Embed Size (px)
Citation preview

City of Ryde Crash Analysis Report 2005-2009 (2010) - 1 -
Crash Analysis Report
City of Ryde
2005 – 2009
Chris Hellmundt
February 2011

City of Ryde Crash Analysis Report 2005-2009 (2010) - 2 -
PART 1
Introduction The City of Ryde is committed to making its roads a safe environment to be. Better understanding of road safety issues and solutions is important in achieving our goal. Each year, these understandings are sought from the Crash Analysis Data, provided to Council by the RTA. This data is analyzed by the Road and Community Safety Projects Officer to identity events and trends. These events and trends are then used to develop community-based local level actions to help make our roads safer. This report and all data is forward to other sections of Council such as our Access and Traffic Team as well as our Enforcement teams.
The Challenge The City of Ryde commenced involvement with the NSW Local Government Road Safety Program in 1999 with the employment of a full-time Road Safety Officer. Since 2004, the Road Safety Officer position has moved from the Access Team to the Community and Culture Team and the position was renamed to Road and Community Safety. The challenge is to address the road safety issues within the City of Ryde, in conjunction with community safety issues, is raising community awareness through enforcement, education and engineering to make the roads a safer place to be.
Objectives of Action Plan Road safety is an issue for all members of the City of Ryde community. The City of Ryde is committed to road safety and the Road Safety Action Plan will help to ensure our objectives are met. These objectives are stated in each road safety project initiative outlined in the Action Plan. They have been decided, based on the crash data evaluation of the City of Ryde and some community consultation. The activities of the Road Safety Action Plan aim to reduce the casualties on City of Ryde roads by educating the community and thereby changing driver and pedestrian behaviour. The actions outlined in the Action Plan reflect both the commitment of the State Government and the City of Ryde Council.
Development, implementation and evaluation The Road Safety Action Plan, based on this crash analysis report, is developed in consultation with the Road and Traffic Authority and the Community Safety Working Group. The Community Safety Working Group overseas and provides advice on the Road Safety Action Plan at key moments throughout the year. The Community Safety Working Group is made of various government and non-government representatives, including Road and Traffic Authority, NSW Police, NSW Health Promotions, Youthsafe, Salvation Army, Putney Progress Association and Fire and Rescue NSW.

City of Ryde Crash Analysis Report 2005-2009 (2010) - 3 -
PART 2 Ryde Demographic Data The City of Ryde has an area of 40.651kms2 and lies in the central northern part of the Sydney Metropolitan area, approximately 12kms from the centre of Sydney.
Figure 1: The location of the City of Ryde The City occupies most of the divide between the Parramatta and Lane Cove rivers, and has 16 suburbs within its boundaries. The suburbs that make up the City of Ryde include Chatswood West, Denistone, Denistone East, Denistone West, East Ryde, Eastwood, Gladesville, Macquarie Park, Marsfield, Meadowbank, Melrose Park, North Ryde, Putney, Ryde, Tennyson Point, and West Ryde. The traditional Aboriginal owners of the land are the Wallumedegal clan of the Dharug tribe. Aboriginal sites in the City are predominantly located around the foreshores of the Parramatta River and Lane Cove River.

City of Ryde Crash Analysis Report 2005-2009 (2010) - 4 -
Figure 2: Structure Plan of the City of Ryde
Underground Rail Link
Rail Link
M2 Motorway
Ferry Wharf
Urban Village
Residential
Industrial
Macquarie Business Park Open Space
Key Facilities and Services Commercial
Schools
Waterways
Local Shopping Precincts

City of Ryde Crash Analysis Report 2005-2009 (2010) - 5 -
The People As at the 2006 Census, the residential population for the City of Ryde was estimated at 96 948. The largest age group in the community is adults aged from 25–54 years who make up 45% of the population. In the City in 2006 there were 46 778 males and 50 170 females. The City’s Aboriginal and Torres Strait Islander population in 2006 was 267 persons.
0% 2% 4% 6% 8% 10%
0-4
5-9
10-14
15-19
20-24
25-29
30-34
35-39
40-44
45-49
50-54
55-59
60-64
65-69
70-74
75-79
80-84
85-89
90-94
95-99
100+
Ryde
Sydney
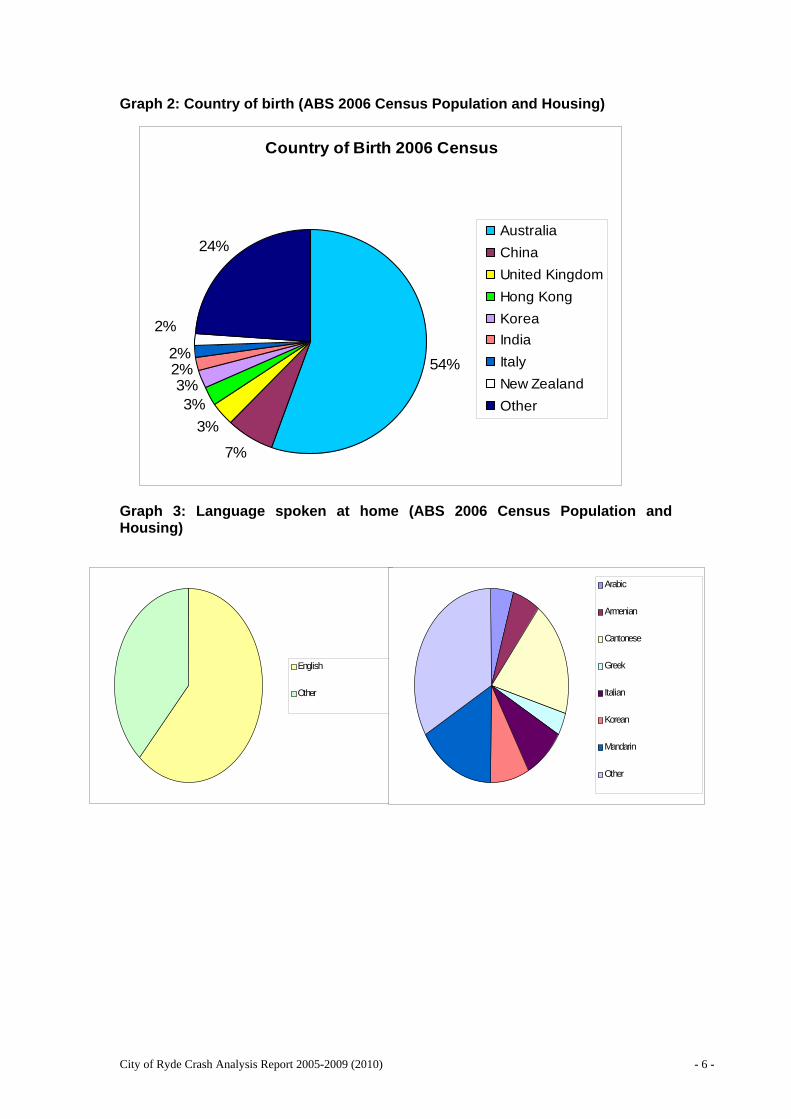
Graph 1: Relative size of age groups (ABS 2006 Census Population and Housing) In 2006, some 62% of the City’s people were born in Australia and 38% born overseas. The most common overseas birthplaces were China, U.K., Hong Kong and Korea. People who spoke a language other than English at home made up 36% of the population. The most common of these languages were Cantonese, Mandarin, Italian, Korean and Armenian.
City of Ryde Crash Analysis Report 2005-2009 (2010) - 6 -
Graph 2: Country of birth (ABS 2006 Census Population and Housing)
Graph 3: Language spoken at home (ABS 2006 Census Population and Housing)
Country of Birth 2006 Census
54%
7%
3%3%
3%2%2%
2%
24%AustraliaChinaUnited KingdomHong KongKoreaIndiaItalyNew ZealandOther
English
Other
Arabic
Armenian
Cantonese
Greek
Italian
Korean
Mandarin
Other

City of Ryde Crash Analysis Report 2005-2009 (2010) - 7 -
The Cars Table A identifies the number of vehicles registered in the City of Ryde. The majority of the vehicles which are registered in the City of Ryde are passenger vehicles (69%) followed by off-road passenger vehicles (10%). There has been an increase in off-road passenger vehicles from 2007 and light trucks continue to grow. There has been a large decrease from 2007 to 2008 in small buses. Table A: Number of vehicles registered in the City of Ryde as at 30 June 2008 and 2009
Pass
enge
r Veh
icle
s
Off-
road
Pas
seng
er
Vehi
cles
Smal
l Bus
es
Bus
es
Mob
ile H
omes
Mot
or-c
ycle
s
Ligh
t Tru
cks
Hea
vy T
ruck
s
Prim
e M
over
s
Ligh
t Pla
nt
Hea
vy P
lant
Smal
l Tra
ilers
Trai
lers
Oth
er V
ehic
les
Size
of V
ehic
le F
leet
2008
54,674 6,139 348 419 37 1,301 6,728 358 15 60 28 3,259 1123 5 74,494
2009
53,719 7,939 195 452 30 1,534 7,496 348 30 61 N/A N/A 4,349 N/A 77,465
Table B: Licence holders in the City of Ryde by licence type as at 30 June 2008 and 2009 Learner P1 P2 Unrestricted Total 2008 4890 2199 3657 60759 71505 2009 4933 1822 3919 61638 72312 Table B shows the number of licence holders in the City Ryde by licence type. There has been a small increase in the number of licence holders and a decrease in P1 drivers.
City of Ryde Crash Analysis Report 2005-2009 (2010) - 8 -
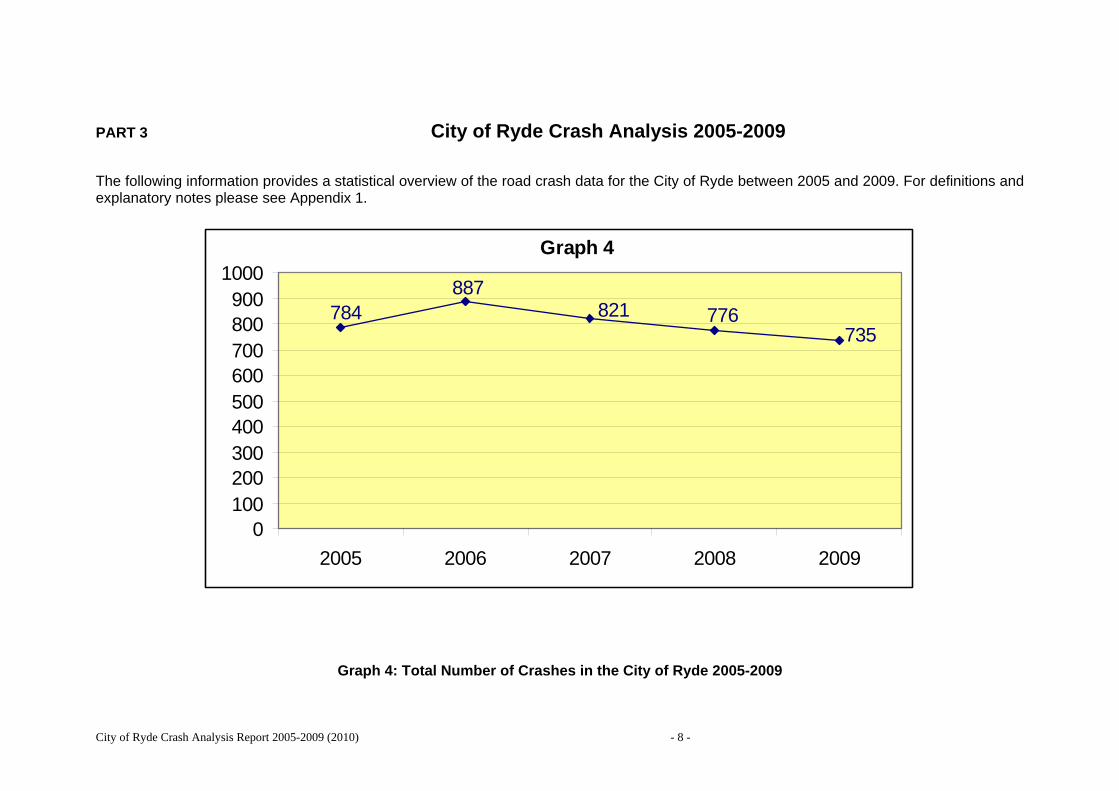
PART 3 City of Ryde Crash Analysis 2005-2009 The following information provides a statistical overview of the road crash data for the City of Ryde between 2005 and 2009. For definitions and explanatory notes please see Appendix 1.
Graph 4
887
735776821784
0100200300400500600700800900
1000
2005 2006 2007 2008 2009
Graph 4: Total Number of Crashes in the City of Ryde 2005-2009

City of Ryde Crash Analysis Report 2005-2009 (2010) - 9 -
1. CRASHES Table 1 (below) and Graph 4 (above) identify the total number of crashes in the City of Ryde by fatal/injury/non-casualty classification between 2005 and 2009. Despite a state-wide increase in the number of crashes in 2009, the City of Ryde has bumped the state trend and has reduced the number of crashes in all categories. The five-year averages reflect this downward tread. This has been achieved, despite a rise in license holders (see Table B). Table 1: City of Ryde number of crashes by fatal/injury/non-casualty classification 2005-2009
2. CASUALTIES Table 2 shows the total number of casualties in the City of Ryde by killed/injured classification between 2005 and 2009. The total number of casualties killed in 2009 has halved from 2008, with just 1 fatality. The number of injured casualties has decreased slightly from 267 in 2007 to 265 (-2 causalities). The total five year average for 2008 (2005-2009) is 291, significantly below the 2008 average (2004-2008) was 356 (-65). In short, 2009 was the best year on record for the City of Ryde. Table 2: City of Ryde number of casualties by killed/injured classification 2005-2009 2005 2006 2007 2008 2009 5 year average Killed 7 2 2 2 1 2.8 Injured 268 312 313 267 265 285 Total 275 314 315 269 266 291
2005 2006 2007 2008 2009 5 year average Fatal Crashes 7 2 2 2 1 2.8 Injury Crashes 268 312 313 267 265 285 Non-Casualty Crashes 509 573 506 507 469 512.8 Total Crashes 784 887 821 776 735 800.6
City of Ryde Crash Analysis Report 2005-2009 (2010) - 10 -
5%
28%
14%
7%6%
26%
7%7%
24%
12%
26%
20%
28%
22%
11%
25%26%
6%
0%
5%
10%
15%
20%
25%
30%
0-16 17-25 26-39 40-59 60 + Unknown
City of RydeSydney RegionNSW
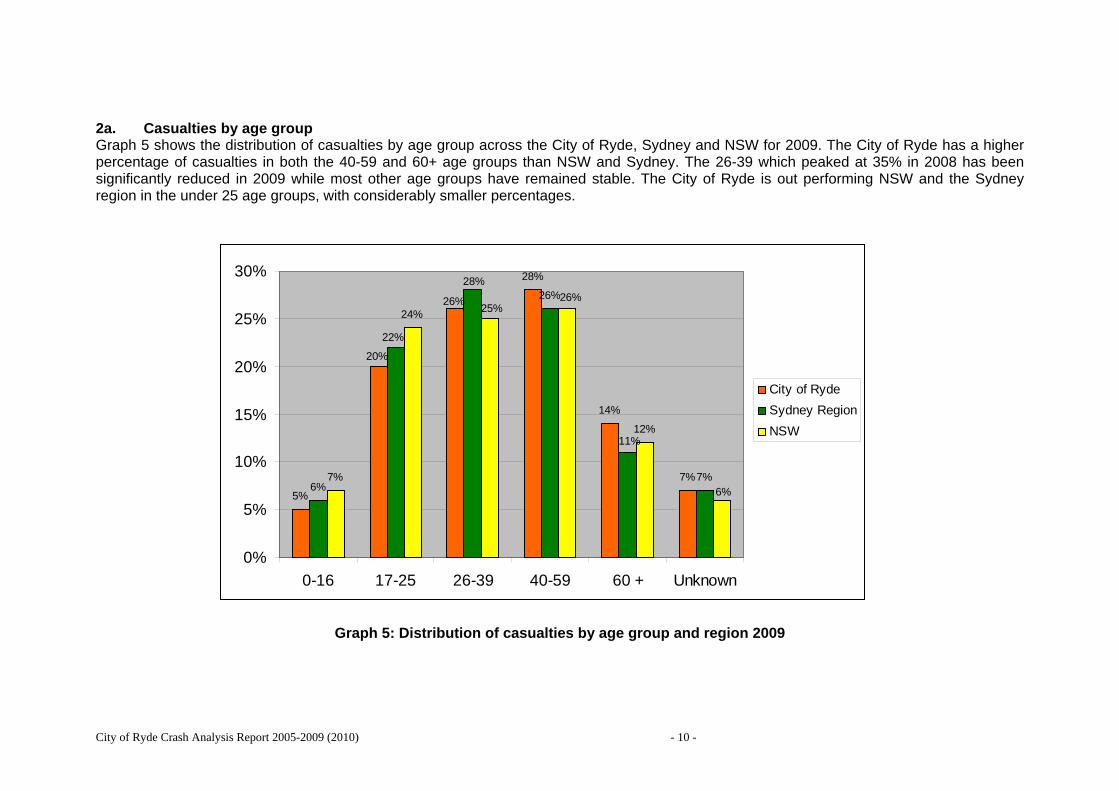
2a. Casualties by age group Graph 5 shows the distribution of casualties by age group across the City of Ryde, Sydney and NSW for 2009. The City of Ryde has a higher percentage of casualties in both the 40-59 and 60+ age groups than NSW and Sydney. The 26-39 which peaked at 35% in 2008 has been significantly reduced in 2009 while most other age groups have remained stable. The City of Ryde is out performing NSW and the Sydney region in the under 25 age groups, with considerably smaller percentages.
Graph 5: Distribution of casualties by age group and region 2009

City of Ryde Crash Analysis Report 2005-2009 (2010) - 11 -
Graph 6 displays the number of casualties in the City of Ryde by age group in 2009. As in 2006 and 2007, the majority of casualties in the City of Ryde occurred in the 40-59 year age group followed by the 26-39 year age group. Casualty rates for 0-16 year olds doubled from 2008. This age group has been in considerable flux for some time and no true trend has emerged. There was a 21% decrease in the 26-39 age group while all other age groups rose slightly.
94
45
19
87
67
16
0 20 40 60 80 100
0-16
17-25
26-39
40-59
60 +
Unknown
Graph 6: Casualties in the City of Ryde by age group 2009
City of Ryde Crash Analysis Report 2005-2009 (2010) - 12 -
164160
2
Male
Female
Unknow n
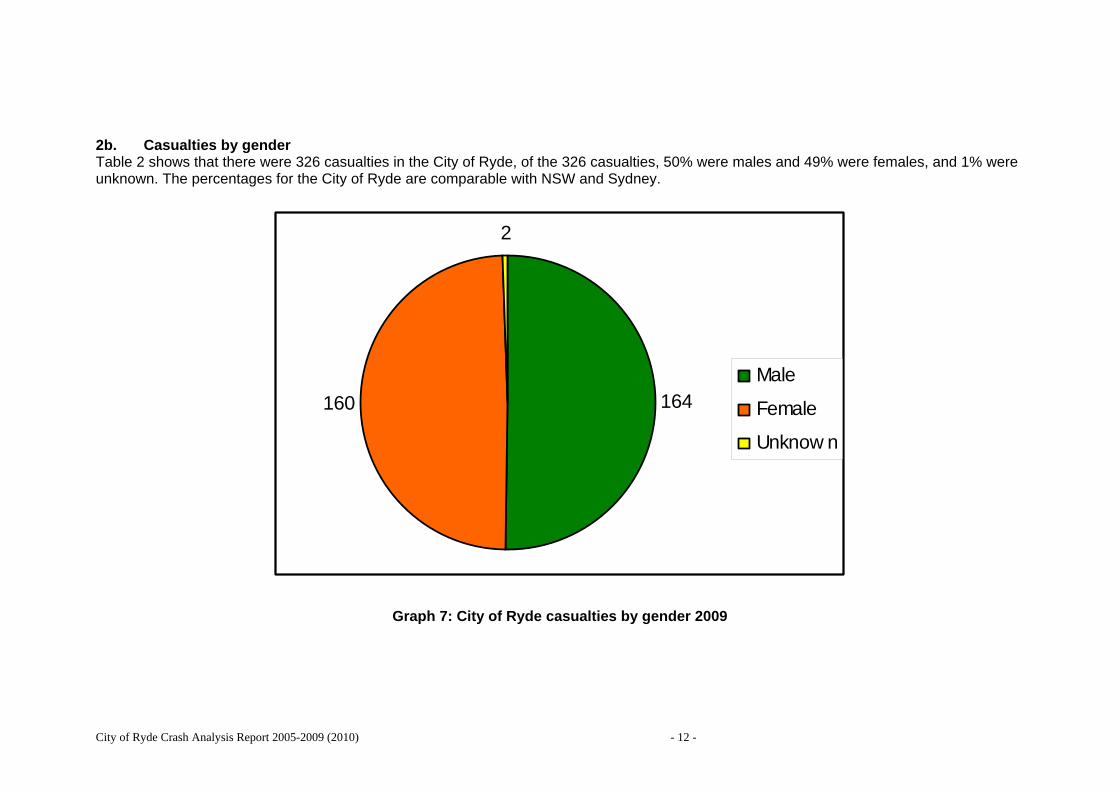
2b. Casualties by gender Table 2 shows that there were 326 casualties in the City of Ryde, of the 326 casualties, 50% were males and 49% were females, and 1% were unknown. The percentages for the City of Ryde are comparable with NSW and Sydney.
Graph 7: City of Ryde casualties by gender 2009

City of Ryde Crash Analysis Report 2005-2009 (2010) - 13 -
51
5
61
13
9
52
24
24
15
12
0 10 20 30 40 50 60 70
A 3am-9am Mon-Fri
B 3am-9am Sat-Sun
C 9am-3pm Mon-Fri
D 9am-3pm Sat
E 9am-3pm Sun
F 3pm-9pm Mon-Wed
G 3pm-9pm Thur-Fri
H 3pm-9pm Sat-Sun
I 9pm-3am Sun(pm)-Thur(am)
J 9pm-3am Thur(pm) - Sun (am)
2c. Casualties by time period Graph 8 describes the number of casualties in the City of Ryde by time periods in 2009. The greatest number of casualties occurred from Monday to Friday between 9am and 3pm which was consistent with past years. The numbers remain fairly stable from 2008.
Graph 8: Number of casualties by time period in the City of Ryde 2009

City of Ryde Crash Analysis Report 2005-2009 (2010) - 14 -
Alcohol Speed Fatigue
City of Ryde
Sydney RegionNSW
4%
16.5%
8.5%
3%
10%
7%
2.5%
10%
6%
0.0%2.0%4.0%6.0%8.0%
10.0%12.0%14.0%16.0%18.0%
3. CONTRIBUTING FACTORS This section discusses crash statistics in relation to contributing factors, including speed, alcohol and fatigue. 3a. Comparisons by region – crashes Graph 9 illustrates the percentage of all crashes in the City of Ryde, Sydney region and NSW according to contributing factors in 2009. NSW has the highest percentage of crashes with speed involvement, with 16.5% involving speed. Speed is also the highest contributing factor for Sydney and City of Ryde with 10% each. Speed as a contributing factor has significantly increased for the City of Ryde from last year, with an increase of 3%. Fatigue related crashes have reduced from the peak last year. Alcohol related crashes have remained stable.
Graph 9: Crash percentage and contributing factors between City of Ryde, Sydney region and NSW in 2009

City of Ryde Crash Analysis Report 2005-2009 (2010) - 15 -
5046
31
43 44 44
1917202017212326
727085
77828480
52
6755
0
10
20
30
40
50
60
70
80
90
2002 2003 2004 2005 2006 2007 2008 2009
AlcoholSpeedFatigue
3b. Comparisons within the City of Ryde 2002-2008 – crashes Graph 10 looks at the number of crashes with contributing factors between 2002 and 2009 in the City of Ryde and shows the difference between the number of speed, fatigue and alcohol crashes. The most noteworthy change in 2009 was speed related crashes rising significantly. Despite this spike, speed has decreased steadily from 2006 as a contributing factor. Fatigue has dropped by 9 crashes and is now on average over the past 10 years. Alcohol related crashes have remained stable since 2004.
Graph 10: Number of all crashes according to contributing factors in the City of Ryde 2002-2009

City of Ryde Crash Analysis Report 2005-2009 (2010) - 16 -
37
881088
12
20
9
4450
26
38
25 2325
141522
3027
11
7
19
0
10
20
30
40
50
60
2002 2003 2004 2005 2006 2007 2008 2009
AlcoholSpeedFaitgue
3c. Comparisons within the City of Ryde 2002-2009 – casualties While speed related crashes have increased, speed related casualties, the number of people killed or injured, has only increased slightly and is on a downward trend from the high of 2003. Fatigue related casualties have decreased slightly to on average. Alcohol related causalities remains constant. Graph 10 and 11 demonstrates that the severity of crashes is being reduced, even when speed is the contributing factor.
Graph 11: Number of casualties according to contributing factors in the City of Ryde 2002-2009

City of Ryde Crash Analysis Report 2005-2009 (2010) - 17 -
3d. Comparisons in the City of Ryde by time period and contributing factor Graph 12 shows the fatal or injury crashes by contributing factor and time period in the City of Ryde in 2009. The time periods are specified in the table according to McLean Time Periods. Speed casualties rise in the morning of Saturday and Sunday and afternoon/evening of Monday – Wednesday.
0
0.5
1
1.5
2
2.5
3
3.5
4
4.5
A 3am-9amMon-Fri
B 3am-9amSat-Sun
C 9am-3pmMon-Fri
D 9am-3pmSat
E 9am-3pmSun
F 3pm-9pmMon-Wed
G 3pm-9pmThur-Fri
H 3pm-9pmSat-Sun
I 9pm-3amSun(pm)-Thur(am)
J 9pm-3amThur(pm) -Sun (am)
AlcoholSpeedFaitgue
Graph 12: Fatal or injury crashes by contributing factor and time period for the City of Ryde 2009

City of Ryde Crash Analysis Report 2005-2009 (2010) - 18 -
0
7
3
9
00
35
18
96
0
12 1214
00
5
10
15
20
25
30
35
40
0-16 years 17-25 years 26-39 years 40-59 years 60+ years
AlcoholSpeedFatigue
3e. Comparisons in the City of Ryde by age and contributing factor Graph 13 shows the number of motor vehicle controllers involved in crashes in the City of Ryde according to contributing factors and age group for 2009. The number of speed related crashes for the 17-25 age group has spiked after years of continued decline and this spike is of concern. Fatigue declined only in the 17-25 and 60+ age groups, remaining steady elsewhere. The significant decline for speed as a contributing factor for 40-59 years age group since 2007 stabilized in 2008 with all gains maintained. The 60+ age group performed best in all categories, with the exception in a rise in speed related crashes.
Graph 13: Number of motor vehicle controllers involved in crashes by contributing factor and age group in the City of Ryde in 2009

City of Ryde Crash Analysis Report 2005-2009 (2010) - 19 -
3f. Crashes involving speed In 2009, there were 72 crashes involving a speeding controller, including one fatal and 24 injury crashes. The number of crashes has risen significantly from 54 crashes in 2008, however the number of injury crashes has remained stable. While it is good news that injury crashes have not increased to the same proportion of crashes generally, the dramatic rise in crashes and the fatality, stop the downward trend from 2006 and this is concerning. As in previous years, the majority of casualty crashes involving speed occurred during the week, Monday to Friday between 9am and 3pm (see Graph 12). The 17-25 year age group had the highest number of speeding crashes by motor vehicle controller, rising significantly after years of decline. This age group accounts for half of all speed related crashes and this is a major concern. There does not appear to be any reason for this sharp increase in this age group and this is concerning. There was also a small rise in the number of persons aged 60+ age group. 3g. Crashes involving alcohol The number of alcohol related crashes has remained stable since 2005. Alcohol contributed to approximately 2.5% of the total number of crashes in the City of Ryde. The time period peak for alcohol-related crashes was between the hours of 3pm and 9pm on Saturday and Sunday (see Graph 12). There may be more drink driving incidences in the late evenings on weekends because of licensed premises being opened until late and an increased number of patrons at these premises. The 17-25 year age group has remained stable in this area since 2008, while the 40-59 age group has risen by more then half, making them the biggest offenders for alcohol related crashes. The 26-39 year age group has also increased the number of alcohol related crashes. 3h. Crashes involving fatigue After a significant number of fatigue related crashes in 2008, and an expected continuation of the upward trend since 2004, fatigue as a contributing factor was significantly reduced in 2009. There were 44 crashes (down 11 from 2008) resulting in 14 casualties (down 1 from 2008) in the City of Ryde, none of which were fatalities. 2009 has been the best year for fatigue related crashes and casualties since 2006. The majority of fatigue related injury crashes in 2009 occurred in the afternoon/evening between 3pm and 9pm mid week (see Graph 12) and in the early hours of the morning, which is consistent with what we know about when fatigue related crashes are more likely to occur. The 17-25 year old age group significantly reduced the number of fatigue related crashes, down 9 crashes which is almost half. Fatigue crashes were lower or stable in the other age groups, with significant reductions in the 60+ age group down 5 crashes (see Graph 13).
City of Ryde Crash Analysis Report 2005-2009 (2010) - 20 -
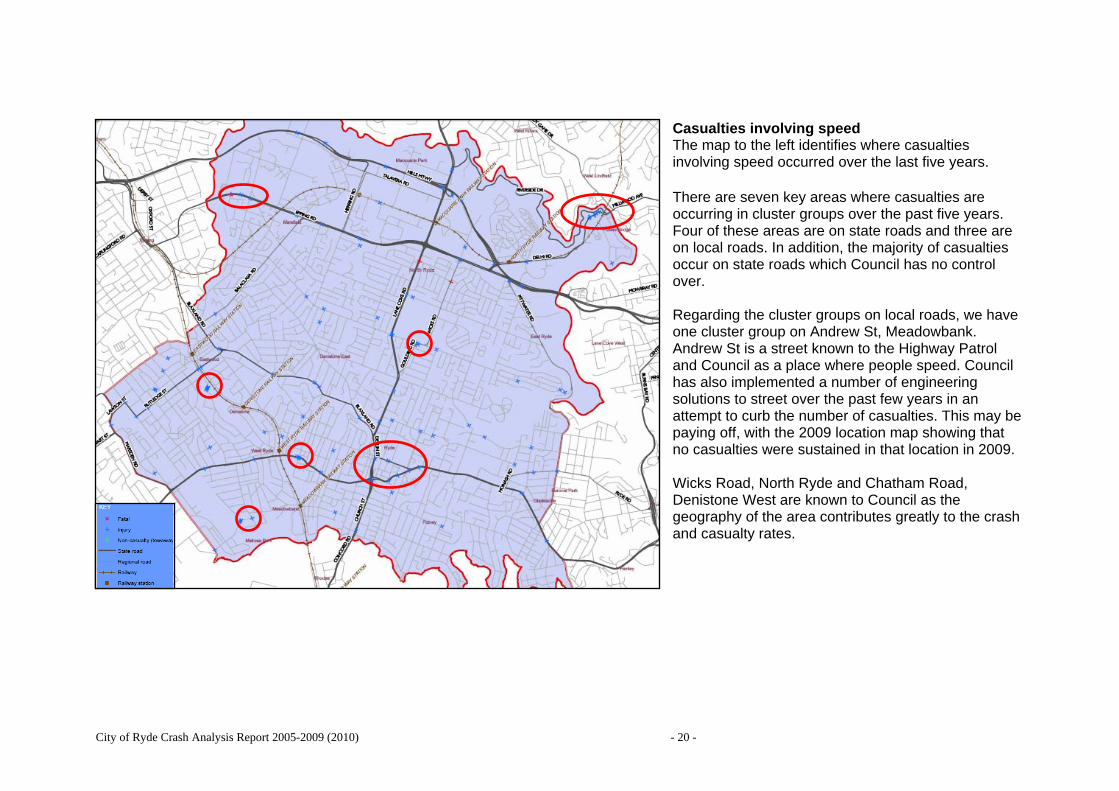
Casualties involving speed The map to the left identifies where casualties involving speed occurred over the last five years. There are seven key areas where casualties are occurring in cluster groups over the past five years. Four of these areas are on state roads and three are on local roads. In addition, the majority of casualties occur on state roads which Council has no control over. Regarding the cluster groups on local roads, we have one cluster group on Andrew St, Meadowbank. Andrew St is a street known to the Highway Patrol and Council as a place where people speed. Council has also implemented a number of engineering solutions to street over the past few years in an attempt to curb the number of casualties. This may be paying off, with the 2009 location map showing that no casualties were sustained in that location in 2009. Wicks Road, North Ryde and Chatham Road, Denistone West are known to Council as the geography of the area contributes greatly to the crash and casualty rates.

City of Ryde Crash Analysis Report 2005-2009 (2010) - 21 -
Casualties involving fatigue The map to the left identifies the driver fatigue related crashes in the City of Ryde between 2005 and 2009. Fatigue related crash locations in the City of Ryde are fairly evenly distributed throughout the City and therefore there is no particular pattern. However Ryde has more casualties then other suburbs. Unlike speed, most fatigue related crashes occurred on local streets. This may indicate that fatigue related crashes occur when drivers are close to home and their concentration is wavering. Not surprisingly, all main roads in the City have considerably more crashes than other streets, including Victoria Road, Blaxland Road, Lane Cove Road and Epping Road. It must be noted that there may be subjectivities in police recordings of what constitutes a fatigue related crash and therefore figures may not be a true and accurate recording of this factor.

City of Ryde Crash Analysis Report 2005-2009 (2010) - 22 -
4. ROAD USER TYPE This section examines crash statistics and road user type. Table 3 summarises the percentage of casualties by road user class, as a total of all casualties, between 2005 – 2009, for NSW, Sydney region and the City of Ryde. The following is representative of the five year average and 2009 data (five year average data is shown). • The City of Ryde has a growing higher percentage of motor vehicle driver casualties (59%) compared to Sydney region (55.9%) and NSW
(55.7%) for the 5 year average. While NSW and Sydney region remained stable in 2009, the City of Ryde rose 6%. However the long term average has dropped 7%.
• There has been a 3% increase in the percentage of motor vehicle passenger casualties for 2008 (16%) in the City of Ryde, which cancelled out the decrease of 3% last year. Both the 2009 percentage and the 5 year average for the City of Ryde (17.3% and 16% respectively) are still well below the 2009 percentages and 5 year averages for the Sydney regions (19.7% and 18% respectively) and NSW (21.6% and 20% respectively). With that said, both NSW and the Sydney Region are marginally lower which the City of Ryde is increasing.
• Motorcyclist casualties have remained stable. And pedal cyclist casualties are trending down. • Pedestrian casualties for the City of Ryde 5 year average (10.7%) is still on par with the Sydney region (10.8%). This is higher than NSW
(8.5%). However, there was a 5% increase in pedestrian casualties in 2009 and this is concerning. • Following by the percentage of motor vehicle driver and motor vehicle passenger casualties (59% and 16%), pedestrians are the third
highest casualty group in the City of Ryde, at 13%. Table 3: Percentage of casualties by road user class 2005-2009 average, and 2009
NSW Sydney Region City of Ryde
5 year average 2009 5 year average 2009 5 year average 2009 Motor Vehicle Driver 55.7% 56% 55.9% 55% 58.9% 59% Motor Vehicle Passenger 21.6% 20% 19.7% 18% 17.3% 16% Motorcyclist 9.5% 11% 8.8% 10% 9.4% 11% Pedal Cyclist 4.6% 5% 4.7% 5% 3.7% 2% Pedestrian 8.5% 9% 10.8% 11% 10.7% 13%

City of Ryde Crash Analysis Report 2005-2009 (2010) - 23 -
192
54
35
5
42
0 50 100 150 200 250
Motor vehicle driver
Motor vehiclepassenger
Motorcyclist (inc.pass.)
Pedal cyclist (inc.pass)
Pedestrian
Table 4 examines the total number of casualties by road user class from 2005 to 2009. 2009 saw mixed results. There were small increases in passengers and motorcyclists casualties and a large increase in pedestrians, which has put strain on the 5 year downward trend. There were reductions in drivers and pedal cyclists casualties. Despite the mixed results, the City of Ryde has also moved below the five year average drivers, passengers and cyclists, but with the increase on 2008 levels in 2009, there was a rise above for pedestrians and motorcyclists. Table 4: Number of casualties by road user class 2005-2009 City of Ryde 2005 2006 2007 2008 2009 5 Yr. Average Motor Vehicle Drivers 198 219 222 198 192 208 Motor Vehicle Passengers 61 77 61 50 54 61 Motorcyclists 28 31 39 31 35 33 Pedal Cyclists 13 17 16 13 5 13 Pedestrians 41 38 36 30 42 37
Graph 14: Casualties in the City of Ryde by road user group 2009

City of Ryde Crash Analysis Report 2005-2009 (2010) - 24 -
0
37
56
66
31
8
12
9
5
7
0
10
9
13
3
1
0
1
1
0
7
8
11
8
4
0 10 20 30 40 50 60 70 80 90 100
0-16
17-25
26-39
40-59
60 +
Motor vehicle driverMotor vehicle passengerMotorcyclistPedal cyclistPedestrian
Table 5: City of Ryde casualties by age, gender and road user class in 2009
0-16 17-25 26-39 40-59 60+
M F M F M F M F M F Unknown Total Motor Vehicle Drivers
0 0 17 20 26 30 25 41 16 15 2 192
Motor Vehicle Passengers
5 3 6 6 3 6 1 5 1 6 12 54
Motorcyclists 0 0 10 0 9 0 12 1 3 0 0 35
Pedal Cyclists 1 0 0 0 1 0 1 0 0 0 1 4
Pedestrians 5 2 4 4 4 7 4 4 2 2 4 42
Graph 15: Casualties by road user class and age in the City of Ryde in 2009

City of Ryde Crash Analysis Report 2005-2009 (2010) - 25 -
686
104
26
17
29
41
5
42
0 100 200 300 400 500 600 700 800
Car crash
Light truck crash
Heavy truck crash
Heavy rigid truck crash
Bus/emergency
Motorcycle crash
Pedal cycle crash
Pedestrian crash
The following section addresses casualties and crashes in the City of Ryde according to age and road user class. The following has been identified from the RTA data, and graphs and tables above. 4ai. Motor Vehicle Drivers Graph 14 shows the total number of casualties for each road user type in the City of Ryde in 2009. Motor vehicle driver casualties account for 58.5% (192 from 328) of all casualties in the City of Ryde for 2009. This is a small decrease from 61.5% in 2006 and 59% in 2007. Graph 15 shows the City of Ryde casualties by age and road user class whilst Table 5 breaks this down further to include gender (note the shaded sections of the table highlights the gender discrepancies within each road user class). Female drivers were involved in more crashes than male drivers, particularly in the 40-49 year old age group. This challenges the notion that male drivers are more likely to be involved in a crash. Graph 16 displays the total number of crashes in the City of Ryde by crash type for 2009. It should be noted that the displayed accident types are not mutually exclusive and therefore should not be added together. For example an accident involving a car and a motorcycle would be included in the “car” and “motorcycle” crash type categories. From a total of 735 crashes (down 41 crashes from 2008), 686 crashes involved cars, with almost 93% of all crashes involving at least one car. This is followed by light trucks (104) and pedestrians (42). The increase in pedestrian crashes is very concerning, as they are one of the most vulnerable groups on the road.
Graph 16: Crash types in the City of Ryde in 2009 4aii. Motor Vehicle Passengers

City of Ryde Crash Analysis Report 2005-2009 (2010) - 26 -
2009 had four more casualties then 2008 which had the lowest number of motor vehicle passenger casualties (50) since 2004. The stability of passenger casualties is a great sign, following from the high of 77 in 2006. The 17-25 year age group have the highest number of casualties (12 casualties), followed closely by the 26-39 age group with 9 casualties. This year in all age groups, female motor vehicle passengers have more or equal casualties than male motor vehicle passengers (Table 5). 4aiii. Occupant Restraints It is important to examine occupant restraints as it relates to motor vehicle drivers and passengers. Table 6 shows the percentage of casualties who had restraints fitted in the vehicle but did not wear them in NSW, Sydney region and in the City of Ryde in 2009. There was two casualties who had restraints fitted in the vehicle and did not wear them. This is up by one in each category from last year. In addition, only one child aged 0-12 years was injured with a child restraint fitted, but not worn. Table 6: Use of Restraints in the City of Ryde in 2009 NSW Sydney Region Ryde All Motor Vehicle Driver Casualties Restraint fitted but not worn (as a percentage of the total number of driver casualties)
259 1.9% 111 1.45% 1 0.5%
NSW Sydney Region Ryde All Motor Vehicle Passenger Casualties Restraint fitted but not worn (as a percentage of the total number of passenger casualties)
126 2.5% 48 1.9% 1 2%
City of Ryde Crash Analysis Report 2005-2009 (2010) - 27 -
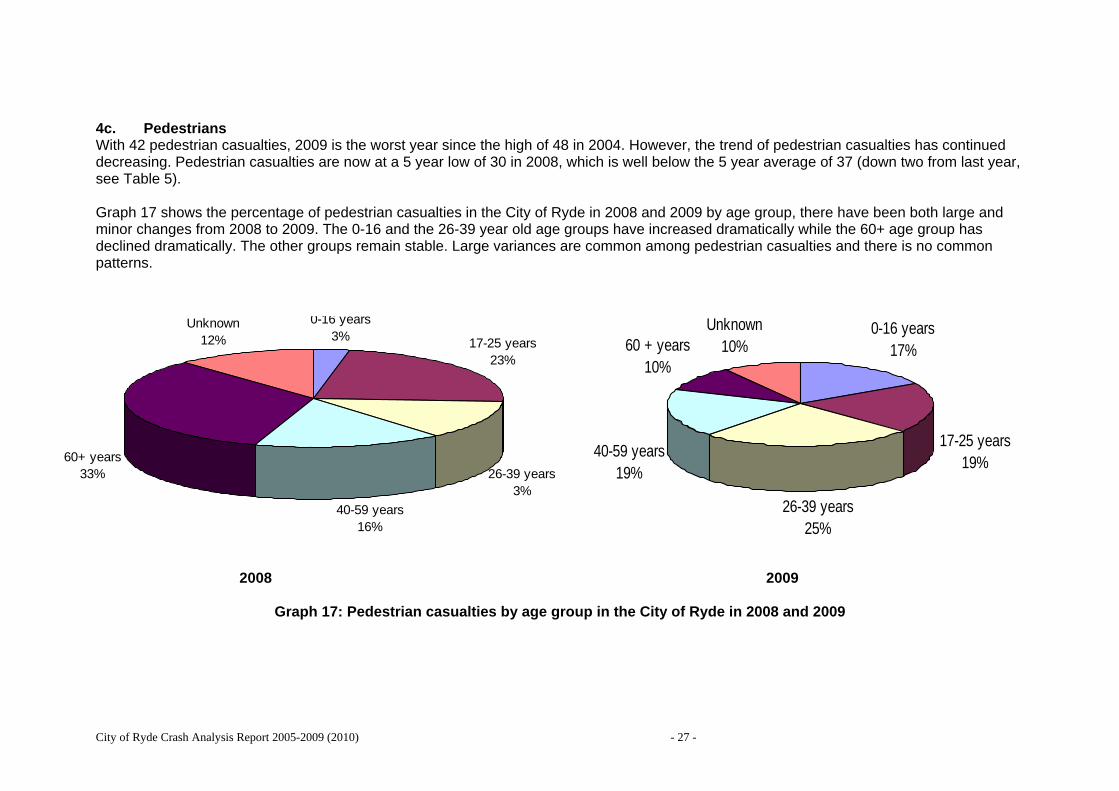
60+ years33%
Unknown12%
0-16 years3% 17-25 years
23%
26-39 years3%
40-59 years16%
0-16 years17%
17-25 years19%
26-39 years25%
40-59 years19%
60 + years10%
Unknown10%
4c. Pedestrians With 42 pedestrian casualties, 2009 is the worst year since the high of 48 in 2004. However, the trend of pedestrian casualties has continued decreasing. Pedestrian casualties are now at a 5 year low of 30 in 2008, which is well below the 5 year average of 37 (down two from last year, see Table 5). Graph 17 shows the percentage of pedestrian casualties in the City of Ryde in 2008 and 2009 by age group, there have been both large and minor changes from 2008 to 2009. The 0-16 and the 26-39 year old age groups have increased dramatically while the 60+ age group has declined dramatically. The other groups remain stable. Large variances are common among pedestrian casualties and there is no common patterns.
2008 2009
Graph 17: Pedestrian casualties by age group in the City of Ryde in 2008 and 2009

City of Ryde Crash Analysis Report 2005-2009 (2010) - 28 -
Casualties involving pedestrian The number of pedestrian casualties increased substantially this year. The increases were in the traditional areas for pedestrian crashes, high pedestrian zones around transport hubs and shopping centers. The map to the left displays each pedestrian casualty in the City of Ryde between 2005 and 2009. Like last year, there are clusters of pedestrian causalities in Ryde, at Devlin St, particularly both of the intersections of Blaxland Road. There are also clusters in West Ryde and Eastwood (which recorded one fatality) and around Macquaire Park, (which recorded four fatalities). The intersection on Devlin St and Blaxland Road has two pedestrian bridges where all pedestrians are directed and there is no pedestrian access at the intersection. The 2009 map (insert) demonstrates that the bridge has reduced the casualty rates for the intersection of Devlin St and Blaxland Road, with 2009 recording zero casualties compared to four and one fatality over the past five years. There continues to be issues in the surrounding area, however they are less severe in comparison to previous years. Last year, the City of Ryde with the RTA conducted a pedestrian safety campaign in Eastwood. Eastwood only suffered one casualty in 2009, down significantly from the suburbs five year total of 18, including one fatality in 2004-2008. This is a significant improvement. In addition, this year shows a concentration of casualties on the main roads of Macquarie Park. This area has a high number of pedestrians with business and education centers close by.

City of Ryde Crash Analysis Report 2005-2009 (2010) - 29 -
4b. Motorcyclists Motorcyclists accounted for 11% of all casualties in 2009, steady on previous figures. As in previous years, the 26-39 year age group and now the 21-25 year age group dominate in the highest number of motorcyclists casualties, with 9 and 10 casualties respectively. Males make up the majority of motorcyclist casualties in 2009, 1 out of the 35 motorcyclist casualties were females. Of the 35 motorcycle casualties in the City of Ryde, there were no known motorcyclists who were not wearing a helmet. 4c. Pedal Cyclists Pedal cyclist casualties have decreased again to 4 from 16 in 2007 in City of Ryde and 13 in 2008, with no pedal cycle fatalities. Pedal Cyclists make up 2% of the total percentage of casualties by road user class. From the 4 casualties there were no female causalities, maintaining the downward trend after a large decrease in 2006 data where five female pedal cyclist casualties. City of Ryde pedal cyclist casualties are lower in the total percentage of casualties than the Sydney region (5%) and NSW (5%). One pedal cyclist casualty was known to have not worn a helmet.

City of Ryde Crash Analysis Report 2005-2009 (2010) - 30 -
5. SUMMARY In summary, there are issues which have been identified and now must be addressed in the City of Ryde for 2009. The issues identified will in turn aid in developing road safety initiatives for the City of Ryde over the 2010-2011 period. • While there was a 16% increase in fatal crashes across NSW, the City of Ryde had its best year ever in 2009, with a reduction in all types
of crashes, including fatal crashes. • The City had only one fatal crash, down from the five year high of seven fatal crashes in 2005. • Speed as a contributing factor stopped its rapid downward trend and rose sharply by 20 crashes to 72 crashes. However, casualties of
speed related crashes remain the stable over the past three years which is an encouraging sign. • With 42 pedestrian casualties, 2009 is the worst year since the high of 48 in 2004. The change occurred mainly in 0-16 year and 26-39 year
age groups. • The total number of crashes (735) is the best ever and is well below the 5-year average (800). • While injury crashes have remained relatively stable decreasing by only two crashes to 265 crashes, non-casualty crashes have decreased
by 38 crashes. • The 17-25 age group had the highest number of any age group for motor vehicle controllers involved in speed related crashes and the
second highest for fatigue and alcohol related crashes. The 17-25 year age group accounts for half of all speed related crashes • There was not a compelling trend as to when the majority of crashes occur. • Alcohol related crashes have made no substantial change.

City of Ryde Crash Analysis Report 2005-2009 (2010) - 31 -
7. SOURCES • Sydney Profile (Census 2006) • RTA Crash Data • Maps provided by the RTA

City of Ryde Crash Analysis Report 2005-2009 (2010) - 32 -
Appendix 1

City of Ryde Crash Analysis Report 2005-2009 (2010) - 33 -
Roads and Traffic Authority (2004) Road Traffic Crashes in NSW – 2003 Statistical Statement


![[type] ryde. Issue #1](https://img.pdfslide.net/doc/110x75/568cc68a1a28ab8c668b5494/type-ryde-issue-1.jpg)