Embed Size (px)
Citation preview
Crash Severity Evaluation for Unsignalized Intersection Using Conflict Data
Rui Li, Wenquan Li* School of Transportation, Southeast University, Si Pai Lou 2#
Nanjing, 210096, China
Linheng Li, Changjiang Zheng Wentian College, Hohai University, Huo Li Shan Avenue 333#
Maanshan, 243031, China
Bin Ran, Yang Cheng Department of Civil and Environmental Engineering, University of Wisconsin - Madison, 1415 Engineering Drive
Madison, WI 53706, U.S.
Abstract
This paper evaluates crash severity of unsignalized intersection using Conflict Index. Crash and Conflict Severity Model is developed to show the relationship between Crash Index and Conflict Index. The validity and reliability of this model are proved by comparing the Model Ranking and Wisconsin Statewide Ranking of unsignalized intersections’ safety. The results indicate that the Model Ranking and Statewide Ranking match well. Based on intersections’ conflict data in Wisconsin, this paper offers unsignalized intersections’ crash severity classification using probabilistic computing. Visual software is developed for calculating unsignalized intersections’ crash severity intelligently based on this model. Overall, CCS Model can serve for intersection crash severity evaluation in real time system and be a theoretical basis for decision support system of unsignalized intersections crash prevention.
Keywords: unsignalized intersection, crash severity evaluation, probabilistic computing, decision support system, real time system.
* corresponding author: [email protected]
1. Introduction
Intersection safety is a crucial component of highway safety; intersection crashes compose of nearly 40% of all reported crashes in 20081. For signalized intersections, signals can usually operate vehicles go through intersections safety and efficient, however, for unsignalized intersections, traffic control signs could not operate vehicles orderly than signals, more attention should be paid to unsignalized intersections for safety. Besides that, the number of unsignalized intersections is more times than signalized intersections, it is necessary to do more researches about the safety prediction and evaluation for unsignalized intersections. Traditional methods for predicting and evaluating the
safety of intersection focus on calculating and comparing Safety Performance Function (SPF)2-7, which associates crash frequency (based on reported crash data) with geometrics, speed, weather or spatial and land use factors8-10. These methods based on crash data can express intersection safety directly; therefore have been used widely for the last 30 years. During this period, most improvements are about the tools for developing predictive models, such as the application of random-effect models6, the Generalized Estimating Equations (GEE)11, and Markov Chain Monte Carlo (MCMC)6,12 methods for modeling crash data. Traditional methods fit several situations well, but in some cases, the lack of good and reliable crash data collected have hampered proper analyses of these crash data based
International Journal of Computational Intelligence Systems, Vol. 4, No. 6 (December, 2011), 1325-1333
Rui Li et al.
methods. As a safety characteristic shows the potential trend of intersection crash, Traffic Conflict Technique (TCT) was introduced to evaluate intersection safety recently. Comparing with crash data, conflict data can be observed or simulated simply and frequently; conflict data based intersection safety prediction methods have been a surrogate method of the crash data based ones. In the late 1960s, observing conflicts between vehicles was studied at General Motors (GM) Research Laboratories14, and some advances research15-16 was proposed later. Svensson made a convincing argument that crashes are the most extreme form of observed serious conflicts17. Saunier and Sayed presented a framework for automated analysis of interactions between road users18. Gettman et al. constructed Normal Linear and Nonlinear Regression Model for crashes as a function of conflicts which can prove a significant quantitative relationship with the calculated number of conflicts19. Such methods mainly use the number of conflict to evaluate intersections crash severity, some other conflict parameters can also be used to indicate unsignalized intersection crash severity. This paper uses conflict data to systematically predict the safety of unsignalized intersections. Firstly, Crash Index (CrI) and Conflict Severity Index (CfI) are defined and calculated based on Wisconsin unsignalized intersections’
crash and conflict data. Secondly, the relationship between Crash Index and Conflict Index is constructed based on statistic model. At last, the model proposed is evaluated by comparing the Crash and Conflict Severity Model (CCS Model) Ranking and Wisconsin Statewide Ranking of unsignalized intersection safety. Because conflicts occur more frequency than crash, using conflict data can evaluates real time crash severity of intersection, therefore, CCS Model can be helpful to intersection crash severity evaluation in real time system. Besides that, CCS Model can also be a theoretical basis for decision support system of unsignalized intersections crash prevention.
2. Methodology
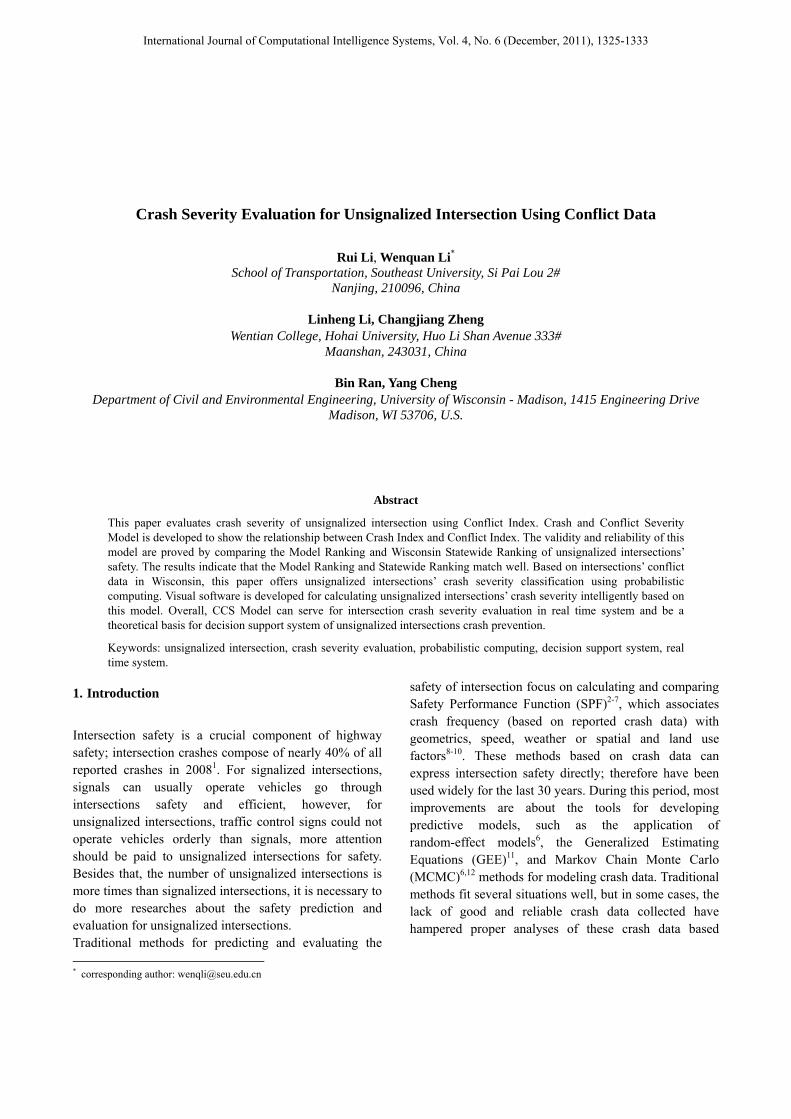
Fig.1. is the methodology flow chart of this paper. In this chart, it can be found that unsignalized intersections’ crash and conflict data of Wisconsin State, U.S. are used in model calibration and evaluation, these data are divided into two part random, one part are used for model calibration and the other part are used for model evaluation.
2.1. Model Construction
2.1.1. Model Overview Introduction
Fig.1. Methodology Flow Chart
Published by Atlantis Press Copyright: the authors 1326
Crash Severity Evaluation
For getting the severity of intersection safety more realistic and credible, this paper uses crash and conflict severity model (CCS Model) to evaluate unsignalized intersection crash severity using conflict data. CCS Model is the relationship between Crash Index and Conflict Index (see Eq.(1)). Crash index and Conflict Index will be different for unsignalized intersection with different type, number and severity weight of crash and conflict, therefore, Crash Index and Conflict Index can be calculated based on Eq.(2) and Eq.(3). m1, m2 are the number of crash and conflict type; n1, n2 are the number of type i crash and conflict; CrTij, CfTij are the serial j of type i crash and conflict; CrWi, CfWi are the weight of type i crash and conflict.
)( ICfIC fr = (1)
∑∑= =
∗=1 1
0 0)(
m
i
n
jirijrr WCTCIC (2)
∑∑= =
∗=2 2
0 0)(
m
i
n
jifijff WCTCIC (3)
2.1.2. Category of Crash and Conflict
Crashes are categorized mainly based on their damage, they are classified into no injuries crash (PDO, N for short), possible injuries crash (C for short), non-incapacitating injuries crash (B for short), incapacitating injuries crash (A for short) and fatal crash (K for short). Taking this category of unsignalized intersection crash into account, Eq.(4) can be obtained to calculate Crash Index from Eq.(2).
KCBANr WKWCWBWAWNIC ∗+∗+∗+∗+∗= (4)
WN, WA, WB, WC and WK, are the weights of N, A, B, C and K. Traditional conflicts classification based on TTC. TTC is the time to a collision with a vehicle that is in front (on road sections) or conflicting (in intersections) if neither vehicle changes its course or speed20. Lu et al., in their study of TTC in intersections, distinguished three accident risk classes based on three critical TTC values, if these are translated into the minimum TTC value of conflicts, three different conflict levels result21. But TTC can not be acquired easily and exactly for large amount of traffic crash and conflict data, this paper uses conflict angle to classify traffic conflict instead of the TTC.
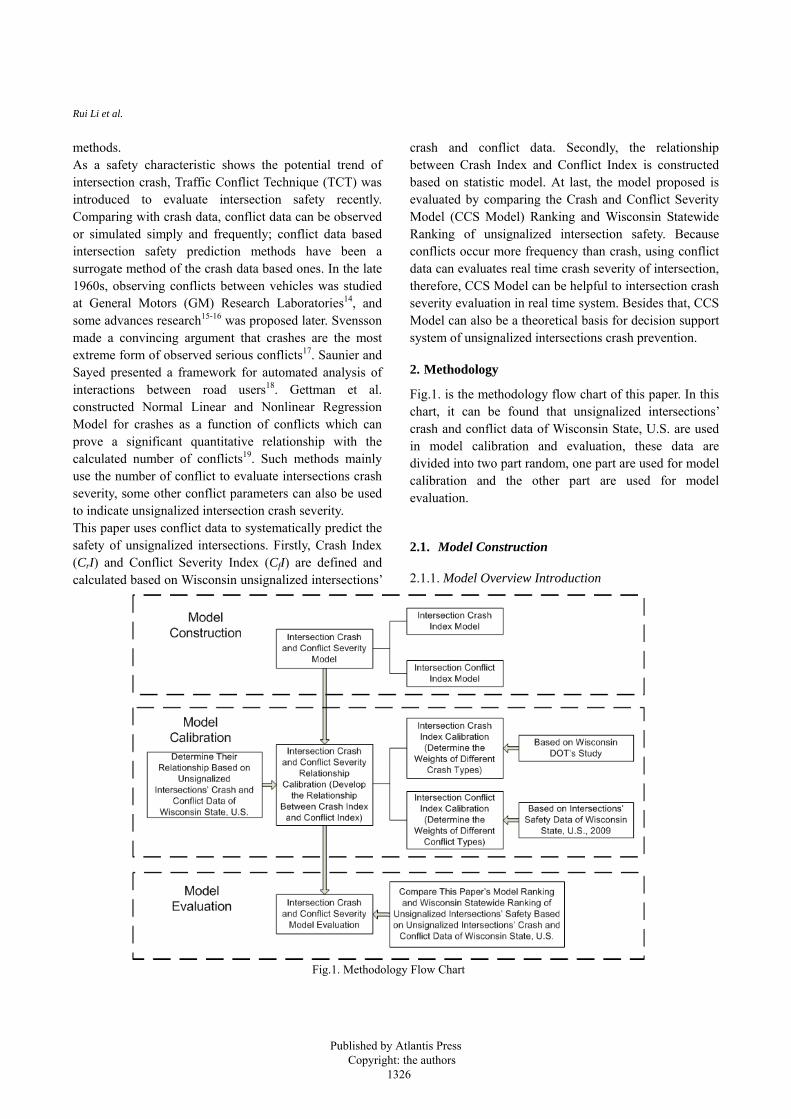
Conflict angle is calculated for each pair of conflicting vehicles, based on the angle at which these vehicles converge to a hypothetical collision point. Conflict is divided into three main types in this paper including Frontal Conflict (F for short), Lateral Conflict and Rear-End Conflict (R for short), in which Lateral Conflict can be divided into three subtypes consist of Small-angle Lateral Conflict (L1 for short), Vertical Lateral Conflict (L2 for short) and Wide-angle Lateral Conflict (L3 for short) (Table 1.). The threshold angles (30 °, 80 °, 100 ° and 150 °) are determined by limited experimentation, though there are cases where classification is difficult. Fig.2. shows the conflict types classified by conflict angle: conflict between vehicle A and vehicle F is Small-angle Lateral Conflict, conflict between vehicle B and vehicle D is Wide-angle Lateral Conflict, conflict between vehicle D and vehicle E is Vertical Lateral Conflict and conflict between vehicle B and vehicle C is Rear End Conflict. Frontal Conflicts seldom break down around intersections.
Table 1. Conflict Classified by Conflict Angle
Conflict type Conflict Angle Range Frontal Conflict 150 ° ≤Conflict Angle≤180 °
Small-angle Lateral Conflict 30 ° ≤Conflict Angle<80 °
Vertical Lateral Conflict 80 ° ≤Conflict Angle<100 °Lateral
ConflictWide-angle
Lateral Conflict 100 ° ≤Conflict Angle<150 °
Rear End Conflict 0 ° ≤Conflict Angle<30 °
Taking this category of unsignalized intersection conflict into account, Eq.(5) can be obtained to calculate Conflict Index from Eq.(3).
Fig.2. Conflict Types in Unsignalized Intersection
Published by Atlantis Press Copyright: the authors 1327
Rui Li et al.
RLLLFf WRWLWLWLWFIC ∗+∗+∗+∗+∗= 332211
(5)
WF, WL1, WL2, WL3 and WR, are the weights of F, L1, L2, L3
and R.
2.2. Model Calibration
2.2.1. Crash Severity Index Calibration
Based on Eq.(4), Crash Index is determined by number of crash and their weights. The number of each type of crash can be acquire from WisTransPortal Database of TOPS Lab, and the weights for each type of crash have already been proposed by several researchers22-23 (Table 2.), the weights of different damage are calculated based on equivalent property damage only (EPDO).
Table 2. Used-in-practice Crash Severity Ranking Methods with Applied Weights
Ranking Method N A B C K North Dakota DOT 1 3 3 3 12
Illinois DOT 1 2 5 9 10Xiao et al. about Wisconsin 1 2 5 9 40
Because the crash data occurred in Wisconsin, this paper uses the weights proposed by Xiao et al (Eq.(6)) to calculate Crash Index.
KCBANICr ∗+∗+∗+∗+= 40259 (6)
2.2.2. Conflict Severity Index Calibration
This paper uses Surrogate Safety Assessment Model ( SSAM ) 24 software to simulate unsignalized intersections (these intersections contain Type-422 (4-legged intersection, Major and minor line have two lanes), Type-442, Type-322 and Type-342, unsignalized intersection, because these four kinds of intersection are the widely used unsignalized intersection) in Wisconsin State, U.S. Before simulation, some assumptions are proposed:
For major and minor arm of unsignalized intersection, distributing the AADT equally to up and down of arms;
Transferring AADT to peak hour volume (SSAM simulation needs peak hour volume of every directions) by Multiplying AADT by a parameter, choosing 0.1 as the parameter by experience;
For 4-armed intersections, major line traffic flow were distributed to left-turn, right-turn and straight for 15%, 10% and 75% of the whole flow
respectively, minor line traffic flow were distributed to left-turn, right-turn and straight for 30%, 30% and 40% of the whole flow respectively;
For 3-armed intersections, major line traffic flow were distributed to left-turn (right-turn) and straight for 15% and 85% of the whole flow respectively, minor line traffic flow were distributed to left-turn, and right-turn for 50% and 50% of the whole flow respectively.
According to observing the traffic video simulated by SSAM for unsignalized intersections, the number of five different types of conflicts for each intersection during the peak hour is recorded, these conflict data are used to calculate Conflict Index. Because traffic conflicts have not any damage like crash, it is hard to analyze and evaluate the severity of traffic conflict directly. For traffic conflicts, if no remedial measurements are implemented, conflicts may turn into crashes, it can be said that traffic conflict is the original format of traffic crash and crash is the potential trend of conflict. Based on the analysis above, conflict severity is strongly related to crash severity. This paper uses crashes (crash angle is the same as conflict angle) severity rate (Eq.(4)) as the weights of conflicts. The crash data for calculating Conflict Index Rate (CfIR) is Wisconsin’s crash data in 2009 (Part B crash data) introduced above. Comparing with crash angle and conflict angle, it can be found:
The conflict angle of Frontal Conflict, Vertical Lateral Conflict and Rear End Conflict are nearly the same as the crash angle of Head On Crash, Angle Crash and Rear End Crash respectively;
The crash angle of Wide-angle Lateral Conflict is range between the crash angle of Head On Crash and Angle Crash;
The crash angle of Small-angle Lateral Conflict is range between the crash angle of Rear End Crash and Angle Crash.
Based on the results above, the weights of Frontal Conflict, Vertical Lateral Conflict and Rear End Conflict can be represented by Conflict Index Rate (calculating by means of Eq.(7) for independent crash, the first line) of Head On Crash, Angle Crash and Rear End Crash respectively; the weights of Wide-angle Lateral Conflict can be represented by Conflict Index Rate (calculating by means of Eq.(7) for multiple crash, the second line) of Head On Crash and Angle Crash; the weights of Small-angle Lateral Conflict can be represented by the
Published by Atlantis Press Copyright: the authors 1328
Crash Severity Evaluation
Conflict Index Rate (calculating by means of Eq.(7) for multiple crash, the second line) of Rear End Crash and Angle Crash. The weights of these five types of conflicts are showed in Table 3. At last, Conflict Index can be calculated based on Eq.(6) using simulated conflict and their weights.
⎪⎪⎩
⎪⎪⎨
⎧
++
=
)( BACrashofNumberICICCrashofNumber
IC
IRCrBrA
r
r (7)
Table 3. Weights of Five Type of Conflict
Conflict Type Crash Type Based on
Weight of Conflict
Frontal Conflict Head on Crash 4.376 Wide-angle Lateral
Conflict Head on Crash &
Angle Crash 2.673
Vertical Lateral Conflict Angle Crash 2.614
Small-angle Lateral Conflict
Angle Crash & Rear-End Crash 2.310
Rear End Conflict Rear-End Crash 1.626
RL
LLFIC f
∗+∗+
∗+∗+∗=
626.1310.2
614.2673.2376.4
3
21 (8)
2.2.3. Crash and Conflict Severity Model Calibration
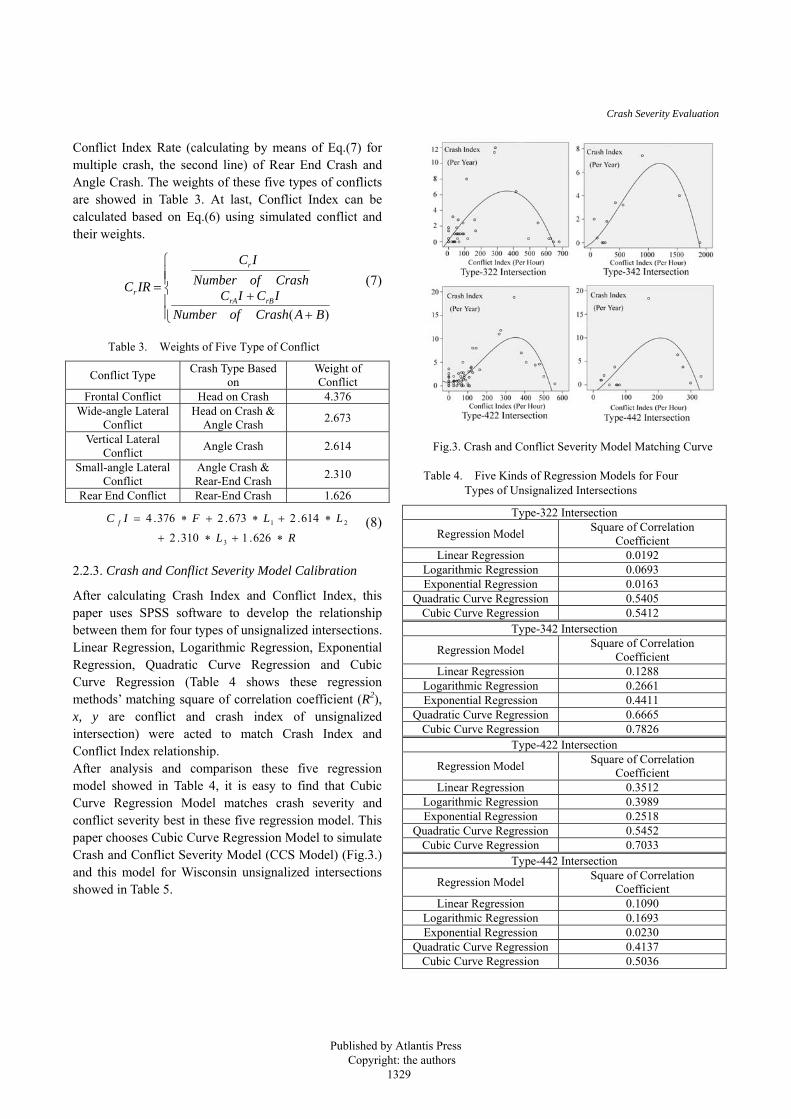
After calculating Crash Index and Conflict Index, this paper uses SPSS software to develop the relationship between them for four types of unsignalized intersections. Linear Regression, Logarithmic Regression, Exponential Regression, Quadratic Curve Regression and Cubic Curve Regression (Table 4 shows these regression methods’ matching square of correlation coefficient (R2), x, y are conflict and crash index of unsignalized intersection) were acted to match Crash Index and Conflict Index relationship. After analysis and comparison these five regression model showed in Table 4, it is easy to find that Cubic Curve Regression Model matches crash severity and conflict severity best in these five regression model. This paper chooses Cubic Curve Regression Model to simulate Crash and Conflict Severity Model (CCS Model) (Fig.3.) and this model for Wisconsin unsignalized intersections showed in Table 5.
Table 4. Five Kinds of Regression Models for Four Types of Unsignalized Intersections
Type-322 Intersection
Regression Model Square of Correlation Coefficient
Linear Regression 0.0192 Logarithmic Regression 0.0693 Exponential Regression 0.0163
Quadratic Curve Regression 0.5405 Cubic Curve Regression 0.5412
Type-342 Intersection
Regression Model Square of Correlation Coefficient
Linear Regression 0.1288 Logarithmic Regression 0.2661 Exponential Regression 0.4411
Quadratic Curve Regression 0.6665 Cubic Curve Regression 0.7826
Type-422 Intersection
Regression Model Square of Correlation Coefficient
Linear Regression 0.3512 Logarithmic Regression 0.3989 Exponential Regression 0.2518
Quadratic Curve Regression 0.5452 Cubic Curve Regression 0.7033
Type-442 Intersection
Regression Model Square of Correlation Coefficient
Linear Regression 0.1090 Logarithmic Regression 0.1693 Exponential Regression 0.0230
Quadratic Curve Regression 0.4137 Cubic Curve Regression 0.5036
Fig.3. Crash and Conflict Severity Model Matching Curve
Published by Atlantis Press Copyright: the authors 1329
Rui Li et al.
Table 5. CCS Model for Four Types of Unsignalized Intersections
Intersection Type Regression Model Equation
Type-322 Intersection 0859.0*0354.0*057.4
*083.12
3
−+−
−−−=
ICICE
ICEIC
ff
fr
Type-342 Intersection 0735.0*003.0*05
1*093.62
3
−+−
+−−=
ICICE
ICEIC
ff
fr
Type-422 Intersection 4809.0*00372.0*00026.0
*0752
3
++
+−−=
ICIC
ICEIC
ff
fr
Type-442 Intersection 0958.1*0262.000047.0
*067.12
3
−+
+−−=
ICIC
ICEIC
ff
fr
Crash Index is calculated using intersection crash data annually, Conflict Index is calculated using intersection conflict data in peak hour.
3. Evaluation
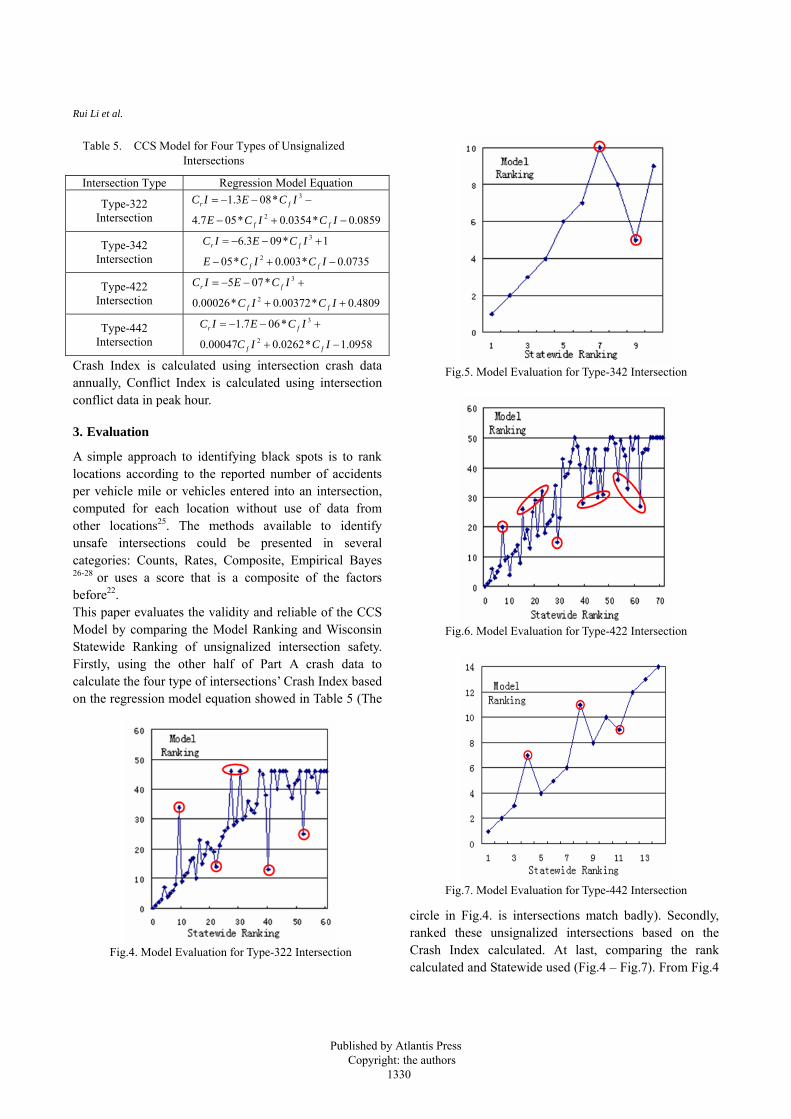
A simple approach to identifying black spots is to rank locations according to the reported number of accidents per vehicle mile or vehicles entered into an intersection, computed for each location without use of data from other locations25. The methods available to identify unsafe intersections could be presented in several categories: Counts, Rates, Composite, Empirical Bayes
26-28 or uses a score that is a composite of the factors before22. This paper evaluates the validity and reliable of the CCS Model by comparing the Model Ranking and Wisconsin Statewide Ranking of unsignalized intersection safety. Firstly, using the other half of Part A crash data to calculate the four type of intersections’ Crash Index based on the regression model equation showed in Table 5 (The
circle in Fig.4. is intersections match badly). Secondly, ranked these unsignalized intersections based on the Crash Index calculated. At last, comparing the rank calculated and Statewide used (Fig.4 – Fig.7). From Fig.4
Fig.6. Model Evaluation for Type-422 Intersection
Fig.5. Model Evaluation for Type-342 Intersection
Fig.7. Model Evaluation for Type-442 Intersection
Fig.4. Model Evaluation for Type-322 Intersection
Published by Atlantis Press Copyright: the authors 1330
Crash Severity Evaluation
– Fig.7, it can be found: For Type-322 intersection, Type-342 intersection
and Type-442 intersection, this Model Ranking and Wisconsin Statewide Ranking match quite well, no more than 20% of these three types of signalized intersections match badly;
For Type-422 intersection, this Model Ranking and Wisconsin Statewide Ranking match not well as other three types of intersections (there are 25% of Type-422 intersections match badly), but most Type-422 intersections based on Model can rank consistent with Wisconsin Statewide Ranking;
All four types of dangerous (ranking forward) unsignalized intersections match quite well.
Based on the evaluation above, the CCS Model proposed in this paper can show the safety of unsignalized intersections well especially for dangerous intersections and be available for different region, therefore is promising.
4. Model Visual Application
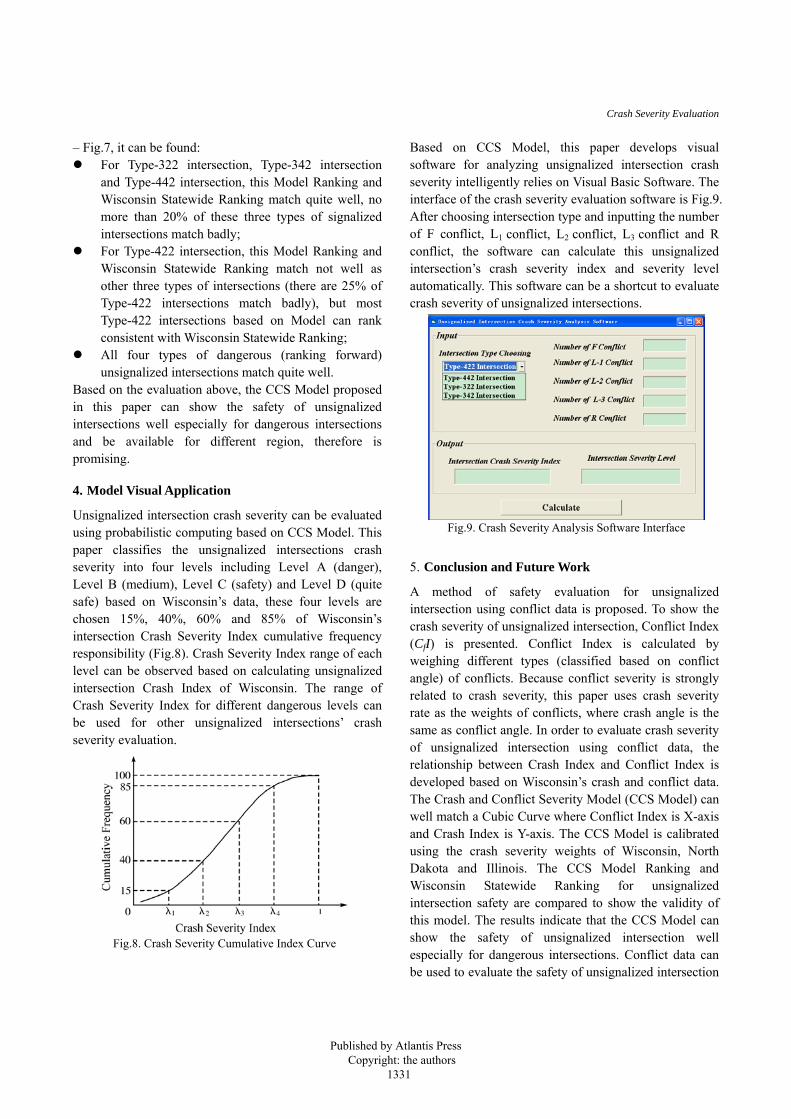
Unsignalized intersection crash severity can be evaluated using probabilistic computing based on CCS Model. This paper classifies the unsignalized intersections crash severity into four levels including Level A (danger), Level B (medium), Level C (safety) and Level D (quite safe) based on Wisconsin’s data, these four levels are chosen 15%, 40%, 60% and 85% of Wisconsin’s intersection Crash Severity Index cumulative frequency responsibility (Fig.8). Crash Severity Index range of each level can be observed based on calculating unsignalized intersection Crash Index of Wisconsin. The range of Crash Severity Index for different dangerous levels can be used for other unsignalized intersections’ crash severity evaluation.
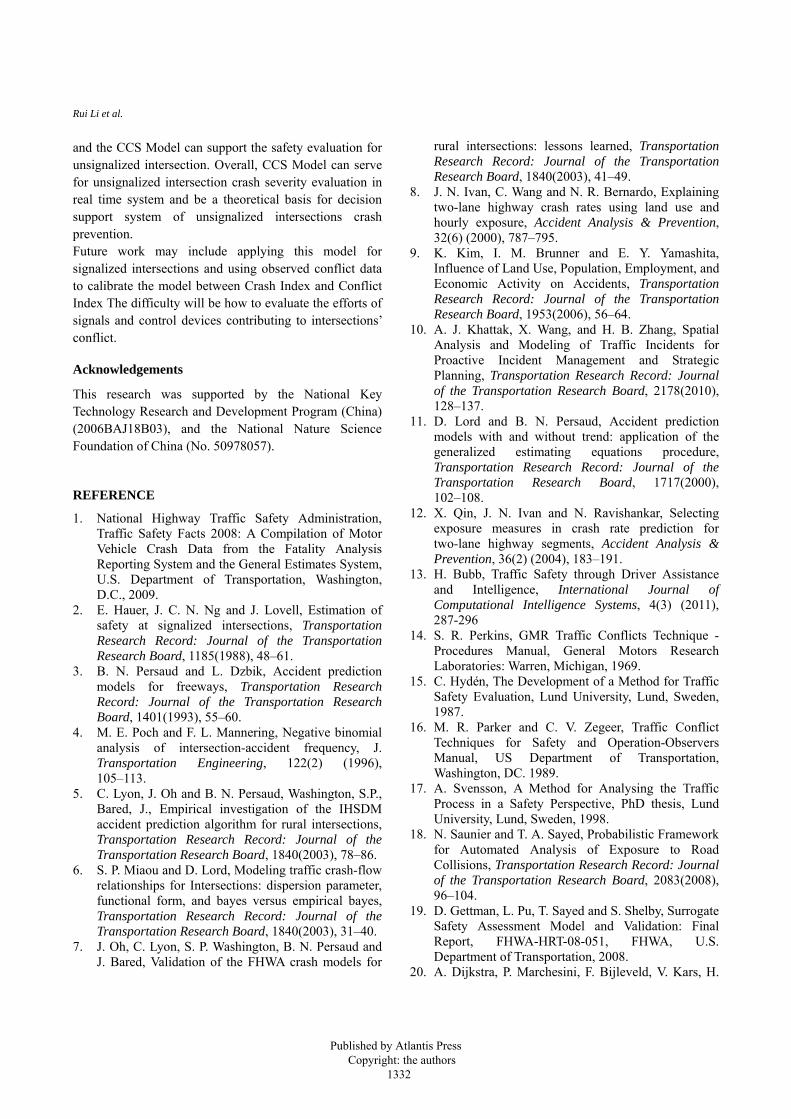
Based on CCS Model, this paper develops visual software for analyzing unsignalized intersection crash severity intelligently relies on Visual Basic Software. The interface of the crash severity evaluation software is Fig.9. After choosing intersection type and inputting the number of F conflict, L1 conflict, L2 conflict, L3 conflict and R conflict, the software can calculate this unsignalized intersection’s crash severity index and severity level automatically. This software can be a shortcut to evaluate crash severity of unsignalized intersections.
5. Conclusion and Future Work
A method of safety evaluation for unsignalized intersection using conflict data is proposed. To show the crash severity of unsignalized intersection, Conflict Index (CfI) is presented. Conflict Index is calculated by weighing different types (classified based on conflict angle) of conflicts. Because conflict severity is strongly related to crash severity, this paper uses crash severity rate as the weights of conflicts, where crash angle is the same as conflict angle. In order to evaluate crash severity of unsignalized intersection using conflict data, the relationship between Crash Index and Conflict Index is developed based on Wisconsin’s crash and conflict data. The Crash and Conflict Severity Model (CCS Model) can well match a Cubic Curve where Conflict Index is X-axis and Crash Index is Y-axis. The CCS Model is calibrated using the crash severity weights of Wisconsin, North Dakota and Illinois. The CCS Model Ranking and Wisconsin Statewide Ranking for unsignalized intersection safety are compared to show the validity of this model. The results indicate that the CCS Model can show the safety of unsignalized intersection well especially for dangerous intersections. Conflict data can be used to evaluate the safety of unsignalized intersection
Fig.9. Crash Severity Analysis Software Interface
Fig.8. Crash Severity Cumulative Index Curve
Published by Atlantis Press Copyright: the authors 1331
Rui Li et al.
and the CCS Model can support the safety evaluation for unsignalized intersection. Overall, CCS Model can serve for unsignalized intersection crash severity evaluation in real time system and be a theoretical basis for decision support system of unsignalized intersections crash prevention. Future work may include applying this model for signalized intersections and using observed conflict data to calibrate the model between Crash Index and Conflict Index The difficulty will be how to evaluate the efforts of signals and control devices contributing to intersections’ conflict.
Acknowledgements
This research was supported by the National Key Technology Research and Development Program (China) (2006BAJ18B03), and the National Nature Science Foundation of China (No. 50978057).
REFERENCE
1. National Highway Traffic Safety Administration, Traffic Safety Facts 2008: A Compilation of Motor Vehicle Crash Data from the Fatality Analysis Reporting System and the General Estimates System, U.S. Department of Transportation, Washington, D.C., 2009.
2. E. Hauer, J. C. N. Ng and J. Lovell, Estimation of safety at signalized intersections, Transportation Research Record: Journal of the Transportation Research Board, 1185(1988), 48–61.
3. B. N. Persaud and L. Dzbik, Accident prediction models for freeways, Transportation Research Record: Journal of the Transportation Research Board, 1401(1993), 55–60.
4. M. E. Poch and F. L. Mannering, Negative binomial analysis of intersection-accident frequency, J. Transportation Engineering, 122(2) (1996), 105–113.
5. C. Lyon, J. Oh and B. N. Persaud, Washington, S.P., Bared, J., Empirical investigation of the IHSDM accident prediction algorithm for rural intersections, Transportation Research Record: Journal of the Transportation Research Board, 1840(2003), 78–86.
6. S. P. Miaou and D. Lord, Modeling traffic crash-flow relationships for Intersections: dispersion parameter, functional form, and bayes versus empirical bayes, Transportation Research Record: Journal of the Transportation Research Board, 1840(2003), 31–40.
7. J. Oh, C. Lyon, S. P. Washington, B. N. Persaud and J. Bared, Validation of the FHWA crash models for
rural intersections: lessons learned, Transportation Research Record: Journal of the Transportation Research Board, 1840(2003), 41–49.
8. J. N. Ivan, C. Wang and N. R. Bernardo, Explaining two-lane highway crash rates using land use and hourly exposure, Accident Analysis & Prevention, 32(6) (2000), 787–795.
9. K. Kim, I. M. Brunner and E. Y. Yamashita, Influence of Land Use, Population, Employment, and Economic Activity on Accidents, Transportation Research Record: Journal of the Transportation Research Board, 1953(2006), 56–64.
10. A. J. Khattak, X. Wang, and H. B. Zhang, Spatial Analysis and Modeling of Traffic Incidents for Proactive Incident Management and Strategic Planning, Transportation Research Record: Journal of the Transportation Research Board, 2178(2010), 128–137.
11. D. Lord and B. N. Persaud, Accident prediction models with and without trend: application of the generalized estimating equations procedure, Transportation Research Record: Journal of the Transportation Research Board, 1717(2000), 102–108.
12. X. Qin, J. N. Ivan and N. Ravishankar, Selecting exposure measures in crash rate prediction for two-lane highway segments, Accident Analysis & Prevention, 36(2) (2004), 183–191.
13. H. Bubb, Traffic Safety through Driver Assistance and Intelligence, International Journal of Computational Intelligence Systems, 4(3) (2011), 287-296
14. S. R. Perkins, GMR Traffic Conflicts Technique - Procedures Manual, General Motors Research Laboratories: Warren, Michigan, 1969.
15. C. Hydén, The Development of a Method for Traffic Safety Evaluation, Lund University, Lund, Sweden, 1987.
16. M. R. Parker and C. V. Zegeer, Traffic Conflict Techniques for Safety and Operation-Observers Manual, US Department of Transportation, Washington, DC. 1989.
17. A. Svensson, A Method for Analysing the Traffic Process in a Safety Perspective, PhD thesis, Lund University, Lund, Sweden, 1998.
18. N. Saunier and T. A. Sayed, Probabilistic Framework for Automated Analysis of Exposure to Road Collisions, Transportation Research Record: Journal of the Transportation Research Board, 2083(2008), 96–104.
19. D. Gettman, L. Pu, T. Sayed and S. Shelby, Surrogate Safety Assessment Model and Validation: Final Report, FHWA-HRT-08-051, FHWA, U.S. Department of Transportation, 2008.
20. A. Dijkstra, P. Marchesini, F. Bijleveld, V. Kars, H.
Published by Atlantis Press Copyright: the authors 1332
Crash Severity Evaluation
Drolenga and M. V. Maarseveen, Do Calculated Conflicts in Microsimulation Model Predict Number of Crashes? Transportation Research Record: Journal of the Transportation Research Board, 2147(2010), 105-112.
21. J. Lu, S. Dissanayake, N. Castillo and K. Williams, Safety Evaluation of Right Turns Followed by U-Turns as an Alternative to Direct Left Turns: Conflict Analysis, Florida Department of Transportation, Tallahassee, 2001.
22. X. Qin, L. Laracuente, D. A. Noyce and M. V. Chitturi, Systemwide Intersection Safety Priority: Development and Assessment, Transportation Research Board Annual Meeting, 2009.
23. J. R. Campbell and K. Knapp, Alternative Crash Severity Ranking Measures and the Implication on Crash Severity Ranking Procedures, Proceedings of the Mid Continent Transportation Research ‐Symposium, Ames, Iowa, 2005.
24. L. Pu and R. Joshi, Surrogate Safety Assessment Model (SSAM)-SOFTWARE USER MANUAL, FHWA-HRT-08-050, FHWA, U.S. Department of Transportation, 2008.
25. L. F. Miranda Moreno, ‐ L. Fu, F. F. Saccomanno and A. Labbe, Alternative Risk Models for Ranking Locations for Safety Improvement, Transportation Research Record: Journal of the Transportation Research Board, 1908(2005), 1 8.‐
26. R. D. Layton, An Evaluation of the Safety Priority Index System, Traffic Management Section, Oregon Department of Transportation, December 1996.
27. S. Hallmark and R. Basavaraju, Evaluation of the Iowa DOT’s Safety Improvement Candidate List Process, Iowa State University and Center for Transportation Research and Education, Ames, Iowa, June 2002.
28. M. D. Pawlovich, Safety Improvement Candidate Location (SICL) Methods, Iowa Department of Transportation, Highway Division, Engineering Bureau, Office of Traffic and Safety, Iowa, February 2007.
Published by Atlantis Press Copyright: the authors 1333