Embed Size (px)
Citation preview

Crater: A Crowd Sensing ApplicationTo Estimate Road Conditions
ByFaria Kalim 2011-NUST-SEECS-BESE-259
Hamza Naveed 2011-NUST-SEECS-BESE-214
AdvisorDr. Muhammad Usman Ilyas
Department of Electrical Engineering
Co-AdvisorDr. Tahir Azim
Department of Computing
A Project Report submitted in partial fulfillment of the requirements forthe degree of Bachelor of Software Engineering (BESE), Department of
Computing
InSchool of Electrical Engineering and Computer Science,
National University of Sciences and Technology (NUST),Islamabad, Pakistan.
(May 2015)


Certificate
It is certified that the contents and form of thesis entitled ”Crater: ACrowd Sending Application To Estimate Road Conditions” submitted by
Faria Kalim (2011-NUST-SEECS-BESE-259) and Hamza Naveed(2011-NUST-SEECS-BESE-214) have been found satisfactory for the
requirement of the degree.
Dr. Usman Ilyas
Dr. Tahir Azim
ii
To my family and faculty.Since I can not possibly pay you back for all that you have given me, I
pray instead that may Allah SWT reward you in this world and the next,and give me the prowess and the opportunity to pay your efforts forward.

Acknowledgements
Dr. Usman Ilyas provided us with invaluable guidance and help at everystep of the project. He gave us his time whenever we chose to walk into hisoffice, and tirelessly explored opportunities to fund the project and take it toa level where it would be more than just an undergraduate final year project.His mentoring changed the way we evaluate information and allowed us todevelop a more analytical approach to problems.
We would also like to thank Dr. Tahir Azim for his valuable input,mentoring and general suggestions for the project.
We will forever be thankful to our advisors for their helpful career adviceand significant efforts to help us get started with our future endeavours.
We would also like to thank Asbah Ashfaq for helping us out with somegraphical user interface design of the project, and Sundus Mariya for lendingher ear when we were in need.
iv
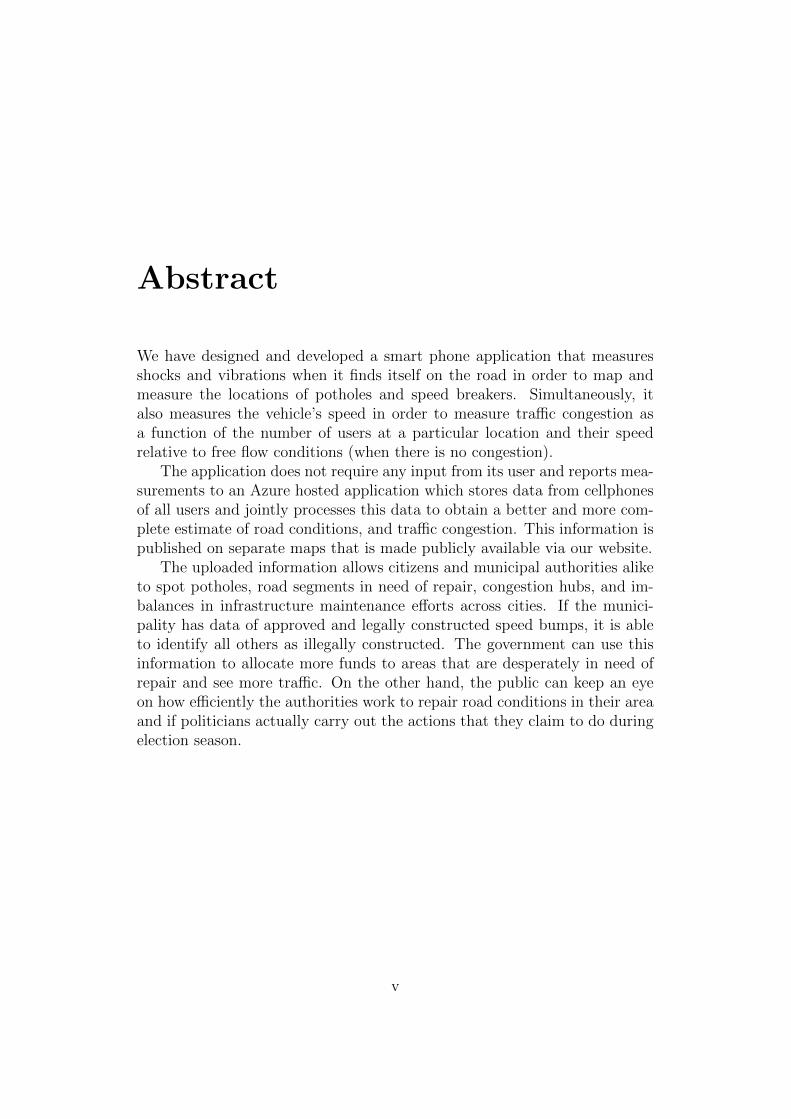
Abstract
We have designed and developed a smart phone application that measuresshocks and vibrations when it finds itself on the road in order to map andmeasure the locations of potholes and speed breakers. Simultaneously, italso measures the vehicle’s speed in order to measure traffic congestion asa function of the number of users at a particular location and their speedrelative to free flow conditions (when there is no congestion).
The application does not require any input from its user and reports mea-surements to an Azure hosted application which stores data from cellphonesof all users and jointly processes this data to obtain a better and more com-plete estimate of road conditions, and traffic congestion. This information ispublished on separate maps that is made publicly available via our website.
The uploaded information allows citizens and municipal authorities aliketo spot potholes, road segments in need of repair, congestion hubs, and im-balances in infrastructure maintenance efforts across cities. If the munici-pality has data of approved and legally constructed speed bumps, it is ableto identify all others as illegally constructed. The government can use thisinformation to allocate more funds to areas that are desperately in need ofrepair and see more traffic. On the other hand, the public can keep an eyeon how efficiently the authorities work to repair road conditions in their areaand if politicians actually carry out the actions that they claim to do duringelection season.
v

Table of Contents
1 Introduction 11.1 Problem Statement . . . . . . . . . . . . . . . . . . . . . . . . 11.2 Proposed Approach . . . . . . . . . . . . . . . . . . . . . . . . 21.3 Scope . . . . . . . . . . . . . . . . . . . . . . . . . . . . . . . 21.4 Contents of This Report . . . . . . . . . . . . . . . . . . . . . 3
2 Literature Review 42.1 Existing Applications . . . . . . . . . . . . . . . . . . . . . . . 4
2.1.1 Street Bump . . . . . . . . . . . . . . . . . . . . . . . 42.1.2 Waze . . . . . . . . . . . . . . . . . . . . . . . . . . . 52.1.3 Potholes Hunter . . . . . . . . . . . . . . . . . . . . . 52.1.4 Fill That Hole . . . . . . . . . . . . . . . . . . . . . . . 52.1.5 Find It, Fix It . . . . . . . . . . . . . . . . . . . . . . . 5
2.2 Published Materials . . . . . . . . . . . . . . . . . . . . . . . . 62.2.1 Pothole Detection System using Machine Learning on
Android . . . . . . . . . . . . . . . . . . . . . . . . . . 62.2.2 The Pothole Patrol: Using a Mobile Sensor Network
for Road Surface Monitoring . . . . . . . . . . . . . . . 62.2.3 Nericell: Rich Monitoring of Road and Traffic Condi-
tions using Mobile Smart Phones . . . . . . . . . . . . 72.2.4 Real Time Pothole Detection using Android Smart-
phones with Accelerometers . . . . . . . . . . . . . . . 72.3 Goals . . . . . . . . . . . . . . . . . . . . . . . . . . . . . . . . 7
3 Functionality and Design 93.1 User Requirements . . . . . . . . . . . . . . . . . . . . . . . . 9
3.1.1 The Application . . . . . . . . . . . . . . . . . . . . . . 93.1.2 The Application Engine . . . . . . . . . . . . . . . . . 93.1.3 The Website . . . . . . . . . . . . . . . . . . . . . . . . 103.1.4 The Database . . . . . . . . . . . . . . . . . . . . . . . 10
3.2 Functional Requirements . . . . . . . . . . . . . . . . . . . . . 11
vi
TABLE OF CONTENTS vii
3.2.1 The Application . . . . . . . . . . . . . . . . . . . . . . 113.2.2 The Website . . . . . . . . . . . . . . . . . . . . . . . . 163.2.3 The Azure Mobile Service . . . . . . . . . . . . . . . . 163.2.4 The App Engine . . . . . . . . . . . . . . . . . . . . . 16
3.3 Database Design . . . . . . . . . . . . . . . . . . . . . . . . . 173.4 Data Flow Diagram . . . . . . . . . . . . . . . . . . . . . . . . 183.5 High Level System Architecture . . . . . . . . . . . . . . . . . 183.6 Important Design Decisions . . . . . . . . . . . . . . . . . . . 21
3.6.1 Google Location APIs vs GPS Sensors in Android Ap-plication : Accuracy and Activity Recognition . . . . . 21
3.6.2 SMO: In the application or at the server end . . . . . . 23
4 Implementation and Results 254.1 Software Development Life Cycle and Challenges Encountered 25
4.1.1 Planning and Requirement Gathering . . . . . . . . . . 254.1.2 Building the Ground Truth Application . . . . . . . . . 254.1.3 Gathering Labelled Data . . . . . . . . . . . . . . . . . 264.1.4 What do Potholes and Speed Breakers Look Like...On
Paper? . . . . . . . . . . . . . . . . . . . . . . . . . . . 274.1.5 Testing Classifiers for Best Performance . . . . . . . . 314.1.6 Building the Final Apps, the Website and the Back-end 344.1.7 Testing and Deployment . . . . . . . . . . . . . . . . . 344.1.8 Implementation Details . . . . . . . . . . . . . . . . . . 40
5 Conclusion and Future Discussion 435.1 Findings and Significance . . . . . . . . . . . . . . . . . . . . . 435.2 Commercialization . . . . . . . . . . . . . . . . . . . . . . . . 445.3 Limitations . . . . . . . . . . . . . . . . . . . . . . . . . . . . 445.4 Improvements . . . . . . . . . . . . . . . . . . . . . . . . . . . 44
List of Figures
3.1 Database Design . . . . . . . . . . . . . . . . . . . . . . . . . 183.2 Data Flow Diagram . . . . . . . . . . . . . . . . . . . . . . . . 193.3 Architectural Diagram . . . . . . . . . . . . . . . . . . . . . . 19
4.1 A Plot of Raw Accelerometer Readings of A Speed Breaker . . 274.2 A Plot of Raw Accelerometer Readings of A Pothole . . . . . 284.3 A Plot of low-Pass Filtered Accelerometer Readings of A Speed
Breaker . . . . . . . . . . . . . . . . . . . . . . . . . . . . . . 294.4 A Plot of Low-Pass Filtered Accelerometer Readings of A Pot-
hole . . . . . . . . . . . . . . . . . . . . . . . . . . . . . . . . 304.5 Naive Bayes . . . . . . . . . . . . . . . . . . . . . . . . . . . . 314.6 J48 . . . . . . . . . . . . . . . . . . . . . . . . . . . . . . . . 324.7 SMO . . . . . . . . . . . . . . . . . . . . . . . . . . . . . . . . 324.8 Decision Tables . . . . . . . . . . . . . . . . . . . . . . . . . . 334.9 Classification via Clustering . . . . . . . . . . . . . . . . . . . 334.10 Home Page of the App . . . . . . . . . . . . . . . . . . . . . . 354.11 Login Page of the App . . . . . . . . . . . . . . . . . . . . . . 364.12 A Map from the App . . . . . . . . . . . . . . . . . . . . . . . 374.13 About Page from the App . . . . . . . . . . . . . . . . . . . . 384.14 Main Page from the Website . . . . . . . . . . . . . . . . . . . 384.15 About Page from the Website . . . . . . . . . . . . . . . . . . 394.16 Maps Page from the Website . . . . . . . . . . . . . . . . . . . 394.17 Calculate Free Flow Conditions . . . . . . . . . . . . . . . . . 414.18 Convert Difference in Latitude and Longitude to Distance . . 414.19 Correct the Device’s Orientation . . . . . . . . . . . . . . . . . 42
viii
List of Tables
3.1 RESTful Services per Table . . . . . . . . . . . . . . . . . . . 17
4.1 Distribution of Labelled Data . . . . . . . . . . . . . . . . . . 31
ix

Acronyms
• FFT: Fast Fourier Transform
• SMO: Sequential Minimal Optimisation
x

Chapter 1
Introduction
1.1 Problem Statement
Road conditions in Pakistan vary from excellent to dilapidated. Urban in-frastructure funds are limited and are spend without giving the public anyvisibility. Every year, the monsoon season brings torrential rain which pushesbad conditions to worse, and sometimes to intolerable levels. It is a frequentcomplaint that patients Some governments try to improve the road networkthrough efforts to build new roads, flyovers and underpasses; such efforts arelimited to urban areas and the major cities of Pakistan. Furthermore, theseefforts generally involve ripping up the old most-frequented routes and cor-doning off these sections of the road network until the repair work is finished.
On occasions that authorities are held accountable for poor road condi-tions in residential areas or in a small locality, the response is that citizensneed to report locations so that the municipality can act. In addition to suf-fering from disrepair, people sometimes construct illegal speed breakers onpublic roads to slow down traffic near their homes and businesses. Lack ofreporting means that sometimes it can be years before such speed breakersare actually removed.
At the same time, Pakistan is a country with a growing population. Re-cently, the number of cars in urban areas has increased exponentially andunfortunately, the road network has not grown at the same rate. This leadsto traffic congestion at central locations in the cities at peak times. Thisis not only a waste of time, but also of energy and money in terms of fuel.Researchers at the Texas A&M Transportation Institute estimate that con-gestion and rough roads will cost the average Texas household $6,100 a yearin wasted fuel, vehicle repairs, and time lost sitting in traffic between nowand 2035 [15]. While the conditions are such in a developed country, we can
1

CHAPTER 1. INTRODUCTION 2
only fathom what it must be costing the citizens of Pakistan to waste timesitting in traffic on terrible roads.
1.2 Proposed Approach
While the use of smartphones is already ubiquitous in urban areas of Pak-istan, they are rapidly pervading the rural setting. On the other hand, withthe advent of 3G/4G technologies in Pakistan, more and more people havebegun to adopt mobile broadband connections. Given these combined factorswe were motivated to come up with a solution to our problem that leveragesthe high density of smartphone users in Pakistan’s urban centers to crowdsense information about road and traffic conditions.
Our solution consists of a zero-input crowdsensing application with aminimum cognitive load i.e. all the user should have to do is to install iton his phone. The application runs in the background while the user ison the road, and gathers information about the jerks and vibrations that avehicle experiences. Then, this information is classified to determine whatexactly the vehicle went over and is uploaded to the server. There, anotherclassifier runs to determine what the majority of users say is present at aparticular geographical location. Having determined this value, it stored inthe database, ready to be published to our website. This website is availablefor the viewing pleasure of all. [8]
Our solution helps both the government and the public by providingthem with much-needed information to make important decisions throughan automated mechanism. All worries about updating information manuallyare removed, as the system shall take updated information from users all thetime while they are driving on the roads.
Government authorities can go through this information to refine theirfund allocation and policies - segments of the road network that is in desper-ate need of repair should be catered to first as an utmost priority. Congestionhubs in the cities should be noted, and alternate routes can be developed.The public can simultaneously check whether government efforts actuallybring results or not.
1.3 Scope
The scope of this project covers mapping:
• Road conditions by measuring on a road:

CHAPTER 1. INTRODUCTION 3
– Potholes
– Speed breakers
• Traffic congestion by measuring:
– the number of users at a particular spot
– the speed of aforementioned users
Initially, the scope included describing overall road conditions in termsof their general condition, and mapping traffic conditions was only an op-tion. However, traffic conditions are actually measured and added to theapplication because they help users make an important decision - choosingroutes with no/little congestion - and this helps motivate more users to adoptthe application. Due to lack of time, describing overall road conditions wasskipped.
1.4 Contents of This Report
This report moves from the introduction of our project to related worksdescribed in the literature review. That section is used to describe howour application has a more significant contribution than the previous works.The third section describes the functionality that is to be implemented aspart of the system and important design decisions that we had to make inorder to use the user’s device memory and bandwidth in an optimal way.The fourth section explains how we completed the implementation of theproject, moved through the software development life cycle and what resultswe produced. Finally, in the last chapter, we conclude with the significanceof our contribution and how the project can be taken forward in the future.

Chapter 2
Literature Review
Previous works on the topic generally describe research or existing applica-tions that have the following features that we would like to avoid:
• Lack of crowd sensing.
• Required user participation in reporting potholes.
• Specialised hardware requirements.
• Incomplete coverage of road anomalies e.g. speed breakers are left outor ignored.
• Only available for commercial or regionally limited use
• The device which gathers the data is forced to be still or not used whilethe data gathering process is going on
2.1 Existing Applications
2.1.1 Street Bump
This app tracks bumps and potholes using the phone’s accelerometer. How-ever, this particular app struggles with speed bumps and manhole covers, andadditionally does not provide the user with the output of its crowd sensing.Instead, the app sends the data to the local government’s road maintenanceworkers. These organizations will then use this information to fix problem-atic road conditions after three or more bumps occur at the same location.This app is currently available on the Apple App store for free. [3]
4
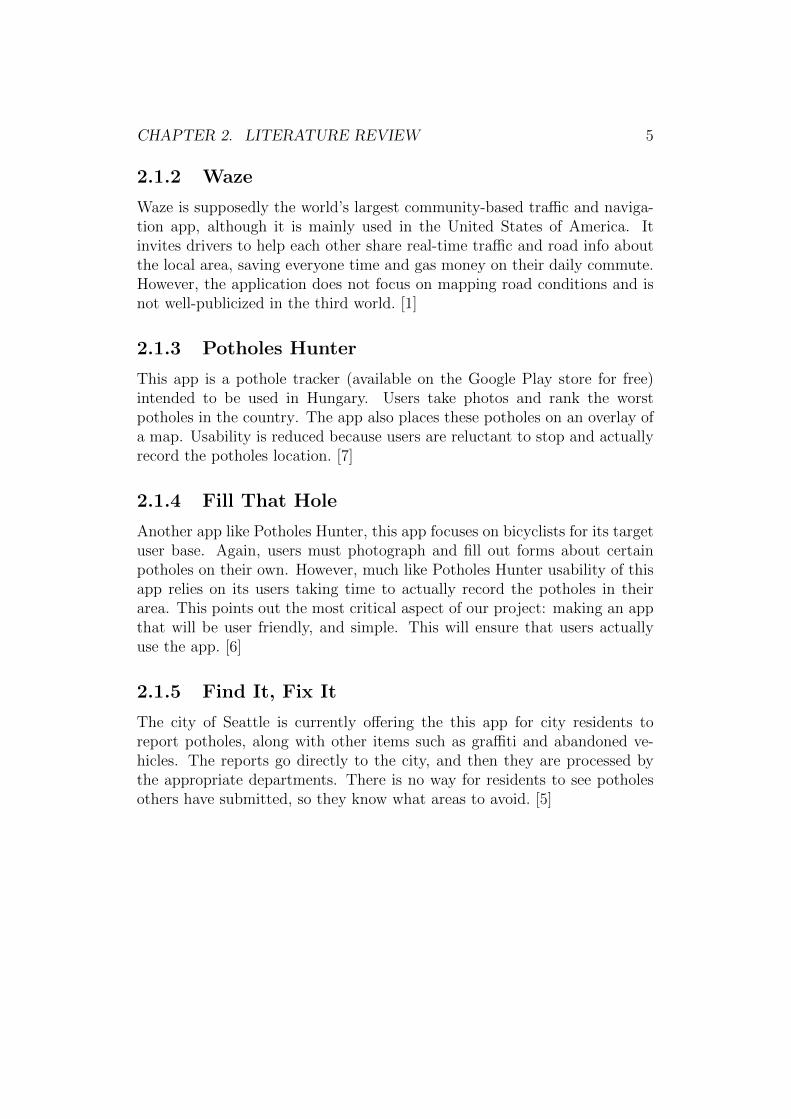
CHAPTER 2. LITERATURE REVIEW 5
2.1.2 Waze
Waze is supposedly the world’s largest community-based traffic and naviga-tion app, although it is mainly used in the United States of America. Itinvites drivers to help each other share real-time traffic and road info aboutthe local area, saving everyone time and gas money on their daily commute.However, the application does not focus on mapping road conditions and isnot well-publicized in the third world. [1]
2.1.3 Potholes Hunter
This app is a pothole tracker (available on the Google Play store for free)intended to be used in Hungary. Users take photos and rank the worstpotholes in the country. The app also places these potholes on an overlay ofa map. Usability is reduced because users are reluctant to stop and actuallyrecord the potholes location. [7]
2.1.4 Fill That Hole
Another app like Potholes Hunter, this app focuses on bicyclists for its targetuser base. Again, users must photograph and fill out forms about certainpotholes on their own. However, much like Potholes Hunter usability of thisapp relies on its users taking time to actually record the potholes in theirarea. This points out the most critical aspect of our project: making an appthat will be user friendly, and simple. This will ensure that users actuallyuse the app. [6]
2.1.5 Find It, Fix It
The city of Seattle is currently offering the this app for city residents toreport potholes, along with other items such as graffiti and abandoned ve-hicles. The reports go directly to the city, and then they are processed bythe appropriate departments. There is no way for residents to see potholesothers have submitted, so they know what areas to avoid. [5]

CHAPTER 2. LITERATURE REVIEW 6
2.2 Published Materials
2.2.1 Pothole Detection System using Machine Learn-ing on Android
This paper investigates an application of mobile sensing: detection of pot-holes on roads. It describes a system and an associated algorithm to monitorthe pothole conditions on the road. The Pothole Detection System uses ac-celerometer sensor of Android smart phones for detection of potholes andGPS for plotting the location of potholes on Google Maps. Accelerome-ter data and pothole data can be mailed to any email address in the formof a .csv file. While designing the pothole detection algorithm some somethreshold values on x-axis and z-axis are assumed. These threshold valuesare justified using a neural network technique which confirms an accuracyof 90%-95%. The neural network has been implemented using a machinelearning framework available for Android called “Encog”.
This paper does not however take into account the benefits of crowdsensing: by gathering data from multiple users, it is likely that a larger roadnetwork would be covered much faster and the aggregated data would bemore accurate. No attention is paid to classifying speed breakers either. [9]
2.2.2 The Pothole Patrol: Using a Mobile Sensor Net-work for Road Surface Monitoring
This paper investigates an application of mobile sensing: detecting and re-porting the surface conditions of roads. A system called the Pothole Patrol(P2 ), uses the inherent mobility of the participating vehicles, opportunis-tically gathers data from vibration and GPS sensors, and processes it toassess road surface conditions. Using a simple machine-learning approach,it is shown that potholes and other severe road surface anomalies can beidentified from accelerometer data.
However, the system requires three-axis acceleration sensors and GPSdevices deployed on embedded computers in cars. We propose to work onlywith android smart phones that users would not have to purchase separatelyfor the purpose of this application. [4]

CHAPTER 2. LITERATURE REVIEW 7
2.2.3 Nericell: Rich Monitoring of Road and TrafficConditions using Mobile Smart Phones
To monitor road and traffic conditions in chaotic settings, this paper presentsNericell, a system that performs rich sensing on smart phones. In this paper,the writers specifically on the sensing component, which uses the accelerom-eter, microphone, GSM radio, and/or GPS sensors in these phones to detectpotholes, bumps, braking, and honking.
This application is also standalone, lacks a central database and does notexploit the benefits of crowd sensing data from multiple users. [11]
2.2.4 Real Time Pothole Detection using Android Smart-phones with Accelerometers
The paper describes a mobile sensing system for road irregularity detectionusing Android OS based smart-phones. Selected data processing algorithmsare discussed and their evaluation presented with true positive rate as highas 90% using real world data.
However, the paper describes that ground truth data is collected for train-ing classifiers through specialized hardware and not smart phones themselves.Furthermore, the smartphone when gathering data for testing the proposedalgorithms was placed in a controlled position. We would like the user to doas they choose while the application gathers data to increase usability of theapplication and decrease cognitive load on the user. [10]
2.3 Goals
Based on the literature review, we aim to bring innovation to the previ-ously described ideas by creating a mobile-cloud solution with the followingfeatures:
• It publishes all processed data online for the use of all and sundry
• It does not involve any user interaction and thus does not place anyburden on the user. All they have to do is carry their phone aroundwith them, just as they would do on any other day
• This application aggregates the data available from crowd sensing andthis allows us to improve accuracy by taking the input of multiple usersinto account

CHAPTER 2. LITERATURE REVIEW 8
• It does not involve using any additional piece of hardware to go withthe application.
• It covers both speed breakers and potholes and also helps the userascertain traffic congestion in the country.

Chapter 3
Functionality and Design
3.1 User Requirements
3.1.1 The Application
• The user shall be able to login to the app.
• Once logged in, the user can view maps for:
– Traffic Congestion
– Potholes
– Speed breakers
• The user shall be able to turn off GPRS usage through app settings
• The app shall inform the user if their device does not support use ofthe application and will direct them to the website.
• The application shall provide an about page for the users to view tounderstand what the app does.
• The application shall gather, classify, store and upload data to thecloud service. This data shall be used there to describe the locationsof potholes and speed breakers.
3.1.2 The Application Engine
• The application engine shall receive data from the users applicationand shall store it into the database
9
CHAPTER 3. FUNCTIONALITY AND DESIGN 10
• The engine shall host the RESTful Web Services to get and post datafrom the users mobile device. The engine shall also support get callsfrom the website
• The server shall regularly process uploaded data to find out the loca-tions of potholes and speed breakers.
• The server shall daily process uploaded data to find out what the freeflow conditions are at particular road segments. These free flow condi-tions shall be used later on to discover if an area is congested or notwith current traffic
3.1.3 The Website
• Displays the three maps, each showing:
– Traffic Congestion
– Potholes
– Speed breakers
• Gives an overview of the application
• Provides the user with the link page for the app stores
3.1.4 The Database
The database shall contains tables that store:
• Congestion Data.
This table shall contain all data that is uploaded by the users relevantto traffic conditions i.e. their locations and their speeds
• Free Flow Traffic
This table shall contain all data that describes free flow conditionson roads i.e. the speed of vehicles when there is no congestion. Analternate could be speed limits
• Classified Data
This table shall contain data that describes what each individual userhas to say about individual locations. This is the result only of theprocessing on the app.

CHAPTER 3. FUNCTIONALITY AND DESIGN 11
• Voting Results
This table shall contain data that describes what the aggregated datasays about each individual location after processing on the server. Thisdata is then displayed on the website.
3.2 Functional Requirements
3.2.1 The Application
1. The user shall log into the app using Facebook or Google authenticationas supported by Azure mobile services
2. The user shall be directed to the main page after logging in
3. The main page shall have three buttons that shall redirect the user tothree separate maps:
• Showing traffic congestion
• Showing location of potholes
• Showing location of speed breakers
4. The main page shall allow the user through the menu to view informa-tion about the app.
5. The main page shall allow the user to turn GPRS on or off at will. Thisprovision is made so that if there is no WiFi available and the user doesnot want to expend their mobile broadband connection on the app, thenthey can choose to prevent the app from using the remainder of theirbandwidth.
6. The application shall periodically check if the following are available,once the user has logged in, after every fifteen minutes:
• An Internet connection (WiFi or GPRS if the user hasnt disal-lowed GPRS)
• Google Play Services (For Locations API and Activity Recogni-tion)
• GPS Sensor, Rotation Sensor, Accelerometer
• GPS Location is on
• The cellphone is moving on the road in a vehicle

CHAPTER 3. FUNCTIONALITY AND DESIGN 12
• The user is not using the phone for a telephone call
• If an SD Card is available, then there should be 100 MBs of spacefor the file that the app is writing into. If there is no SD cardavailable, then only 50 MBs of space should be utilised. If there isalready a file of such size available in memory, then data gathering,storage and processing should not take place.
If all of these conditions are true, the application can proceed to thestep 7.
7. The application shall begin gathering data about road conditions andtraffic congestion.
• The application shall use the accelerometer sensor at the highestfrequency in android with minimum delay i.e SENSOR DELAY FASTEST.This gives a frequency of 50 Hertz approximately.
• The accelerometer readings must be scaled to a vertical axis. Asthe device rotates, the axis along which readings are taken alsorotate. These must be scaled back to the original axis. (This canbe done using the rotation sensor readings)
• Once 40,000 accelerometer readings across all three axes are col-lected, calculate features from the data by dividing these readingsinto sets of 800 readings each. Each record of readings shall con-tain: (time in milliseconds, latitude, longitude, acceleration in thex direction, acceleration in the y axis direction, acceleration in thez axis direction)
• Calculate the speed simultaneously for each record and add it tothe record.
• Pass this data across through a low pass filter and a high passfilter to generate three sets of data:
– The first with only low frequency data
– The second with only high frequency data
– The original data set
• Calculate features for each of these 800 readings. These featuresinclude:
– Average speed
– FFT of the accelerometer readings across the x axis (first 50)
– FFT of the accelerometer readings across the y axis (first 50)
CHAPTER 3. FUNCTIONALITY AND DESIGN 13
– FFT of the accelerometer readings across the z axis (first 50)
– FFT of the low pass-filtered accelerometer readings across thex axis (first 50)
– FFT of the low pass-filtered accelerometer readings across they axis (first 50)
– FFT of the low pass-filtered accelerometer readings across thez axis (first 50)
– Maximum value from FFT of low pass filtered accelerometerreadings across x-axis
– Maximum value from FFT of low pass filtered accelerometerreadings across y-axis
– Maximum value from FFT of low pass filtered accelerometerreadings across z-axis
– Minimum value from FFT of low pass filtered accelerometerreadings across x-axis
– Minimum value from FFT of low pass filtered accelerometerreadings across y-axis
– Minimum value from FFT of low pass filtered accelerometerreadings across z-axis
– Maximum value from FFT of accelerometer readings acrossx-axis
– Maximum value from FFT of accelerometer readings acrossy-axis
– Maximum value from FFT of accelerometer readings acrossz-axis
– Minimum value from FFT of accelerometer readings acrossx-axis
– Minimum value from FFT of accelerometer readings acrossy-axis
– Minimum value from FFT of accelerometer readings acrossz-axis
– Standard deviation of accelerometer readings across x axis
– Standard deviation of accelerometer readings across y axis
– Standard deviation of accelerometer readings across z axis
– Mean of accelerometer readings across x axis
– Mean of accelerometer readings across y axis
– Mean of accelerometer readings across z axis

CHAPTER 3. FUNCTIONALITY AND DESIGN 14
– Standard deviation of low pass filtered accelerometer readingsacross x axis
– Standard deviation of low pass filtered accelerometer readingsacross y axis
– Standard deviation of low pass filtered accelerometer readingsacross z axis
– Mean of low pass filtered accelerometer readings across x axis
– Mean of low pass filtered accelerometer readings across y axis
– Mean of low pass filtered accelerometer readings across z axis
– Number of points one standard deviation away from the meanon the x axis
– Number of points two standard deviation away from the meanon the x axis
– Number of points one standard deviation away from the meanon the y axis
– Number of points two standard deviation away from the meanon the y axis
– Number of points one standard deviation away from the meanon the z axis
– Number of points two standard deviation away from the meanon the z axis
– Number of points one low pass filtered standard deviationaway from the low pass filtered mean on the x axis
– Number of points two low pass filtered standard deviationaway from the low pass filtered mean on the x axis
– Number of points one low pass filtered standard deviationaway from the low pass filtered mean on the y axis
– Number of points two low pass filtered standard deviationaway from the low pass filtered mean on the y axis
– Number of points one low pass filtered standard deviationaway from the low pass filtered mean on the z axis
– Number of points two low pass filtered standard deviationaway from the low pass filtered mean on the z axis
– Number of points one high pass filtered standard deviationaway from the low pass filtered mean on the x axis
– Number of points two high pass filtered standard deviationaway from the low pass filtered mean on the x axis
CHAPTER 3. FUNCTIONALITY AND DESIGN 15
– Number of points one high pass filtered standard deviationaway from the low pass filtered mean on the y axis
– Number of points two high pass filtered standard deviationaway from the low pass filtered mean on the y axis
– Number of points one high pass filtered standard deviationaway from the low pass filtered mean on the z axis
– Number of points two high pass filtered standard deviationaway from the low pass filtered mean on the z axis
– Maximum on X axis
– Maximum on Y axis
– Maximum on Z axis
– Minimum on X axis
– Minimum on Y axis
– Minimum on Z axis
– Minimum Speed
– Maximum Speed
– Maximum of ratio of x to z in high pass filtered data
– Mean of ratio of x to z in high pass filtered data
– Median of ratio of x to z in high pass filtered data
– Minimum of ratio of x to z in high pass filtered data
– Standard deviation of high pass filtered data across x axis
– Standard deviation of high pass filtered data across y axis
– Standard deviation of high pass filtered data across z axis
– Maximum of high pass filtered data across x axis
– Maximum of high pass filtered data across y axis
– Maximum of high pass filtered data across z axis
– Minimum of high pass filtered data across x axis
– Minimum of high pass filtered data across y axis
– Minimum of high pass filtered data across z axis
• This data shall be passed to the classifier (an SMO trained model)and is classified as either a pothole, or a speed breaker or as noanomaly
• This classified data should be written to file
• As speed, location and time values are available, they should bepassed to the mobile service for storing in the database for calcu-lation of congestion of traffic

CHAPTER 3. FUNCTIONALITY AND DESIGN 16
8. The application shall periodically upload data stored during gatheringinformation about road conditions to the server if WiFi is available.
3.2.2 The Website
The website shall have two main functionalities:
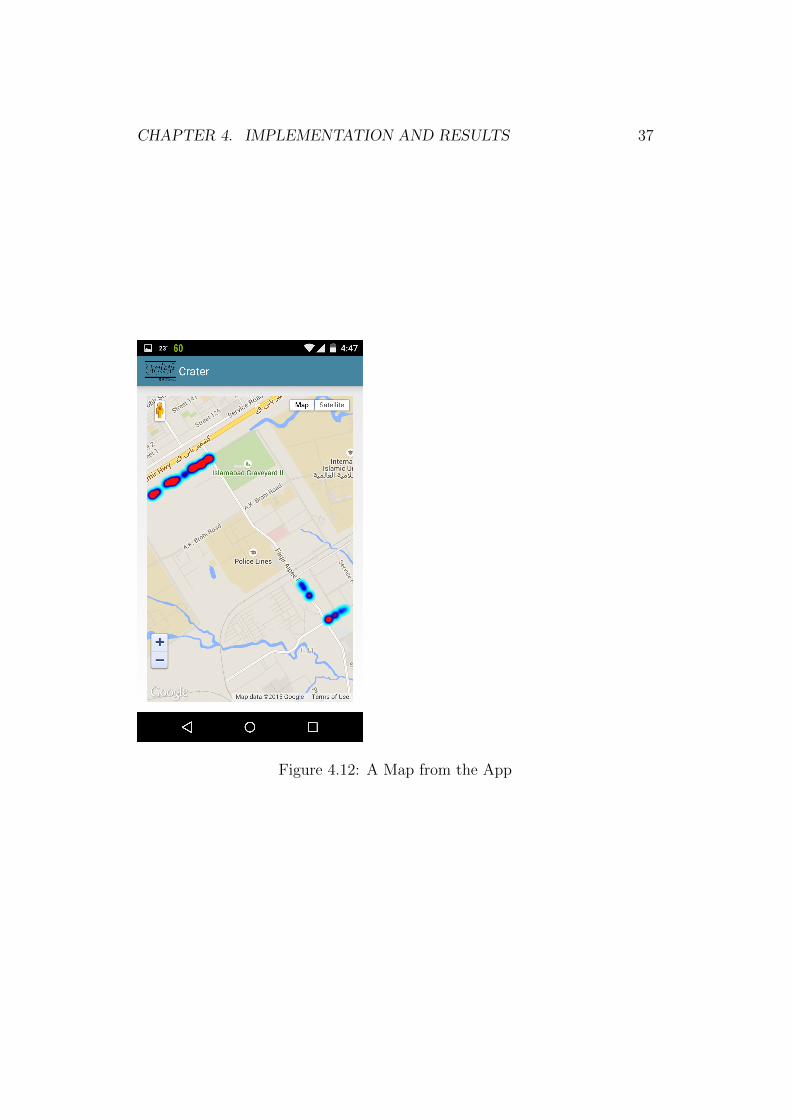
• The website shall have an about page, explaining how the app works,how to download it and who are the creators.
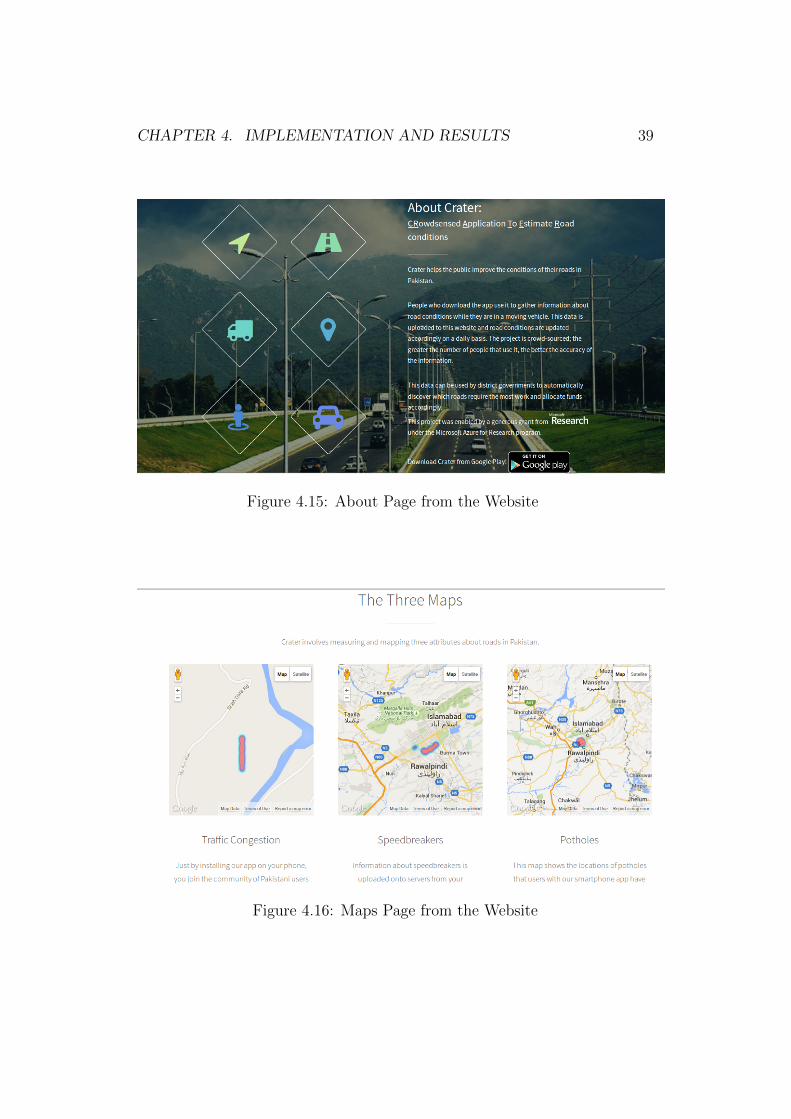
• The website shall display three separate heat maps for showing:
– Potholes (data from voting results)
– Speed breakers (data from voting results)
– Congestion (Live) (data from congestion data)
• An option that could also be additionally implemented would be toallow the user to choose a certain time for which they would like to seethe congestion in the city.
3.2.3 The Azure Mobile Service
The mobile service provides two essential functionalities:
• Passes data from the app to the database. An optimal implementa-tion would include batch processing the input from the user and theninserting it into the database.
• The service provides RESTful APIs to allow easy access to the datafor display on the website and on the maps in the device. APIs can becustomised for any use.
• The service also provides authentication through social media websites.
The following services must be implemented:
3.2.4 The App Engine
The application engine shall consist of a server that shall periodically runthe following processes:
• Delete all old processed data from classified data to make room for moredata. The database size is limited and more space should be made asthe volume of data increases with the number of users.

CHAPTER 3. FUNCTIONALITY AND DESIGN 17
Table Name Table Description ServicesClassified Data Used to store data received from the
applications classifierGet, Post
Voting Results Server gets data from classified data,processes it and pushes results back tovoting results
Get, Post
CongestionData
Stores data containing user id, loca-tion, speed and time to calculate con-gestion
Get, Post, Get withina specified time for aspecific location withunique users only
Free Flow Contains free flow speed for each roadsegment
Get, Put, Post
Table 3.1: RESTful Services per Table
• Get data from classified data table, process it and push result back intovoting results. The processing would involve:
– Get data for a particular cell across the map
– See whether there are more votes for that cell having a pothole,a speed breaker or no anomaly. This is the defined result. In thecase where votes for two features (potholes—speed breakers, noanomaly) are equal, then we choose the safe option and say thatthere are no anomalies in that cell. If the votes for potholes andspeed breakers are equal, then the decision becomes more difficultto make and due to that, we must consider implemented NaiveBayes at the server end to make the choice easier.
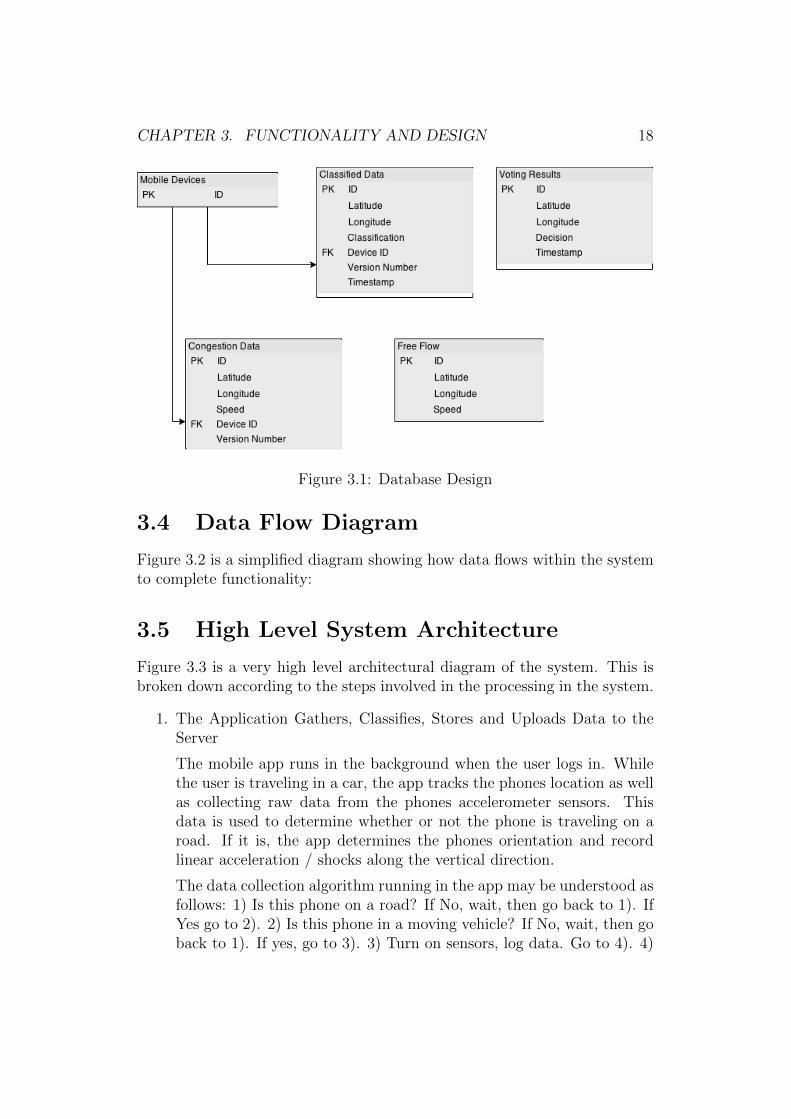
3.3 Database Design
Figure 3.1 shows the database design. The version numbers in the congestiondata and classified data tables are significant as they help us keep track ofthe version of the application that uploaded the data to the database. Asthe application is updated, we need a method that would allow us to keeptrack of what data came from what version of the application so that eachof the data types could be updated using their respective algorithms.
CHAPTER 3. FUNCTIONALITY AND DESIGN 18
Figure 3.1: Database Design
3.4 Data Flow Diagram
Figure 3.2 is a simplified diagram showing how data flows within the systemto complete functionality:
3.5 High Level System Architecture
Figure 3.3 is a very high level architectural diagram of the system. This isbroken down according to the steps involved in the processing in the system.
1. The Application Gathers, Classifies, Stores and Uploads Data to theServer
The mobile app runs in the background when the user logs in. Whilethe user is traveling in a car, the app tracks the phones location as wellas collecting raw data from the phones accelerometer sensors. Thisdata is used to determine whether or not the phone is traveling on aroad. If it is, the app determines the phones orientation and recordlinear acceleration / shocks along the vertical direction.
The data collection algorithm running in the app may be understood asfollows: 1) Is this phone on a road? If No, wait, then go back to 1). IfYes go to 2). 2) Is this phone in a moving vehicle? If No, wait, then goback to 1). If yes, go to 3). 3) Turn on sensors, log data. Go to 4). 4)

CHAPTER 3. FUNCTIONALITY AND DESIGN 19
Figure 3.2: Data Flow Diagram
Figure 3.3: Architectural Diagram

CHAPTER 3. FUNCTIONALITY AND DESIGN 20
Is the phone still on the road AND in a vehicle? If Yes, continue to logdata and go to 4). If No, turn off sensors, go to 1). This yields a timeseries signal of the vertical acceleration the phone experiences. Thissignal is processed to: 1) Detect potholes and estimate the location. 2)Detect speed bumps and estimate their location. 3) Estimate the carsspeed and use it to measure traffic conditions.
The mobile app transmits detected potholes and speed bumps, alongwith speed along the road at various points either via GPRS / 3G / 4Gmobile Internet connection (if available) or through the next availableWiFi connection, whenever it becomes available.
The app is allocated a finite amount of memory to buffer data thatneeds to be transmitted to the server. Once the buffer is full, the appmay stop collecting data until the buffer is emptied. Once data hasbeen sent to the main server, it is removed from the users device.
2. The Mobile Service Stores Data into the SQL Database
The SQL database contains data about new mobile app measurementsawaiting processing since the last run of the app engine. The app engineuses this data when it executes and updates road condition consensus,speed bump locations, pothole locations and the limited backlog of rawmeasurements
3. Server Periodically Retrieves Data, Processes It and Uploads it Backinto the Database
The principal task of the app engine is the periodic analysis of classifieddata received from mobile app instances. Every time the app engineexecutes it includes the new data received since the last run for thefollowing two detectors:
• Pothole detector.
• Speed bump detector
For each location on the map, the app engine periodically analyzes thedata available, filters out false positives, and detects the consensus valuethat describes the speed bump / pothole location and road condition.The greater the number of readings for a location, the more accuratethe mean value is likely to be. The updated results of the detectorsis plotted on the Google Maps interface. An additional feature is toinclude a map view of the results of the app engines two detectors in aview of the mobile app described above. Therefore, they could see the
CHAPTER 3. FUNCTIONALITY AND DESIGN 21
updates without launching the browser which could serve as additionalmotivation for users to install the mobile app.
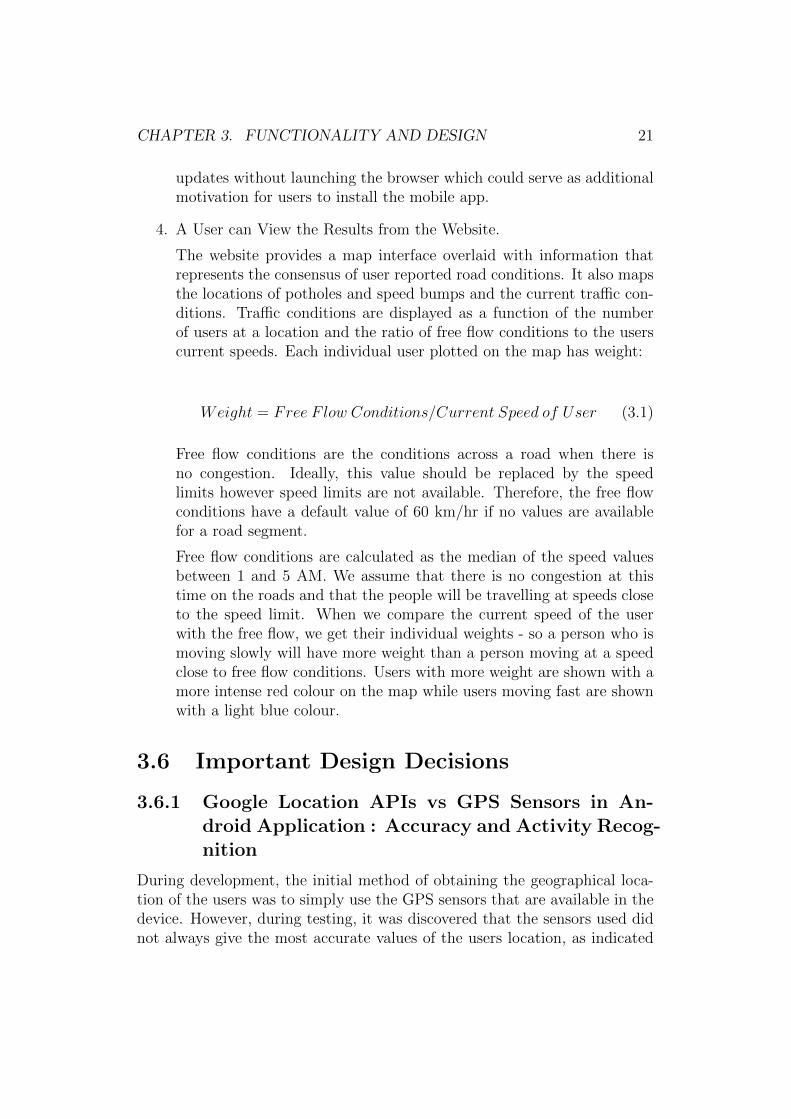
4. A User can View the Results from the Website.
The website provides a map interface overlaid with information thatrepresents the consensus of user reported road conditions. It also mapsthe locations of potholes and speed bumps and the current traffic con-ditions. Traffic conditions are displayed as a function of the numberof users at a location and the ratio of free flow conditions to the userscurrent speeds. Each individual user plotted on the map has weight:
Weight = Free F low Conditions/Current Speed of User (3.1)
Free flow conditions are the conditions across a road when there isno congestion. Ideally, this value should be replaced by the speedlimits however speed limits are not available. Therefore, the free flowconditions have a default value of 60 km/hr if no values are availablefor a road segment.
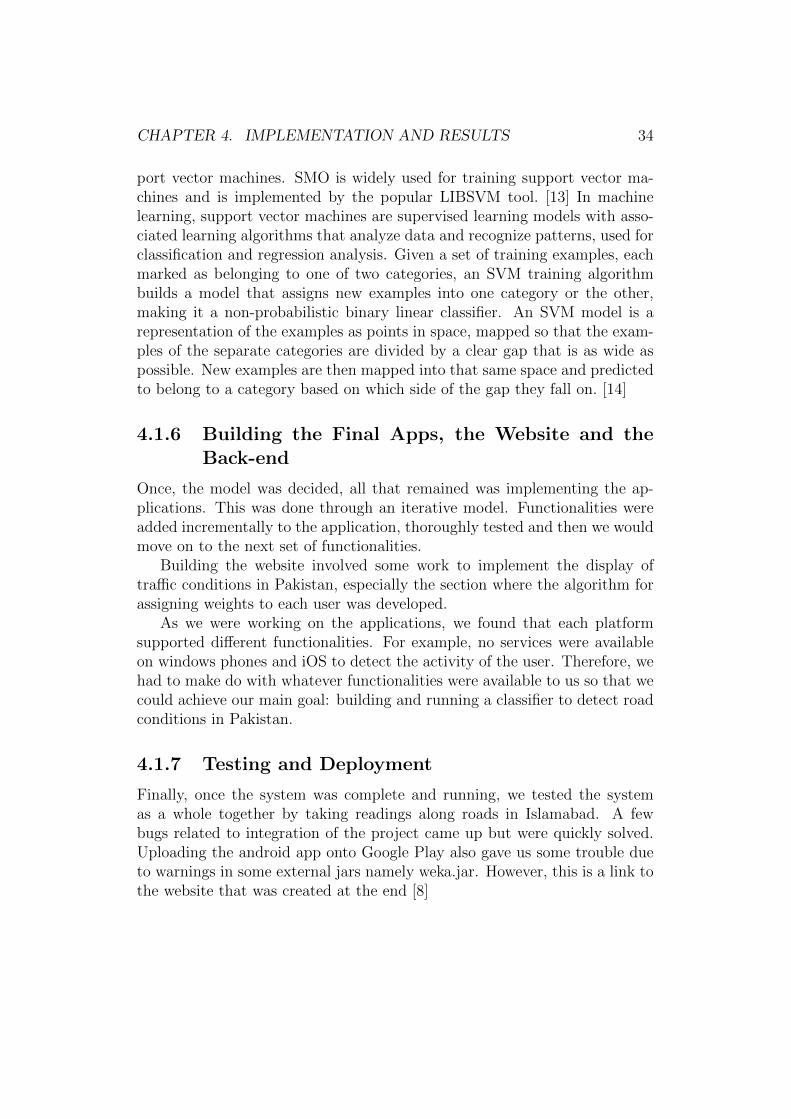
Free flow conditions are calculated as the median of the speed valuesbetween 1 and 5 AM. We assume that there is no congestion at thistime on the roads and that the people will be travelling at speeds closeto the speed limit. When we compare the current speed of the userwith the free flow, we get their individual weights - so a person who ismoving slowly will have more weight than a person moving at a speedclose to free flow conditions. Users with more weight are shown with amore intense red colour on the map while users moving fast are shownwith a light blue colour.
3.6 Important Design Decisions
3.6.1 Google Location APIs vs GPS Sensors in An-droid Application : Accuracy and Activity Recog-nition
During development, the initial method of obtaining the geographical loca-tion of the users was to simply use the GPS sensors that are available in thedevice. However, during testing, it was discovered that the sensors used didnot always give the most accurate values of the users location, as indicated

CHAPTER 3. FUNCTIONALITY AND DESIGN 22
by the accuracy field that the function result also provides. These returnedvalues were subsequently plotted onto Google Maps by a user who knewwhere they had been while using the application and sometimes, the latitudeand longitude pair returned by android sensors was off by several streets.
Such inaccuracy was unacceptable for us because there would be no pointin finding the location of potholes and speed breakers if the location wasoff by a couple of streets. Therefore, we set out in search of a methodthat would give us better accuracy in terms of location. Since android isa product by Google, a solution was already provided to by them in theform of Google Location APIs. (https://developer.android.com/google/play-services/location.html). The website claims that its fused location providerhas the following features: “The Fused Location Provider intelligently man-ages the underlying location technology and gives you the best location ac-cording to your needs.
• Simple APIs: Lets you specify high-level needs like “high accuracy” or“low power”, instead of having to worry about location providers.
• Immediately available: Gives your apps immediate access to the best,most recent location.
• Power-efficiency: Minimizes your app’s use of power. Based on all in-coming location requests and available sensors, fused location providerchooses the most efficient way to meet those needs.
• Versatility: Meets a wide range of needs, from foreground uses thatneed highly accurate location to background uses that need periodiclocation updates with negligible power impact.”
After rigorous testing, it was found that the service does provide muchbetter accuracy than the sensors alone. The worst case involved the readingsto be in a few meters distance of the actual location of the user. Therefore,it was decided that the APIs should be used.
This decision was corroborated by the fact that the APIs provide function-ality to discover what the users current activity is. The web page describesthis as:
“Activity recognition:The Activity recognition API makes it easy to check the users current
activitystill, walking, cycling, and in-vehiclewith very efficient use of thebattery:
• Optimized for battery: Uses low-power sensors to recognize the user’scurrent physical activity.

CHAPTER 3. FUNCTIONALITY AND DESIGN 23
• Enhances other services with context: Great for adding movementawareness to location awareness. Apps can adjust the amount of loca-tion awareness they provide, based on the current user movement. Forexample, a navigation app can request more frequent updates when theuser is driving.
• Advanced activity detection: For apps that want to do their own post-processing, the activity APIs provide confidence values for each of theactivities. It also includes two activities that indicate unreliable mea-surements: unknown and tilt.
”Since code reuse is always a good idea, this API has been used to discover
the users activity as well. The alternate would be to use another classifierto recognise the users activity. Since this work did not take priority overclassifying the road conditions, this idea was discarded.
3.6.2 SMO: In the application or at the server end
During the initial phases of the architectural design, the plan was to placethe classifier at the server instead of in the app.
• Plan 1: Send Gathered Accelerometer Data to Server
This turned out to be a poor design decision in practice because therate at which data is gathered is 50 Hertz. This means that for eachsecond, we have 50 records containing (timestamp, latitude, longi-tude,acceleration in the x direction, acceleration in the y direction,and acceleration in the z direction). This amounted to a lot of spacethat the application occupied in memory. Therefore, a method had tobe discovered in order to make this process easier.
• Plan 2: Send features only to the server
Approximately 350 features (all doubles) are calculated for every 800readings/for 16 seconds of data. This allowed us to go from storing 4800readings for every 16 seconds in Plan 1 to storing 350 readings for every16 seconds. However, during an experimental test, this also occupiedquite a lot of space on the device and consumed a lot of bandwidthwhen uploading the data to the server end and . Therefore, we movedto plan 3.
• Plan 3: Moving the classifier and feature extraction to the app

CHAPTER 3. FUNCTIONALITY AND DESIGN 24
Once the low pass filtering, and classification portions are shifted theapp, then the downside is that the application becomes large in size. Onthe upside however, is that for every 1600 seconds, only the followingrecords are stored in file: (timestamp, latitude, longitude, classification,device id). This significantly decreases the amount of data that is storedon file and also helps save the users bandwidth.
Chapter 4
Implementation and Results
4.1 Software Development Life Cycle and Chal-
lenges Encountered
Our software development life cycle consisted essentially of moving from re-quirement gathering to deployment while going through several iterationsduring each stage in order to find and remove bugs right there and then, andensure that the system was well-integrated with the rest of its components.
4.1.1 Planning and Requirement Gathering
During this stage of development, we went through defining the scope of ourapplication, the functionalities we would implement and the constraints thatwe would have to face while developing the system.
4.1.2 Building the Ground Truth Application
The ground truth application was created only so that we could get data thatwould be used to train our classifiers, and would test different classifiers tosee which one gave the best results. Its functionality included the following:
1. The app gathered sensor data in the background the moment it wasswitched on.
2. The user interface must provide two buttons. The first one would befor potholes and the second one would be for speed breakers. At thebutton press, the timestamp and location of the user would be storedin a buffer.
25
CHAPTER 4. IMPLEMENTATION AND RESULTS 26
These two functionalities allowed us to have three arrays of informationat the end of the day:
• Sensor Data
• When and where was a pothole encountered
• When and where was a speed breaker encountered
By taking the timestamp from when a pothole/speed breaker was en-countered and finding out what the sensor data looked at the time, we couldbegin to understand what features we might use to classify potholes andspeed breakers.
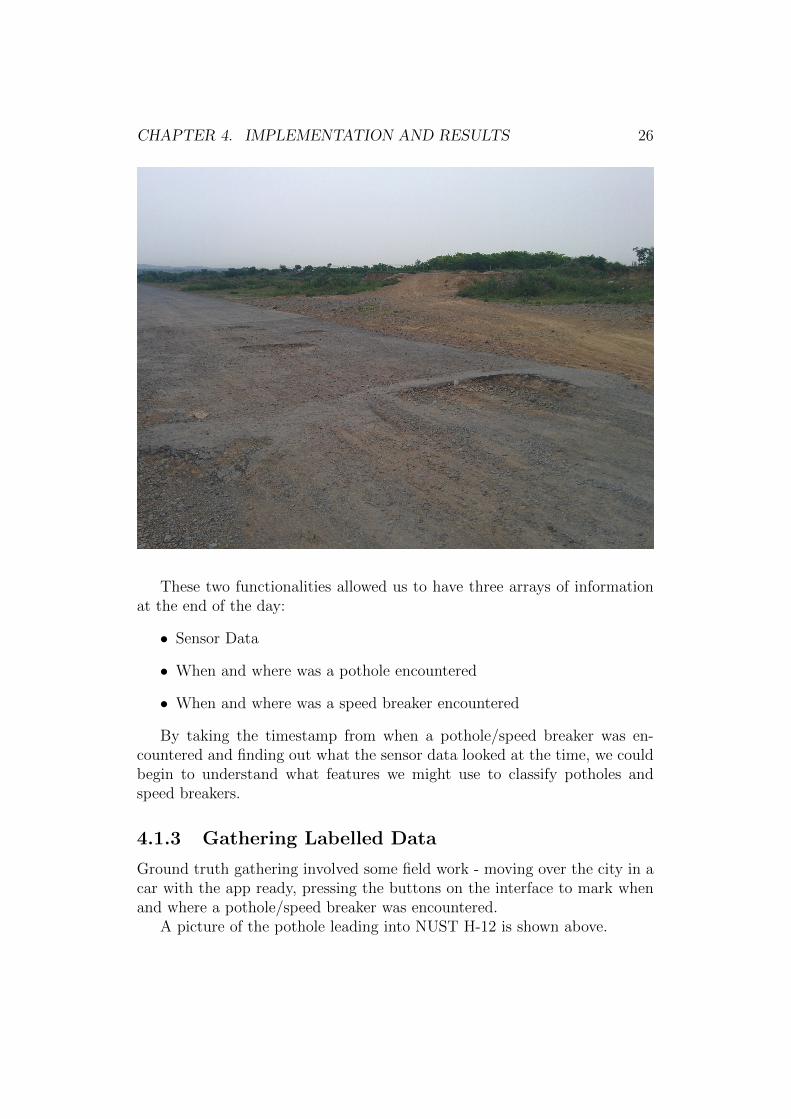
4.1.3 Gathering Labelled Data
Ground truth gathering involved some field work - moving over the city in acar with the app ready, pressing the buttons on the interface to mark whenand where a pothole/speed breaker was encountered.
A picture of the pothole leading into NUST H-12 is shown above.

CHAPTER 4. IMPLEMENTATION AND RESULTS 27
Figure 4.1: A Plot of Raw Accelerometer Readings of A Speed Breaker
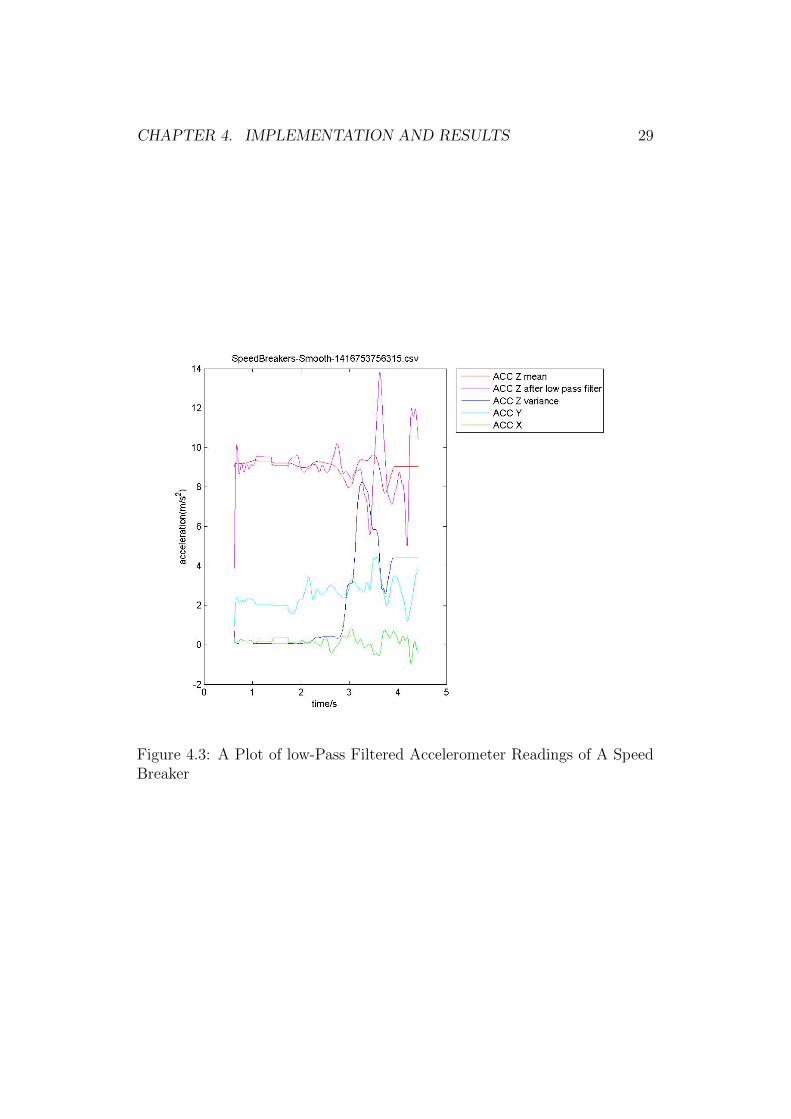
4.1.4 What do Potholes and Speed Breakers Look Like...OnPaper?
Once we had the data describing a pothole and a speed breaker available tous, we decided to plot this data to find out what potholes and speed breakerslook like on paper.
This data was first plotted through matlab. Figures 4.1-4.4 indicate howraw values of acceleration along the x,y and z axis look when plotted withrespect to time.
A low pass filter was applied to smooth the curve. A high pass filter wasapplied to see exactly what very high frequency values were obtained whichcould be used to describe general road conditions (now no longer in the scopeof the project).
After looking at the smoothed curves obtained from acceleration in allthree directions, we extracted the features that are described in the require-ments section in detail. We used these features to classify potholes, speedbreakers and no road anomaly across the road. Feature extraction was done

CHAPTER 4. IMPLEMENTATION AND RESULTS 28
Figure 4.2: A Plot of Raw Accelerometer Readings of A Pothole
CHAPTER 4. IMPLEMENTATION AND RESULTS 29
Figure 4.3: A Plot of low-Pass Filtered Accelerometer Readings of A SpeedBreaker

CHAPTER 4. IMPLEMENTATION AND RESULTS 30
Figure 4.4: A Plot of Low-Pass Filtered Accelerometer Readings of A Pothole

CHAPTER 4. IMPLEMENTATION AND RESULTS 31
Figure 4.5: Naive Bayes
using Python scripts which made the job a whole lot easier.
4.1.5 Testing Classifiers for Best Performance
Using Weka, we tested several classifiers, given our ground truth data.The distribution of labelled ground truth data is given in Table 4.1.
Labelled Pot-holes
Labelled Speed Break-ers
Points Not Labelled Total
254 177 6446 6877
Table 4.1: Distribution of Labelled Data
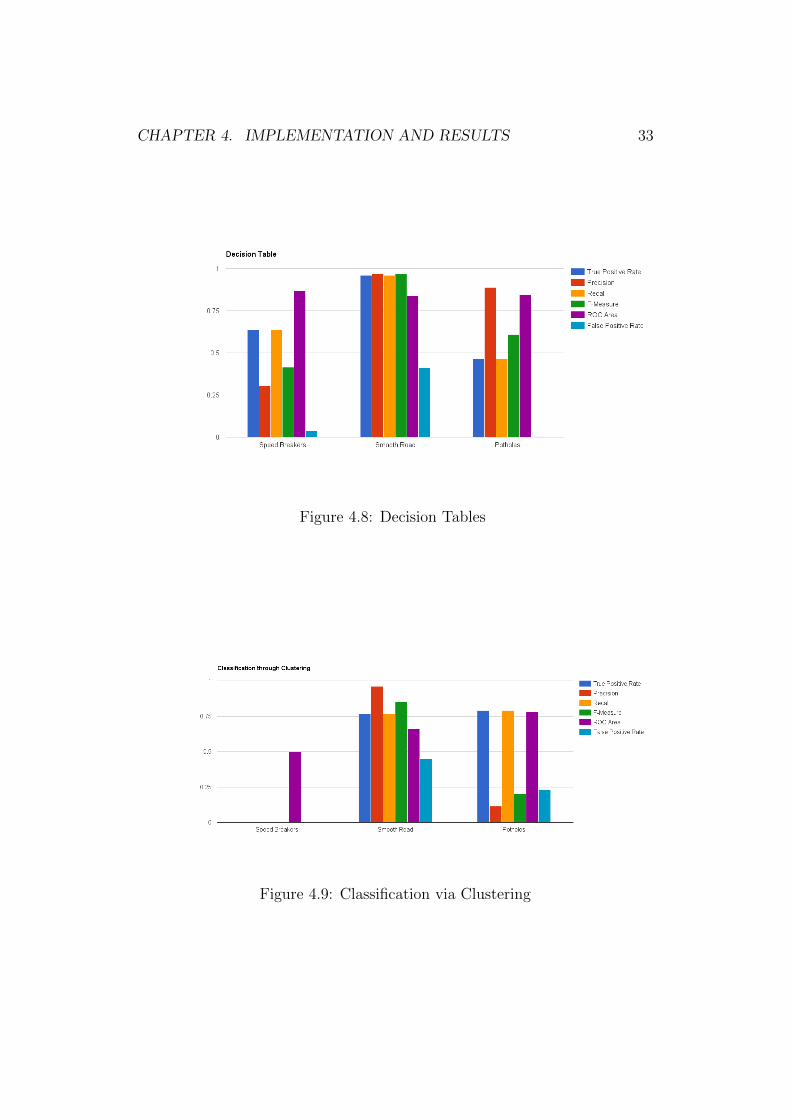
We trained five classifiers on the labelled data sets and performed cross-validation to test them. The performance of each classifier would help uschoose which classifier to deploy in the application. The results of theseclassifiers are shown in Figures 4.5-4.9
After looking at the results, we decided to use SMO as our classifierof choice as it gave the gave the best Precision (a measure of the quality ofresults) and F-measure, and the second best Recall and ROC Area. Althoughthere is a high false positive rate for “smooth road”, we believe that usingcrowd sensing would allow us to compensate for this error by processingaggregate data from multiple users.
Sequential minimal optimization (SMO) is an algorithm for solving thequadratic programming (QP) problem that arises during the training of sup-

CHAPTER 4. IMPLEMENTATION AND RESULTS 32
Figure 4.6: J48
Figure 4.7: SMO
CHAPTER 4. IMPLEMENTATION AND RESULTS 33
Figure 4.8: Decision Tables
Figure 4.9: Classification via Clustering
CHAPTER 4. IMPLEMENTATION AND RESULTS 34
port vector machines. SMO is widely used for training support vector ma-chines and is implemented by the popular LIBSVM tool. [13] In machinelearning, support vector machines are supervised learning models with asso-ciated learning algorithms that analyze data and recognize patterns, used forclassification and regression analysis. Given a set of training examples, eachmarked as belonging to one of two categories, an SVM training algorithmbuilds a model that assigns new examples into one category or the other,making it a non-probabilistic binary linear classifier. An SVM model is arepresentation of the examples as points in space, mapped so that the exam-ples of the separate categories are divided by a clear gap that is as wide aspossible. New examples are then mapped into that same space and predictedto belong to a category based on which side of the gap they fall on. [14]
4.1.6 Building the Final Apps, the Website and theBack-end
Once, the model was decided, all that remained was implementing the ap-plications. This was done through an iterative model. Functionalities wereadded incrementally to the application, thoroughly tested and then we wouldmove on to the next set of functionalities.
Building the website involved some work to implement the display oftraffic conditions in Pakistan, especially the section where the algorithm forassigning weights to each user was developed.
As we were working on the applications, we found that each platformsupported different functionalities. For example, no services were availableon windows phones and iOS to detect the activity of the user. Therefore, wehad to make do with whatever functionalities were available to us so that wecould achieve our main goal: building and running a classifier to detect roadconditions in Pakistan.
4.1.7 Testing and Deployment
Finally, once the system was complete and running, we tested the systemas a whole together by taking readings along roads in Islamabad. A fewbugs related to integration of the project came up but were quickly solved.Uploading the android app onto Google Play also gave us some trouble dueto warnings in some external jars namely weka.jar. However, this is a link tothe website that was created at the end [8]

CHAPTER 4. IMPLEMENTATION AND RESULTS 35
Figure 4.10: Home Page of the App

CHAPTER 4. IMPLEMENTATION AND RESULTS 36
Figure 4.11: Login Page of the App
CHAPTER 4. IMPLEMENTATION AND RESULTS 37
Figure 4.12: A Map from the App

CHAPTER 4. IMPLEMENTATION AND RESULTS 38
Figure 4.13: About Page from the App
Figure 4.14: Main Page from the Website
CHAPTER 4. IMPLEMENTATION AND RESULTS 39
Figure 4.15: About Page from the Website
Figure 4.16: Maps Page from the Website
CHAPTER 4. IMPLEMENTATION AND RESULTS 40
4.1.8 Implementation Details
4.1.8.1 Dividing the Map
In order to simplify the way the maps are viewed on the website, we dividedthe map into 1 meter square cells. Therefore, whenever a user would wantto view the map for potholes—speed breakers, the following things wouldhappen:
• The bounds (North east corner and the south west corner of the map)would be sent to the server.
• At the server, a query would be applied to retrieve all the data thatfits within these bounds from the table Voting Results.
• These are displayed in the form of a heat map on the website.
However, things get a little complicated when displaying data for conges-tion. Challenges include:
• Displaying each user just once on the map even though there are mul-tiple rows of data for each user.
• Each road segment can have a different free flow speed. Therefore, thedrivers weight must be displayed with respect to that particular freeflow speed.
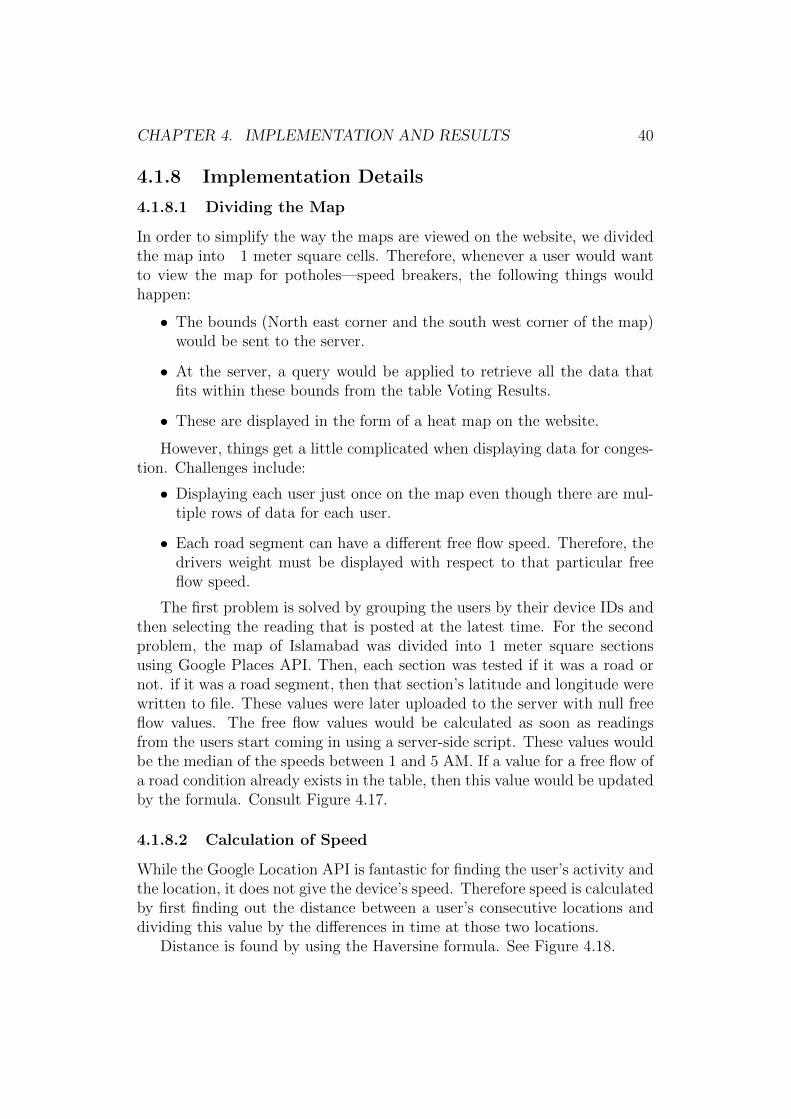
The first problem is solved by grouping the users by their device IDs andthen selecting the reading that is posted at the latest time. For the secondproblem, the map of Islamabad was divided into 1 meter square sectionsusing Google Places API. Then, each section was tested if it was a road ornot. if it was a road segment, then that section’s latitude and longitude werewritten to file. These values were later uploaded to the server with null freeflow values. The free flow values would be calculated as soon as readingsfrom the users start coming in using a server-side script. These values wouldbe the median of the speeds between 1 and 5 AM. If a value for a free flow ofa road condition already exists in the table, then this value would be updatedby the formula. Consult Figure 4.17.
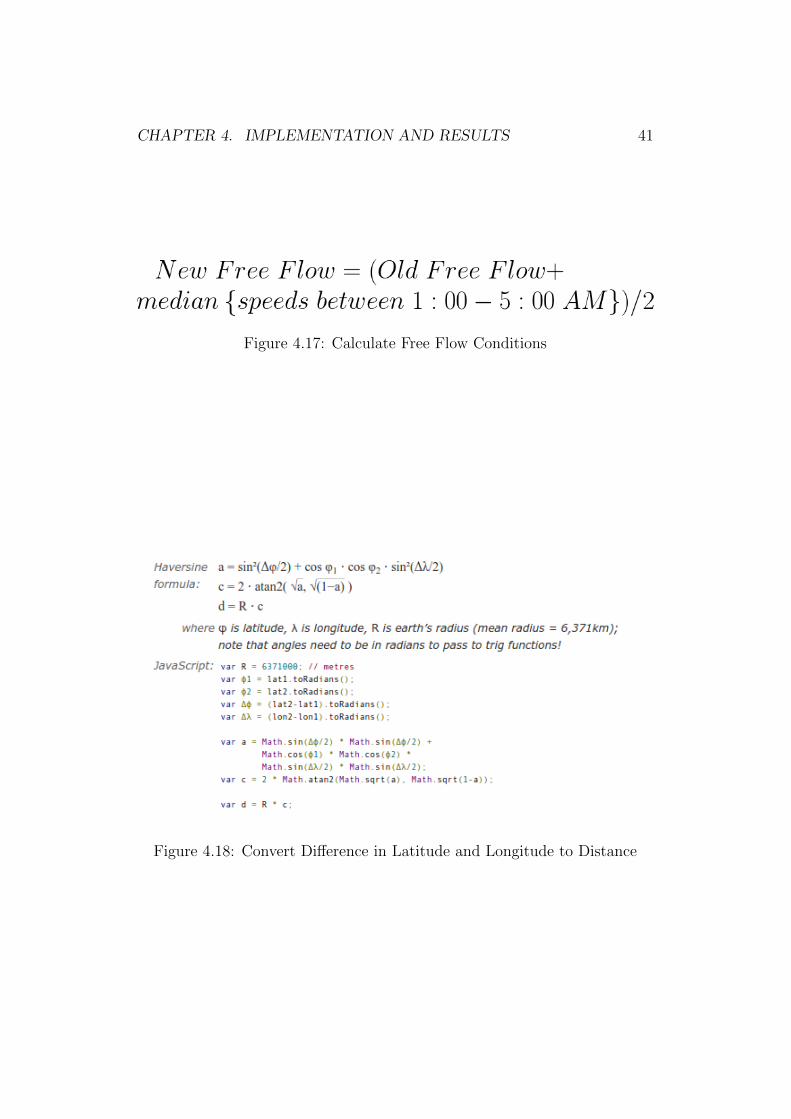
4.1.8.2 Calculation of Speed
While the Google Location API is fantastic for finding the user’s activity andthe location, it does not give the device’s speed. Therefore speed is calculatedby first finding out the distance between a user’s consecutive locations anddividing this value by the differences in time at those two locations.
Distance is found by using the Haversine formula. See Figure 4.18.
CHAPTER 4. IMPLEMENTATION AND RESULTS 41
Figure 4.17: Calculate Free Flow Conditions
Figure 4.18: Convert Difference in Latitude and Longitude to Distance

CHAPTER 4. IMPLEMENTATION AND RESULTS 42
Figure 4.19: Correct the Device’s Orientation
4.1.8.3 Fixing the 3D axis
One of our essential features include the fact that the device does not haveto remain still during data gathering. However, the readings of accelerationchange with rotation of the device as the axis for acceleration is fixed [2]
Therefore, we must get the accelerometer readings along the real-world3D axis. In order to do this, we employ readings from the rotation matrixthat is provided by android. Consult code snippet in Figure 4.19. [12]

Chapter 5
Conclusion and FutureDiscussion
5.1 Findings and Significance
Our finding show that we have an approximately 60% true positive rate foridentifying potholes and speed breakers and a 97% true positive rate foridentifying that a particular road segment has no anomaly. This is quitea significant contribution as the device is not held still and can be moved,rotated or used to play games.
Studies “Researchers at the Texas A&M Transportation Institute esti-mate that, unless spending increases, congestion and rough roads will costthe average Texas household $6,100 a year in wasted fuel, vehicle repairs, andtime lost sitting in traffic between now and 2035.” [15] However, there is stillsome room for improvement, as described in the section “Improvements”.
Traffic conditions have never been mapped before in Pakistan. AlthoughGoogle Maps does provide an overlay of traffic, there is no information avail-able for Pakistan. This feature of the application will allow users to chooseroutes with minimum traffic so that they can reduce the amount of fuel thatis wasted while sitting idly in traffic, and save their time.
The greater the number of people that use the application, the greateraccuracy that we will achieve. Once the application becomes commonlyused, our results will be sufficiently accurate to allow the government tomake decisions about allocating funds in proportion to how terrible the roadconditions are at a particular road segment or how badly congested the areagets and is in need of alternate routes. The public shall be able to use thisinformation to keep an eye on how well the government authorities are doingand if they are actually fulfilling their promises they make during elections.
43

CHAPTER 5. CONCLUSION AND FUTURE DISCUSSION 44
Since we are an objective third party, our results would be reliable and theconcern that they are conditions are shown much better than they actuallyare would easily be assuaged.
5.2 Commercialization
This project can be easily commercialized by keeping government agenciesand the general public in mind as target audiences. The government cansponsor the application as they need the information this application providesto properly plan and allocate funds for road maintenance in an efficaciousmanner. By adding ads to the application or charging a small amount ofmoney for installing the application, funds can be generated from the publicand these can be put into additional research for improving our classificationalgorithm.
Companies such as TCS whose drivers have to travel long distances alsomake for good target customers as they can make productive use of the trafficcongestion information to take the least congested route to their destination.This benefits the overall system; as they move over the road network, theautomatically map the road sections by simply keeping an installation of thesmart phone application in their mobile devices.
5.3 Limitations
The limitations of the project are tied to the improvements suggested in thenext section. Most significantly, the application treats all potholes and speedbreakers as one class each. This may limit the accuracy that we can achieveas for example, potholes vary in size and shape from tiny, round ones tolarge misshapen ones. Therefore, there are several types of potholes—speedbreakers in one class and this makes classification increasingly difficult.
Furthermore, our greatest current limitation is the fact that we have avery limited number of users. This application is crowd sensing; it needs tobe supported by a crowd to improve accuracy of information and increasecoverage of more and more locations in Pakistan.
5.4 Improvements
In the next phase of the project, classification can be done by dividing typesof road anomalies into several different categories to have much more discreteclasses. For example, some factors to keep in mind are:
CHAPTER 5. CONCLUSION AND FUTURE DISCUSSION 45
• Potholes and speed breakers are of different sizes and are likely to givedifferent results.
• Different roads can alter the pattern of potholes. For instance, a grav-elly road with a pothole will give different readings than a smooth roadwith a pothole.
• Different vehicles have different shock absorbers and this can affect theamplitude of the wave form produced.
• Phones have sensors of varying quality and this factor must also beaccounted for.
An option that must be explored involved mapping and measuring thegeneral road conditions of the roads e.g is the road smooth or gravelly or isit unpaved? Answering this question would complete the overall picture thatdescribes road conditions in Pakistan.

Bibliography
[1] Waze. www.waze.com.
[2] Tegra android accelerometer whitepaper, 2010.http://developer.download.nvidia.com/tegra/docs/tegra android accelerometer v5f.pdf.
[3] Connected Bits, 2014. www.streetbump.org/.
[4] Jakob Eriksson, Lewis Girod, Bret Hull, Ryan Newton, Samuel Madden,and Hari Balakrishnan. The pothole patrol: using a mobile sensor net-work for road surface monitoring. In Proceedings of the 6th internationalconference on Mobile systems, applications, and services, pages 29–39.ACM, 2008.
[5] Fix It Find It, 2015. http://www.seattle.gov/customerservice-bureau/find-it-fix-it-mobile-app.
[6] Fill That Hole, 2015. http://www.fillthathole.org.uk/iphone.
[7] Pothole Hunters, 2015. https://play.google.com/store/apps/details?id=cz.vymoly.androidhl=en.
[8] Faria Kalim. Crater, 2015. http://craters.azurewebsites.net.
[9] Aniket Kulkarni, Nitish Mhalgi, Dr Sagar Gurnani, and Nupur Giri.Pothole detection system using machine learning on android.
[10] Artis Mednis, Girts Strazdins, Reinholds Zviedris, Georgijs Kanonirs,and Leo Selavo. Real time pothole detection using android smartphoneswith accelerometers. In Distributed Computing in Sensor Systems andWorkshops (DCOSS), 2011 International Conference on, pages 1–6.IEEE, 2011.
46

BIBLIOGRAPHY 47
[11] Prashanth Mohan, Venkata N Padmanabhan, and Ramachandran Ram-jee. Nericell: rich monitoring of road and traffic conditions using mobilesmartphones. In Proceedings of the 6th ACM conference on Embeddednetwork sensor systems, pages 323–336. ACM, 2008.
[12] Stackoverflow. Calculate acceleration in reference to true north, 2013.http://stackoverflow.com/questions/14963190/calculate-acceleration-in-reference-to-true-north/14988559.
[13] Wikipedia. Sequential minimal optimization — wikipedia, the free en-cyclopedia, 2014. [Online; accessed 15-May-2015].
[14] Wikipedia. Support vector machine — wikipedia, the free encyclopedia,2015. [Online; accessed 15-May-2015].
[15] Zhanmin Zhang, Michael Murphy, Robert Harrison, Jose Weissmann,Tim Lomax, David Schrank, Seokho Chi, Randy Machemehl, Khali Per-sad, David Ellis, et al. Its about time: investing in transportation tokeep texas economically competitive: Appendices. 2011.