Embed Size (px)
Citation preview
1
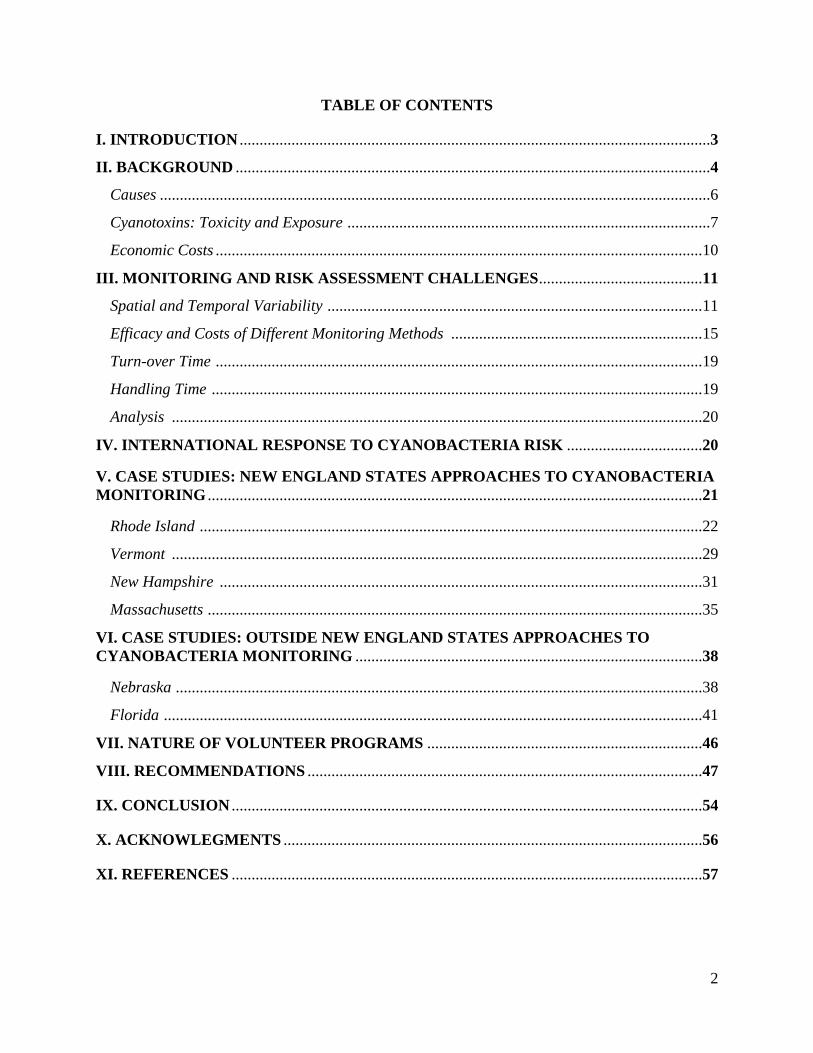
CREATING A CYANOBACTERIA MONITORING PLAN FOR THE STATE OF
RHODE ISLAND
By
CINDY CHU
A MAJOR PAPER SUBMITTED IN PARTIAL FULLFILLMENT OF THE REQUIREMENTS FOR
THE DEGREE OF MASTER OF ENVIRONMENTAL SCIENCE AND MANAGEMENT
UNIVERSITY OF RHODE ISLAND
December 13, 2011
MAJOR PAPER ADVISOR: Dr. Art Gold
MESM TRACK: Wetland, Watershed, and Ecosystem Science
2
TABLE OF CONTENTS
I. INTRODUCTION ......................................................................................................................3
II. BACKGROUND .......................................................................................................................4
Causes ..........................................................................................................................................6
Cyanotoxins: Toxicity and Exposure ...........................................................................................7
Economic Costs ..........................................................................................................................10
III. MONITORING AND RISK ASSESSMENT CHALLENGES .........................................11
Spatial and Temporal Variability ..............................................................................................11
Efficacy and Costs of Different Monitoring Methods ...............................................................15
Turn-over Time ..........................................................................................................................19
Handling Time ...........................................................................................................................19
Analysis .....................................................................................................................................20
IV. INTERNATIONAL RESPONSE TO CYANOBACTERIA RISK ..................................20
V. CASE STUDIES: NEW ENGLAND STATES APPROACHES TO CYANOBACTERIA
MONITORING ............................................................................................................................21
Rhode Island ..............................................................................................................................22
Vermont .....................................................................................................................................29
New Hampshire .........................................................................................................................31
Massachusetts ............................................................................................................................35
VI. CASE STUDIES: OUTSIDE NEW ENGLAND STATES APPROACHES TO
CYANOBACTERIA MONITORING .......................................................................................38
Nebraska ....................................................................................................................................38
Florida .......................................................................................................................................41
VII. NATURE OF VOLUNTEER PROGRAMS .....................................................................46
VIII. RECOMMENDATIONS ...................................................................................................47
IX. CONCLUSION ......................................................................................................................54
X. ACKNOWLEGMENTS .........................................................................................................56
XI. REFERENCES ......................................................................................................................57
3
I. INTRODUCTION
Cyanobacteria (blue-green algae) blooms on freshwater lakes and ponds can have
negative effects on the environment and on public health. Cyanobacteria blooms create
unsightly, highly turbid waters, often with floating scum layers that deter recreational use and
foul shorelines. Some cyanobacteria produce toxins that can have detrimental health effects on
both humans and animals; for example, humans can be exposed to cyanobacteria blooms as a
result of recreational activities from contaminated lakes while livestock and wildlife can be
exposed when they encounter blooms at their source of drinking water or cooling waters. The
problem has been tracked since the 1930s and has been an increasing problem globally (Hitzfeld
et al., 2000). In the United States, states are responding to the problem by monitoring these
blooms; however, monitoring presents many challenges and these challenges are difficult to
overcome. While some states have developed a rather comprehensive cyanobacteria monitoring
plan, some states are lacking one. As of 2011 Rhode Island had not yet established a
cyanobacteria monitoring plan. However, state personnel conduct some monitoring, often
initiated through accidental observations or reported by involved members of the public.
In this major paper, I have generated a number of recommendations for developing a
cyanobacteria monitoring plan for the state of Rhode Island based on analysis on monitoring
programs that currently exist. Monitoring cyanobacteria is important because it can promote
pollution abatement efforts and protect the public health of local communities. Monitoring will
help to better understand trends and patterns of cyanobacteria’s role in the environment so
management practices can be implemented to improve the problem. Ultimately, developing a
cyanobacteria monitoring plan for Rhode Island holds many beneficial value for the ecosystem
and local communities.
4
For my recommendations, I analyzed and adapted elements of approaches used by New
England states’ and several other states outside of New England. For each state, I examined their
background, protocols, results from the monitoring, and challenges that they faced. Then, I
examined the general concerns and challenges that are associated with monitoring cyanobacteria.
I also examined the value of volunteer monitors through the scientist-led volunteer monitoring
program of The University of Rhode Island Watershed Watch (URI WW). The development of
my proposed plan was also informed by the World Health Organization’s (WHO) Toxic
Cyanobacteria in Water: A Guide to their Public Health Consequences, Monitoring, and
Management. The WHO looked at the need to control cyanobacteria in order to protect public
health. The guide established a list of standards that have been utilized globally as a foundation
for their cyanobacteria monitoring plan. Based on these hosts of factors, I formulated an outline
of a model for a cyanobacteria monitoring plan that Rhode Island could follow.
This major paper is intended as a resource for an array of audiences: local communities
of Rhode Island, URI WW, Rhode Island Department of Environmental Management (RI DEM),
and Rhode Island Department of Health (RI HEALTH). Local communities of Rhode Island can
benefit from this because their residents are the ones at potential risk from cyanobacteria
exposure. The paper informs the public about potential risks, causes, and what actions can be
taken. The intentions of this paper were to propose a plan as a resource that stresses what is
important in a cyanobacteria monitoring plan. However, the paper could provide URI WW, RI
DEM, and RI HEALTH a proposed plan that they can refer to if the opportunity presents itself.
II. BACKGROUND
Cyanobacteria are nitrogen-fixing blue-green algae that occur in freshwater, brackish, and
marine waters under favorable conditions of warm, high nutrients, calm-moving waters (Codd et
5
al., 2004). Low levels of cyanobacteria cells are often present in many mesotrophic and
eutrophic waters. But in response to the right combination of environmental factors,
cyanobacteria experience explosive population growth and form colonies -- called algal blooms –
over a period of days. These blooms quickly turn water from clear to cloudy, often occur in late
summer to early-fall, and are characterized by a sudden increase of large number of cells
(Krogmann et al., 1986). Factors that enhance blooms are low turbulence, stagnant water
conditions, high pH values, and high temperatures (Blaha et al., 2002). Blooms can form a dense
mass that prevents incoming sunlight and depletes oxygen from water body. Blooms that pose
major threat to the environment and public health are known as “harmful algal blooms” or HABs
(Backer et al., 2006). HABs are capable of producing toxins that can cause sickness in humans
and animals.
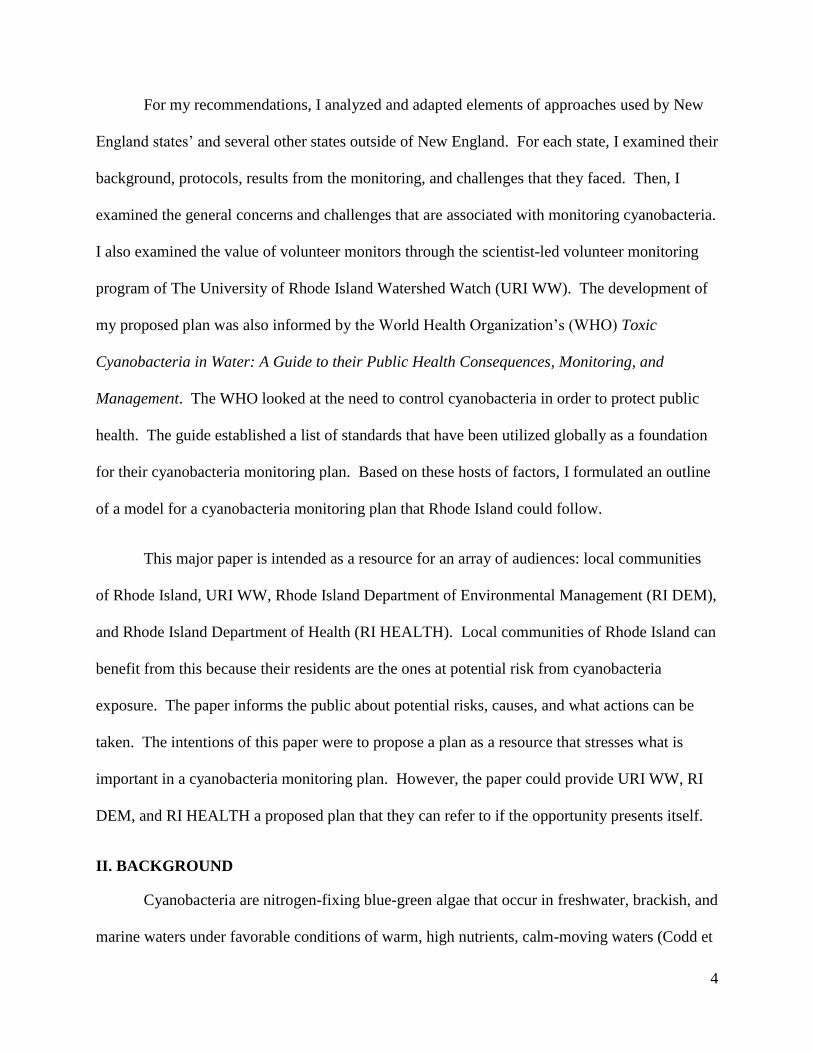
Within freshwater lakes and ponds,
algae typically occur in a succession following
a yearly pattern cycle (Axler, 2004). Figure 1
shows presence of diatoms during the cold,
winter season. However, as seasons change
and the supplies of different nutrients are
depleted, the diatoms give way to green algae
that are favorable to warmer temperatures.
Then as temperatures become exceedingly warmer and nutrient levels higher during summer
season, the green-algae give way to the blue-green algae. When temperatures and nutrient levels
drop during the winter season, diatoms begin to succeed and the yearly cycle repeats itself. In
Figure 1. The seasonal succession of phytoplankton (Axler,
2004).
6
nutrient-rich waters with high concentrations of available phosphorus, the succession of algae is
often accelerated and nitrogen-fixing cyanobacteria can dominate the phytoplankton.
Causes
Nitrogen (N) and phosphorus (P) are the two dominant nutrients that lead to algal blooms.
In the United States, nutrient excess is recognized as a problem in both coastal areas and
estuaries (Howarth et al., 2002). An excess of these nutrients could lead to nutrient pollution
and eutrophication, an increase in primary productivity leading to accumulations of organic
carbon within the system, which impairs water surfaces (Howarth et al., 2002; Carpenter et al.,
1998). Eutrophication is the most common impairment to water surfaces in the United States
(Carpenter et al., 1998). P is the primary nutrient that causes eutrophication in lakes while N is
the primary nutrient that causes eutrophication in temperate estuaries and coastal ecosystem
(Carpenter et al., 1998). Furthermore, eutrophication can impact water quality: excessive
macrophyte growth, loss of clarity, low dissolved oxygen levels, production of organic matter,
formation of toxic gases, degradation of drinking water, and formation of carcinogens (Axler,
2004).
Sources of nutrients come from sewage and animals wastes, atmospheric deposition,
groundwater inflow, and agricultural and fertilizer runoff (Anderson et al., 2002). As of result
of huge investments in municipal wastewater treatment, non-source pollution often generates
higher nutrient loading than point source pollution. In some locales, point source pollution still
has a bigger impact on small watersheds or in major cities (Anderson et al., 2002). For example,
67% of N inputs into Long Island Sound derive from wastewater and 40-80% of N inputs into
Kaneohe Bay, Hawaii, and Narragansett Bay, Rhode Island derive from sewage treatment plant
7
(Anderson et al., 2002). Non-point source pollution is commonly generated by urban and
agricultural activities through inorganic fertilizers application and fossil fuels combustion
(Howarth et al., 2002; Carpenter et al., 1998). P inputs result from eroded materials and
wastewater running from land into the water, causing an increase of 14 Tg per year globally due
to these anthropogenic activities. (Howarth et al., 2002). In addition, N inputs result from
synthetic inorganic fertilizer and human activities mobilize N through fossil fuel combustion
and production of N fertilizers (Howarth et al., 2002). Human alteration to the nutrient cycle is
not uniform globally and the greatest N and P inputs come from parts of the world where human
population and intensive farming are the greatest (Howarth et al., 2002).
Cyanotoxins: Toxicity and Exposure
Some species of cyanobacteria produce toxins termed “cyanotoxins” and some
cyanobacteria can produce more than one cyanotoxins (Ouellette & Wilhelm, 2003). These
toxins are considered secondary metabolites and are typically more diverse than the organisms
that produce them (Ouellette & Wilhelm, 2003). The species commonly associated with toxins
are Microcystis aeruginosa, Planktothrix (=Oscillatoria) rubescens, Aphanizomenon flos-aquae,
Anabaena flos-aquae, Planktothrix agardhii, and Lyngbia spp. (Hitzfeld et al., 2000).
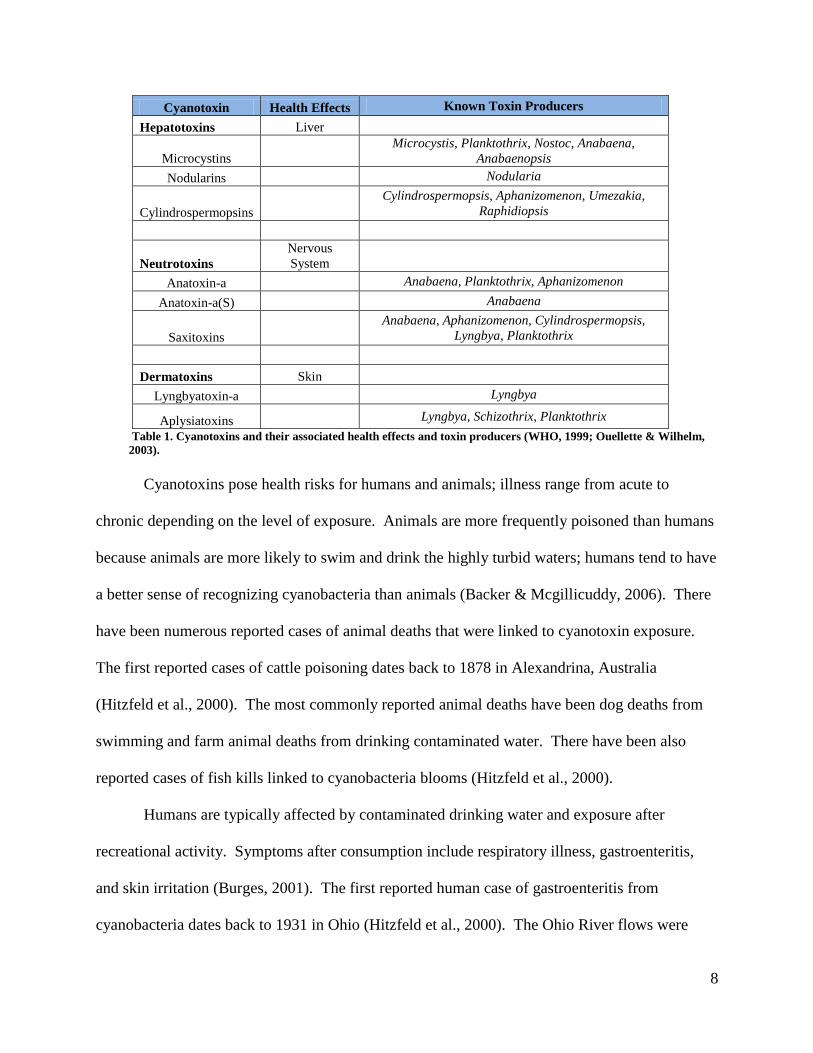
Cyanotoxins are classified according how they affect human health (Table 1). Heptatoxins affect
the liver, neurotoxins affect the nervous system, and dermatoxins affect the skin (Hitzfeld et al.,
2000).
8
Cyanotoxin Health Effects Known Toxin Producers
Hepatotoxins Liver
Microcystins
Microcystis, Planktothrix, Nostoc, Anabaena,
Anabaenopsis
Nodularins Nodularia
Cylindrospermopsins
Cylindrospermopsis, Aphanizomenon, Umezakia,
Raphidiopsis
Neutrotoxins
Nervous
System
Anatoxin-a Anabaena, Planktothrix, Aphanizomenon
Anatoxin-a(S) Anabaena
Saxitoxins
Anabaena, Aphanizomenon, Cylindrospermopsis,
Lyngbya, Planktothrix
Dermatoxins Skin
Lyngbyatoxin-a Lyngbya
Aplysiatoxins Lyngbya, Schizothrix, Planktothrix
Table 1. Cyanotoxins and their associated health effects and toxin producers (WHO, 1999; Ouellette & Wilhelm,
2003).
Cyanotoxins pose health risks for humans and animals; illness range from acute to
chronic depending on the level of exposure. Animals are more frequently poisoned than humans
because animals are more likely to swim and drink the highly turbid waters; humans tend to have
a better sense of recognizing cyanobacteria than animals (Backer & Mcgillicuddy, 2006). There
have been numerous reported cases of animal deaths that were linked to cyanotoxin exposure.
The first reported cases of cattle poisoning dates back to 1878 in Alexandrina, Australia
(Hitzfeld et al., 2000). The most commonly reported animal deaths have been dog deaths from
swimming and farm animal deaths from drinking contaminated water. There have been also
reported cases of fish kills linked to cyanobacteria blooms (Hitzfeld et al., 2000).
Humans are typically affected by contaminated drinking water and exposure after
recreational activity. Symptoms after consumption include respiratory illness, gastroenteritis,
and skin irritation (Burges, 2001). The first reported human case of gastroenteritis from
cyanobacteria dates back to 1931 in Ohio (Hitzfeld et al., 2000). The Ohio River flows were
9
very low due to a lack of rainfall and this led to a development of large algal bloom which
contaminated the drinking water source within the area. The water treatment failed to treat the
taste, odor and toxin content of the drinking water, thus, leading to exposure and illness (Hitzfeld
et al., 2000).
Conventional drinking water treatment systems may not be designed to treat cyanotoxins.
Cyanotoxins are developed within the cell, thus, water treatment has to include a step process
that destroys or avoids the cells (Hitzfeld et al., 2000). Another challenge with treating
cyanobacteria is that cyanotoxins are water soluble, so the remediation process has to chemically
reduce toxins or remove the toxins from drinking water (Hitzfeld et al., 2000). The effectiveness
of water treatment involves a series of process because each method alone is not sufficient. An
effective strategy involves the process of coagulation and filtration to remove cyanobacteria cells
and then the process of adsorption and/or post-filtration oxidation to destroy toxins (NHDES,
2009a). The following steps will maximize cyanobacteria cell and toxin removal (NHDES,
2009a):
1. Prevent rupture of the cell before the removal process by minimizing pre-
oxidation.
2. Increase the amount of backwashing time. This will minimize the cell’s contact
time with water.
3. “Optimize ozone and chlorine doses” after filtration.
4. Include powdered activated carbon (PAC) if oxidation does not reduce toxin
concentration.
Toxins can accumulate in shellfish and pose a health risk to those who consume it.
Paralytic shellfish poison (PSP) is a form of illness caused by freshwater cyanobacteria. PSP is
commonly known to cause human and animal sickness from marine waters and less is known
10
about PSP from freshwater cyanobacteria (Humpage et al., 2007). The first case of PSP
freshwater cyanobacteria occurred in the 1980s in North America from an Aphanizomenon sp.
bloom. Later in 1991, Australia experienced an Anabaena bloom along Darling River that
caused stock deaths (Humpage et al., 2007). Seven cyanobacterial species have been identified
to cause PSP all around the world: Cylindrospermopsis raciborskii —Brazil, Aphanizomenon
gracile and Aphanizomenon issatschenkoi—United States and Portugal, Planktothrix sp.—Italy,
Anabaena circinalis—Italy, Lyngbia wollei—United States, and Anabaena lemmermannii—
Denmark (Humpage et al., 2007; Dias et al. 2002). Since PSP toxins are highly potent,
symptoms include “respiratory arrest within 24 hours of consumption (Holm & Hernroth, 2005).”
Economic Costs
Recreational lakes and rivers can serve as a tourist attraction and can generate revenue
from visitors. Recreational lakes can provide swimming, boating, fishing, and water skiing
visitor’s enjoyments; however, cyanobacteria blooms can affect the economic value of these
lakes (Hudnell, 2008). Hudnell (2008) outlines three different cases illustrating economic losses
due to cyanobacteria blooms found in lakes and rivers.
1. Darling River: In 1991, Anabaena was detected along the coast of Darling River in
Australia. The area is characterized by agricultural lands and is a popular tourist
attraction for its recreational activities (i.e. fishing, swimming, camping, sight-seeing, and
hunting). The reported massive bloom affected the tourist industry with losses of
approximately $1.5 million.
2. Nepean/Hawkesbury River: During summer season in 1991 and 1992, a series of
blooms were detected along Nepean River in Sydney, Australia. The river is known for
11
its recreational activities that include swimming, fishing, water skiing, canoeing, camping,
and picnicking. The estimated revenue loss after the cyanobacteria bloom was $6.7
million. It was later discovered that no toxins were found but the river still received
negative publicity.
3. New South Wales: In 1991, there were nine storages that became affected by
cyanobacteria blooms. These storages provide recreational activities and estimated
economic loss was $1.2 million.
III. MONITORING AND RISK ASSESSMENT CHALLENGES
Given the rapidity with which cyanobacteria can occur, sampling strategies and timely
responses are important elements for any program that seeks to reduce the public health risk of
cyanotoxins. However, cyanobacteria monitoring can be challenging to implement since a host
of factors can affect outcomes in the effectiveness of monitoring system. Some challenges
include spatial and temporal variability, cost of sampling, turn-over between time of sampling
and receiving results, handling time, and analysis.
Spatial and Temporal Variability
Spatial and temporal variability need to be addressed in any sampling and assessment
scheme. Pobel et al. (2010) examined how spatial (horizontal distribution) and temporal aspects
of sampling strategy can influence sampling results. Their study site was located in a shallow
lake (0.08 km2, 2.5 m max depth) in the plain of Forez in France. This lake generates high levels
of fish production. Its trophic status is classified as euotrophic to hypereutrophic with blooms of
Microcystis aeruginosa every summer. Six sampling stations were monitored; each station was
12
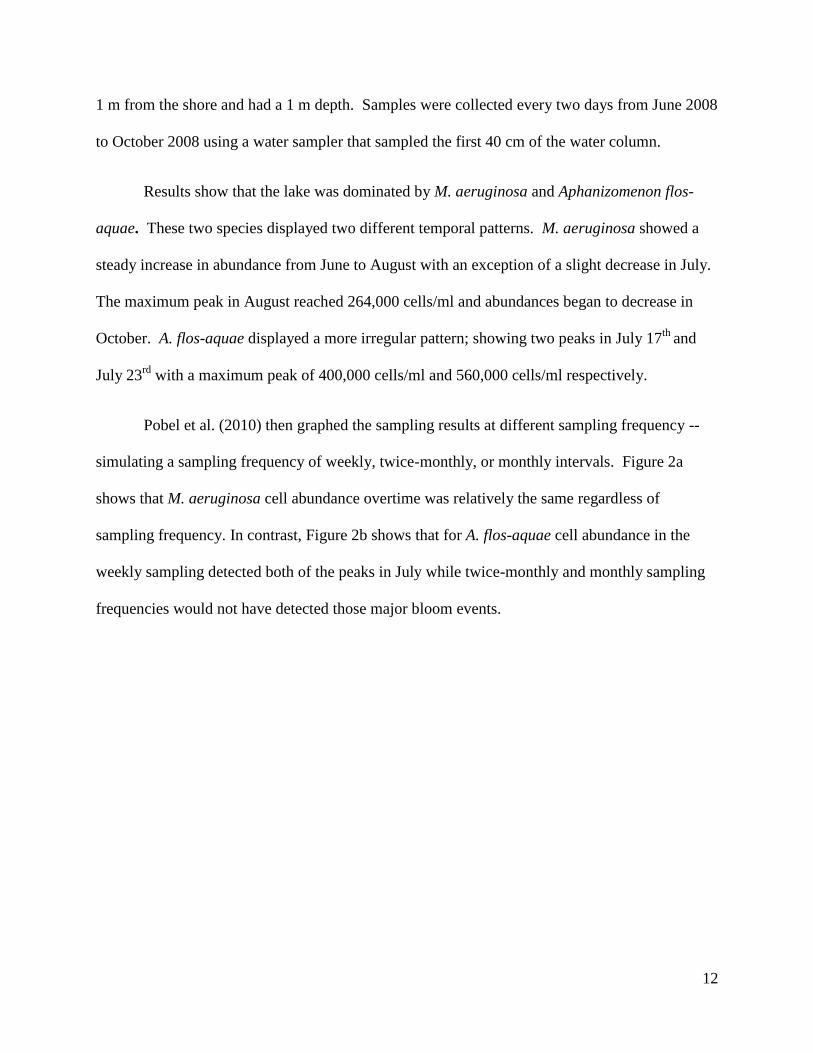
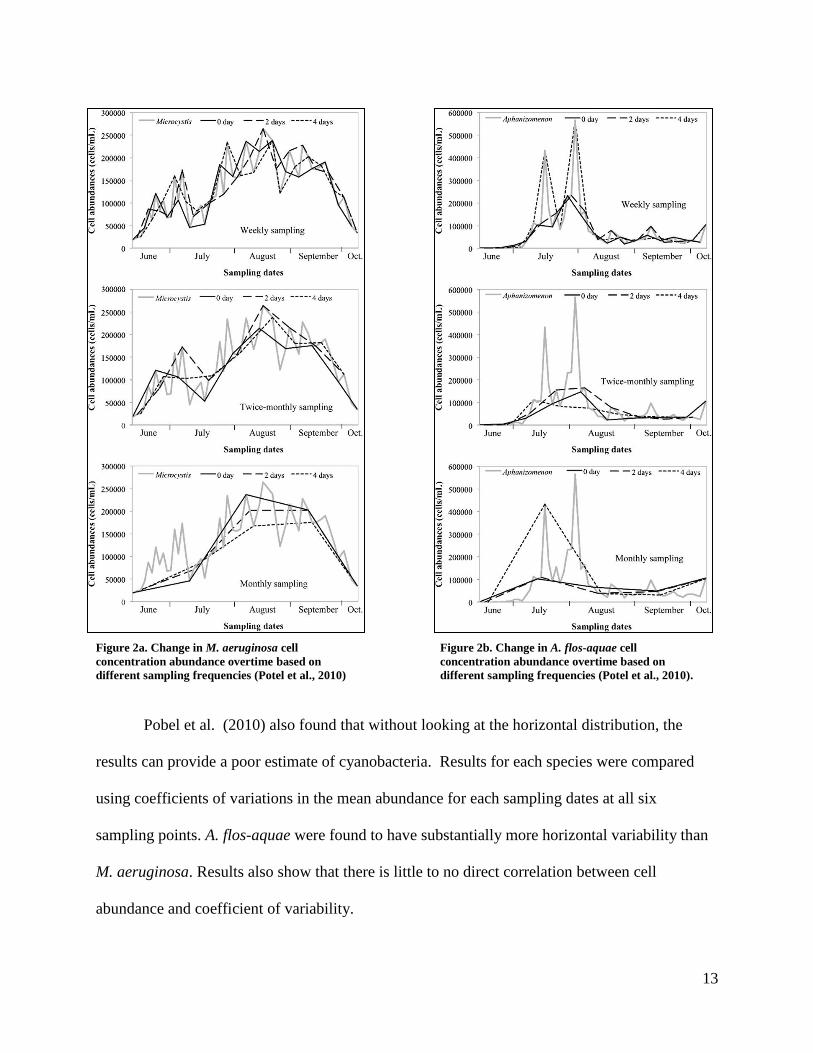
1 m from the shore and had a 1 m depth. Samples were collected every two days from June 2008
to October 2008 using a water sampler that sampled the first 40 cm of the water column.
Results show that the lake was dominated by M. aeruginosa and Aphanizomenon flos-
aquae. These two species displayed two different temporal patterns. M. aeruginosa showed a
steady increase in abundance from June to August with an exception of a slight decrease in July.
The maximum peak in August reached 264,000 cells/ml and abundances began to decrease in
October. A. flos-aquae displayed a more irregular pattern; showing two peaks in July 17th
and
July 23rd
with a maximum peak of 400,000 cells/ml and 560,000 cells/ml respectively.
Pobel et al. (2010) then graphed the sampling results at different sampling frequency --
simulating a sampling frequency of weekly, twice-monthly, or monthly intervals. Figure 2a
shows that M. aeruginosa cell abundance overtime was relatively the same regardless of
sampling frequency. In contrast, Figure 2b shows that for A. flos-aquae cell abundance in the
weekly sampling detected both of the peaks in July while twice-monthly and monthly sampling
frequencies would not have detected those major bloom events.
13
Figure 2a. Change in M. aeruginosa cell Figure 2b. Change in A. flos-aquae cell
concentration abundance overtime based on concentration abundance overtime based on
different sampling frequencies (Potel et al., 2010) different sampling frequencies (Potel et al., 2010).
Pobel et al. (2010) also found that without looking at the horizontal distribution, the
results can provide a poor estimate of cyanobacteria. Results for each species were compared
using coefficients of variations in the mean abundance for each sampling dates at all six
sampling points. A. flos-aquae were found to have substantially more horizontal variability than
M. aeruginosa. Results also show that there is little to no direct correlation between cell
abundance and coefficient of variability.
14
In addition, they measured diel variations in the subsurface at 5 sampling location using a
BBE Algaetorch that provides concentration cyanobacteria and total chlorophyll readings. The
torch provided readings at 20 cm depth every hour and readings were taken three times at each
point. Results show that there was a decrease in cyanobacterial biomass in the evening and
afternoon and an increase at night and in the morning at the five sampling locations.
Pobel et al. (2010) also examined the effects of the number of sample points for
determining a good estimation of cyanobacterial cell abundance. They compared estimations of
cell abundances for the entire set of sampling dates based on one, two, three, four or five
sampling points to that of all six sampling points. Results show that estimation of cell
abundance based on one to two sampling points had poor correlations but above three sampling
points correlations were very good and results comparable to results obtained with 6 sampling
sites.
Because most cyanobacteria are buoyant, they float at or near the surface. Thus, wind
and water currents can concentrate blooms, creating uneven and patchy distribution of
cyanobacteria (Haney, 2010). Surface accumulation can easily change by wind movement; a
lake with no visible presence of cyanobacteria scums in the morning may have notable presence
of cyanobacteria by the afternoon (Graham et al., 2009).
Pobel et al. (2010) did not analyze vertical distribution, but vertical distribution affects
the spatial and temporal distribution of a bloom within a water column. Some cyanobacteria cells
contain gas vesicles which makes them buoyant in water (WHO, 1999). Although the cells
containing gas vesicles are buoyant, cells store also heavy carbohydrate in their cells during
photosynthesis. Thus, the larger the cyanobacteria colonies (d2), the more susceptible they are to
15
sinking (WHO, 1999). Cyanobacteria alter the extent of gas vesicles under different
environmental factors (e.g., photic, gravitational, chemical, thermal) to optimize their function
for growth and survival. Light affects the presence of gas vesicles—as light is reduced, the
abundance of gas vesicles increases (WHO, 1999).
The study conducted by Pobel et al. (2010) showed that strategic sampling is important in
obtaining effective results. All the factors that they tested—sampling frequency, time of day,
vertical and horizontal distribution, and number of sampling points can each mask the conditions
of the lake. The effects seem to vary with species, but there are strong lessons for any sampling
regime that is intended to be implemented to assess and manage the risks of cyanobacteria
blooms.
Efficacy and Costs of Different Monitoring Methods
Some approaches to monitoring cyanobacteria can be relatively expensive with costs
incurred for both intensive monitoring by professional staff and for detailed lab analyses. Ideal
methods include the following features that are deemed valuable for long term monitoring:
immediate response, low maintenance costs, specificity, sensitivity, ease of handling, and rapid
interpretation (Leboulanger et al., 2002). Below describes several methods that can be employed
for monitoring cyanobacteria.
Devices can identify between the different phytoplankton groups based on the relative
fluoresce intensity of chlorophyll a and light excitation by 5 light-emitting diodes (Leboulanger
et al, 2002). An example of this is the spectrofluorometric probe that is used to determine
vertical distribution within the water column (Pobel et al. 2010; Leboulanger et al, 2002). A
16
company called Ocean Optics developed a miniature spectrometer priced at approximately
$3,500 (Ocean Optics, 2011).
Remote sensing methods use algorithms to obtain chlorophyll a concentrations. Because
chlorophyll a is found in almost all phytoplankton, the tool cannot determine the abundance of
cyanobacteria if eukaryotic algal coexist with chlorophyll a (Hunter et al., 2009). However,
remote sensing can detect chlorophyll a, C-phycocyanin (C-PC), a pigment that is found in high
concentrations of freshwater cyanobacteria and is distinctive from the chlorophyll a in
eurkayrotic algae (Hunter et al., 2009).
Direct water sampling is frequently used to generate estimates of chlorophyll a to provide
insight into lake tropic status. Chlorophyll a is a green pigment that is required for
photosynthesis to occur (Addy & Green, 1996). In addition, this parameter is used to determine
algal biomass. High concentrations of chlorophyll a do occur from cyanobacteria blooms, but
this method does not distinguish the different chlorophyll pigments and is not capable of
separating cyanobacteria blooms from other types of algal blooms. It is useful in to indicate the
trophic status of a water body (Addy & Green, 1996). The collected water sample goes through
a glass fiber filter disk which collects the algal cells. The filter is then stored under cold and dark
conditions to prevent cell degradation or growth (Addy & Green, 1996). Next, chlorophyll a is
removed using acetone and concentration is measured using a fluorometer or a
spectrophotometer. The method is relatively easy and can be done with limited prior experience
(Addy & Green, 1996). However, this method has several disadvantages. Algae are not equally
distributed throughout the water body so samplers have to take multiple samples in one sampling
event. Another disadvantage is that some algae species have higher chlorophyll a concentrations
than others. In addition, chlorophyll a concentration changes throughout the day to “maximize
17
efficiency of photosynthesis (Addy & Green, 1996).” Taking several measurements at varying
depths and locations throughout the water body will alleviate these disadvantages.
In addition to chlorophyll a measures, water samples can also be collected, stored in a
preservative and analyzed with a microscope for algal abundance and species composition. This
approach can verify the presence and extent of different cyanobacteria. According to the Oregon
Health Authority (2011), the cost for species identification and cell counts costs approximately
$150. Also, depending of the methods and equipment used, costs can range from $150 to $350
(Oregon Health Authority, 2011).
Although chlorophyll a and cell counts are useful in determining the trophic status of a
water body, they do not specifically explain the amount of toxins produced by cyanobacteria.
Rogalus & Watzin (2008) conducted a study on Lake Champlain over two field seasons in 2003
and 2004. They compared chlorophyll a concentration to cyanobacteria density and microcystin
concentration. They tested chlorophyll a as a screening tool as suggested by WHO and sought to
determine if chlorophyll a is useful for predicting cynobacteria density and toxin concentration.
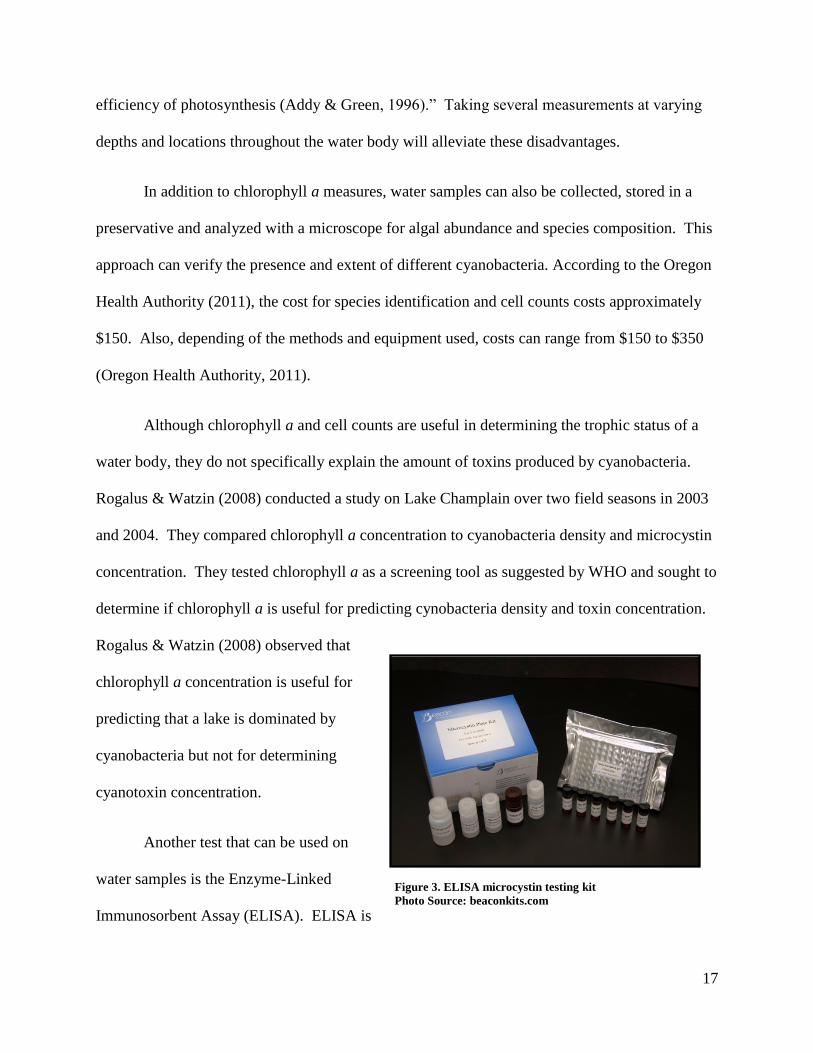
Rogalus & Watzin (2008) observed that
chlorophyll a concentration is useful for
predicting that a lake is dominated by
cyanobacteria but not for determining
cyanotoxin concentration.
Another test that can be used on
water samples is the Enzyme-Linked
Immunosorbent Assay (ELISA). ELISA is
Figure 3. ELISA microcystin testing kit
Photo Source: beaconkits.com
18
an inexpensive way of measuring cyanotoxin concentrations (Figure 3). ELISA is a laboratory
test kit carrying many advantages: low cost, fast turn-around time, and “semi-quantiative analytic
method” that measures the concentration of the most commonly found cyanobacteria toxins--
microcystins (Oregon Health Authority, 2011; Graham et al., 2009; Brakhage, 2009). However,
it only measures microcystin concentrations (Oregon Health Authority, 2011; Graham et al.,
2009; Brakhage, 2009). More recently, Abraxis, a company that develops products that measure
cyanotoxins, have developed ELISA that measures saxitoxins and cylindrospermopsins. These
kits typically range from $25 to $340 (Abraxis, 2011).
Another relatively inexpensive method relies on protein phosphatase inhibition (PPi).
This method “is not specific for microcystin, as phosphatase enzyme can be inhibited by other
compounds that occur in environmental samples (Hawkins et al., 2005).” Each sample is tested
twice and results are taken from the average mean of the two samples. Each test costs
approximately $15 and each run takes 30 minutes for 12 samples (Hawkins et al., 2005).
Hawkins et al. (2005) conducted a study comparing results using ELISA and PPi to measure
microcystin concentrations and found that the ELISA was more successful in specifying
microcystins.
Molecular approaches are also another method used to detect cyanotoxins. DNA-based
detection methods are beneficial primarily because they can distinguish between non-toxic and
toxic cyanobacteria (Ouellette & Wilhelm, 2003). Other advantages include the ease of use,
speed of results, but price can be quite high. Generally, these methods involve using polymerase
chain reaction (PCR) techniques to amplify the genes. In PCR, primers are used to initiate DNA
replication by a thermostable DNA polymerase. The process will yield “amplification of the
genetic fragment of interest (Ouellette & Wilhelm, 2003).” Then gel electrophoresis and staining
19
is used to further analyze these genetic fragments (Ouellette & Wilhelm, 2003). Although
genetically applied techniques have advanced recently, the use for monitoring is novel. PCR
methods require an understanding of molecular biology and knowledge for the “respective
biosynthetic genes (Kurmayer & Christiansen, 2009).” Therefore, molecular techniques are more
complex than the methods described above. Depending on the provider, prices for standard PCR
can range anywhere from $25,000 to $50,000 (EnviroLogix, 2011).
Turn-over time
Turn-over time, the time required to obtain lab results for cyanotoxins, can be several
days to several weeks and poses challenge to timely assessment of cyanobacteria risks. This can
frustrate agencies and organizations who want to know if the water body has cyanotoxins when
water bodies do not have visible scums. This can pose a delay in notifying the public of the
potential health risks involved with coming in contact with a possible contaminated water body.
Even if cyanobacteria results come back negative, those results may not reflect current day
conditions which could be positive.
Handling Time
Handling time is the time between when the samples are collected and when the samples
are sent to the laboratory for analysis. The sooner the samples are analyzed following the
sampling event, the more accurate the results will be. While transferring the sample, it is crucial
that the sample is handled with appropriate care and is placed under the right conditions. If
samples are not handled with proper care, this can disrupt the cell wall of the bacteria (Hudnell,
2008).
20
Analysis
An accurate assessment of cyanotoxins presence presents many challenges when the
analyses of results do not reflect the status of the water body. For example, some programs
measure cyanobacteria cell counts; however, this identifies the presence and abundance of
cyanobacteria rather than the concentration of cyanotoxins (Graham et al., 2009). In addition,
new cyanotoxins have been discovered and identified; however, it is not realistic to include all of
them in the analyses.
IV. INTERNATIONAL RESPONSE TO CYANOBACTERIA RISK
Many agencies and organizations use the World Health Organization‘s (WHO) Toxic
Cyanobacteria in Water: A Guide to their Public Health Consequences, Monitoring, and
Management as a guide and framework for setting standards and protocols. The WHO is
responsible for “directing and coordinating authority for health within the United Nations system
(WHO, 2011).” They are also responsible for providing information on global health matters
through research, monitoring, and policy. Furthermore, they use information collected to
determine global health trends. The guide was developed in 1999 to inform the potential health
risks of cyanobacteria and to set standards and protocols to manage cyanobacteria problems.
Since the United States have not developed a national standard for limits and protocols, many
organizations have successfully implemented monitoring plan using this guide as its foundation.
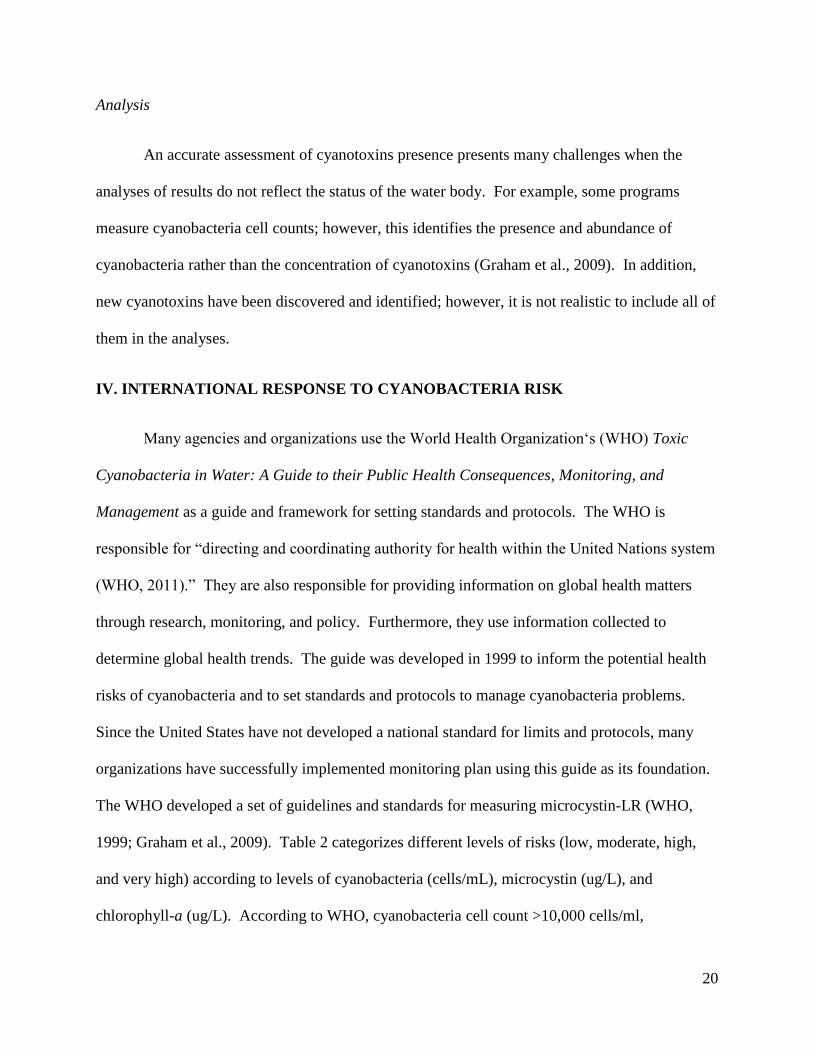
The WHO developed a set of guidelines and standards for measuring microcystin-LR (WHO,
1999; Graham et al., 2009). Table 2 categorizes different levels of risks (low, moderate, high,
and very high) according to levels of cyanobacteria (cells/mL), microcystin (ug/L), and
chlorophyll-a (ug/L). According to WHO, cyanobacteria cell count >10,000 cells/ml,
21
microcystin-LR >2,000 ug/l and chlorophyll-a >5,000 ug/l levels are considered very high
probability for acute health effects (WHO, 1999; Graham et al., 2009). Although the WHO
provides an underlying foundation for developing a cyanobacteria monitoring plan, they do
provide guidance on dissemination of advisories and notifications to the public (Graham et al.,
2009).
Relative Probability of
Acute Health Effects
Cyanobacteria
(cells/mL)
Microcystin-LR
(ug/L)
Chlorophyll-a
(ug/L)
Low <20,000 <10 <10
Moderate 20,000-100,000 10-20 10-50
High 100,000-10,000,000 20-2,000 50-5,000
Very High >10,000,000 >2,000 >5,000
Table 2. The relative probability of having acute health effects based on specific cell count numbers of cyanobacteria,
microcystin-LR, and chlorophyll-a (WHO, 1999; Graham, Loftin & Kamman, 2009).
V. CASE STUDIES: NEW ENGLAND STATES APPROACHES TO CYANOBACTERIA
MONITORING
A number of different approaches to cyanobacteria monitoring are underway within New
England and outside of New England states. For each state, the background,
protocols/procedures, cyanobacteria results, current status of the program, and challenges
encountered will be examined. This information will assist with developing recommendations
for a cyanobacteria monitoring program in Rhode Island. Currently, Rhode Island does not have
a robust cyanobacteria monitoring program. Analyzing other state’s approaches will enable me
to make recommendations for Rhode Island by including any additional factors that would
reduce challenges and limitations that a monitoring program typically encounters. The following
questions will be addressed:
What protocols should be used?
What methods should be employed?
Would a volunteer based program serve the best interest for this program?
What standards should be used?
22
The answers to these questions are important for implementing and maximizing the efficiency
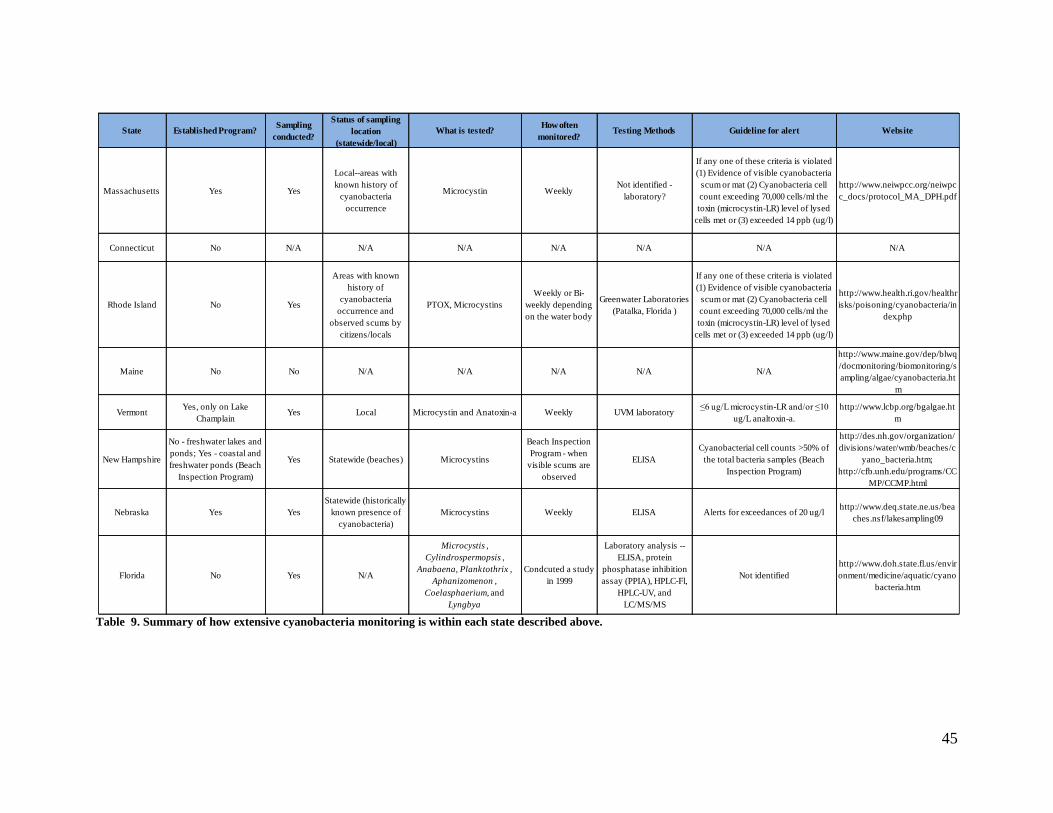
and accuracy of the cyanobacteria monitoring program. Table 9 summarizes how each state
approaches cyanobacteria monitoring.
The current status of an established cyanobacteria monitoring program within the New
England state varies from state to state. Some states monitor bacteria at a local, state, event-
based, or educational level (Graham et al., 2009). New Hampshire measures cyanobacteria on a
state level (freshwater beaches), Vermont measures cyanobacteria on a watershed-basis, and
Massachusetts has developed a protocol to measure cyanobacteria on a local level, but Rhode
Island, Connecticut, and Maine have no established state-wide plan to monitor cyanobacteria
(Graham et al., 2009). Below outlines what each state within the New England region have been
doing to tackle the issues and challenges of cyanobacteria.
Rhode Island Status
Background
Currently, Rhode Island has no systematic monitoring program for cyanotoxins in
freshwater. Cyanobacteria blooms have been documented during the summer and fall of 2010
and Rhode Island Department of Environmental Protection (RI DEM) issued temporary
advisories for the following water bodies: Almy Pond (Newport), Melville Pond (Portsmouth),
and Turner Reservoir (East Providence) (Zalewsky, 2010). RI DEM adopted Massachusetts
Department of Public Health’s (MDPH) protocols. An advisory was issued if any one of the
following criteria was violated:
Evidence of visible cyanobacteria scum or mat.
23
Cyanobacteria cell count exceeding 70,000 cells/mL
The toxin (Microcystin-LR) level of lysed cells met or exceeded 14 ppb (ug/l)
Once an advisory was issued, RI DEM act to do the following:
RI DEM and RI Department of Health (RI HEALTH) websites are updated and a press
release is sent out advising locals of blooms in water bodies.
A notice is sent out to town officials, watershed groups, and sometimes water suppliers.
Advisories are posted at water body access points.
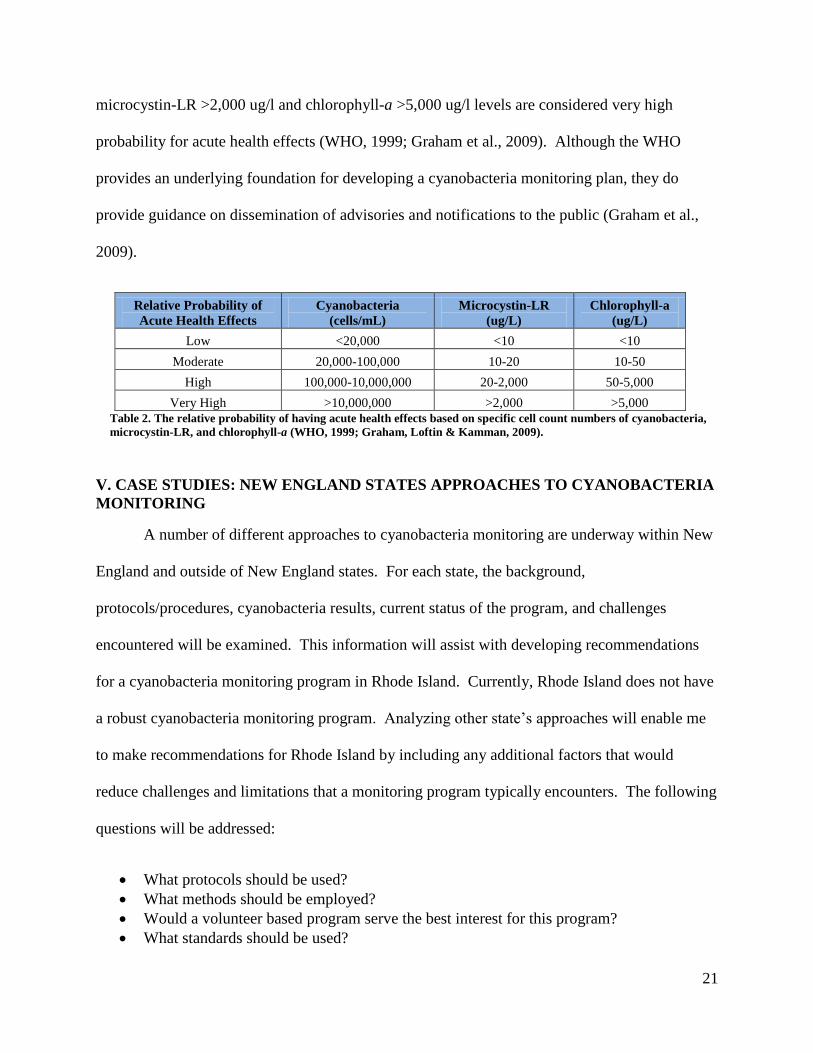
Table 3 lists all the previously documented sites where cyanobacteria toxins have occurred since
1998 (RI Department of Health, 2010).
Body of Water City or Town Year(s) Dominant Cyanobacteria Species
Melville Pond Portsmouth 2010 Anabaena, Microcystis
Almy Pond Newport 2010
Aphanizomenon, Microcystis,
Anabaena
Central Pond East Providence 2010, 2007 Microcystis
Turner Reservoir East Providence 2010, 2007 Microcystis
Lower Ten Mile River East Providence 2007 Microcystis
Omega Pond East Providence 2007 Microcystis
Mashapaug Pond Providence 2001 N/A
Yawgoo Pond South Kingstown 1998 N/A
Table 3. Previously documented cyanobacteria toxins in Rhode Island (RI Department of Health, 2010)
Protocols
The following are general protocols for sampling for cyanobacteria blooms developed by RI
DEM and RI Department of Health (RI HEALTH) (RI Department of Health, 2010).
1. Take a picture to document the bloom.
a. Record the following observations: water color, water clarity, current and three to
four day prior weather conditions, recent inflow events, lake level, recent public
use, and presence of surface accumulation and/or visible algae.
2. Wade to the sampling location without disturbing the water bottom.
a. Samples should be collected at 15 cm below if the water is ankle-deep.
b. Samples should be collected at 30 cm below if the water is knee or hip deep.
3. Samples should be placed under cool and dark conditions in a cooler.
24
4. Samples are sent to Greenwater Laboratories in Patalka, Florida for the following: algal
identification, enumeration, and toxicity analysis. Toxicity analysis is made using ELISA.
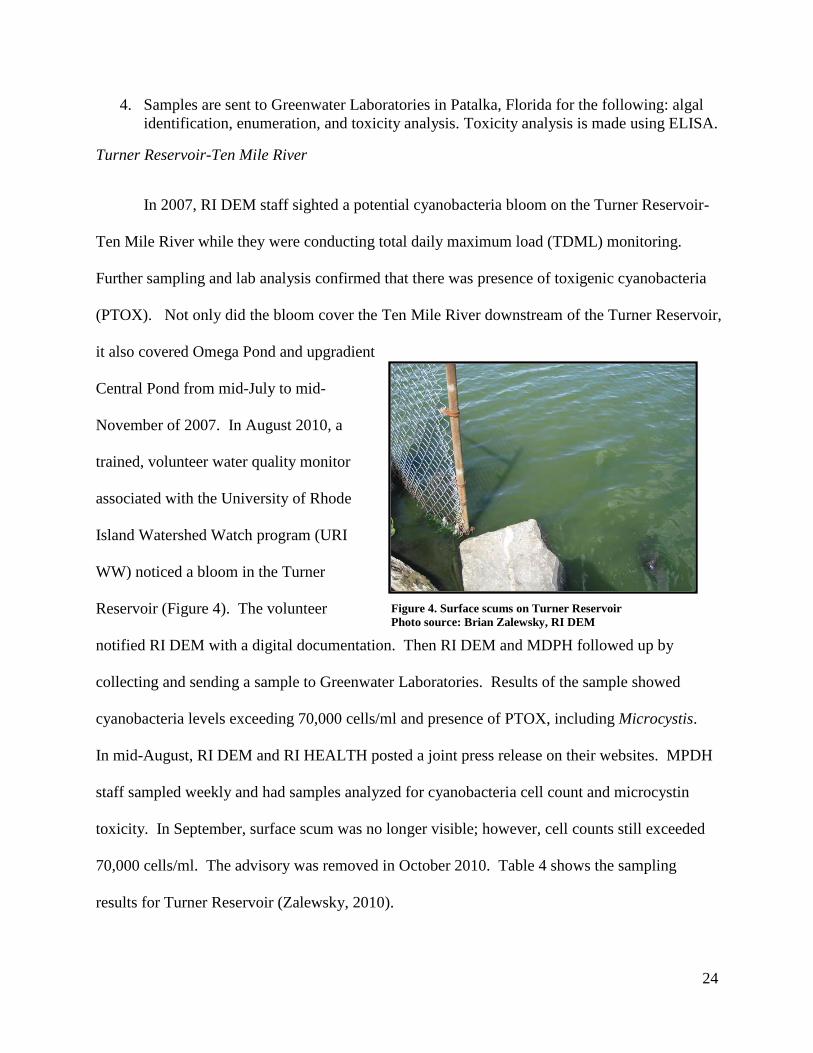
Turner Reservoir-Ten Mile River
In 2007, RI DEM staff sighted a potential cyanobacteria bloom on the Turner Reservoir-
Ten Mile River while they were conducting total daily maximum load (TDML) monitoring.
Further sampling and lab analysis confirmed that there was presence of toxigenic cyanobacteria
(PTOX). Not only did the bloom cover the Ten Mile River downstream of the Turner Reservoir,
it also covered Omega Pond and upgradient
Central Pond from mid-July to mid-
November of 2007. In August 2010, a
trained, volunteer water quality monitor
associated with the University of Rhode
Island Watershed Watch program (URI
WW) noticed a bloom in the Turner
Reservoir (Figure 4). The volunteer
notified RI DEM with a digital documentation. Then RI DEM and MDPH followed up by
collecting and sending a sample to Greenwater Laboratories. Results of the sample showed
cyanobacteria levels exceeding 70,000 cells/ml and presence of PTOX, including Microcystis.
In mid-August, RI DEM and RI HEALTH posted a joint press release on their websites. MPDH
staff sampled weekly and had samples analyzed for cyanobacteria cell count and microcystin
toxicity. In September, surface scum was no longer visible; however, cell counts still exceeded
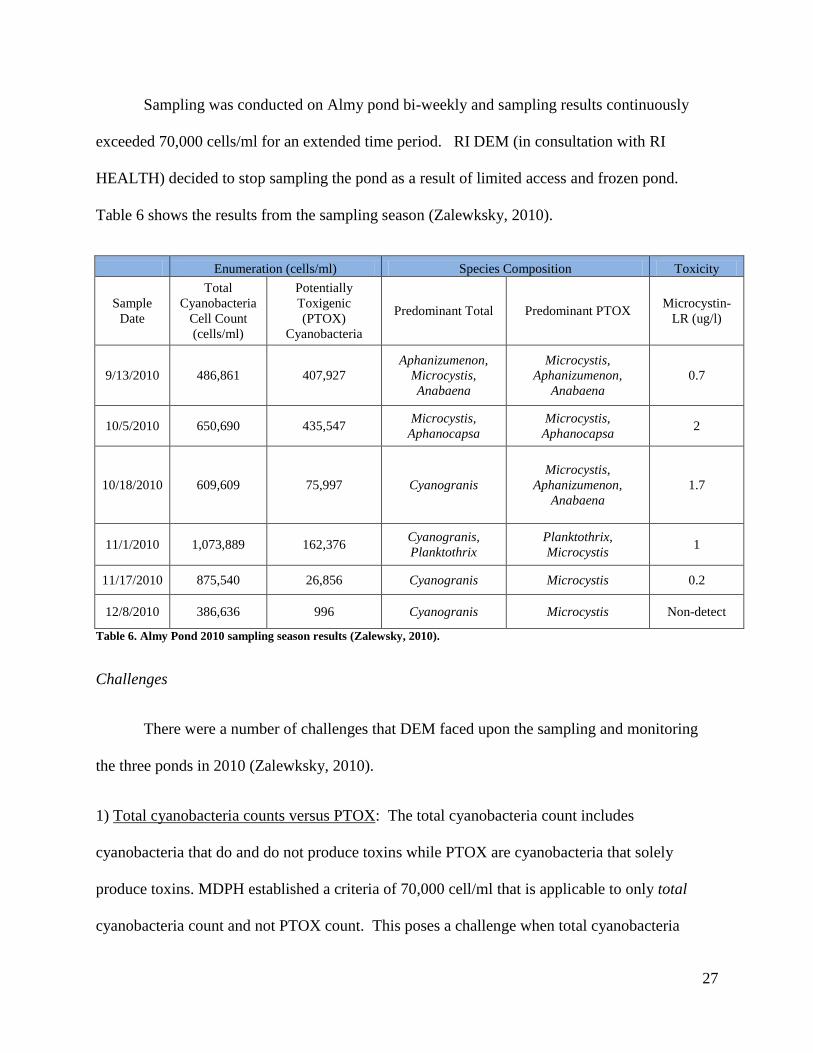
70,000 cells/ml. The advisory was removed in October 2010. Table 4 shows the sampling
results for Turner Reservoir (Zalewsky, 2010).
Figure 4. Surface scums on Turner Reservoir
Photo source: Brian Zalewsky, RI DEM
25
Table 4. Turner Reservoir 2010 sampling season results (Zalewsky, 2010)
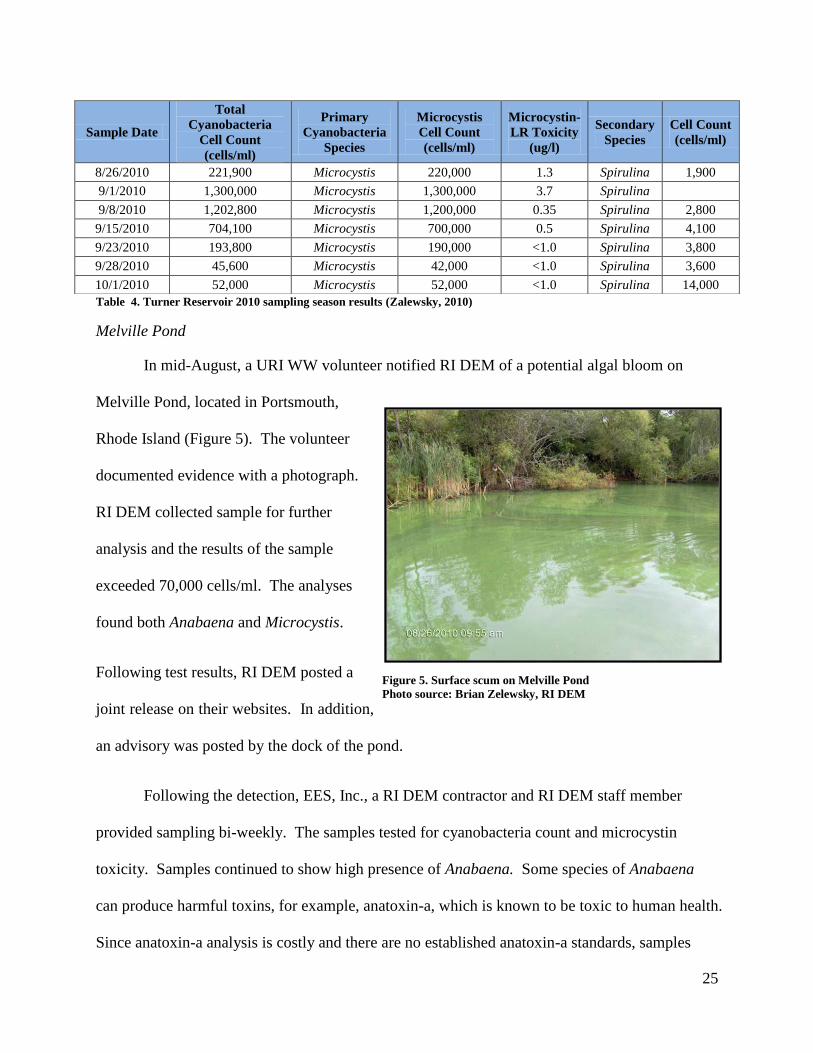
Melville Pond
In mid-August, a URI WW volunteer notified RI DEM of a potential algal bloom on
Melville Pond, located in Portsmouth,
Rhode Island (Figure 5). The volunteer
documented evidence with a photograph.
RI DEM collected sample for further
analysis and the results of the sample
exceeded 70,000 cells/ml. The analyses
found both Anabaena and Microcystis.
Following test results, RI DEM posted a
joint release on their websites. In addition,
an advisory was posted by the dock of the pond.
Following the detection, EES, Inc., a RI DEM contractor and RI DEM staff member
provided sampling bi-weekly. The samples tested for cyanobacteria count and microcystin
toxicity. Samples continued to show high presence of Anabaena. Some species of Anabaena
can produce harmful toxins, for example, anatoxin-a, which is known to be toxic to human health.
Since anatoxin-a analysis is costly and there are no established anatoxin-a standards, samples
Sample Date
Total
Cyanobacteria
Cell Count
(cells/ml)
Primary
Cyanobacteria
Species
Microcystis
Cell Count
(cells/ml)
Microcystin-
LR Toxicity
(ug/l)
Secondary
Species
Cell Count
(cells/ml)
8/26/2010 221,900 Microcystis 220,000 1.3 Spirulina 1,900
9/1/2010 1,300,000 Microcystis 1,300,000 3.7 Spirulina
9/8/2010 1,202,800 Microcystis 1,200,000 0.35 Spirulina 2,800
9/15/2010 704,100 Microcystis 700,000 0.5 Spirulina 4,100
9/23/2010 193,800 Microcystis 190,000 <1.0 Spirulina 3,800
9/28/2010 45,600 Microcystis 42,000 <1.0 Spirulina 3,600
10/1/2010 52,000 Microcystis 52,000 <1.0 Spirulina 14,000
Figure 5. Surface scum on Melville Pond
Photo source: Brian Zelewsky, RI DEM
26
only tested for microcystins. Surface scum disappeared in September, but samples continued to
exceed 70,000 cells/ml until mid-October. The advisory was removed on October 29, 2010.
Table 5 shows the sampling results for Melville Pond (Zalewsky, 2010).
Table 5. Melville Pond 2010 sampling season results (Zalewsky, 2010)
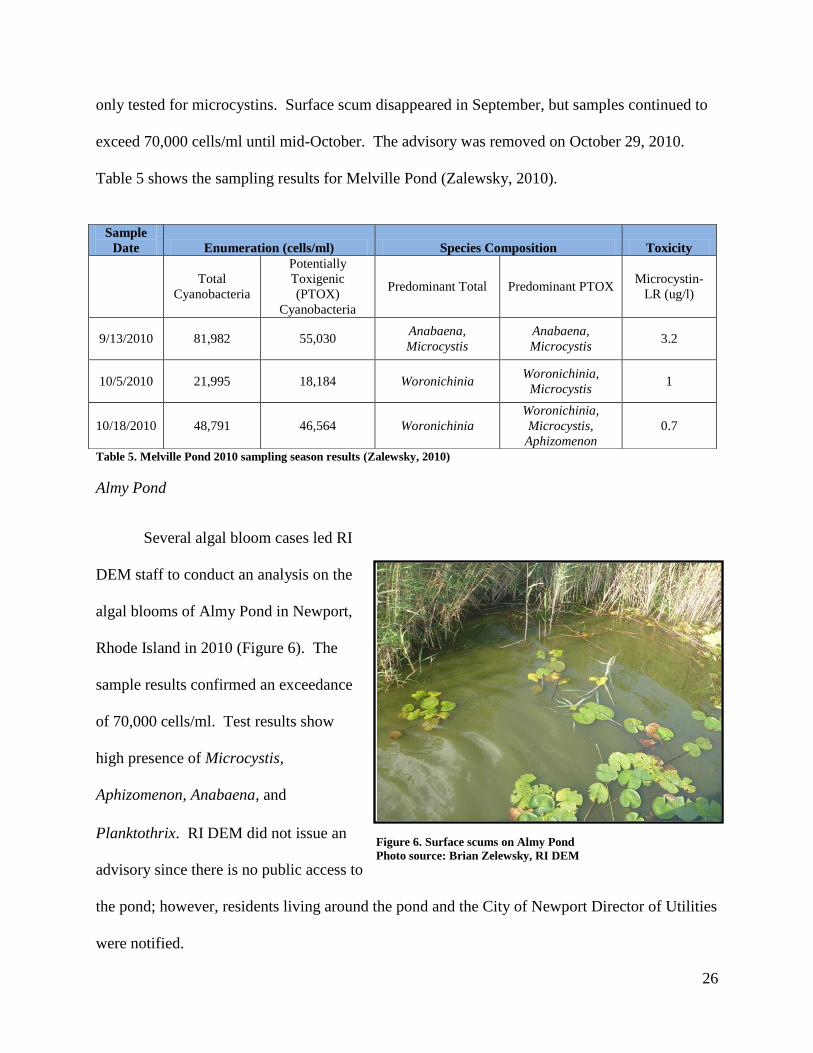
Almy Pond
Several algal bloom cases led RI
DEM staff to conduct an analysis on the
algal blooms of Almy Pond in Newport,
Rhode Island in 2010 (Figure 6). The
sample results confirmed an exceedance
of 70,000 cells/ml. Test results show
high presence of Microcystis,
Aphizomenon, Anabaena, and
Planktothrix. RI DEM did not issue an
advisory since there is no public access to
the pond; however, residents living around the pond and the City of Newport Director of Utilities
were notified.
Sample
Date Enumeration (cells/ml) Species Composition Toxicity
Total
Cyanobacteria
Potentially
Toxigenic
(PTOX)
Cyanobacteria
Predominant Total Predominant PTOX Microcystin-
LR (ug/l)
9/13/2010 81,982 55,030 Anabaena,
Microcystis
Anabaena,
Microcystis 3.2
10/5/2010 21,995 18,184 Woronichinia Woronichinia,
Microcystis 1
10/18/2010 48,791 46,564 Woronichinia
Woronichinia,
Microcystis,
Aphizomenon
0.7
Figure 6. Surface scums on Almy Pond
Photo source: Brian Zelewsky, RI DEM
27
Sampling was conducted on Almy pond bi-weekly and sampling results continuously
exceeded 70,000 cells/ml for an extended time period. RI DEM (in consultation with RI
HEALTH) decided to stop sampling the pond as a result of limited access and frozen pond.
Table 6 shows the results from the sampling season (Zalewksky, 2010).
Enumeration (cells/ml) Species Composition Toxicity
Sample
Date
Total
Cyanobacteria
Cell Count
(cells/ml)
Potentially
Toxigenic
(PTOX)
Cyanobacteria
Predominant Total Predominant PTOX Microcystin-
LR (ug/l)
9/13/2010 486,861 407,927
Aphanizumenon,
Microcystis,
Anabaena
Microcystis,
Aphanizumenon,
Anabaena
0.7
10/5/2010 650,690 435,547 Microcystis,
Aphanocapsa
Microcystis,
Aphanocapsa 2
10/18/2010 609,609 75,997 Cyanogranis
Microcystis,
Aphanizumenon,
Anabaena
1.7
11/1/2010 1,073,889 162,376 Cyanogranis,
Planktothrix
Planktothrix,
Microcystis 1
11/17/2010 875,540 26,856 Cyanogranis Microcystis 0.2
12/8/2010 386,636 996 Cyanogranis Microcystis Non-detect
Table 6. Almy Pond 2010 sampling season results (Zalewsky, 2010).
Challenges
There were a number of challenges that DEM faced upon the sampling and monitoring
the three ponds in 2010 (Zalewksky, 2010).
1) Total cyanobacteria counts versus PTOX: The total cyanobacteria count includes
cyanobacteria that do and do not produce toxins while PTOX are cyanobacteria that solely
produce toxins. MDPH established a criteria of 70,000 cell/ml that is applicable to only total
cyanobacteria count and not PTOX count. This poses a challenge when total cyanobacteria
28
exceed the 70,000 cell/ml but PTOX are well below the limit. RI DEM posts an advisory
regardless of this situation. This imposes extra costs for sampling and extends the length of the
posted advisory.
2) Laboratory expenses and turn-over time: The Green Waters Laboratories is known nationally
for testing cyanobacteria and they receive samples from across the country. The time it takes to
run the sample can take up to two weeks and by then the surface scum on the surface of the pond
could disappear, but the toxicity may still remain.
3) Other toxins: There was presence of Anabaena in Almy Pond and Anabaena is known to
produce anatoxin-a, which is a highly toxic neuroxin. Currently there is no advisory for
anatoxin-a.
4) Public notice: Press releases were typically sent out by RI DEM and HEALTH. Municipal
officials also sent out press releases if their local water body is affected. Active volunteers and
citizens also took action to post notices on the websites. Although the public is notified, RI
DEM believe that the list of groups could be expanded to local watershed groups, affected towns,
state and local veterinarian hospitals, and all public access points.
5) Spatial and temporal distribution: As a result of budget constraints, RI DEM appears to only
sample if there is a visible presence of a bloom. If there is a bloom, the waters are monitored
biweekly rather than weekly. RI DEM makes no report of sampling at various depths within the
water column nor do they conduct sampling at more than one point on the affected water body.
29
Vermont
Background
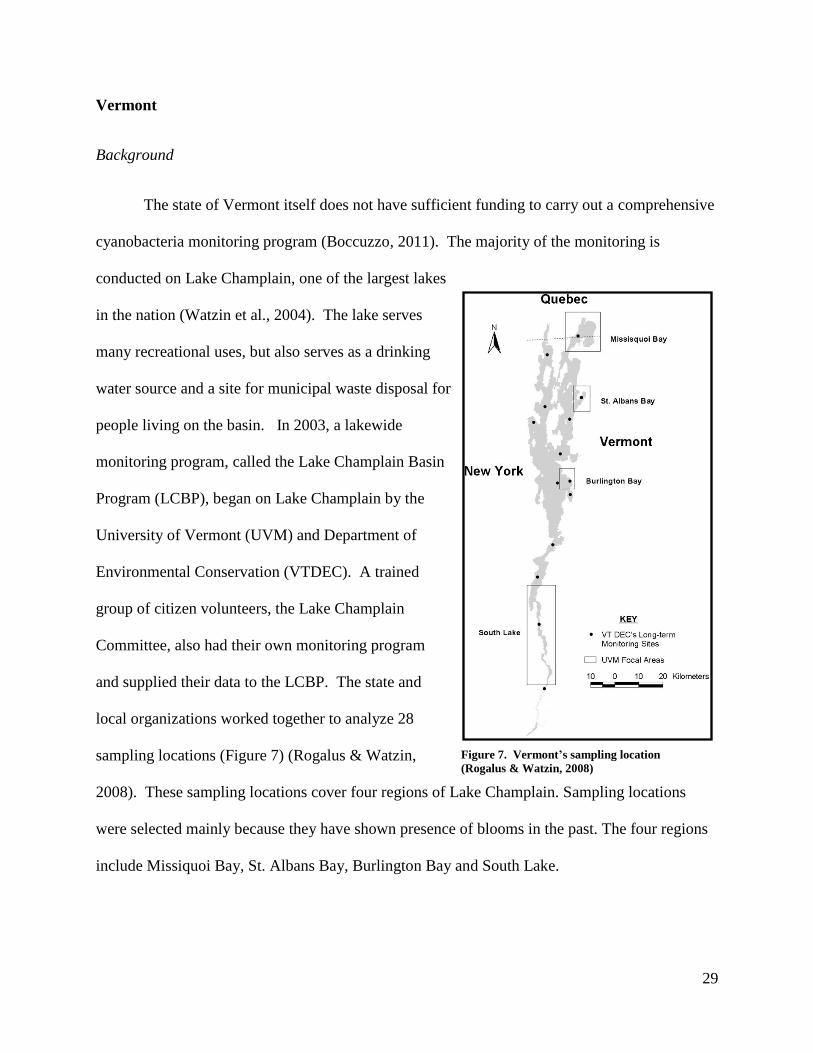
The state of Vermont itself does not have sufficient funding to carry out a comprehensive
cyanobacteria monitoring program (Boccuzzo, 2011). The majority of the monitoring is
conducted on Lake Champlain, one of the largest lakes
in the nation (Watzin et al., 2004). The lake serves
many recreational uses, but also serves as a drinking
water source and a site for municipal waste disposal for
people living on the basin. In 2003, a lakewide
monitoring program, called the Lake Champlain Basin
Program (LCBP), began on Lake Champlain by the
University of Vermont (UVM) and Department of
Environmental Conservation (VTDEC). A trained
group of citizen volunteers, the Lake Champlain
Committee, also had their own monitoring program
and supplied their data to the LCBP. The state and
local organizations worked together to analyze 28
sampling locations (Figure 7) (Rogalus & Watzin,
2008). These sampling locations cover four regions of Lake Champlain. Sampling locations
were selected mainly because they have shown presence of blooms in the past. The four regions
include Missiquoi Bay, St. Albans Bay, Burlington Bay and South Lake.
Figure 7. Vermont’s sampling location
(Rogalus & Watzin, 2008)
30
Protocols
VTDEC together with the Water Quality Division, Vermont Department of Health
(VDH), and UVM developed cyanobacteria testing and response protocols for public water
systems. The program focuses entirely on Lake Champlain (Royer, 2010). The LCBP followed
guidelines and framework established by WHO. In terms of frequency sampling, the LCBP
conducts sampling based on the tiered alert system framework which WHO calls for less
frequent sampling until a bloom occurs. Once a bloom occurs, protocols call for weekly
monitoring (Watzin et al., 2004). The LCBP measures the following parameters for analysis:
whole water and net plankton, whole water for total nitrogen, whole water for total phosphorus,
whole water for chlorophyll a, whole water for toxins (microcystin and anatoxin-a) weekly. Net
plankton samples are collected using a 63-µm Wisconsin net and samples are then placed in a
cooler until it is ready for analysis in the lab (Watzin et al., 2004). Total nitrogen, total
phosphorus, chlorophyll a, and whole water plankton samples are collected via surface grabbing
sampling. Each parameter is collected twice (Watzin et al., 2004). All samples are sent to UVM
Rubenstein laboratory (Bress et al, 2010).
Advisories
Once samples are tested, results are reported to the VDH and they post the results their
website. VDH provides updates every week on the status of the cyanobacteria (Royer, 2010).
Advisories are posted for recreational areas if any of the criteria are violated: ≤6 ug/L
microcystin-LR and/or ≤10 ug/L anatoxin-a (Bress et al, 2010).
31
Challenges
1) Budget: VTDEC does not have sufficient funds to establish a comprehensive monitoring
program so monitoring is done solely on Lake Champlain. Fortunately, all analysis is conducted
in UVM’s laboratory which relieves the costs on sending samples to outside laboratories.
2) Outreach: The LCBP makes no mention of any outreach efforts or public postings in their
technical report or on their website. The only public outreach effort mentioned was posting the
cyanobacteria status on the website. This represents minimal effort in communicating
information to the public. Since Lake Champlain is a recreational lake, it is imperative that some
outreach effort is done.
3) Frequency of sampling: Following the WHO protocols, the LCBP only conducts sampling on
a regular basis if a bloom occurs. Not sampling on a consistent and frequent basis from the
initial sampling season can mask blooms that occur between sampling dates.
New Hampshire
According to New Hampshire Department of Environmental Services (NH DES), the
extent and severity of cyanobacteria problem is currently unknown for freshwater since they do
not conduct routine monitoring across the entire state (NHDES, 2009a). The first reported scum
in a lake was in 1996 (Carlson, 2009). More recently, cyanobacteria blooms have been found in
30 lakes, ponds, and reservoirs throughout the state experiencing taste and odor problems
(NHDES, 2009a). A survey conducted on 44 lakes in 1999 and 2000 found microcystin in all
the lakes (NHDES, 2009a). In addition, three other types of cyanobacteria have been found in
New Hampshire lakes: Anabaena, Aphanizomenon, and Oscillatoria (NHDES, 2009b). In 2010,
The University of New Hampshire Center for Freshwater Biology (UNHCFB) developed a
32
Citizen-based Cyanobacteria Monitoring Program (CCMP) to track cyanobacteria and
microcystins (Hanley, 2010). The program began in summer 2010 as a pilot program. The goals
for this program were to see if there was interest within the state and if there could be any
potential funders (Murby, 2011). The season wrapped up at the end of the summer. However,
the results were not publicly posted and were solely viewed by their “clients” (Murby, 2011).
Due to high interests, the program could not keep up with the demand so the program did not
continue in summer 2011. They produced many results but were not sure how to regulate the
release of the results (Murby, 2011)
In 2008, a study was conducted to determine if there was an association linked between
β-methylamino-L-alanine (BMAA) and amyotrophic lateral sclerosis (ALS) (Caller et al, 2009).
Several cases of ASL were reported in Enfield, NH. The cause was believed to have resulted
from exposure to cyanobacteria bloom on Lake Mascoma. In 2008, samples were collected from
Lake Mascoma and several regional lakes; however BMAA was not detected in the samples
(Caller et al., 2009; Caller, 2009). Results could be limited to several factors including low algal
yield, fluctuating levels of toxins, insufficient sampling protocols, etc. (Caller et al., 2009; Caller,
2009). Thus, there was no proven connection between BMAA and ASL (Caller et al, 2009).
Although freshwater monitoring has not been extensive, the NH DES Beach Inspection
Program monitors cyanobacteria along with other water quality parameters. The Beach
Inspection program monitors water quality for New Hampshire’s freshwater and coastal beaches
to protect the public’s health from Memorial Day until September. The program’s sampling is
conducted by volunteers and they monitor 489 beaches.
33
Protocols
UNHCFB’s CCMP developed standard operating procedure for field sampling
cyanobacteria for lakes for their pilot program. The procedures are as follows (Hanley, 2010):
1. Sample mid-day between 10 a.m. and 3 p.m.
2. Collect samples from several locations. Cyanobacteria distribution can be patchy
due to wind and water currents. The number of samples depends on the size and
complexity of the lake.
3. Sample in 3-5 locations with varying depths
4. Collect water samples by lowering an “integrated tube sampler” at 3 meters deep.
This prevents variability as a result of vertical strata.
5. Combine all samples into one large container.
6. Shake the container thoroughly and pour into 1 liter sample bottle 3/4th
full.
7. Place sample on ice and in the dark until the sample is dropped off at the UNH
CFB lab.
8. Freeze the sample if the sample storage time >12 hours before sample drop off.
Samples are analyzed for liver toxin, microcystin concentration using the Envirogix,
Quantiplate-ELISA kit (Hanley, 2010). Results are delivered as ng microcystins per liter. The
phycocyanin fluoresce is then determine and converted to equivalent Microcystis aeruginosa
cells/ml (Hanley, 2010).
General protocols for the Beach Inspection Program are as followed: if scum or a bloom
is observed, a sample is collected and sent to NH DES Laboratory Services for cyanbacteria
count and toxicity analysis (Carlson, 2009; NH DES, 2004).
34
Advisories
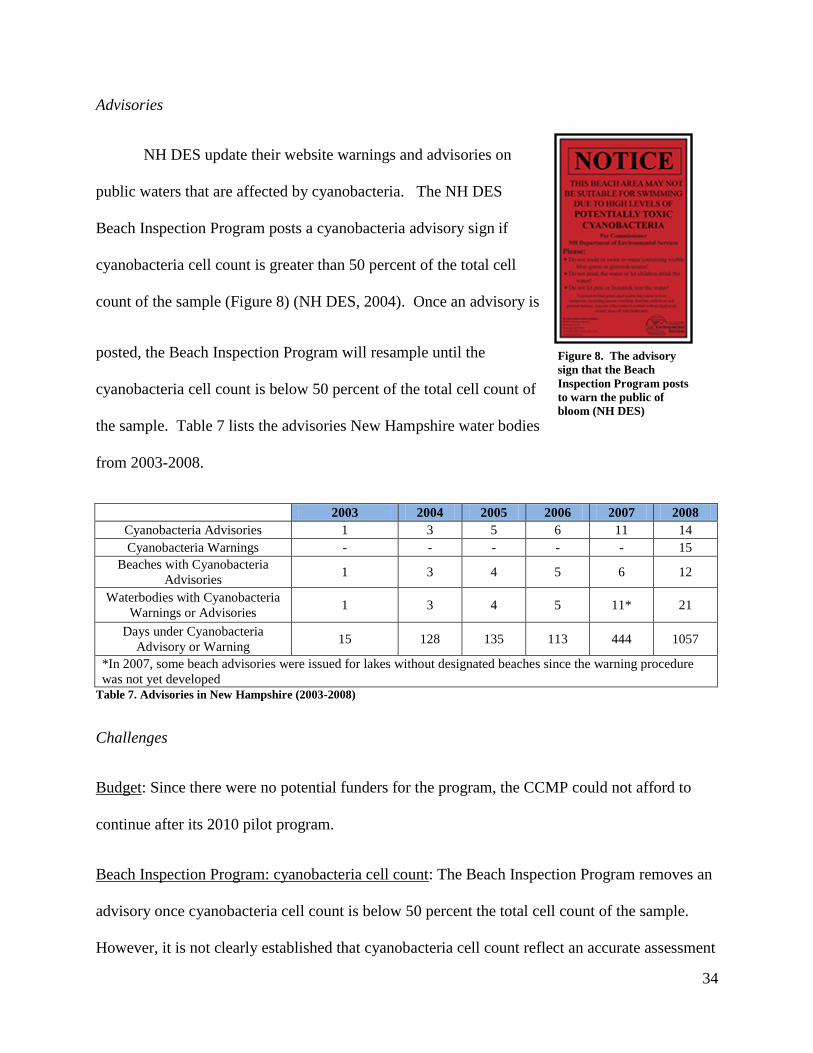
NH DES update their website warnings and advisories on
public waters that are affected by cyanobacteria. The NH DES
Beach Inspection Program posts a cyanobacteria advisory sign if
cyanobacteria cell count is greater than 50 percent of the total cell
count of the sample (Figure 8) (NH DES, 2004). Once an advisory is
posted, the Beach Inspection Program will resample until the
cyanobacteria cell count is below 50 percent of the total cell count of
the sample. Table 7 lists the advisories New Hampshire water bodies
from 2003-2008.
2003 2004 2005 2006 2007 2008
Cyanobacteria Advisories 1 3 5 6 11 14
Cyanobacteria Warnings - - - - - 15
Beaches with Cyanobacteria
Advisories 1 3 4 5 6 12
Waterbodies with Cyanobacteria
Warnings or Advisories 1 3 4 5 11* 21
Days under Cyanobacteria
Advisory or Warning 15 128 135 113 444 1057
*In 2007, some beach advisories were issued for lakes without designated beaches since the warning procedure
was not yet developed
Table 7. Advisories in New Hampshire (2003-2008)
Challenges
Budget: Since there were no potential funders for the program, the CCMP could not afford to
continue after its 2010 pilot program.
Beach Inspection Program: cyanobacteria cell count: The Beach Inspection Program removes an
advisory once cyanobacteria cell count is below 50 percent the total cell count of the sample.
However, it is not clearly established that cyanobacteria cell count reflect an accurate assessment
Figure 8. The advisory
sign that the Beach
Inspection Program posts
to warn the public of
bloom (NH DES)
35
of the cyanotoxins present. Also, if the cyanobacteria cell count fell below 50 percent to 40
percent of the total cell count, the percentage is still relatively high.
Massachusetts
Background
In 1998, there were reported incidents of dog deaths from cyanobacteria poisoning after
the dogs had consumed water from the shorelines of Nickerson State Park in Brewster,
Massachusetts (Colman & Friesz, 2001). In 2010, a bloom was identified on Lake Attitash in
Amesbury/Merrimac area. The bloom was present for 8 weeks with a peak cell count reaching
350,000 cells/ml. A fish kill was also reported in the lake (Yandell, 2011b).
Protocol
The Massachusetts Department of Public Health (MDPH) conducts sampling along
various locations in Massachusetts with established monitoring routines (MDPH, 2007). These
sampling locations are chosen based on historical records of high cyanobacteria toxins. The
samples test for cyanobacteria count and identification, microcystin, and the following water
quality parameters: total phosphorus, total suspended solids (TTS), total kjeldahl nitrogen (TKN),
chlorophyll a, nitrate/nitrite/ammonium, dissolved oxygen, etc. every week for a minimum of 12
weeks (Yandell, 2011b). MDPH uses the following protocols for posting an advisory once a
bloom is detected (MDPH, 2007):
1. If a visible cyanobacteria scum or mat is evident, MDPH recommends an immediate
posting by the local health department, state agency, or relevant authority to advise
against contact with the water body.
36
2. If the cell count exceeds 50,000 cells/mL, toxin testing of lysed cells should be done to
ensure that guideline of 14 ppb (ug/l) is not exceeded. The lysing should consist of three
freeze and thaw cycles.
3. If either the cell count exceeds 70,000 cells/mL or the toxin level of lysed cells meets or
exceeds 14 ppb, post an advisory against contact with the water. The lysing should
consist of three freeze and thaw cycles.
4. Because cyanobacteria can multiply extremely rapidly, frequency of follow-up testing
may depend in part on weather conditions, e.g., predicted hot, dry, and calm conditions,
all of which promote rapid cyanobacteria generation, may suggest more frequent testing
than weekly.
5. Since decreasing cell counts indicate cell die-off and lysing cells release toxins, algal
toxin concentrations in the water may rise for a period of time after cell counts decrease.
Many factors (e.g., wind, rain, temperature) can affect the progression of die-off, which
supports a measured approach for lifting an advisory similar to that of Oregon and
Australia: advisories may be lifted after two successive and representative sampling
rounds one week apart demonstrate cell counts or toxin levels below those at which an
advisory would be posted.
After sampling, water bodies that are experiencing algal blooms are revisited. Local people are
then interviewed to determine if they have come in contact with the contaminated water (Yandell,
2011b). MDPH responds by distributing brochures and educational guides to local residents and
businesses about possible human and animal health threats (Yandell, 2011b).
Results
In 2009, 151 water samples were collected from 32 waterbodies from June 18, 2009 to
November 23, 2009 by MDPH staff, a MDPH contractor, and Massachusetts Department of
Environmental Protection (MA DEP) (Yandell, 2011b). Approximately 21% of the samples
exceeded the standard level of 70,000 cells/ml and a total of 24 advisories were issued (Yandell,
2011b). In 2010, 235 water samples were collected from 25 waterbodies from May 21, 2009 to
December 13, 2009 by MDPH staff, a MDPH contractor, and MA DEP (Yandell, 2011b).
37
Approximately 33% of the samples exceeded the standard level of 70,000 cells/ml. A total of 24
advisories were issued.
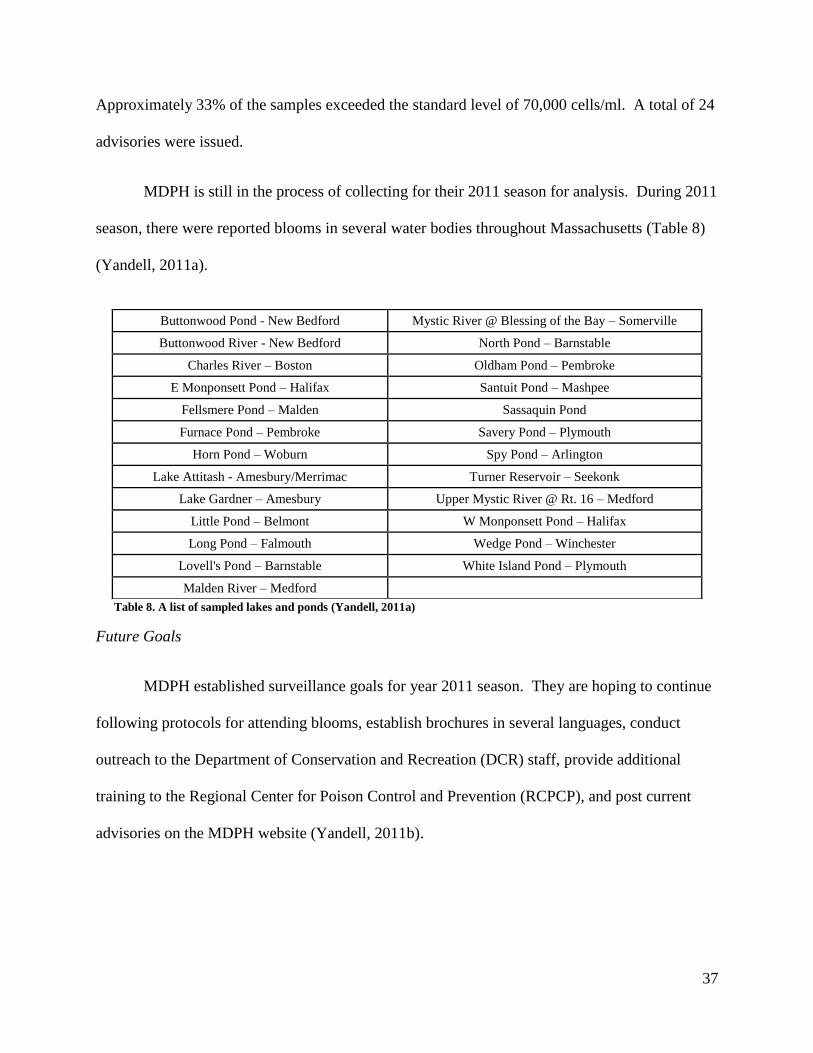
MDPH is still in the process of collecting for their 2011 season for analysis. During 2011
season, there were reported blooms in several water bodies throughout Massachusetts (Table 8)
(Yandell, 2011a).
Table 8. A list of sampled lakes and ponds (Yandell, 2011a)
Future Goals
MDPH established surveillance goals for year 2011 season. They are hoping to continue
following protocols for attending blooms, establish brochures in several languages, conduct
outreach to the Department of Conservation and Recreation (DCR) staff, provide additional
training to the Regional Center for Poison Control and Prevention (RCPCP), and post current
advisories on the MDPH website (Yandell, 2011b).
Buttonwood Pond - New Bedford Mystic River @ Blessing of the Bay – Somerville
Buttonwood River - New Bedford North Pond – Barnstable
Charles River – Boston Oldham Pond – Pembroke
E Monponsett Pond – Halifax Santuit Pond – Mashpee
Fellsmere Pond – Malden Sassaquin Pond
Furnace Pond – Pembroke Savery Pond – Plymouth
Horn Pond – Woburn Spy Pond – Arlington
Lake Attitash - Amesbury/Merrimac Turner Reservoir – Seekonk
Lake Gardner – Amesbury Upper Mystic River @ Rt. 16 – Medford
Little Pond – Belmont W Monponsett Pond – Halifax
Long Pond – Falmouth Wedge Pond – Winchester
Lovell's Pond – Barnstable White Island Pond – Plymouth
Malden River – Medford
38
Challenges
Massachusetts cyanobacteria monitoring plan is a comprehensive one; they conduct a
reasonable amount of monitoring and have established a set of standards for cyanobacteria
exceedance. The state also has a collaborative partnership between MDPH and MA DEP. They
post advisories and published outreach materials. Although the state does present a few minor
challenges:
Temporal and spatial distribution: Within the methods, it was not clear whether or not they
address any of the challenges that temporal and spatial distribution presents.
A call for state-wide monitoring: MDPH does not conduct state-wide monitoring and most
sampling locations are focused around greater Boston area and eastern side of the state.
VI. CASE STUDIES: OUTSIDE NEW ENGLAND STATES APPROACHES TO
CYANOBACTERIA MONITORING
Nebraska has a comprehensive monitoring program and has been actively improving
their monitoring program. Florida, monitored cyanobacteria as part of a study in 1999 but has
not extensively monitor cyanobacteria since then.
Nebraska
On May 4, 2004, two dogs reportedly died after consuming water in a private lake in
Omaha, Nebraska. Water samples and a necropsy were conducted and found that the dog deaths
were due to high levels of the microcystin-LR (Brakhage, 2009). The state acted quickly and
had a meeting with the Nebraska Department of Environmental Quality (NDEQ), Nebraska
Health and Human Services (NHHS), Nebraska Game and Parks Commission (NGPC), and the
University of Nebraska-Lincoln (UNL). During those meetings, the agencies implemented
39
monitoring strategies and public notifications. Although actions were taken immediately, there
were reports of three additional dog deaths, wildlife and livestock deaths, and more than 50 cases
of human effects (skin rashes, lesions, or gastrointestinal illnesses) in 2004 (Brakhage, 2009).
Protocols
Weekly samplings began on May 17, 2004; two weeks after the first reported dog deaths.
Monitoring stations were placed where cyanobacteria blooms were known to exist (Brakhage,
2009). In 2004, monitoring brought in 671 microcystin samples from 111 different waterbodies.
In 2005, cyanobacteria monitoring was combined with the swimming beach monitoring. By
2008, weekly sampling was conducted from May to September at 47 lakes and reservoirs with
financial help from U.S. Environmental Protection Agency (EPA) and staff assistance from the
following agencies: Nebraska Natural Resources Districts, Nebraska Game and Parks
Commission, Nebraska Public Power District, U.S. Army Corp of Engineers, UNL, and other
local health agencies (Brakhage, 2009).
Results
In 2004, health advisories were posted if microsystin samples exceeded 2 ug/l and health
alerts were posted if microsystin samples exceeded 15 ug/l (Brakhage, 2009). In 2004, the 671
microcystin samples collected resulted in health alerts in 26 lakes and health advisories in 69
lakes. In 2005, NDEQ no longer posted health advisories and health alerts for microsystin
exceedances were raised from15 ug/l to 20 ug/l in order to meet WHO’s recommendations
(Brakhage, 2009).
40
From 2005 to 2008, more than 3,625 samples were collected from 65 lakes in Nebraska.
Forty-three of the lakes had greater than the “reporting limit” of 0.15 ug/l limit and 18 lakes had
at least one sample had concentrations greater than 20 ug/l (Brakhage, 2009).
Future
Nebraska has been continuously monitoring cyanobacteria and is working towards
reducing nutrient level into lakes. Nonpoint source pollution has been a major concern and
Nebraska’s Nonpoint Source Management Program has been working alongside local, state, and
federal agencies and watershed stakeholders to reduce nutrient loading into lakes (Brakhage,
2009). While external nutrient loading is apparent, internal loading nutrient is also a source of
the problem. Nebraska’s reservoirs and sand pits built in 1950s and 1960s have substantial
nutrient loading. However, internal nutrient loading is difficult and costly to tackle.
Challenges
1) Cost: Samples sent to the laboratory were expensive which limited the number of samples
collected (Brakhage, 2009).
2) Turn-over time: Initially the time between collection time and receiving results did not
provide public notification in a timely manner. Thus, Nebraska Department of Environmental
Quality (NDEQ) purchased the Abraxis Microcystin ELISA laboratory test kit to analyze total
microcystins concentration (Brakhage, 2009). The ELISA test kits were relatively inexpensive
kit compared to the High Performance Liquid Chromatography (HPLC) or Liquid
Chromatography/Mass Spectometry (LC/MS). The ELISA test kits also provided a fast turn
over time. The estimated savings from using ELISA is $77,000.
41
Florida
Background
The first reported bloom in Florida was on Lake Okeechobee and Lake Istokpoga in1992
(Burns, 2008). Both lakes experienced cattle deaths and were linked to Anabaena and
Microcystis blooms. Since the first report, there have been very little published reports on
cyanotoxins in Florida water bodies. In 1999, the Florida Harmful Bloom Task Force (FHABTF)
made up of five committees was formed to conduct surveys on cyanobacteria blooms. The group
established several goals: 1) identify cyanotoxins throughout Florida; 2) characterize the level of
cyanotoxins; 3) help develop “analytical capability” for cyanotoxins with the Florida Department
of Health laboratory; and 4) assess the cyanobacteria toxins within water treatment plants (Burns,
2008). The FHABTF, Florida Marine Research Institute, and St. Johns River Water
Management District collaborated with Florida Department of Health and Wright State
University conducted a project in summer 1999 by collecting samples and analyzing the
cyanobacteria toxins in Florida’s lakes, rivers, reservoirs, and estuaries (Williams et al., 2001;
Burns, 2008; Fleming et al., 2002). The objective of the project was to “identify major water
bodies throughout Florida that experience cyanobacterial blooms, collect representative water
samples during cyanobacterial blooms, screen collected samples for potentially toxic algal
species, and identify/characterize cyanotoxins (Williams et al., 2001).”
More recently in 2005 a massive bloom was recorded in Lower St. Johns River (Burns,
2008). The toxins were identified as Microcystis and Cylindrospermopsis. Through tide
movement, algal scums were transported from Jacksonville to the Atlantic Ocean. One person
42
died from coming in contact with the bloom while jet skiing (Burns, 2008). The Florida
Department of Public Health posted a public health advisory warning people about the bloom.
Procedures
For the summer 1999 project, sampling sites were prioritized according the following:
drinking water source, recreation (swimming), livestock water supply, and Outstanding Florida
Waters (OFWs) (Williams et al., 2001). For sampling procedures, the project used several
general practices (Williams et al., 2001):
1. Collect samples from bow of the boat, upstream, upwind or upstream from motor, piers
or edge of the water body.
2. Ensure that no sediment disturbance occurs within the sampling area.
3. Rinse collection equipment before water sampling
4. Label sampling containers with the station name, date, and time.
The project employed several method of identifying cyanotoxins: ELISA, protein phosphatase
inhibition assay (PPIA), HPLC-Fl, HPLC-UV, and LC/MS/MS (Burns, 2008). Mouse bioassay
was used to test the toxicity level through sample injection into ICR-Swiss male mice. The
project used WHO organization to testify if results exceeded limits for recreational use. No
papers or technical report listed whether or not the project proceeded with public health
advisories if there was an exceedance.
Results
Altogether, they collected 167 samples with 88 samples (representing different 75
individual water bodies) containing high levels of cyanotoxins (Williams et al., 2001; Burns,
2008; Fleming et al., 2002). High concentrations of the following cyanobacteria taxa were found:
43
Microcystis (43.1%), Cylindrospermopsis (39.5%), and Anabaena (28.7%) (Burns, 2008). The
following cyanobacteria taxa were also found: Planktothrix (13.8%), Aphanizomenon (7.2%),
Coelasphaerium (3.6%) and Lyngbya (1.2%). Nine samples collected from drinking water sites
were tested positive for cylindrospermopsin (Burns, 2008). Cylindrospermopsin toxin is known
to affect liver and sample injections into mice shows that it affects kidneys, spleen, thymus, and
heart (Burns, 2008). Mice were affected when microcystins had concentrations of 50-300 ug/kg
body weight (Burns, 2008). Of all the samples, fifty-eight samples killed the mice (Williams et
al., 2001).
Status
Although cyanobacteria continue to persist in Florida waters, there are no established
state-wide cyanobacteria monitoring program in Florida (Burns, 2008). Burns (2008) clearly
states there have been no established cyanobacteria monitoring program since the study in 1999,
but he does not clarify why nor are there any other cited literature explaining this. In addition,
there are no guidelines for recreational or drinking water exposure in Florida. However,
FHABTF made effort to conduct independent monitoring through funding for workshops and
technical reports (Burns, 2008).
Challenges
1. Holding time: The samples were sent between two laboratories: Florida Department of Health
and Wright State University (Williams et al., 2001). The two laboratories yielded different
results—results from Florida Department of Health showed that microcystins were absent while
results from Wright State University often showed that microcystins were apparent (Williams et
44
al., 2001). Florida Department of Health experienced equipment problems and had to hold on to
water samples until October.
2. Time constraints and protocols: The initial objective of this project was to analyze level
toxicity within mice; however, due to limited time and complications for two laboratory
protocols, only sixty-eight of the samples were tested in mice (Williams et al., 2001).
45
Table 9. Summary of how extensive cyanobacteria monitoring is within each state described above.
State Established Program? Sampling
conducted?
Status of sampling
location
(statewide/local)
What is tested?How often
monitored? Testing Methods Guideline for alert Website
Massachusetts Yes Yes
Local--areas with
known history of
cyanobacteria
occurrence
Microcystin Weekly Not identified -
laboratory?
If any one of these criteria is violated
(1) Evidence of visible cyanobacteria
scum or mat (2) Cyanobacteria cell
count exceeding 70,000 cells/ml the
toxin (microcystin-LR) level of lysed
cells met or (3) exceeded 14 ppb (ug/l)
http://www.neiwpcc.org/neiwpc
c_docs/protocol_MA_DPH.pdf
Connecticut No N/A N/A N/A N/A N/A N/A N/A
Rhode Island No Yes
Areas with known
history of
cyanobacteria
occurrence and
observed scums by
citizens/locals
PTOX, Microcystins
Weekly or Bi-
weekly depending
on the water body
Greenwater Laboratories
(Patalka, Florida )
If any one of these criteria is violated
(1) Evidence of visible cyanobacteria
scum or mat (2) Cyanobacteria cell
count exceeding 70,000 cells/ml the
toxin (microcystin-LR) level of lysed
cells met or (3) exceeded 14 ppb (ug/l)
http://www.health.ri.gov/healthr
isks/poisoning/cyanobacteria/in
dex.php
Maine No No N/A N/A N/A N/A N/A
http://www.maine.gov/dep/blwq
/docmonitoring/biomonitoring/s
ampling/algae/cyanobacteria.ht
m
VermontYes, only on Lake
ChamplainYes Local Microcystin and Anatoxin-a Weekly UVM laboratory
≤6 ug/L microcystin-LR and/or ≤10
ug/L analtoxin-a.
http://www.lcbp.org/bgalgae.ht
m
New Hampshire
No - freshwater lakes and
ponds; Yes - coastal and
freshwater ponds (Beach
Inspection Program)
Yes Statewide (beaches) Microcystins
Beach Inspection
Program - when
visible scums are
observed
ELISA
Cyanobacterial cell counts >50% of
the total bacteria samples (Beach
Inspection Program)
http://des.nh.gov/organization/
divisions/water/wmb/beaches/c
yano_bacteria.htm;
http://cfb.unh.edu/programs/CC
MP/CCMP.html
Nebraska Yes Yes
Statewide (historically
known presence of
cyanobacteria)
Microcystins Weekly ELISA Alerts for exceedances of 20 ug/l http://www.deq.state.ne.us/bea
ches.nsf/lakesampling09
Florida No Yes N/A
Microcystis ,
Cylindrospermopsis ,
Anabaena, Planktothrix ,
Aphanizomenon ,
Coelasphaerium, and
Lyngbya
Condcuted a study
in 1999
Laboratory analysis --
ELISA, protein
phosphatase inhibition
assay (PPIA), HPLC-Fl,
HPLC-UV, and
LC/MS/MS
Not identified
http://www.doh.state.fl.us/envir
onment/medicine/aquatic/cyano
bacteria.htm
46
VII. NATURE OF VOLUNTEER PROGAMS
The reoccurring challenges of establishing an effective cyanobacteria monitoring
program are limited budget and unequal spatial distribution monitoring at a site. Incorporating a
volunteer based citizen science program can eliminates those challenges by providing extended
coverage within a site and training volunteers to conduct sampling. However, volunteer based
programs present challenges within themselves. First, new start-up programs will require
recruitment effort to gain perspective volunteers. Second, volunteers may not follow protocols
correctly and may thus affect results. Third, volunteers may not attend to their schedule
sampling event. Fourth, volunteers may not commit to the entire season. Fifth, sampling poses
potential risk if volunteers do not take precaution. For example, sampling may require handling
of chemicals and using canoes and kayaks as their mode of transportation to the middle of the
water body. A number of monitoring programs have overcome all of these challenges and have
established successful long- term monitoring with high levels of quality control and quality
assurance.
In Rhode Island, The University of Rhode Island Watershed Watch (URI WW) is a state-
wide volunteer water quality monitoring program and is considered one of the longest running
volunteer monitoring programs in the nation with more than 20 years of data (Green et al., 2002).
They test for many parameters including water clarity, algal density, dissolved oxygen, water
temperature, alkanility and pH, nutrients (total and dissolved phosphorus, ammonia, total and
nitrate-nitrogen), and bacteria (fecal coliform and enterococci) (Green et al., 2002). The data
collected throughout the years help monitor the health of these water bodies by explaining trends
and patterns. This information then translates into management practices for improving water
quality. URI WW does not monitor cyanobacteria but provides information about cyanobacteria
47
on their website. They do monitor chlorophyll a, which provides an indication of algal biomass.
However, the chlorophyll samples are collected every two weeks, stored and then analyzed only
three times per year. This limits the timeliness of these data for cyanobacteria detection, but
generates a useful record of water bodies that have experienced major algal blooms. These data
could be used to prioritize locations that warrant more intensive training and monitoring
protocols.
A key facet of the URI WW program and most volunteer programs is the weekly
collection of water clarity through secchi disc measurements. This places trained volunteers on
the lakes and ponds throughout the summer season.
VIII. RECOMMENDATIONS
The following recommendations for developing a cyanobacteria monitoring plan for
Rhode Island is based on the analysis that I conducted above. I incorporate approaches based on
the most cost effective and efficient methods while implementing approaches that would reduce
the challenges presented with cyanobacteria monitoring.
Framework & Guideline
When comparing the different approaches conducted by other states, many agencies and
organizations utilized WHO’s Toxic Cyanobacteria in Water: A Guide to their Public
Consequences, Monitoring and Management as a foundation for establishing guidelines. Some
states, for example, Massachusetts set their own guidelines but otherwise there are currently no
established national standards. Many states have commonly adopted WHO’s guidelines to
conduct their analysis. In the guideline, WHO outlines approaches to developing monitoring
program which I will follow in addition to incorporating my own approaches that I feel are
48
important and appropriate for a successful monitoring program. The following lists objectives
that WHO (1999) believe should entail in developing a monitoring program:
Assessment of health hazards caused by cyanobacteria and their toxins.
Identification of contaminated areas (e.g. in relation to drinking water intakes and
recreational areas).
Development of regulations concerning the development and use of recreational sites.
Public education and information.
Assessment of the cause of cyanobacteria problems (nutrient concentration and other
limnological data for understanding cyanobacterial growth).
Development of a nutrient pollution control programme
Checking whether compliance with cyanobacterial cell (or biomass) and toxin level
standards for the respective water use is being achieved.
Prediction of levels and changes in cyanobacterial populations and toxins resulting from
natural phenomena and human influence.
Information of the effect of interventions, including lake and reservoir management and
water treatment and reservoir management and water treatment methods, on
cyanobacterial cell and toxin levels.
Wider contribution to the knowledge of cyanobacterial ecology, hydrobiology, and the
state of the environment.
In addition to those listed by WHO, I would include the following objectives:
Design sampling protocols to address temporal and spatial variability
Develop guidance levels for different cyanotoxins
Maximize the level of monitoring—a call for state wide monitoring if applicable
Who is to sample?
URI WW has established a successful water quality monitoring network, thus it would be
most sensible to have the program volunteers trained to identify and report conditions that
suggest the potential for a cyanobacteria bloom. They can serve as a first alert system for the
49
state. On water bodies with a history of algal blooms (based on chlorophyll measures)
volunteers could be trained to recognize and report substantial declines in water clarity and to
identify, collect and report any visible surface scums. In addition, they could be given supplies
and trained in sampling protocols that would enable them to obtain and store samples for
cyanobacteria analyses. URI WW has established a strong foundation of dedicated volunteers
and many of the previous observed scums in Rhode Island were reported by URI WW volunteers
who were conducting their routine volunteering. Utilizing volunteers to sample cyanobacteria
would relieve expenses in hiring people within the field and volunteers can provide coverage
over a larger number of water bodies.
Sampling Sites
Since URI WW monitoring program covers a great majority of the recreational water
body, it would be reasonable for them to use the same sites for cyanobacteria monitoring. The
list of sites that URI WW program monitors includes the three ponds that showed evidence of
surface scum in Rhode Island in 2010.
Sampling stations need to be established. Every site should include 3-5 sampling stations.
One sampling station should represent the deepest part of the water body and the remaining
sampling stations should be 1 meter off the shore around the perimeter of the water body.
Standards
RI DEM had done some monitoring in the past and they have adopted MDPH’s standards
for what is considered an exceedance. RI DEM and MDPH have no experienced any problems
using these standards. Under WHO’s guidance, these numbers would fall under the category of
moderate risk. Thus, an advisory was posted when either one of the following occurs:
50
Evidence of visible cyanobacteria scum or mat.
Cyanobacteria cell count exceeding 70,000 cells/mL
The toxin (Microcystin-LR) level of lysed cells met or exceeded 14 ppb (ug/l)
Protocols
On lakes and ponds where cyanobacteria monitoring is to take place, the number of
samples taken at a lake, pond, or reservoir depends highly on how big the area of the lake is. If
water bodies are greater than 100 acres, take 5 samples; if water bodies are less than 100 acres,
take 3 samples. Sampling stations include one sampling station at the deepest point and the
remaining sampling stations are located 1 meter off the shore. Some sites are not accessible by
wading and require a canoe/kayak.
Each volunteer involved in cyanobacteria sampling should be equipped with the
following items: manual, labeled sterilized bottles, and integrated tube sampler, and cooler with
ice/freezer. Protocols should follow accordingly:
1) Collect between 7 a.m. and noon, when presence of cyanobacteria biomass is the highest.
2) At sampling location, collect samples at 6 inches below the surface and at 3 meters in
depth using an integrated tube sampler for each of the monitoring station; each bottle
should be 3/4th
full. The following steps are adopted by the UNH CFB’s standard
operating procedures (Hanley, 2010):
a. Lower the tube to desired depth using the markings on the tube as a ruler
b. Crimp the tube above the water
c. Retrieve the tube using the line attached to the bottle to prevent loss of water from
the tube
d. Place the open end of the tube (protruding from the bottle) into the sample jar
3) Place samples under cold (using ice) and dark conditions until the samples are ready to be
processed for microcystin analysis and cyanobacteria count.
51
Samples will be measured using the Abraxis Microcystin-LR, ELISA kit. The following
are instructions on how samples are analyzed (Abraxis, 2011):
1. Bring all kit reagents and samples to be run to room temperature
2. Prepare 1 X wash solution by diluting the 100X washing concentrate with DI water. 1
mL concentrate per 100 mL DI water.
3. Remove the required number of antibody coated tubes from the re-sealable foil bag.
Place tubes in rack and label with samples or calibrator level. Be sure to re-seal the bag
with the desiccant to limit exposure to tubes to moisture.
4. Pipet 500 uL of calibrators, control and samples into the appropriate tubes. Be sure to
use a clean pipette tip for each solution to avoid cross contamination.
5. Add 500 uL of Antibody Solution to each tube.
6. Swirl the tubes rapidly to mix the contents.
7. Incubate for 20 minutes.
8. After incubation, vigorously take the contents of the tubes into a sink. Flood the tubes
completely with wash solution, then shake to empty. Repeat this wash step four times for
a total of five washes. Invert the rack on absorbent paper and tap out as much water as
possible.
9. Add 500 uL of Substrate to each tube.
10. Cover the tubes and incubate for 20 minutes.
11. Add 500 uL of Stop Solution to each tube in the same order of addition as the substrate.
12. Read the tubes with spectrometer on tube rader at 450 mm. If the reader has dual
wavelength capability, read at 450 mm minute 605 or 650 mm.
What happens if there is an identified bloom?
Once a site has identified a bloom, advisories should be posted on RI DEM, URI WW,
and RI HEALTH websites, warning signs should be posted at all access points and press release
should be sent out. Monitoring should be continued weekly and advisories should be lifted once
52
there shows no clear signs of cyanobacteria bloom. Outreach should be an important component
to this monitoring plan. It is necessary that the public is aware of this problem because they are
the ones at potential risk. There are many ways that could reach out to the public, including
educational programs, events, brochures, posters, etc.
Overcoming the Challenges
Temporal and Spatial Distribution: Even though temporal and spatial distribution is highly
important, it is unrealistic to overcome the challenge completely. Potel et al. (2010) explain that
sample frequency is important and that the more frequent a pond is sampled, the higher the
chances of catching the peak of a bloom. Ideally, monitoring every day would be best; however,
a more realistic sampling frequency would be once a week. Wind and current has also shown to
play a role in the distribution of cyanobacteria presence. Their presence could fluctuate on an
hourly basis. Again, it would be unrealistic to be collecting samples every hour. In addition, 3-5
samples should be collected throughout the entire site. Since cyanobacteria presence is highest
in the early morning, sampling between 7 a.m. to 12 p.m. would reduce diel variation. To reduce
vertical distribution, sampling should be measured at two different depths: at 6 inches below the
surface and at 3 meters deep using an integrated tube sampler.
Costs/Choice of test/Turn-over Time/Holding Time: There are various tests developed to
measure cyanotoxins. Although the ELISA is the most commonly used, there is no test that is
regarded as the best one. However, the following factors are considered when determining the
choice of test: cost, effectiveness, turn-around time, and ease of use. The remote sensing tool
and spectrofluorometric probe are costly and require technical knowledge to use. Laboratory
analysis is another option; however, laboratories that do measure cyanotoxins are not within
53
proximity of Rhode Island so the handling time and turn around may affect the accuracy of the
results. In 2010, RI DEM sent their samples to Greenwater Laboratories which uses ELISA,
amongst other methods used as well (RI Department of Health, 2011). Since it is costly to send
samples to this particular lab, it would be reasonable to mirror the techniques that the lab used
for cyanotoxin analysis. I would recommend using the following ELISA test kits: Saxitoxin
(PSP) ELISA Kit, Microcystin-LR ELISA Kit, and Cylindrospermopsin ELISA Kit. These
ELISA kits are cost effective; however, these kits present several limitations. None of these kits
measure anatoxin-a and there are no established guidance level for cylindrospermopsin or
saxitoxin. With little information available, WHO (1999) developed the following level for
saxitoxins: 80 μg saxitoxin equivalents per 100 g. On the Abraxis website, the following
standard was established for cylindrospermopsin: 10 ug/l (Abraxis, 2011). For the purpose of
this paper, I would make my recommendation solely based on using the Microcystin-LR ELISA
kit. However, I do recommend that other cyanotoxins be monitored. ELISA has recently
developed relatively inexpensive products to measure other cyanotoxins and Rhode Island
should take advantage of this.
In coming years, assuming the costs and availability of PCR techniques continue to drop,
I recommend transferring to PCR-based tests. The PCR-based method provides many
advantages including fast result, and sensitivity to detection of cyanotoxis; however, PCR is a
complex technique that requires a good understanding of DNA. Several years with ELISA test
as preferred methodology will enable a better understanding of the toxins’ genes and general
patterns.
54
IX. CONCLUSION
Implementing a state-wide cyanobacteria monitoring plan for the state of Rhode Island
would create positive impacts on the public health of Rhode Island communities and on the
environment. There are many benefits to long-term monitoring of cyanobacteria and ultimately
it would lead to a better understanding of cyanobacteria trends and patterns and using that
information to implement management practices. The analysis I conducted by evaluating
different approaches allowed me to look at the weakness and strengths of each approach. I then
was able to apply and incorporate them into my recommendations. Conducting this analysis I
found that many cyanobacteria monitoring program only tested for microcystins. Microcystins is
the most commonly found cyanotoxins; however, this does not account for all the cyanotoxins
listed in Table 1. I suggest that monitoring programs need to address this issue. In addition,
many approaches do not incorporate spatial (horizontal and vertical) and temporal distribution to
their sampling approaches. This area can affect the accuracy of the results greatly. In general,
monitoring cyanobacteria is difficult and may require years of trial and error to reduce these
challenges.
Monitoring cyanobacteria is not directly going to prevent blooms. However, the results
will help us understand what cause these algal blooms. Since major source of nutrient inputs
come from anthropogenic activities, it is also important to relay this message to the public. It is
crucial to reach out to the public about ways to reduce nutrient inputs into water bodies: reducing
fertilizer usage, picking up after your pets, and using little to no phosphate detergents.
Ultimately, we want to protect human health, the environment, and not have to prevent
locals from enjoying recreational activities. Hopefully, one day Rhode Island will begin long

55
term monitoring at a state level and management practices can be implemented to improve water
quality.
56
X. ACKNOWLEDGEMENTS
I would like to acknowledge Linda Green and Elizabeth Heron from Watershed Watch
for the support of developing this major paper topic. I would like to thank Brian Zalewsky from
Rhode Island Department of Environmental Management, Vanessa Yandell from Massachusetts
Department of Public Health, Amanda Murby from University of New Hampshire, Sonya
Carlson from New Hampshire Department of Environmental Services, and Linda Boccuzzo from
Vermont Department of Public Health for providing information and resources for this paper. I
would like to thank Dr. Art Gold for his support, guidance, and feedback during the process of
this paper. In addition, I would like to thank Dr. Peter August for his support during my time in
the MESM program.
57
XI. REFERENCES
Abraxis. Algal toxins. (2011). Retrieved from
http://www.abraxiskits.com/productByCat.php?catId=36
Addy, K., & Green, L. (1996). Algae in aquatic ecosystems. Natural resources fact sheet,
University of Rhode Island, Kingston, Rhode Island.
Anderson, D., Gilbert, P., & Burkholder, J. (2002). Harmful algal blooms and eutrophication:
nutrient sources, composition, and consequences. Estuaries, 25(4b), 704-726.
Axler, R. (2004). Understanding lake ecology. Water on the Web, 1-29. Retrieved from
http://www.waterontheweb.org/under/lakeecology/lakeecology.pdf
Backer, L., & Mcgillicuddy, D. (2006). Harmful algal blooms. Oceanography, 19(2), 2006.
Blaha, L., Babica, P., & Marsalek, B. (2002). Toxins produced in cyanobacterial water blooms -
toxicity and risks. Interdisciplinary toxicology, 2(2), 36-41.
Boccuzzo, Linda. "Cyanobacteria Web Inquiry." Message to [email protected]. 12 July
2011. E-mail.
Brakhage, P. (2009). Cyanobacteria, the Nebraska experience. Retrieved from Nebraska
Department of Enviornmental Quality website:
http://www.deq.state.ne.us/Publica.nsf/pages/WAT145
Bress, B., Boccuzzo, L., Center, G. (2010). Vermont’s Experience with Cyanobacteria [Power
point slides]. Retrieved from the Vermont Department of Health:
http://www.neiwpcc.org/neiwpcc_docs/VT%20Update,%20Amanda%20Shambaugh.pdf
Burgess, B. (2001). A wave of momentum for toxic algae study. Environmental Health
Perspectives, 109(4), 160-161.
Burns, J. (2008). Toxic cyanobacteria in Florida waters. (pp. 127-137). New York, NY: Spring
Press.
Caller, T. (2009). Cyanobacterial blooms in New Hampshire: An environmental trigger for ALS?
[Powerpoint presentation]. Retrieved from New Hampshire Department of
Environmental Services website:
http://des.nh.gov/organization/divisions/water/wmb/beaches/documents/20090701wkshp
_cyano4.pdf
Caller, T., Doolin, J., Haney, J., Murby, A., West, K., Farrar, H., Ball, A., Harris, B, Stommel, E.
(2009). A cluster of amyotrophic lateral sclerosis in New Hampshire: A possible role for
toxic cyanobacteria blooms. Amyotrophic Lateral Sclerosis, 101-108.
58
Carlson, S. (2009). The sampling process and keep you informed: Warnings and advisories
[PowerPoint slides]. Retrieved from New Hampshire Department of Environmental
Services website:
http://des.nh.gov/organization/divisions/water/wmb/beaches/documents/20090701wkshp
_cyano2.pdf
Carpenter, S. (1998). Nonpoint pollution of surface waters with phosphorus and nitrogen.
Ecological Applications, 8(3), 559-568.
Codd, G., Morrison, L., & Metcalf, J. (2004). Cyanobacterial toxins: risk management for health
protection. Elsevier, 203, 264-272.
Colman, J. , & Friesz, P. U.S. Department of the Interior, U.S. Geological Survey. (2001).
Geohydrology and limnology of Walden Pond, Concord, Massachusetts (01-4137).
Northborough: Retrieved from http://pubs.usgs.gov/wri/wri014137/pdf/insidecovers.pdf
Connor, J., & Carlson, S. (2010, July 27). New Hampshire coastal beaches named 1st in the
nation in water quality by NRDC. Retrieved from
http://des.nh.gov/media/pr/2010/20100730-nh-beaches.htm
Dias, E., Pereira, P., & Franca, S. (2002). Production of paralytic shellfish toxins by
ananizomenon sp. lyecya 31 (cyanobacteria). Journal of Phycology, 38, 705-712.
Envirologix. Products. (2011). Retrieved from
http://www.envirologix.com/artman/publish/products.shtml
Fleming, L. E., Rivero, C., Burns, J., Williams, C., Bean, J. A., Shea, K. A., & Stinn, J. (2002).
Blue green algal (cyanobacterial) toxins, surface drinking water, and liver cancer in
Florida. Harmful Algae, 1, 157-168.
Graham, JL., Loftin, KA., & Kamman, N. (2009). Monitoring recreational freshwater. Lakeline,
18-24.
Green, L., Herron, E., Gold, A., & Addy, K. (2002). What is Watershed Watch?. Unpublished
raw data, University of Rhode Island, Kingston, Rhode Island.
Haney, J. (2010). Standard operating procedure for field sampling of cyanobacteria in lakes.
Retrieved from
http://www.cfb.unh.edu/programs/CCMP/UNHCyanobacteriaProtocol2010.pdf
Hawkins, P., Novic, S., Cox, P., Neilan, B., Burns, B., Shaw, G., Wickramasinghe, W.,
Peerapornpisal, Y., Ruangyuttikarn, W., Itayma, T., Saitou, T., Mizuochi, M., and
Inamori, Y. (2005). A review of analytical methods for assessing public health risks from
microcystin in the aquatic enviornment. Journal of Water Supply: Research and
Technology , 54(8), 509-518.
Hitzfeld, B., Hoger, S., & Dietrich, D. (2000). Cyanobacterial toxins: Removal during drinking
water treatment, and human risk assessment. Environmental Health Prospectives, 108(1),
113-122.
59
Hoeger, S., Dietrich, D., & Hitzfeld, B. (2002). Effect of ozonation on the removal of
cyanobacterial toxins during drinking water treatment. Environmental Health
Perspectives, 110(11), 1127-1132.
Howarth, R., Sharpley, A., & Walker, D. (2002). Sources of nutrient pollution to coastal waters
in the United States: Implications for achieving coastal water quality goals. Estuaries,
25(4b), 656-676.
Hudnell, K. (2008). Cyanobacterial harmful algal blooms: State of the science and research
needs. (pp. 855-865). Springer.
Humpage, A., Ledreux, A., Fanok S., Bernard, C., Briand, F., & Eaglesham, G. (2007).
Applications of the nueroblastoma assay from paralytic shellfish poisons to neurotoxic
freshwater cyanobacteria: interlaboratory calibration and comparison with other methods
of analysis. Environmental Toxicology and Chemistry, 26(7), 1512-1519.
Hunter, P., Tyler, A., Gilvear, D., & Willby, N. (2009). Using remote sensing to aid the
assessment of human health risks from blooms of potentially toxic cyanobacteria.
Enviornmental Science & Technology, 43, 2627-2633.
Krogmann, T., Butalla, R., & Sprinkle, J. (1986). Blooms of cyanobacteria on the Potomac River.
Plant Physiology, 80, 667-671.
Kurmayer, R., & Christiansen, G. (2009). The genetic basis of toxin production in cyanobacteria.
Freshwater Reviews, 2, 31-50.
Leoboulanger, C., Dorigo, U., & Jacquet, S., Brigitte, L., Paolini, G., Humbert, J.(2002).
Application of a submersible spectrofluorometer for rapid monitoring of freshwater
cyanobacterial blooms: a case study. Aquatic Microbial Ecology, 30, 83-89.
Massachusetts Department of Public Health (2007). MDPH guidelines for cyanobacteria in
freshwater recreational water bodies in Massachusetts. Boston, MA: The
Commonwealth of Massachusetts.
Murby, Amanda. "cyanobacteria monitoring program." Message to Cindy Chu. 25 Nov 2011. E-
mail.
New Hampshire State, Department of Environmental Services. (2004). NHDES adopt-a-beach
program
New Hampshire State, Department of Environmental Services (2009a). Cyanobacteria and
drinking water: guidance for public systems. Retried from
http://www.neiwpcc.org/neiwpcc_docs/NH%20DES%20DW%20Cyano%20FS.pdf
New Hampshire State, Department of Environmental Services. (2009b). Potential Dangers of
Cyanobacteria in New Hampshire. Retrieved from
http://des.nh.gov/organization/commissioner/pip/factsheets/wmb/documents/wmb-10.pdf
60
Ocean Optics. Products. (2011). Retrieved from
http://www.oceanoptics.com/Products/spectrometers.asp
Oregon Health Authority. Sampling guidelines: Harmful algae blooms in recreational waters.
(2011, Jun). Retrieved from
http://public.health.oregon.gov/HealthyEnvironments/Recreation/HarmfulAlgaeBlooms/
Documents/HABS Sampling Guidelines.2011WEB.pdf
Ouellette, J., & Wilhelm, S. (2003). Toxic cyanobacteria: The evolving molecular toolbox. The
Ecological Society of America, 1(7), 359-366.
Pobel, P., Robin, J., & Humbert, J. (2010). Influence of sampling strategies on the monitoring of
cyanobacteria sampling in shallow lakes: Lessons from a case study in France. Water
Research , 45(2011), 1005-1014.
Rehnstam-Holm, A., & Hernroth, B. (2005). Shellfish and public health: A Swedish perspective.
Ambio, 34(2), 139-144.
Rhode Island Department of Public Health. Cyanobacteria. (2010). Retrieved from
http://www.health.ri.gov/healthrisks/poisoning/cyanobacteria/index.php
Rhode Island Department of Public Health. Sampling for cyanobacteria. (2011, August).
Retrieved from
http://www.health.ri.gov/publications/policies/SamplingForCyanoBacteriaBlooms.pdf
Rogalus, M., & Watzin, M. (2008). Evaluation of sampling and screening techniques for tiered
monitoring of toxic cyanobacteria in lakes. Harmfal Algae, 7, 504-514.
Royer, L. (2010, September). Cyanobacteria (blue-green algae) in Lake Champlain. Newsleak,
pp. 1, 9.
Vasconcelos, V., & Pereira, E. (2001). Cyanobacteria diversity and toxicity in a wastewater
treatment plant (Portugal). Water Research, 35(5), 1354-1357.
Watzin, MC., Miller, EB., Kreider, M., Couture, S., Clason, T., Levine, M. (2005). Monitoring
and evaluation of cyanobacteria in Lake Champlain: Summer 2004. Technical report
prepared for the Lake Champlain Basin Program.
Williams, C. D., Burns, J., Chapman, A., Flewelling, L., Pawlowicz, M., & Carmichael, W.
(2001). Assessment of cyanobacteria in Florida, Palatka, FL: Retrieved from
http://greenwaterlab.com/articles/Assessment of Cyanotoxins 2001.pdf
World Health Organization. (1999). Toxic cyanobacteria in water: A guide to their public health
consequences, monitoring and management. London, England: St Edmundsbury Press.
Retrieved from
http://www.who.int/water_sanitation_health/resourcesquality/toxcyanobacteria.pdf
61
World Health Organization. (2003). Guidelines for Safe Recreational Water Environments,
Volume 1: Coastal and Fresh Waters. World Health Organization.
http://www.who.int/water_sanitation_health/bathing/srwe1/en/
World Health Organization. About WHO. (2011). Retrieved from http://www.who.int/about/en/
Yandell, Vanessa. “blue-green algae map.” Message to Cindy Chu. 13 Sep 2011a. Email.
Yandell, Vanessa. "Cyanobacteria and Public Health in Massachusetts." Cyanobacteria
Workshop. New England Interstate Water Pollution Control Commission. Boxborough,
MA. April 14, 2011b. In Person.
Zalewsky, B. (2010). Cyanobacteria blooms in Rhode Island – 2010 Rhode Island Department of
Environmental Management