Embed Size (px)
Citation preview
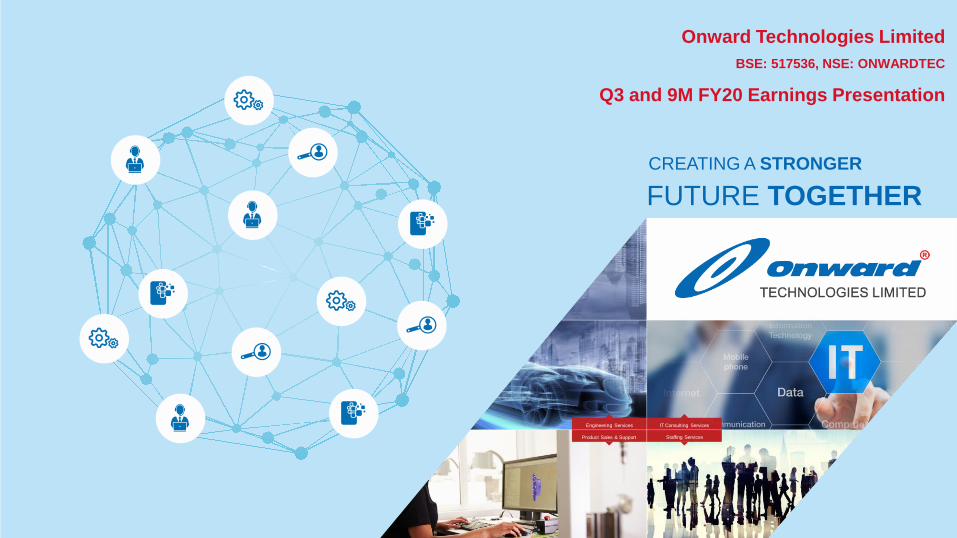
Onward Technologies Limited
BSE: 517536, NSE: ONWARDTEC
Q3 and 9M FY20 Earnings Presentation
CREATING A STRONGER
FUTURE TOGETHER
Engineering Services
Product Sales & Support
IT Consulting Services
Staffing Services

www.onwardgroup.com
// About Us
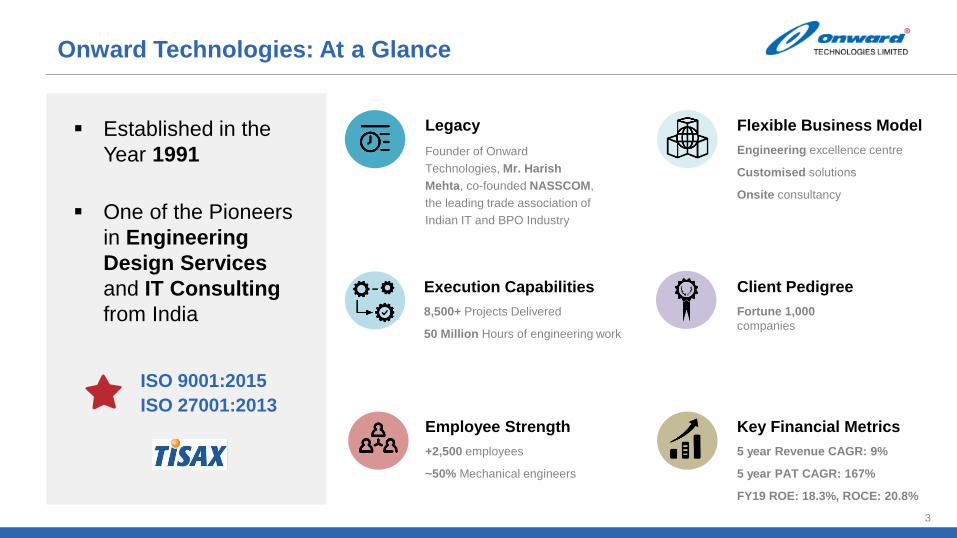
Onward Technologies: At a Glance
Established in the
Year 1991
One of the Pioneers
in Engineering
Design Services
and IT Consulting
from India
Legacy
Founder of Onward
Technologies, Mr. Harish
Mehta, co-founded NASSCOM,
the leading trade association of
Indian IT and BPO Industry
Flexible Business Model
Engineering excellence centre
Customised solutions
Onsite consultancy
Employee Strength
+2,500 employees
~50% Mechanical engineers
Client Pedigree
Fortune 1,000
companies
Execution Capabilities
8,500+ Projects Delivered
50 Million Hours of engineering work
Key Financial Metrics
5 year Revenue CAGR: 9%
5 year PAT CAGR: 167%
FY19 ROE: 18.3%, ROCE: 20.8%
ISO 9001:2015
ISO 27001:2013
3
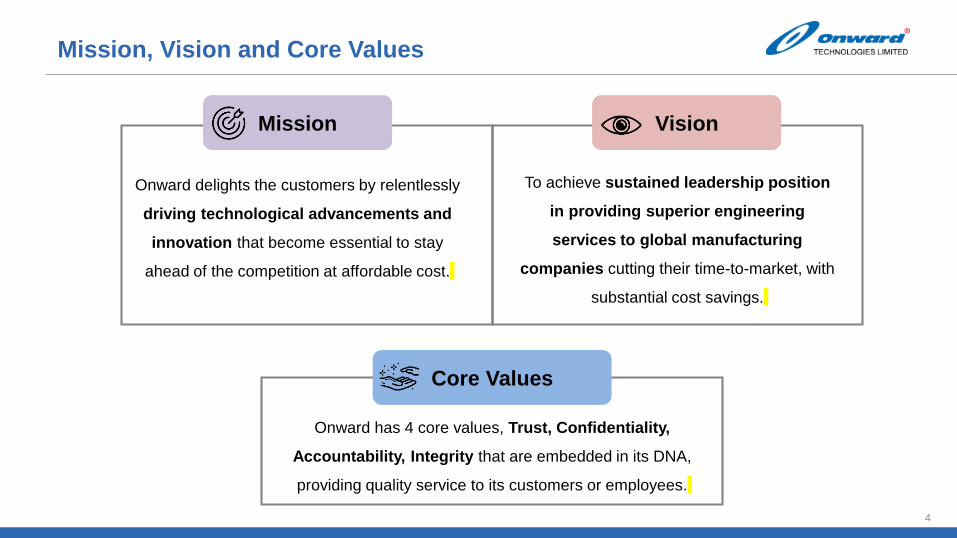
Mission, Vision and Core Values
Mission Vision
Core Values
To achieve sustained leadership position
in providing superior engineering
services to global manufacturing
companies cutting their time-to-market, with
substantial cost savings.
Onward delights the customers by relentlessly
driving technological advancements and
innovation that become essential to stay
ahead of the competition at affordable cost.
Onward has 4 core values, Trust, Confidentiality,
Accountability, Integrity that are embedded in its DNA,
providing quality service to its customers or employees.
4
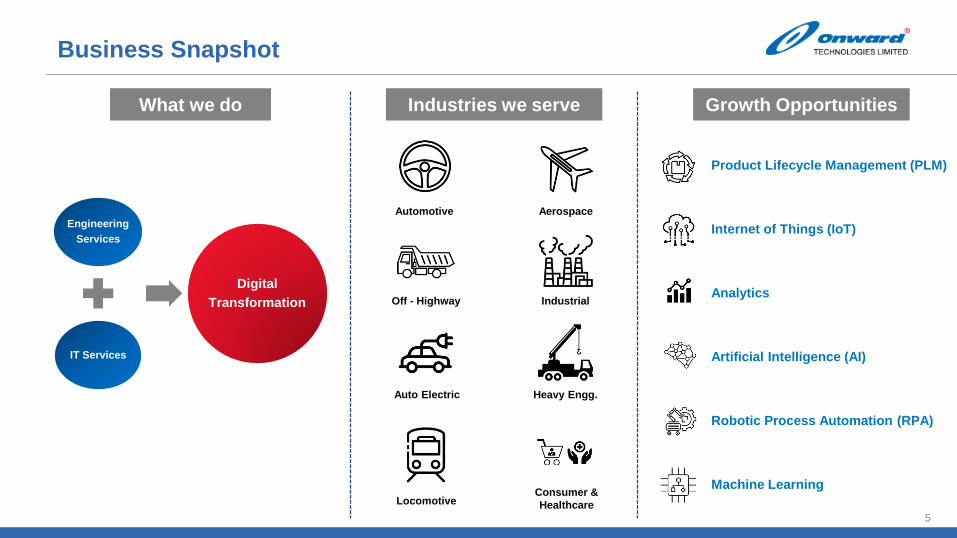
Business Snapshot
What we do Industries we serve Growth Opportunities
Engineering
Services
IT Services
Digital
Transformation
Automotive Aerospace
Off - Highway Industrial
Auto Electric Heavy Engg.
LocomotiveConsumer &
Healthcare
Product Lifecycle Management (PLM)
Internet of Things (IoT)
Analytics
Artificial Intelligence (AI)
Robotic Process Automation (RPA)
Machine Learning
5
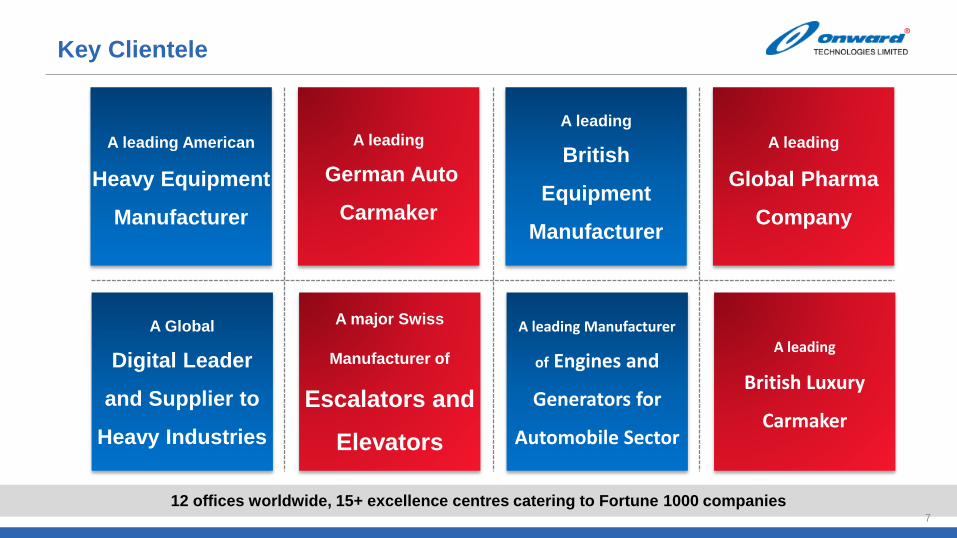
Key Clientele
A leading American
Heavy Equipment
Manufacturer
A leading
German Auto
Carmaker
A leading
British
Equipment
Manufacturer
A leading
Global Pharma
Company
A Global
Digital Leader
and Supplier to
Heavy Industries
A major Swiss
Manufacturer of
Escalators and
Elevators
A leading Manufacturer
of Engines and
Generators for
Automobile Sector
A leading
British Luxury
Carmaker
12 offices worldwide, 15+ excellence centres catering to Fortune 1000 companies7
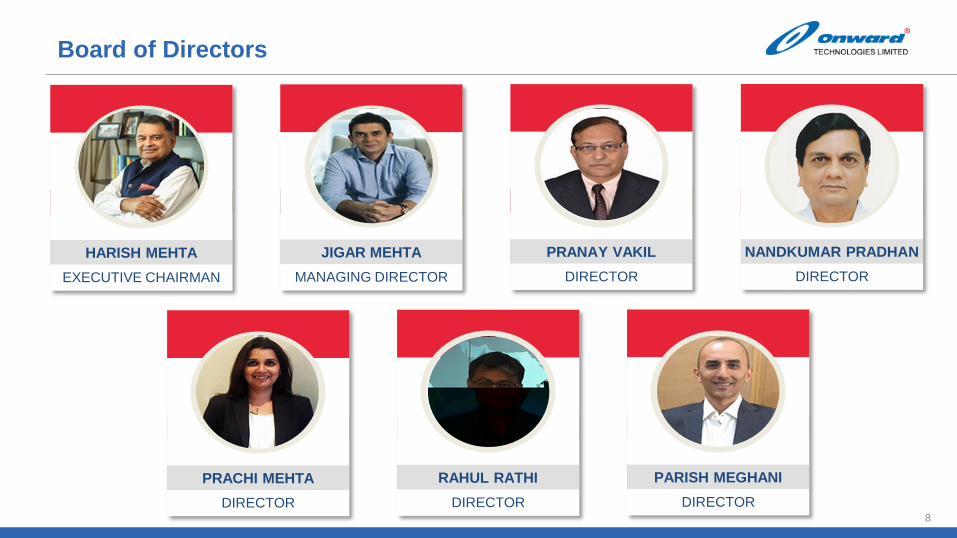
Board of Directors
Jane Doe
HARISH MEHTA
EXECUTIVE CHAIRMAN
Jane Doe
JIGAR MEHTA
MANAGING DIRECTOR
Jane Doe
PRANAY VAKIL
DIRECTOR
Jane Doe
NANDKUMAR PRADHAN
DIRECTOR
Jane Doe
PRACHI MEHTA
DIRECTOR
Jane Doe
RAHUL RATHI
DIRECTOR
Jane Doe
PARISH MEGHANI
DIRECTOR8
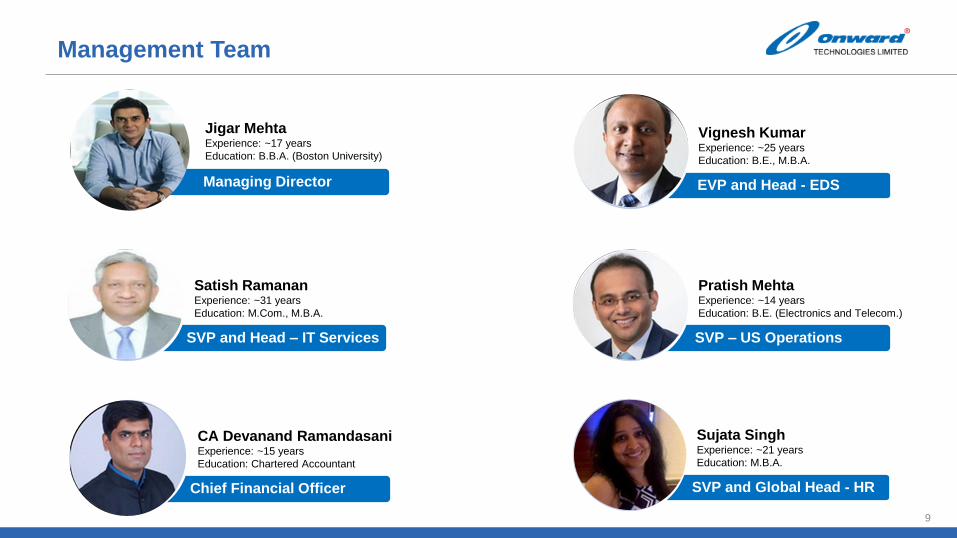
Management Team
Managing Director
Jigar MehtaExperience: ~17 years
Education: B.B.A. (Boston University)
Chief Financial Officer
CA Devanand RamandasaniExperience: ~15 years
Education: Chartered Accountant
9
SVP – US Operations
Pratish MehtaExperience: ~14 years
Education: B.E. (Electronics and Telecom.)
EVP and Head - EDS
Vignesh KumarExperience: ~25 years
Education: B.E., M.B.A.
SVP and Global Head - HR
Sujata SinghExperience: ~21 years
Education: M.B.A.
SVP and Head – IT Services
Satish RamananExperience: ~31 years
Education: M.Com., M.B.A.
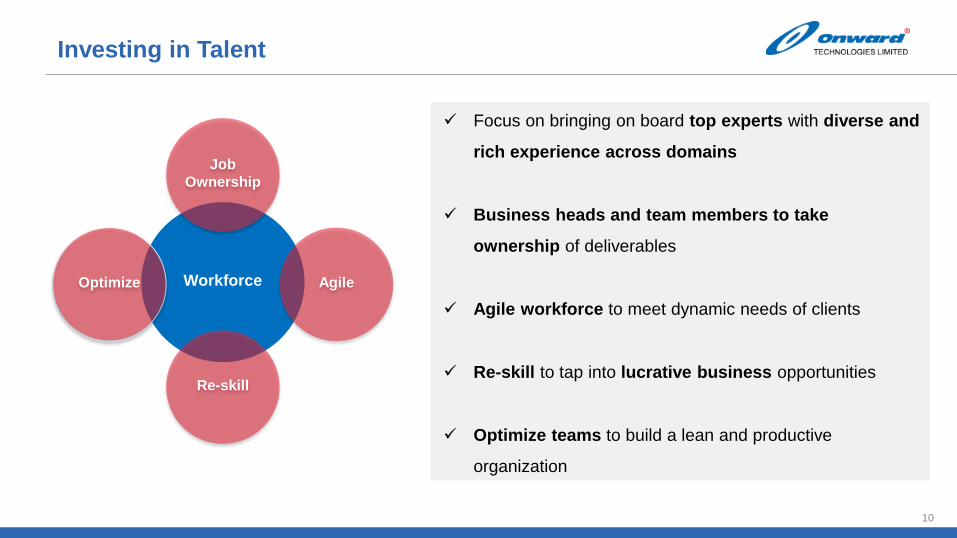
Investing in Talent
Workforce Agile
Job
Ownership
Optimize
Re-skill
Focus on bringing on board top experts with diverse and
rich experience across domains
Business heads and team members to take
ownership of deliverables
Agile workforce to meet dynamic needs of clients
Re-skill to tap into lucrative business opportunities
Optimize teams to build a lean and productive
organization
10

www.onwardgroup.com
// Industry Trends
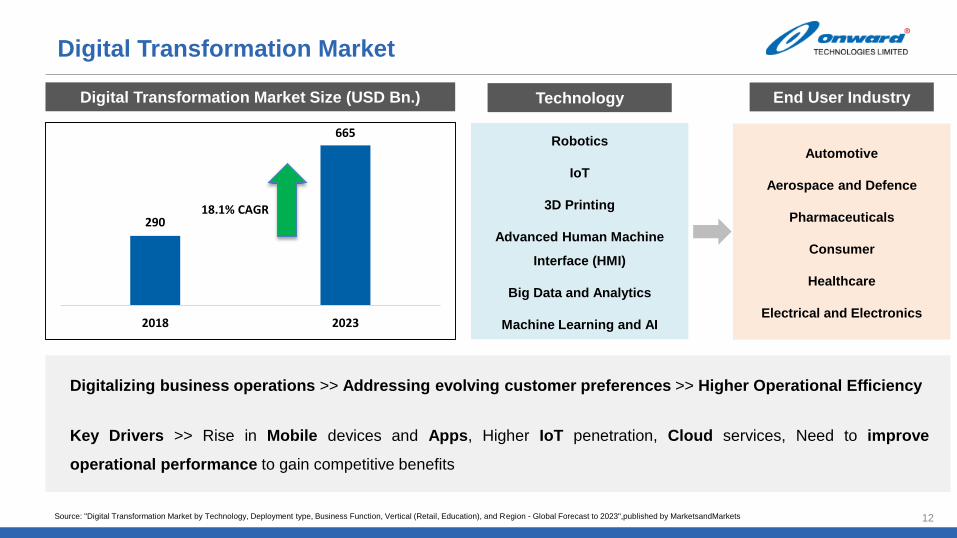
Digital Transformation Market
290
665
2018 2023
Digital Transformation Market Size (USD Bn.)
18.1% CAGR
Digitalizing business operations >> Addressing evolving customer preferences >> Higher Operational Efficiency
Key Drivers >> Rise in Mobile devices and Apps, Higher IoT penetration, Cloud services, Need to improve
operational performance to gain competitive benefits
Automotive
Aerospace and Defence
Pharmaceuticals
Consumer
Healthcare
Electrical and Electronics
Robotics
IoT
3D Printing
Advanced Human Machine
Interface (HMI)
Big Data and Analytics
Machine Learning and AI
Technology End User Industry
Source: "Digital Transformation Market by Technology, Deployment type, Business Function, Vertical (Retail, Education), and Region - Global Forecast to 2023",published by MarketsandMarkets 12
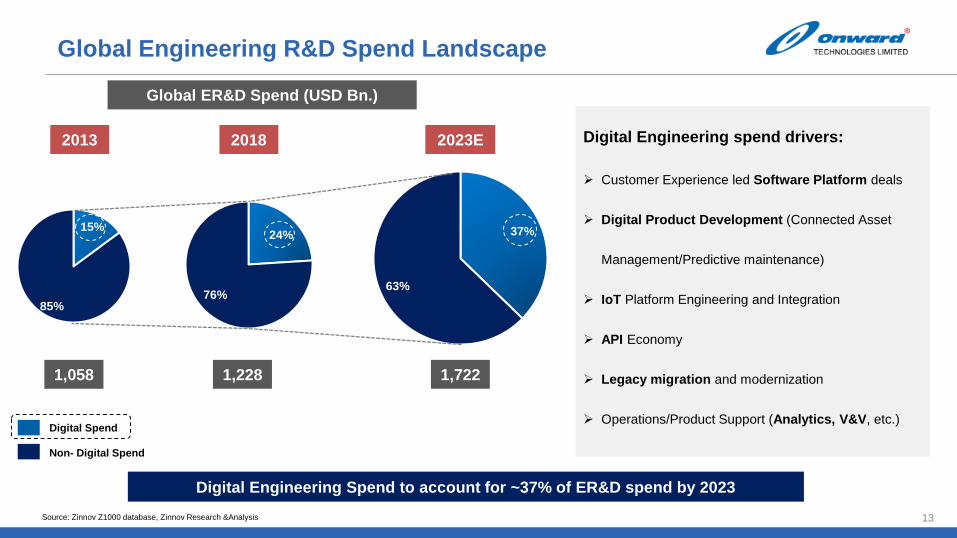
Global Engineering R&D Spend Landscape
15%
85%
24%
76%
37%
63%
Global ER&D Spend (USD Bn.)
2013 2018 2023E
1,058 1,228 1,722
Digital Spend
Non- Digital Spend
Digital Engineering Spend to account for ~37% of ER&D spend by 2023
Digital Engineering spend drivers:
Customer Experience led Software Platform deals
Digital Product Development (Connected Asset
Management/Predictive maintenance)
IoT Platform Engineering and Integration
API Economy
Legacy migration and modernization
Operations/Product Support (Analytics, V&V, etc.)
Source: Zinnov Z1000 database, Zinnov Research &Analysis 13

www.onwardgroup.com
// Business Overview
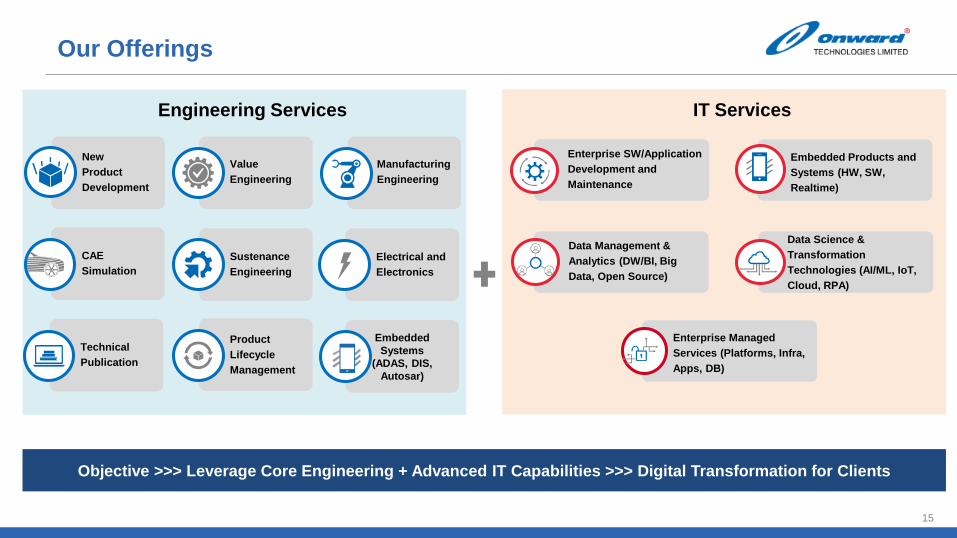
Our Offerings
Engineering Services
New
Product
Development
Value
Engineering
Manufacturing
Engineering
CAE
Simulation
Sustenance
Engineering
Electrical and
Electronics
Technical
Publication
Product
Lifecycle
Management
Embedded
Systems
(ADAS, DIS,
Autosar)
IT Services
Enterprise SW/Application
Development and
Maintenance
Embedded Products and
Systems (HW, SW,
Realtime)
Data Management &
Analytics (DW/BI, Big
Data, Open Source)
Data Science &
Transformation
Technologies (AI/ML, IoT,
Cloud, RPA)
Enterprise Managed
Services (Platforms, Infra,
Apps, DB)
Objective >>> Leverage Core Engineering + Advanced IT Capabilities >>> Digital Transformation for Clients
15
Navigation & Connectivity
HMI, Head-Unit & Infotainment
Lighting, Seat, Keyless entry
EMS/BMS
EV-Motor/Gen./ Trans. Control
ABS, ESP, ESC, Suspension/ Steering,
EPAS
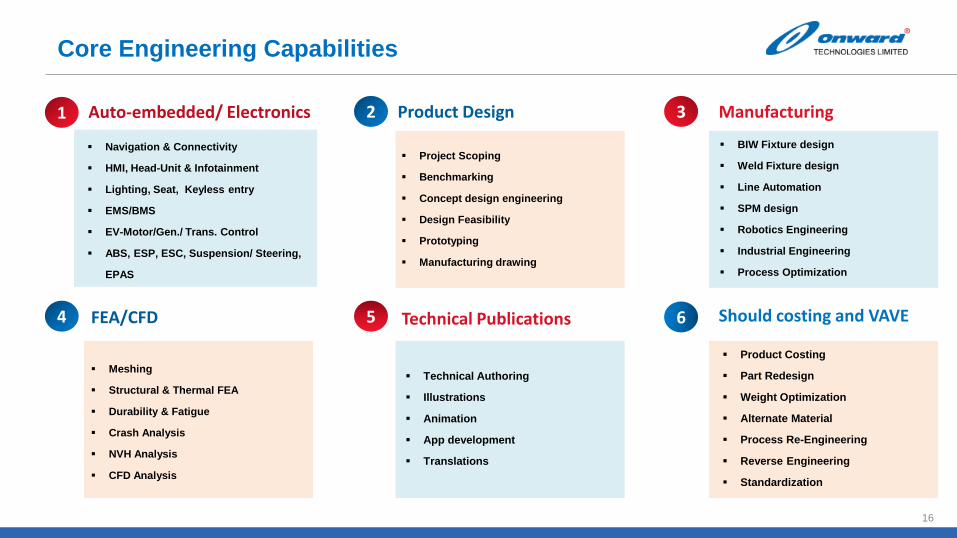
Core Engineering Capabilities
1 Auto-embedded/ Electronics 2 Product Design 3 Manufacturing
4 FEA/CFD 5 Technical Publications 6 Should costing and VAVE
Project Scoping
Benchmarking
Concept design engineering
Design Feasibility
Prototyping
Manufacturing drawing
BIW Fixture design
Weld Fixture design
Line Automation
SPM design
Robotics Engineering
Industrial Engineering
Process Optimization
Meshing
Structural & Thermal FEA
Durability & Fatigue
Crash Analysis
NVH Analysis
CFD Analysis
Technical Authoring
Illustrations
Animation
App development
Translations
Product Costing
Part Redesign
Weight Optimization
Alternate Material
Process Re-Engineering
Reverse Engineering
Standardization
16
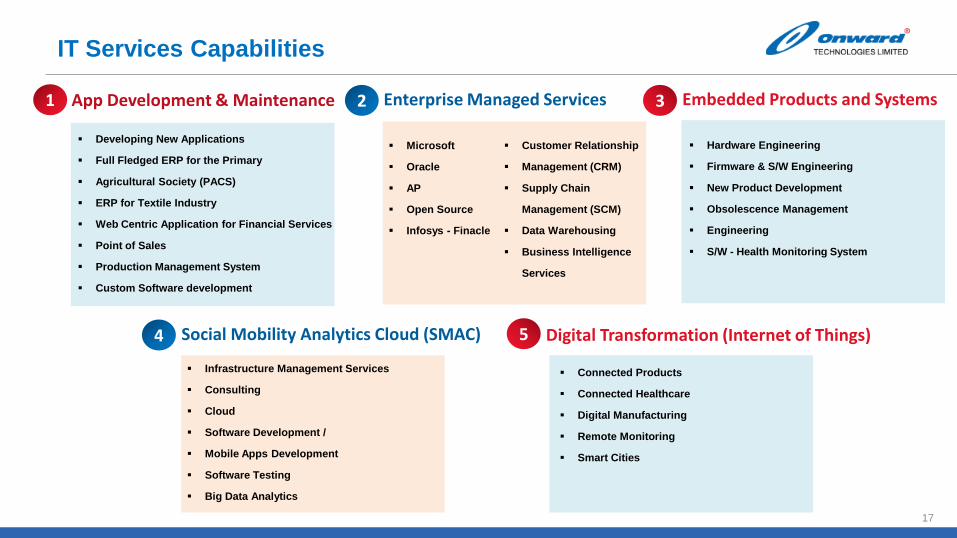
IT Services Capabilities
1 App Development & Maintenance 2 Enterprise Managed Services 3 Embedded Products and Systems
Developing New Applications
Full Fledged ERP for the Primary
Agricultural Society (PACS)
ERP for Textile Industry
Web Centric Application for Financial Services
Point of Sales
Production Management System
Custom Software development
Microsoft
Oracle
AP
Open Source
Infosys - Finacle
Customer Relationship
Management (CRM)
Supply Chain
Management (SCM)
Data Warehousing
Business Intelligence
Services
Hardware Engineering
Firmware & S/W Engineering
New Product Development
Obsolescence Management
Engineering
S/W - Health Monitoring System
4 Social Mobility Analytics Cloud (SMAC) 5 Digital Transformation (Internet of Things)
Infrastructure Management Services
Consulting
Cloud
Software Development /
Mobile Apps Development
Software Testing
Big Data Analytics
Connected Products
Connected Healthcare
Digital Manufacturing
Remote Monitoring
Smart Cities
17
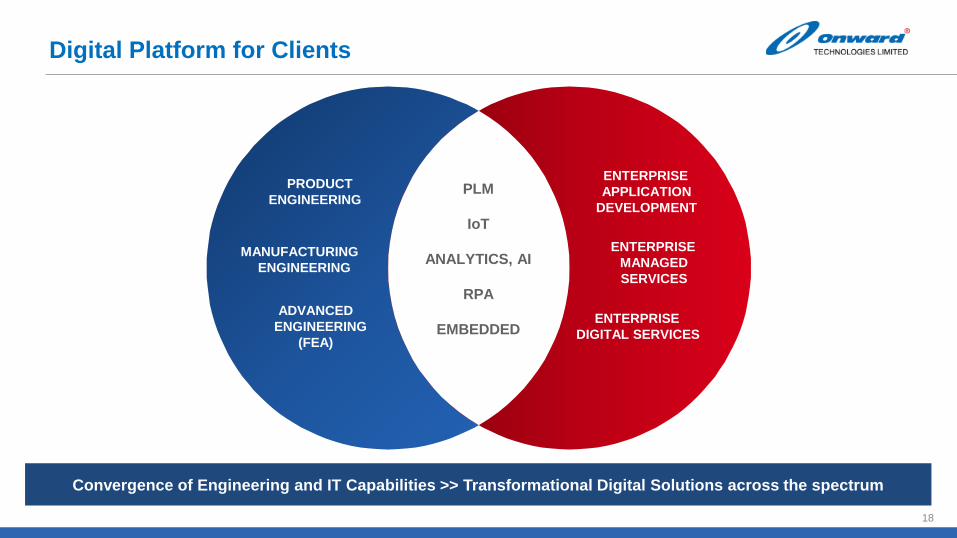
Digital Platform for Clients
PRODUCT
ENGINEERING
MANUFACTURING
ENGINEERING
ADVANCED
ENGINEERING
(FEA)
ENTERPRISE
APPLICATION
DEVELOPMENT
ENTERPRISE
DIGITAL SERVICES
ENTERPRISE
MANAGED
SERVICES
PLM
IoT
ANALYTICS, AI
RPA
EMBEDDED
Convergence of Engineering and IT Capabilities >> Transformational Digital Solutions across the spectrum
18

www.onwardgroup.com
// Strategy and Outlook
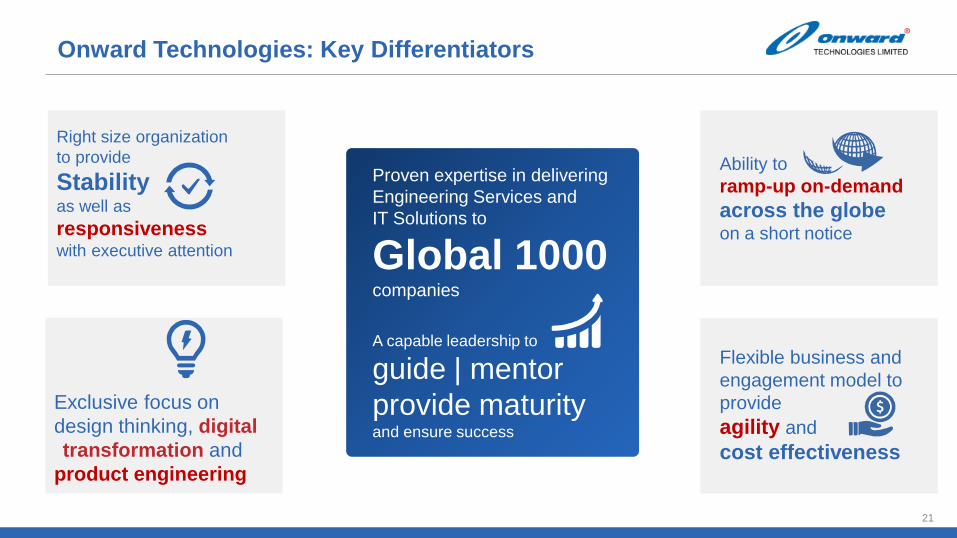
Right size organization
to provide
Stabilityas well as
responsivenesswith executive attention
Flexible business and
engagement model to
provide
agility and
cost effectiveness
Ability to
ramp-up on-demand
across the globeon a short notice
Proven expertise in delivering
Engineering Services and
IT Solutions to
Global 1000companies
A capable leadership to
guide | mentor
provide maturityand ensure success
Exclusive focus on
design thinking, digital
transformation and
product engineering
Onward Technologies: Key Differentiators
21

www.onwardgroup.com
// Quarterly Highlights
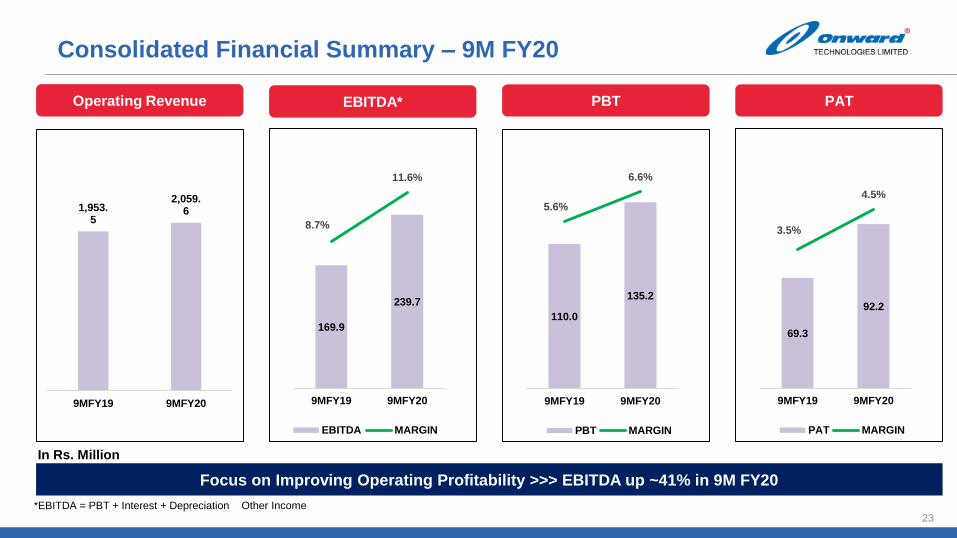
Focus on Improving Operating Profitability >>> EBITDA up ~41% in 9M FY20
Consolidated Financial Summary – 9M FY20
1,953.5
2,059.6
9MFY19 9MFY20
Operating Revenue EBITDA* PBT
110.0
135.2
5.6%
6.6%
9MFY19 9MFY20
PBT MARGIN
In Rs. Million
23
PAT
*EBITDA = PBT + Interest + Depreciation – Other Income
169.9
239.7
8.7%
11.6%
9MFY19 9MFY20
EBITDA MARGIN
69.3
92.2
3.5%
4.5%
9MFY19 9MFY20
PAT MARGIN
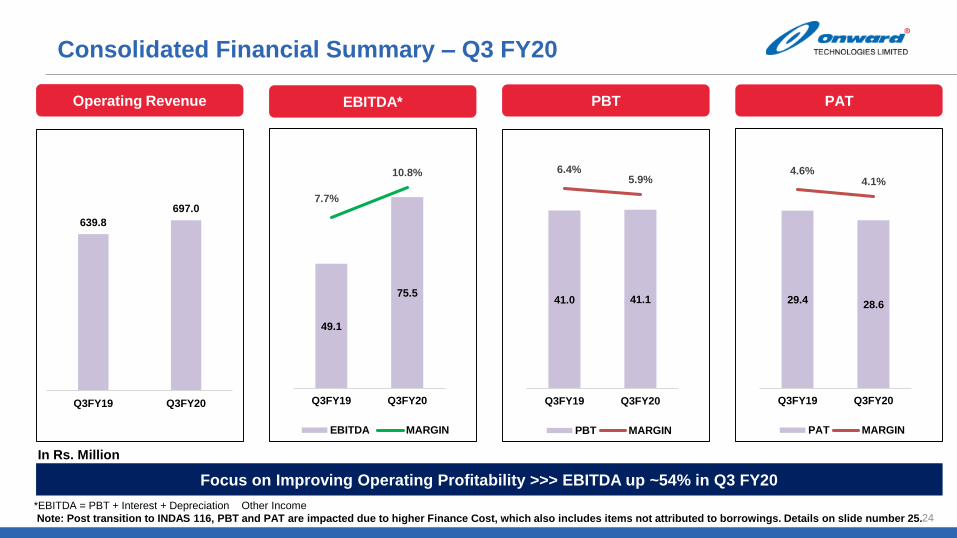
Focus on Improving Operating Profitability >>> EBITDA up ~54% in Q3 FY20
Consolidated Financial Summary – Q3 FY20
639.8
697.0
Q3FY19 Q3FY20
Operating Revenue EBITDA* PBT
41.0 41.1
6.4%5.9%
Q3FY19 Q3FY20
PBT MARGIN
In Rs. Million
24
PAT
49.1
75.5
7.7%
10.8%
Q3FY19 Q3FY20
EBITDA MARGIN
29.4 28.6
4.6%4.1%
Q3FY19 Q3FY20
PAT MARGIN
*EBITDA = PBT + Interest + Depreciation – Other Income
Note: Post transition to INDAS 116, PBT and PAT are impacted due to higher Finance Cost, which also includes items not attributed to borrowings. Details on slide number 25.
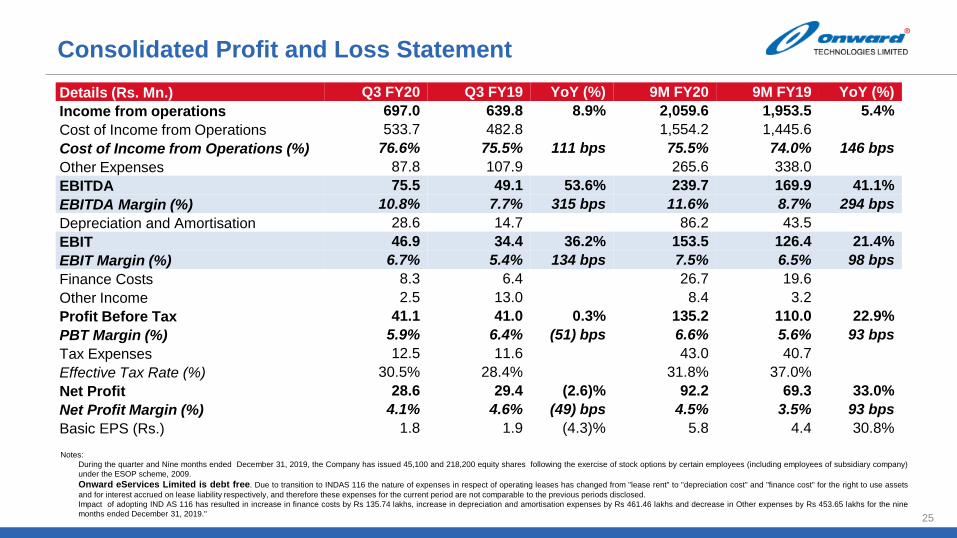
Consolidated Profit and Loss Statement
25
Notes:
• During the quarter and Nine months ended December 31, 2019, the Company has issued 45,100 and 218,200 equity shares following the exercise of stock options by certain employees (including employees of subsidiary company)
under the ESOP scheme, 2009.
• Onward eServices Limited is debt free. Due to transition to INDAS 116 the nature of expenses in respect of operating leases has changed from "lease rent" to "depreciation cost" and "finance cost" for the right to use assets
and for interest accrued on lease liability respectively, and therefore these expenses for the current period are not comparable to the previous periods disclosed.
• Impact of adopting IND AS 116 has resulted in increase in finance costs by Rs 135.74 lakhs, increase in depreciation and amortisation expenses by Rs 461.46 lakhs and decrease in Other expenses by Rs 453.65 lakhs for the nine
months ended December 31, 2019."
Details (Rs. Mn.) Q3 FY20 Q3 FY19 YoY (%) 9M FY20 9M FY19 YoY (%)
Income from operations 697.0 639.8 8.9% 2,059.6 1,953.5 5.4%
Cost of Income from Operations 533.7 482.8 1,554.2 1,445.6
Cost of Income from Operations (%) 76.6% 75.5% 111 bps 75.5% 74.0% 146 bps
Other Expenses 87.8 107.9 265.6 338.0
EBITDA 75.5 49.1 53.6% 239.7 169.9 41.1%
EBITDA Margin (%) 10.8% 7.7% 315 bps 11.6% 8.7% 294 bps
Depreciation and Amortisation 28.6 14.7 86.2 43.5
EBIT 46.9 34.4 36.2% 153.5 126.4 21.4%
EBIT Margin (%) 6.7% 5.4% 134 bps 7.5% 6.5% 98 bps
Finance Costs 8.3 6.4 26.7 19.6
Other Income 2.5 13.0 8.4 3.2
Profit Before Tax 41.1 41.0 0.3% 135.2 110.0 22.9%
PBT Margin (%) 5.9% 6.4% (51) bps 6.6% 5.6% 93 bps
Tax Expenses 12.5 11.6 43.0 40.7
Effective Tax Rate (%) 30.5% 28.4% 31.8% 37.0%
Net Profit 28.6 29.4 (2.6)% 92.2 69.3 33.0%
Net Profit Margin (%) 4.1% 4.6% (49) bps 4.5% 3.5% 93 bps
Basic EPS (Rs.) 1.8 1.9 (4.3)% 5.8 4.4 30.8%

www.onwardgroup.com
// Financial Overview
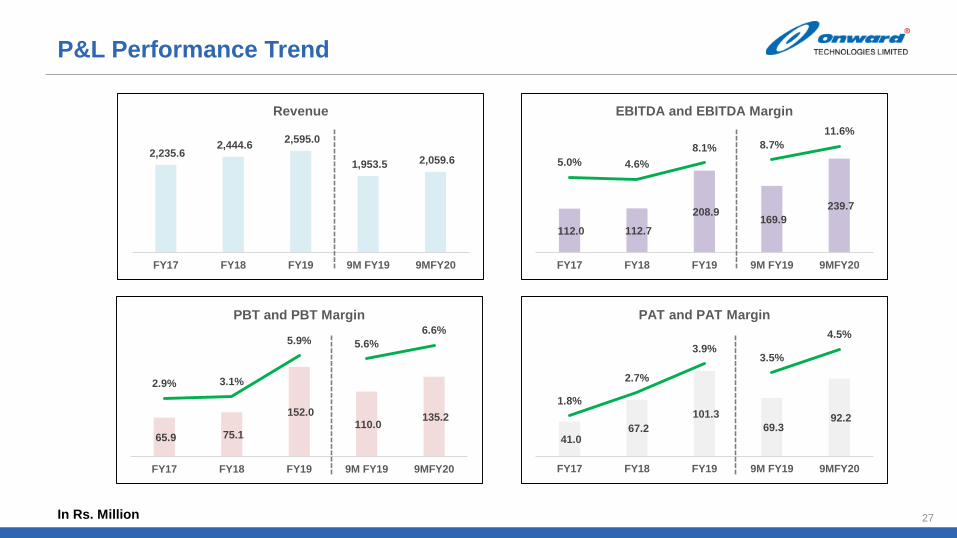
P&L Performance Trend
In Rs. Million 27
2,235.6 2,444.6
2,595.0
1,953.5 2,059.6
FY17 FY18 FY19 9M FY19 9MFY20
Revenue
112.0 112.7
208.9 169.9
239.7
5.0% 4.6%
8.1% 8.7%
11.6%
FY17 FY18 FY19 9M FY19 9MFY20
EBITDA and EBITDA Margin
65.9 75.1
152.0 110.0
135.2
2.9% 3.1%
5.9% 5.6%
6.6%
FY17 FY18 FY19 9M FY19 9MFY20
PBT and PBT Margin
41.0 67.2
101.3
69.3 92.2
1.8%
2.7%
3.9%3.5%
4.5%
FY17 FY18 FY19 9M FY19 9MFY20
PAT and PAT Margin
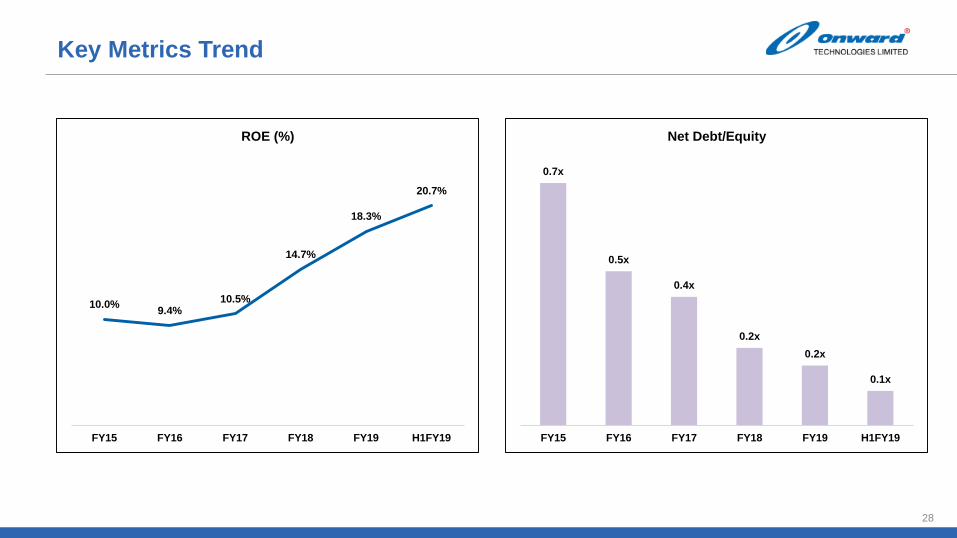
Key Metrics Trend
10.0%9.4%
10.5%
14.7%
18.3%
20.7%
FY15 FY16 FY17 FY18 FY19 H1FY19
ROE (%)
0.7x
0.5x
0.4x
0.2x
0.2x
0.1x
FY15 FY16 FY17 FY18 FY19 H1FY19
Net Debt/Equity
28
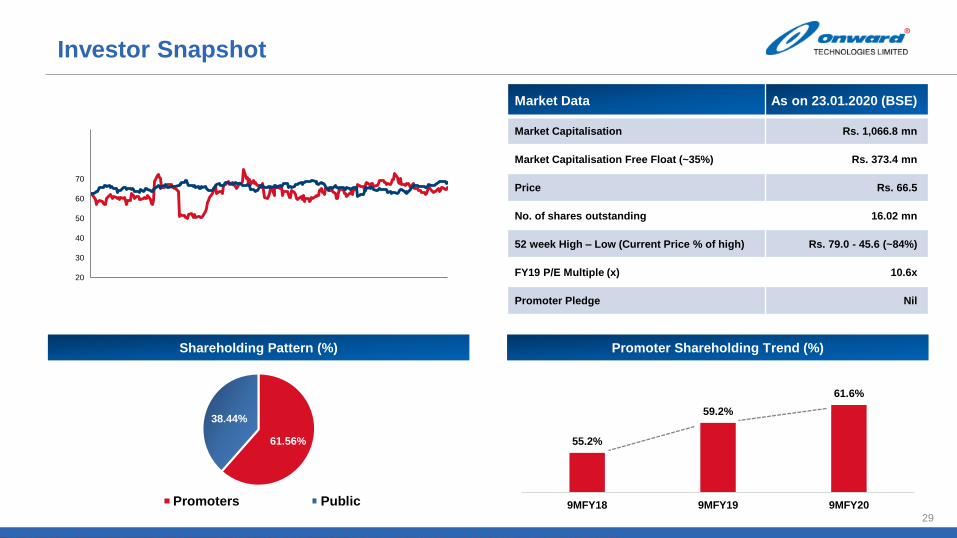
Investor Snapshot
Shareholding Pattern (%)
Market Data As on 23.01.2020 (BSE)
Market Capitalisation Rs. 1,066.8 mn
Market Capitalisation Free Float (~35%) Rs. 373.4 mn
Price Rs. 66.5
No. of shares outstanding 16.02 mn
52 week High – Low (Current Price % of high) Rs. 79.0 - 45.6 (~84%)
FY19 P/E Multiple (x) 10.6x
Promoter Pledge Nil
29
61.56%
38.44%
Promoters Public
Promoter Shareholding Trend (%)
55.2%
59.2%
61.6%
9MFY18 9MFY19 9MFY20
20
30
40
50
60
70
7070
Disclaimer
30
This presentation contains statements that contain “forward looking statements” including, but without limitation,
statements relating to the implementation of strategic initiatives, and other statements relating to Onward
Technologies future business developments and economic performance. While these forward-looking statements
indicate our assessment and future expectations concerning the development of our business, a number of risks,
uncertainties and other unknown factors could cause actual developments and results to differ materially from our
expectations. These factors include, but are not limited to, general market, macro-economic, governmental and
regulatory trends, movements in currency exchange and interest rates, competitive pressures, technological
developments, changes in the financial conditions of third parties dealing with us, legislative developments, and other
key factors that could affect our business and financial performance. Onward Technologies undertakes no obligation
to publicly revise any forward-looking statements to reflect future / likely events or circumstances.

www.onwardgroup.com
// THANK YOU
Onward Technologies Limited
2nd Floor, Sterling Centre, Dr A.B. Road,
Worli, Mumbai – 400018
CIN: L28920MH1991PLC062542
Investor Relations Contact:
Prasan Abichandani – VP (Corporate Finance and IR)
Email ID: [email protected]
Rohan Rege – Churchgate Partners
Email ID: [email protected]
Contact No.: +91 22 6269 5988
Onward Technologies Limited is a global player in Mechanical engineering design and IT consulting services. Onward offers
a range of engineering design services including product design, engineering analysis, engineering documentation and
maintenance, and manufacturing solutions, and training for automotive, off highway, aerospace, industrial equipment and
consumer goods. The Company has its footprints with operations in India, North America, Germany & UK. Its global design
& delivery centers are present in Pune, Chennai, Mumbai & Bangalore. OTL has grown to 2000+ employees globally
servicing Fortune 1000 companies.