Embed Size (px)
Citation preview
CS 686—INTRODUCTION TO ARTIFICIAL INTELLIGENCE
Creating A Trip Prediction Model For Riders of ElectricBicycles
Christian Gorenflo (20612801)
December 20, 2015
In this project I create a model to predict the use of an electric bicycle at a specific time(hour, day of week, month) based on the recorded riding history of single study participantsof the WeBike project. The assumption under scrutiny is if submodels on multiple time-scalescan be learned independently and then superimposed the achieve a unified prediction model.
1 INTRODUCTION1
Global Warming will be a very real threat to modern society in the coming years. The damage done bysevere weather conditions will raise the government expenses dramatically. Additionally, the increase inthe average global temperature will have dire consequences for harvesting crops all over the world.
In light of the recent agreement at the 2015 United Nations Climate Change Conference to limit thewarming "to well below 2°C" [1] and the current state of an increase of already about 1°C [2], it is paramountto take action. It will probably not be possible to reach the goal by improving technology alone, a changein consumer behaviour will also have to accompany it.
Climate change is mainly driven by the excessive emission of greenhouse gasses like CO (carbonmonoxide), CO2 (carbon dioxide) and CH4 (methane). The transportation sector is a major producer of
1DISCLAIMER—I, Christian Gorenflo, use the data of the WeBike project for another course project. Therefore parts of theIntroduction and the WeBike project section might resemble or equal these sections in the other report. For the other project,I develpoed a smart watch app together with a partner. This app uses non-monetary incentives for riders to help increaseengagement and frequency of bike use. We base this on an online clustering algorithm that distributes riders to clusters basedon their riding behavior (trip frequency, trip length etc.). There is no overlap in the original research done for the two projects.
1
these gasses as most vehicles are fuel driven and exhaust (primarily) carbon oxides in the process. In thisproject, I focus on the sector of privately owned vehicles — mainly cars and bicycles.
Nowadays, many people use their car even for short trips that could easily be done riding a bike oreven on foot. As long as the price of gas is low enough that these trip don’t become noticeable financially,convenience and comfort will far outweigh any regard for the environment. However, raising gas prices toa point where short trips financially hurt people would elevate cars to a luxury item and in turn lead toohuge ramifications for society. On the other hand changing the perception of a majority of the populationfor the dangers of climate change before severe consequences actually happen—it would be to latethen—is an unrealistic thought.
Technological improvements can work, provided they don’t suffer from disadvantages in comparisonto current solutions. Namely, they need to be at least as comfortable and convenient as establishedtechnology and be available at a comparable price, if they don’t have any additional appeal (e.g., as astatus symbol). However, if technology changes to drastically, consumers will mistrust it regardless ofequal benefits to known solutions. For example, electric cars have a high buy-in cost and shorter rangethan traditional cars. Even though lower energy prices might make up for the price difference in the longrun, the perceived financial benefit and greater convenience due to wider range of gas fueled cars hamperthe adoption of this new technology.
This report is based on the work of the WeBike project [3] [4], which uses technological improvementsto increase the convenience of a car alternative. The goal of this course project is to develop a betterunderstanding for the riding behaviour of study participants by learning a prediction model for trips withthe electric bicycle.
1.1 THE WeBike PROJECT1
1.1.1 ELECTRIC BICYCLES
As stated before, many people shun from using their bicycle to do even short trips out of a perceivedinconvenience compared to using their car. This fact can be partially mitigated by making bicycles moreappealing. One Solution is to equip bicycles with an electric motor to support the efforts of the rider. Evenso—for electric cars—skepticism towards this technology born from range anxiety exists in the generalpopulation. To study the concerns and the adoption behaviour of electric bicycles, a project called WeBike[3][4] by the ISS4E group at the University of Waterloo started in mid 2014.
After a survey, a fleet of about 30 electric bicycles (e-bikes) were distributed among University facultyand students who participated in the study. These e-bikes are equipped with a battery that has a capacityto support the rider for about 40km and a sensor kit that is attached to the battery. This sensor kit consistsmainly of a Samsung Galaxy S3 smart phone with its built-in sensors (GPS, clock, gyroscope, accelerometer,magnetometer) and additional sensors for measuring ambient temperature and charge/discharge currentand voltage. The sensor kit is automatically charged directly from the battery.
The battery plus sensor kit can be removed from the e-bike and carried with the rider in order to chargeit from a power supply. In order to preserve energy and therefore the supported range of the e-bike,the sensors are currently only activated twice per minute for 2 seconds. This resolution is high enough
2
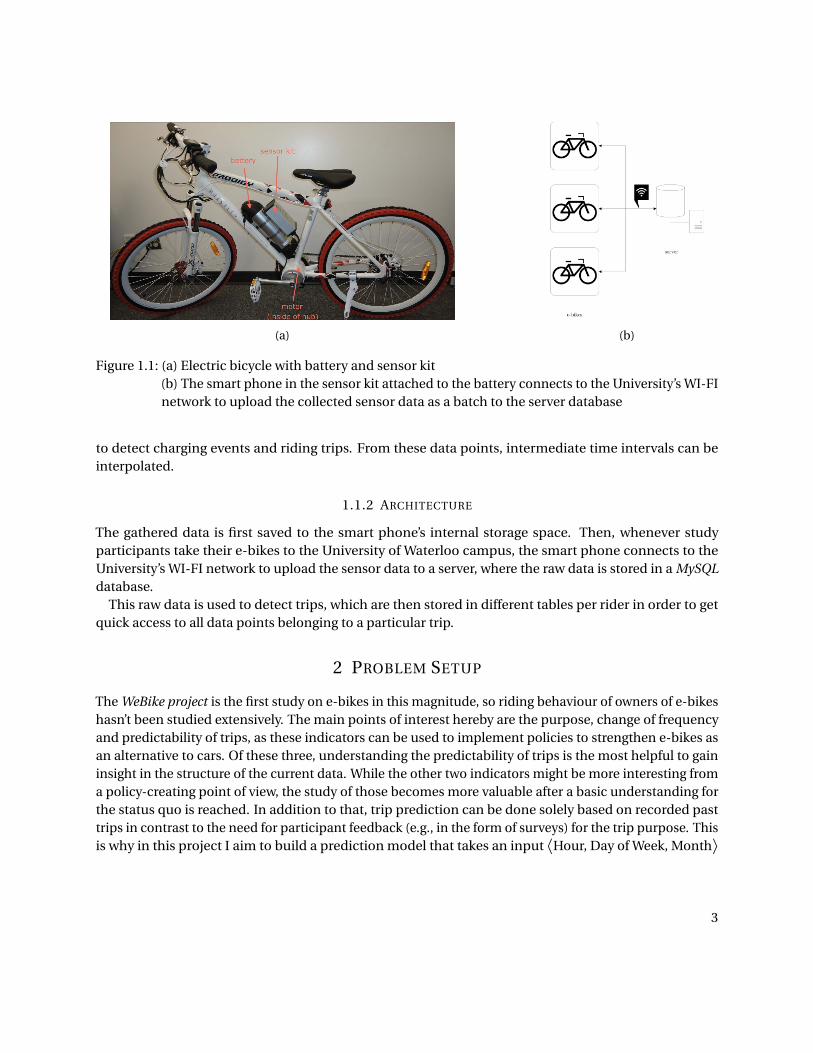
(a) (b)
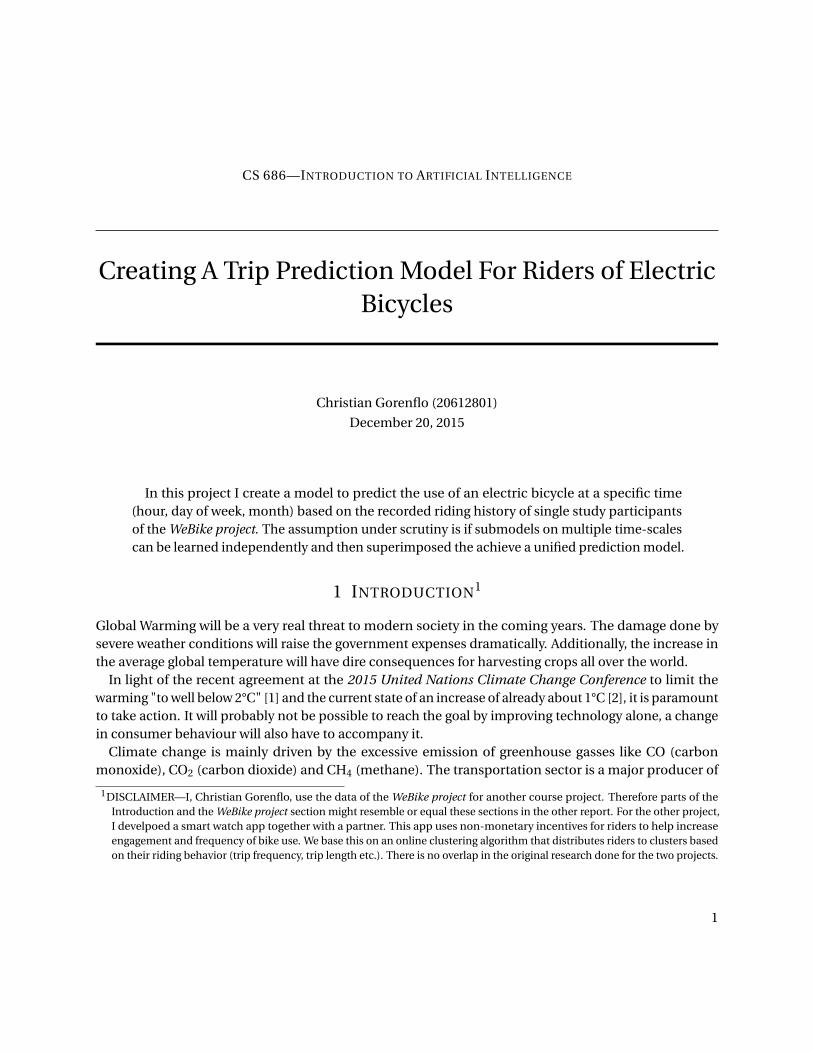
Figure 1.1: (a) Electric bicycle with battery and sensor kit(b) The smart phone in the sensor kit attached to the battery connects to the University’s WI-FInetwork to upload the collected sensor data as a batch to the server database
to detect charging events and riding trips. From these data points, intermediate time intervals can beinterpolated.
1.1.2 ARCHITECTURE
The gathered data is first saved to the smart phone’s internal storage space. Then, whenever studyparticipants take their e-bikes to the University of Waterloo campus, the smart phone connects to theUniversity’s WI-FI network to upload the sensor data to a server, where the raw data is stored in a MySQLdatabase.
This raw data is used to detect trips, which are then stored in different tables per rider in order to getquick access to all data points belonging to a particular trip.
2 PROBLEM SETUP
The WeBike project is the first study on e-bikes in this magnitude, so riding behaviour of owners of e-bikeshasn’t been studied extensively. The main points of interest hereby are the purpose, change of frequencyand predictability of trips, as these indicators can be used to implement policies to strengthen e-bikes asan alternative to cars. Of these three, understanding the predictability of trips is the most helpful to gaininsight in the structure of the current data. While the other two indicators might be more interesting froma policy-creating point of view, the study of those becomes more valuable after a basic understanding forthe status quo is reached. In addition to that, trip prediction can be done solely based on recorded pasttrips in contrast to the need for participant feedback (e.g., in the form of surveys) for the trip purpose. Thisis why in this project I aim to build a prediction model that takes an input
⟨Hour, Day of Week, Month
⟩
3

0 2 4 6 8 10 12 14 16 18 20 22 24 26 28 30 32
0
200
400
Participants
Tota
lnu
mb
ero
ftri
ps
Figure 2.1: The total number of trips every participant of the study has completed (as of Dec 2015)
and outputs the probability of a trip at that given time in the future.Data has been collected since June 2014 with a total of over 5000 detected trips. The range of the number
of trips per participant is shown in figure 2.1.
3 MODEL CREATION
The basic assumption for building a prediction model in this project is the following: Given definite datafor past trips of a specific e-bike rider, a prediciton model can be built by analyzing the trips on separatediscrete time scales. After building these sub-models, a unified prediction model can be achieved bysuperposition of the weighted sub-models. In the following I will describe the creation of the sub-models,three varieties of superposition and I will analyze the results.
3.1 SUB-MODELS
There exist four obvious recurring time patterns human-beings in a society tend to follow:
• Daily cycles
• Weekly cycles
• Monthly cycles
• Yearly cycles
I chose to evaluate the daily, weekly and yearly cycles by analyzing the trip distributions sorted byhour of day (daily cycle), day of week (weekly cycle) and month (yearly cycle). While for other studies
4
0 2 4 6 8 10 12 14 16 18 20 22 24Hour of day
Trip
dis
trib
uti
on
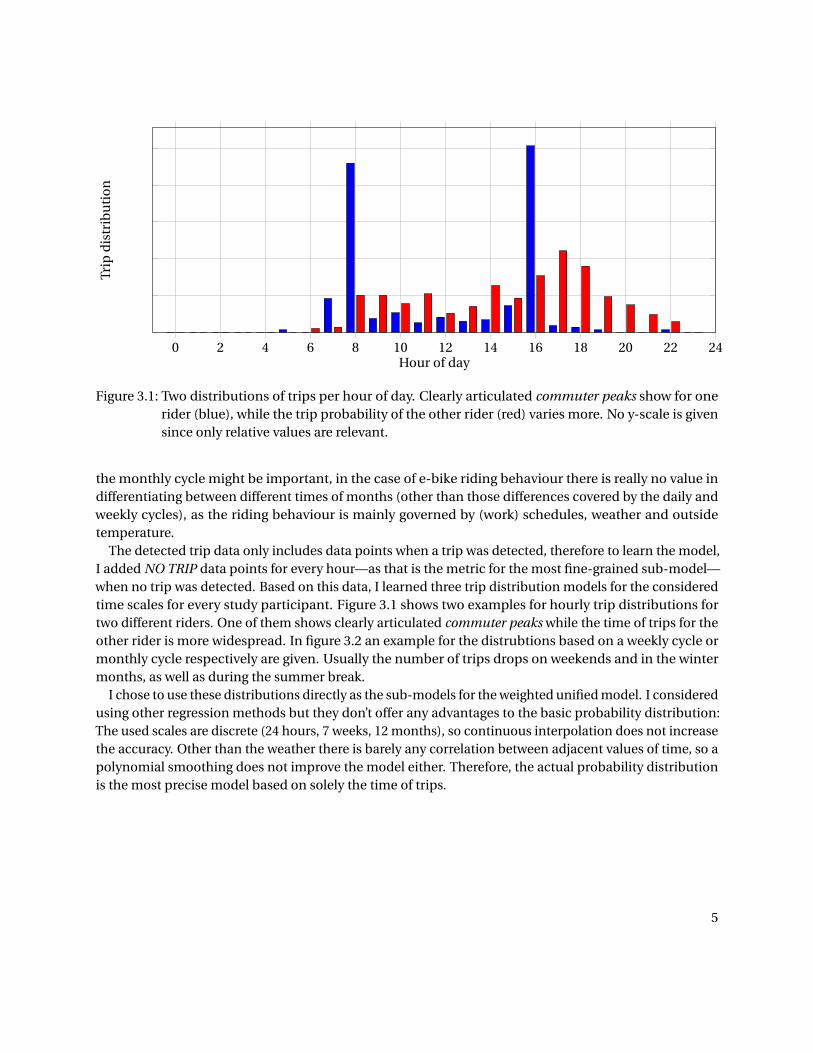
Figure 3.1: Two distributions of trips per hour of day. Clearly articulated commuter peaks show for onerider (blue), while the trip probability of the other rider (red) varies more. No y-scale is givensince only relative values are relevant.
the monthly cycle might be important, in the case of e-bike riding behaviour there is really no value indifferentiating between different times of months (other than those differences covered by the daily andweekly cycles), as the riding behaviour is mainly governed by (work) schedules, weather and outsidetemperature.
The detected trip data only includes data points when a trip was detected, therefore to learn the model,I added NO TRIP data points for every hour—as that is the metric for the most fine-grained sub-model—when no trip was detected. Based on this data, I learned three trip distribution models for the consideredtime scales for every study participant. Figure 3.1 shows two examples for hourly trip distributions fortwo different riders. One of them shows clearly articulated commuter peaks while the time of trips for theother rider is more widespread. In figure 3.2 an example for the distrubtions based on a weekly cycle ormonthly cycle respectively are given. Usually the number of trips drops on weekends and in the wintermonths, as well as during the summer break.
I chose to use these distributions directly as the sub-models for the weighted unified model. I consideredusing other regression methods but they don’t offer any advantages to the basic probability distribution:The used scales are discrete (24 hours, 7 weeks, 12 months), so continuous interpolation does not increasethe accuracy. Other than the weather there is barely any correlation between adjacent values of time, so apolynomial smoothing does not improve the model either. Therefore, the actual probability distributionis the most precise model based on solely the time of trips.
5
Sunday
Monday
Tuesday
Wednesd
ay
Thursday
Friday
Saturd
ay
Trip
dis
trib
uti
on
January
Febuary
Marc
hApril
May
June
July
August
Septem
ber
October
November
December
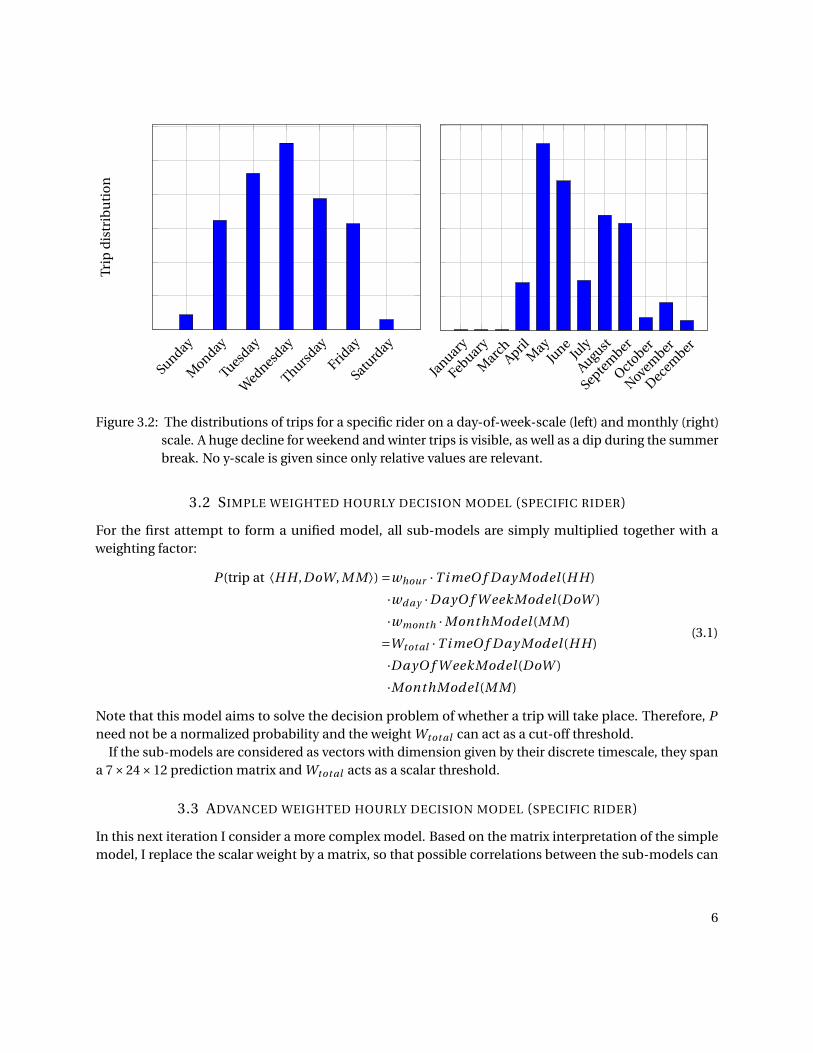
Figure 3.2: The distributions of trips for a specific rider on a day-of-week-scale (left) and monthly (right)scale. A huge decline for weekend and winter trips is visible, as well as a dip during the summerbreak. No y-scale is given since only relative values are relevant.
3.2 SIMPLE WEIGHTED HOURLY DECISION MODEL (SPECIFIC RIDER)
For the first attempt to form a unified model, all sub-models are simply multiplied together with aweighting factor:
P (trip at ⟨H H ,DoW, M M⟩) =whour ·T i meO f Day Model (H H)
·wd ay ·DayO f W eekModel (DoW )
·wmonth ·MonthModel (M M)
=Wtot al ·T i meO f Day Model (H H)
·DayO f W eekModel (DoW )
·MonthModel (M M)
(3.1)
Note that this model aims to solve the decision problem of whether a trip will take place. Therefore, Pneed not be a normalized probability and the weight Wtot al can act as a cut-off threshold.
If the sub-models are considered as vectors with dimension given by their discrete timescale, they spana 7×24×12 prediction matrix and Wtot al acts as a scalar threshold.
3.3 ADVANCED WEIGHTED HOURLY DECISION MODEL (SPECIFIC RIDER)
In this next iteration I consider a more complex model. Based on the matrix interpretation of the simplemodel, I replace the scalar weight by a matrix, so that possible correlations between the sub-models can
6
be taken into account.
P (trip at ⟨H H ,DoW, M M⟩) =whour (H H)T i meO f Day Model (H H)
·wd ay · (DoW )DayO f W eekModel (DoW )
·wmonth · (M M)MonthModel (M M)
=Wtot al (⟨H H ,DoW, M M⟩) ·T i meO f Day Model (H H)
·DayO f W eekModel (DoW )
·MonthModel (M M)
(3.2)
3.4 MODEL LEARNING AND VALIDATION
I decided to implement cross validation to asses the models. Since the WeBike project started little over ayear ago, taking out a specific block of trips for validation would seriously hamper especially the learningof the weights for the month sub-model. Therefore I randomly selected 10% of the data for validation andthe rest for training. After training, I validated the learned model against the validation set and recordedthe accuracy of the model. I repeated this process 10 times to get different random samples. Then I chosethe average over all validation cycles as the mean accuracy of the model.
With cross validation it is paramount to never let the validation result inform the learning of the model,otherwise the model becomes meaningless, because it has been learned on the complete data set.
For learning the weights I implemented an evolutionary algorithm: I start with a random seed of weights.After evaluating the best 10 weight combinations, 500 new weights are generated by applying a randomfactor 1±α, with α bound by an ever-decreasing learning rate. Then again the best 10 weights are chosenfor the next round and the process is repeated until the termination condition is reached.
During the learning process, the weights are evaluated by calculating P for a specific set of weights andthen repeating a monte carlo simulation 20 times to compare the outcome with the actual value (TRIP orNO TRIP).
The analysis of the models lead to two insights:
• The time of a trip varies greatly from day to day for a majority of riders, therefore a meaningfuldecision model could not be achieved,
• For the few riders with articulated commuter peaks, the chosen models were not able to accuratelylearn them.
When the change in accuracy of the learned model was chosen as the termination condition and onlythe weights that lead to the best accuracy would seed the next round, the model would always converge topredict no trips at all. The reason behind this is that given all the hours of the day, the number of NO TRIPdata points vastly outnumbers the TRIP points. Therefore I chose the F-Measure as a metric to evaluatethe model. As seen in figure 3.3, this leads to the best learned model being outperformed by the modelthat never predicts any trip. The data shon in that figure originates from the learned model with matrix
7
0 5 10 15 20 25 300.9
0.92
0.94
0.96
0.98
1
Participants
Acc
ura
cytraining datatest datanever ride model
0 5 10 15 20 25 300.1
0.15
0.2
ParticipantsF
-Mea
sure
training datatest data
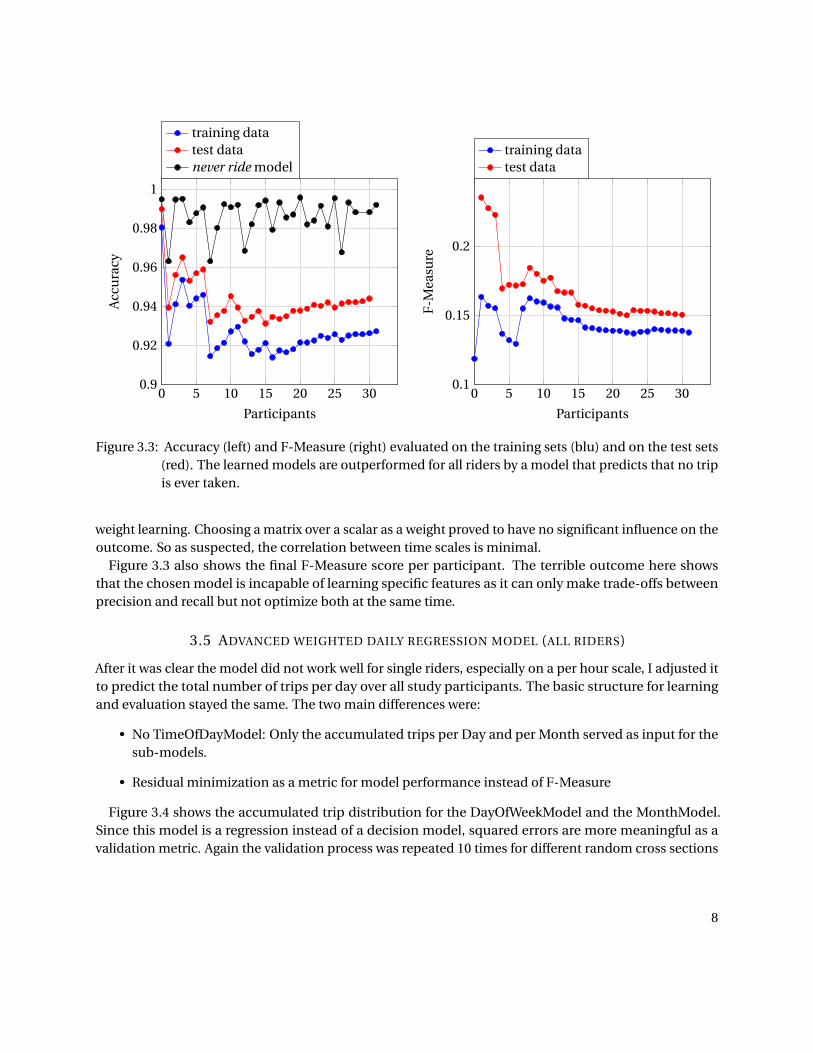
Figure 3.3: Accuracy (left) and F-Measure (right) evaluated on the training sets (blu) and on the test sets(red). The learned models are outperformed for all riders by a model that predicts that no tripis ever taken.
weight learning. Choosing a matrix over a scalar as a weight proved to have no significant influence on theoutcome. So as suspected, the correlation between time scales is minimal.
Figure 3.3 also shows the final F-Measure score per participant. The terrible outcome here showsthat the chosen model is incapable of learning specific features as it can only make trade-offs betweenprecision and recall but not optimize both at the same time.
3.5 ADVANCED WEIGHTED DAILY REGRESSION MODEL (ALL RIDERS)
After it was clear the model did not work well for single riders, especially on a per hour scale, I adjusted itto predict the total number of trips per day over all study participants. The basic structure for learningand evaluation stayed the same. The two main differences were:
• No TimeOfDayModel: Only the accumulated trips per Day and per Month served as input for thesub-models.
• Residual minimization as a metric for model performance instead of F-Measure
Figure 3.4 shows the accumulated trip distribution for the DayOfWeekModel and the MonthModel.Since this model is a regression instead of a decision model, squared errors are more meaningful as avalidation metric. Again the validation process was repeated 10 times for different random cross sections
8

Sunday
Monday
Tuesday
Wednesd
ay
Thursday
Friday
Saturd
ay
Trip
dis
trib
uti
on
January
Febuary
Marc
hApril
May
June
July
August
Septem
ber
October
November
December
Figure 3.4: The distribution of all accumulated trips on a day-of-week-scale (left) and monthly (right)scale. The dips for weekend, summer break and winter trips are smoothed out. No y-scale isgiven since only relative values are relevant.
of the data. Even for this regression, the proposed model did not perform well. For training, the standarddeviation valued σ= 6.56 while running on the validation data set, the standard deviation was σ= 5.84.This means on average, the model had an error of about 30%.
4 RELATED WORK
Asefa et al.[5] have shown that remarkable results can be achieved with support vector machines (SVMs)on data time lines of differing scales. However, they do apply their algorithm to a regression probleminstead of a decision problem and their data does not suffer from a huge skew towards a specific value.
Bakker and Heskes [6] showcase a way to implement a hierarchical neural network, where differentindependent tasks can share information between them. It remains an open question if this can beapplied to the problem of combining models of different time scales.
Sundstrom et al.[7] tackle a similar prediction problem to the one in this project. They choose toimplement a Markov model based on location data of an electric car. This appears to be a more fruitfulapproach than the location-ignoring approach in this project.
9
5 CONCLUSION
I have shown that weighted prediction models based solely on the trip distribution on different time scalesis unsuitable for the problem of e-bike trip prediction. The first reason for that is that the time of tripsvaries greatly from day to day and might be influenced by effects not covered by the sensor data (e.g., badweather periods, injuries,...). A coarser TimeOfDayModel based on hour intervals might be better suitedto catch some uncertainties through a more fuzzy prediction.
On the other hand, it became apparent that in light of the heavily skewed ratio between timespan oftrips and timespan of no trips it is paramount to only learn features of the distribution that are actuallypredictable like commuter peaks instead of learning the complete distribution. As future work, a neuralnet that specializes on specific features might prove more suitable. Additionally, future research shouldtake into account supplementary sensor data like GPS and outside temperature.
REFERENCES
[1] United Nations. Adoption of the paris agreement. In 2015 United Nations Climate Change Conference,2015.
[2] Stocker, T.F., D. Qin, G.-K, Plattner, M. Tignor, S.K. Allen, J. Boschung, A. Nauels, Y. Xia, V. Bex, andP.M. Midgley (eds.). Summary for policymakers. in: Climate change 2013: The physical sciencebasis.contribution of working group i to the fifth assessment report of the intergovernmental panel onclimate change. In IPCC. Cambridge University Press, Cambridge, United Kingdom and New York, NY,USA, 2013.
[3] Tommy Carpenter. Measuring & Mitigating Electric Vehicle Adoption Barriers. PhD thesis, Universityof Waterloo, 2015.
[4] ISS4E group. Webike web page. http://blizzard.cs.uwaterloo.ca/iss4e/?page_id=3661,2015.
[5] Tirusew Asefa, Mariush Kemblowski, Mac McKee, and Abedalrazq Khalil. Multi-time scale stream flowpredictions: The support vector machines approach. Journal of Hydrology, 318(1–4):7 – 16, 2006.
[6] Bart Bakker and Tom Heskes. Task clustering and gating for bayesian multitask learning. J. Mach.Learn. Res., 4:83–99, December 2003.
[7] O. Sundstrom, O. Corradi, and C. Binding. Toward electric vehicle trip prediction for a charging serviceprovider. In Electric Vehicle Conference (IEVC), 2012 IEEE International, pages 1–6, March 2012.
10


![Licensing MotorcycleRiders’ Handbookironbrothersmc.com/motors/[Riders' book]/Riders' handbook.pdf · MotorcycleRiders’ Handbook. Motorcycle Riders’ Handbook Learner Approved](https://img.pdfslide.net/doc/110x75/5a7801147f8b9ad22a8e985c/licensing-motorcycleriders-ha-riders-bookriders-handbookpdf-motorcycleriders.jpg)