Embed Size (px)
Citation preview
Creating and delivering value
in the ASEAN steel industry
Edwin Basson, Director General, worldsteel

Disclaimer text
This document is protected by copyright. Distribution to third parties or reproduction
in any format is not permitted without written permission from worldsteel. worldsteel
operates under the strictest antitrust guidelines. Visit worldsteel.org\About us for
detailed antitrust guidelines.

Global framework
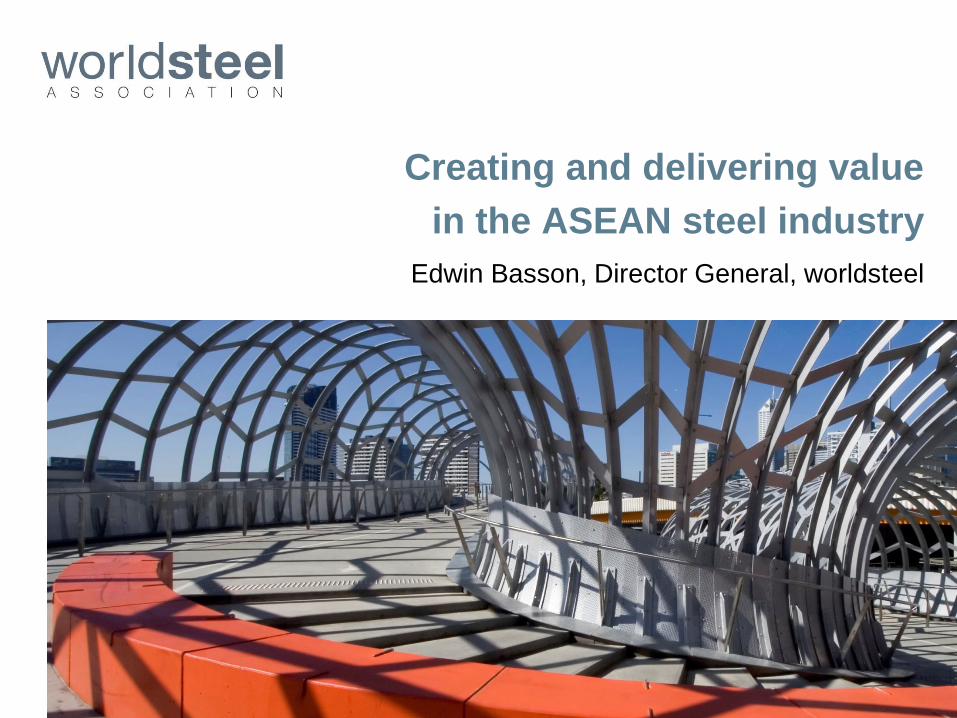
Steel industry faces new challenge of low growth
4
474 447300 373 397 389 388 412 413 420
329 332
299348 374 391 406 415 425 442
418 447551
588641 660 735 711 707 704
6.8
0.4
-6.1
13.7
7.9
2.0
6.2
0.6 0.5 1.4
0
500
1 000
1 500
2 000
2 500
-50
-45
-40
-35
-30
-25
-20
-15
-10
-5
0
5
10
15
2007 2008 2009 2010 2011 2012 2013 2014 2015 2016
Developed, Mt Developing ex China, Mt
China, Mt World, y-o-y % growth
-40
-30
-20
-10
0
10
20
30
2007 2008 2009 2010 2011 2012 2013 2014 2015 2016
China Developing ex China Developed
y-o-y % growth
Apparent Steel Use, finished steel (SRO April 2015)

Regional Summary Apparent Steel Use, finished steel (SRO April 2015)
2014 2015 2016 14/13 15/14 16/152016 as
% of 2007
World 1 537.3 1 544.4 1 565.5 0.6 0.5 1.4 128.2
European Union (28) 146.8 149.9 154.1 4.5 2.1 2.8 76.9
Other Europe 37.0 38.0 38.5 0.2 2.8 1.4 126.6
CIS 56.5 52.4 52.2 -4.9 -7.3 -0.3 92.7
NAFTA 144.6 143.3 145.1 11.3 -0.9 1.3 103.0
Central & South America 48.1 46.5 48.1 -3.9 -3.4 3.4 116.4
Africa 36.9 39.6 41.5 4.2 7.4 4.9 182.4
Middle East 51.9 53.3 55.6 3.7 2.8 4.2 126.7
Asia & Oceania 1 015.6 1 021.5 1 030.4 -1.0 0.6 0.9 150.3
China 710.8 707.2 703.7 -3.3 -0.5 -0.5 168.2
million tonnes (Mt) %
5

ASEAN region

Short & medium term outlook in ASEAN strong…
The ASEAN region expected to see the fastest growth among
developing countries and to exceed the world average.
7
Source: IHS April 2015
Real GDP growth (5-year averages)
2000-04 2005-09 2010-14 2015-2019
NAFTA 2.7 1.0 2.3 2.7
S.America 2.4 4.2 3.5 2.2
EU28 2.2 1.0 1.0 2.0
CIS 7.1 4.5 3.2 1.2
Africa 4.9 5.3 3.7 4.7
Middle East 5.2 5.3 3.8 3.9
Asia ex ASEAN 4.2 4.9 5.3 4.8
ASEAN 5.0 4.8 5.6 5.0
World 2.9 2.3 3.1 3.3

…Supporting the convergence of income levels
to developed world levels
Economic development supporting income growth and gradual
convergence to the developed world.
8
GDP per capita (000’s real USD 2010 PPP)
Source: IHS April 2015
GDP per capita (000’s real USD 2010 PPP)
Developed world average: 40k USD
0
5
10
15
20
25Philippines Indonesia
Malaysia Thailand
Vietnam
2
4
6
8
10
12
14
16
18
ASEAN India China

…and helping the urbanisation process
9
Urbanisation (% of total population) ASEAN urbanisation (% of total population)
Urbanisation will continue to increase in ASEAN but at different degrees
among countries.
Source: United Nations
15
20
25
30
35
40
45
50
55
60
65ASEAN China India
15
25
35
45
55
65
75
85Philippines Malaysia
Thailand Vietnam
Indonesia

…and steel using sectors
10
Personal vehicles (per 000 population)
Vehicle penetration low compared to developed world levels.
Construction to continue growing strongly.
Real construction output (2010 real USD 2005=100)
Source: LMC Automotive Source: IHS global construction service
15
35
55
75
95
115
135
155
175
Philippines Thailand
Indonesia China
India
USA + W.Europe average 750
50
100
150
200
250
300
350
400
Phillipines Thailand
Indonesia China
India

Income and urbanisation underpin steel demand
11
ASU/capita (kg) vs Urbanisation (% of total population)
1980-2014
ASU/capita (kg) vs Urbanisation (% of total population)
1980 -2014
Source: United Nations & worldsteel
A generally strong correlation between urbanisation and apparent steel
use per capita in ASEAN countries
0
100
200
300
400
500
600
15 25 35 45 55
AS
U p
er
ca
pit
a
Urbanisation (%)
ASEAN China India
0
50
100
150
200
250
300
350
400
15 35 55 75 95A
SU
pe
r c
ap
ita
Urbanisation (%)
Philippines Malaysia
Thailand Vietnam
Indonesia
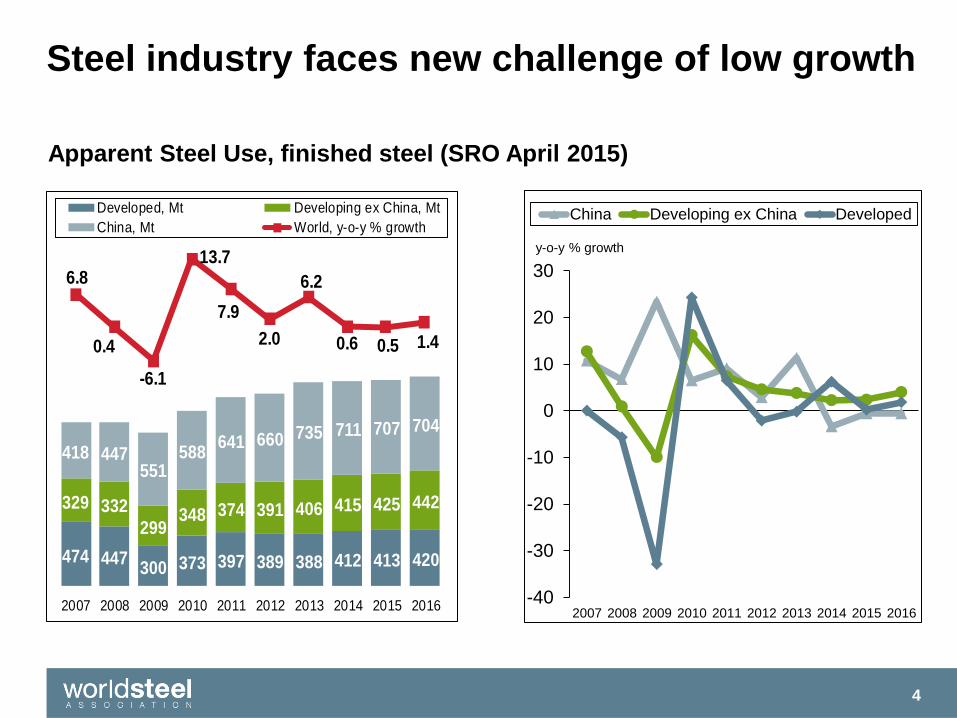
… with steel demand outlook strong
Source : SEAISI
Preliminary figures
ASEAN apparent steel use in 2014 increased by 6.3% y-o-y to 67.1 million
tonnes.
Vietnam registered highest growth rate (23.8%), followed by the Philippines
(10%) and Indonesia (6.8%).
Malaysia’s steel demand continued its moderate growth path, at 3.2% y-o-y.
Thailand and Singapore experienced decline in growth rate, at -1.6% and -
9.5%, respectively.
12
2013 2014E % change 13/14
Vietnam 11,769,000 14,575,000 23.8%
Philippines 6,704,674 7,374,489 10.0%
Indonesia 12,692,180 13,559,483 6.8%
Malaysia 10,048,767 10,372,949 3.2%
Thailand 17,603,911 17,323,258 -1.6%
Singapore 4,275,960 3,868,053 -9.5%
ASEAN 63,094,492 67,073,232 6.3%

Apparent Steel Consumption in ASEAN (million tonnes)
Source : SEAISI
30
40
50
60
70
80
90
2004
2006
2008
2010
2012
2014
E
2016
F
2018
F
Steel use growth well distributed across the region …
ASU is expected to surpass 80 mt after
2017
19% 20%
18% 15%
8% 11%8% 6%
29% 26%
18% 22%
2008 2014E
Vietnam
Thailand
Singapore
Philippines
Malaysia
Indonesia
13

Construction, 66%
Automotive, 18%
Ship building & repair, 1%
E&E, 4%
Machinery & Industry, 3%
Packaging, 2%
Oil & Gas, 3%
Others, 3%
Construction Sector – a Major driver of steel demand in ASEAN
66% of total steel used in the region comes from construction sector
Share of steel used in construction sector in each country
14
…With construction the largest steel user
Source: SEASI
% of Construction
Contribution
Philippines 81%
Singapore 75%
Malaysia 69%
Indonesia 66%
Vietnam 60%
Thailand 60%

Steel demand outpaces capacity
Present characteristics suggests the region to remain a net importer for
some time
15
ASEAN(6): crude steel capacity vs crude ASU, Mt
Source : OECD & worldsteel
20
30
40
50
60
70
80
90
2000 2002 2004 2006 2008 2010 2012 2014 2016
Crude capacity Apparent demand

…contributing to a persistent net-import gap
16
Source : worldsteel
Finished steel imports account for over 60% of ASEAN finished steel
use.
Finished and semi-finished net-imports (million tonnes)
2010 2011 2012 2013 2010 2011 2012 2013 2010 2011 2012 2013
Middle East -23.5 -24.0 -24.1 -22.2 -8.5 -7.0 -7.5 -3.0 -32.0 -30.9 -31.7 -25.2
Africa -11.5 -12.8 -12.2 -14.3 -2.5 -1.9 -2.5 -4.1 -13.9 -14.7 -14.7 -18.4
ASEAN -23.4 -25.0 -30.4 -36.0 -8.9 -6.1 -8.8 -8.5 -32.3 -31.1 -39.1 -44.5
NAFTA -10.2 -11.6 -15.0 -14.8 -2.8 -6.4 -5.9 -6.2 -13.1 -17.9 -20.9 -21.0
ASIA exc. ASEAN 56.1 66.1 76.9 73.0 -5.6 -3.0 -1.1 0.8 50.5 63.1 75.8 73.8
CIS 17.1 16.2 12.6 10.5 27.6 24.7 26.4 24.9 44.8 40.9 39.0 35.4
EU28 13.9 14.7 20.5 15.2 -4.4 -7.3 -3.7 -3.0 9.5 7.3 16.8 12.2
Finished Semi finished Total

The future

Future regional strategy could focus on creating
and delivering value
Using steel in downstream activities can be equally value-adding than
steelmaking strategies.
Substantial regional steel supply sources create interesting development
opportunities.
Focus on delivering service
Large population with many and diverse requirements
Value chain focus could deliver sustainable returns, but require
appropriate focus on:
Training & development
Building collaborative producer relationships
Ensuring stable supply relationships
18

19
Thank you for your attention.
For further information contact:
Edwin Basson | Director General
World Steel Association [email protected] | T: +32 (0)2 702 81 87 | worldsteel.org

worldsteel.org


![ASEAN + ME [ASEAN object traveler]](https://img.pdfslide.net/doc/110x75/568c534f1a28ab4916ba3e5d/asean-me-asean-object-traveler.jpg)