Embed Size (px)
Citation preview
• Creating Business Harmony: The
Integration of ERP, EPM and BI
– Enzo Santilli, Partner, MarketSphere

Agenda
2
History in the Making… of Information (and the need for Harmony) 1
2
One-Certified & Secured View of Data 2
Connect the Transaction Detail to Enterprise Layer 3
Establish an End-to-End Foundation 4
Enable Cross Domain Analysis 5
Provide the Ability to Develop New Analytic Models 6
Improve Collaboration & Where to Start 7

History in the Making… (and the need for Harmony!)
3
• Information (the common attribute of BI, ERP & EPM) is as powerful-- if cash is king,
information is its palace
• It drives business performance success, but it must also be secured, managed, and
protected to reduce risk and exposure, while maximizing its potential
Twenty years past BI ideation- what is the next best coined phrase to support and
exploit information to improve performance?
It is Harmony.
History in the Making…
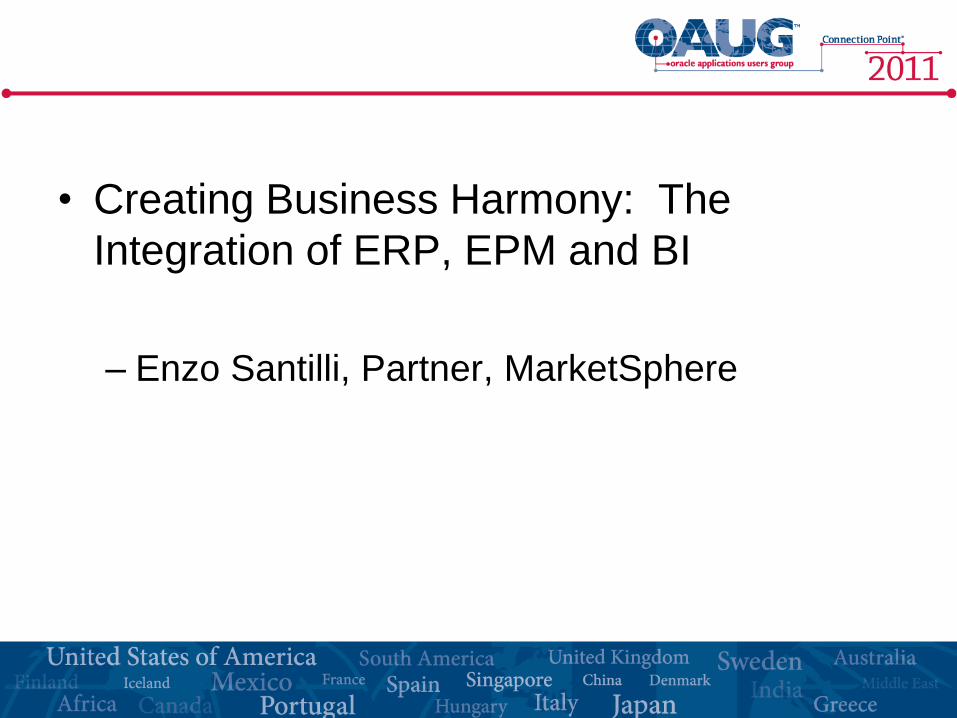
The Integration of ERP, BI and EPM
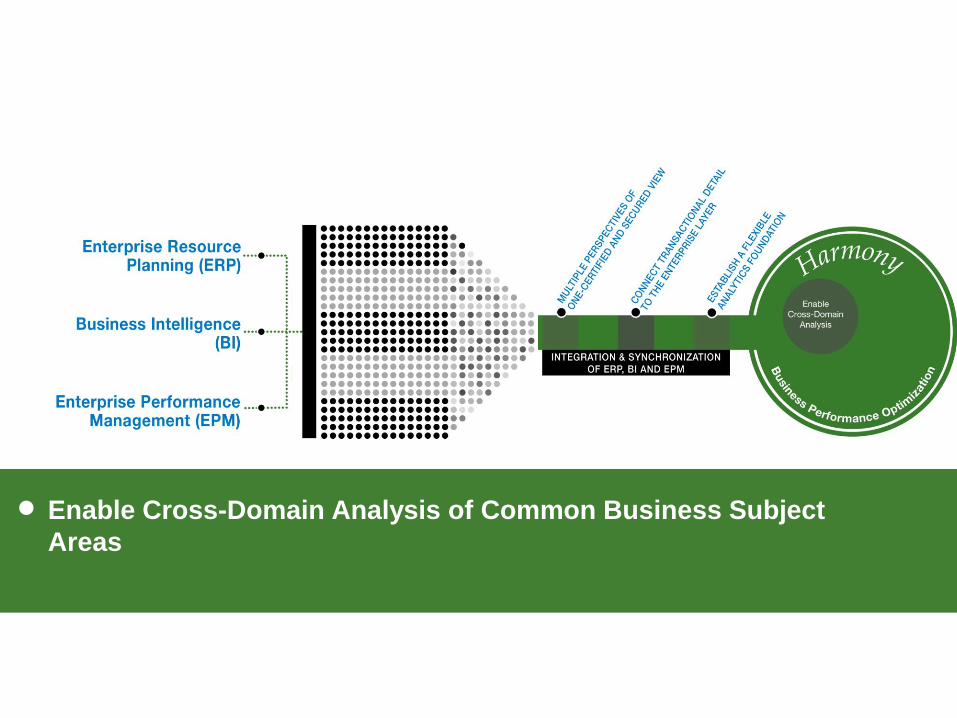
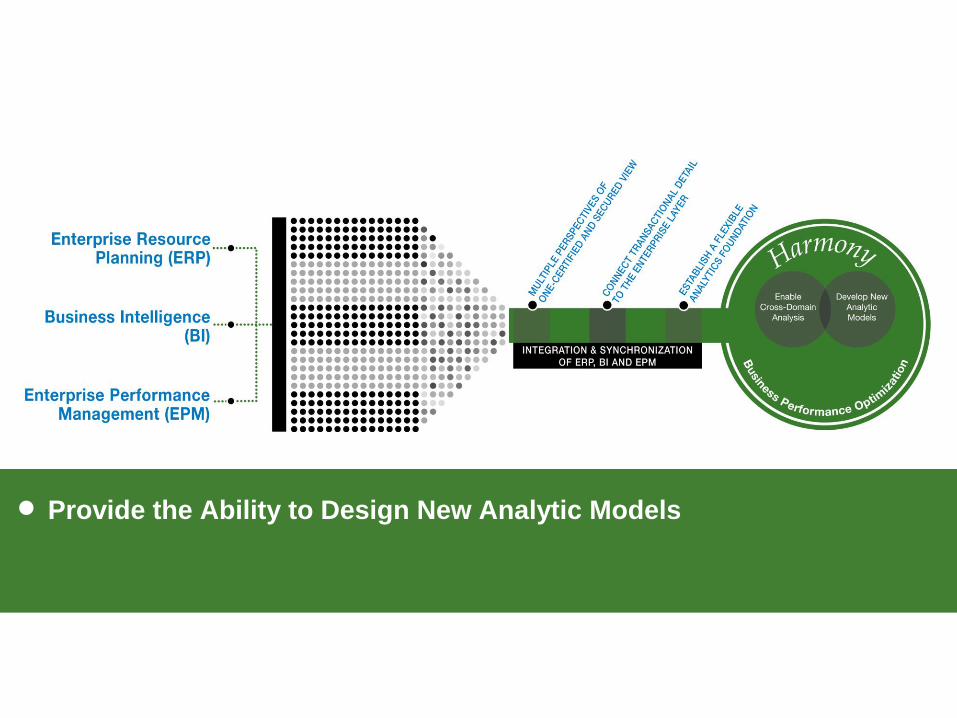
• Harmony turns data into relevant and complete information:
– creating multiple perspectives with one-certified and secured view of data (BI) by
– connecting transactional detail (ERP) to predictive forecasting content (EPM) and
– establishing a flexible end-to-end analytics foundation for future growth and change
• Harmony drives the following benefits:
– Enables cross-domain analysis of common business subject areas
– Provides the ability to develop new analytic models
– Improves collaboration across an organization
4
Harmony is the integration and access of information across an organization‟s
ERP, BI and EPM solutions to produce a robust analytical environment
that delivers timely business insight.
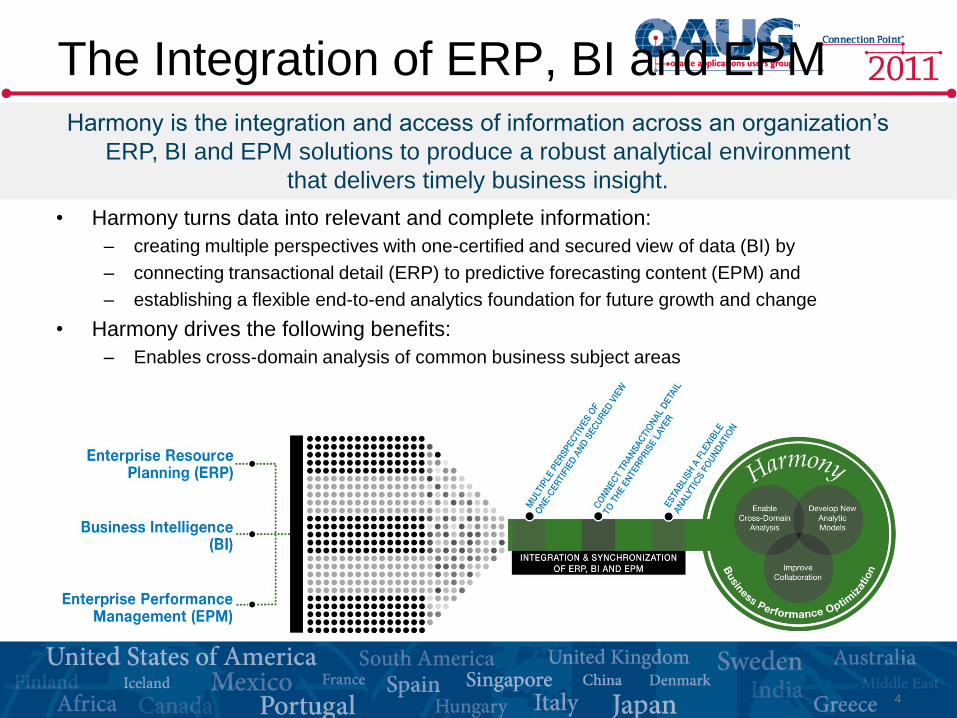
One-Certified and Secured View of Data

One-Certified & Secured View of Data
6
Failed,
Past Approaches
Data Marts & Siloed Sources
• Detail pulled from ERP or
legacy for needs finance,
marketing, HR, etc.
• Created multiple version of
many truths
• Failing to meet regulatory
requirements
Data Warehousing
• Delivers single view
• Massive mission, taking years
to complete
• Failure due to constant organic
of M&A growth
BI Platform
• Detail pulled from ERP or
legacy for needs finance,
marketing, HR, etc.
• Creates one version of truth
• Complete, pre-built analytics
Meta Data Repository
• Data model-agnostic master
data management solution
• Builds consistency within
master data assets despite
endless changes
• Creates one version of truth
Successful, New
Approaches
To consume the data, appropriate tools and technologies are needed to move data
to create consumable information.
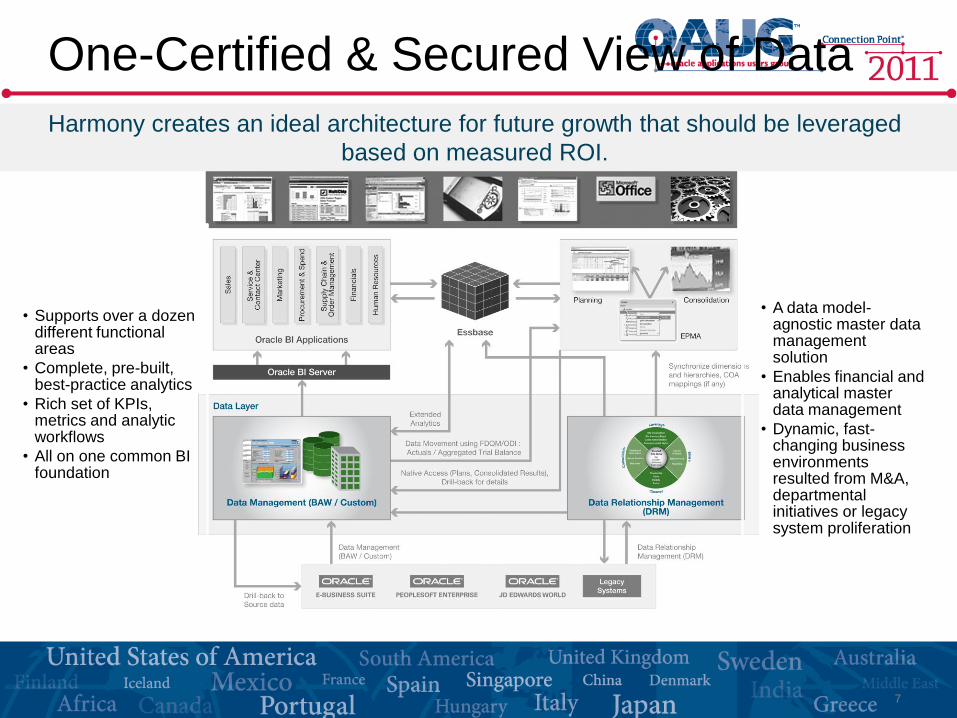
Oracle BI Applications™
• Supports over a dozen different functional areas
• Complete, pre-built, best-practice analytics
• Rich set of KPIs, metrics and analytic workflows
• All on one common BI foundation
7
One-Certified & Secured View of Data
Oracle Hyperion DRM™
• A data model-agnostic master data management solution
• Enables financial and analytical master data management
• Dynamic, fast-changing business environments resulted from M&A, departmental initiatives or legacy system proliferation
Harmony creates an ideal architecture for future growth that should be leveraged
based on measured ROI.

Case-In-Point
Situation
• Due to swift and steady growth, operations outgrowing technologies and processes
• Required upgrades to existing systems to properly report on performance and
provide improved analytical capabilities to accomplish effective revenue growth and
profitability decisions
• Kendle had the following to improve:
– Three financial systems across three global regions, with difficultly collecting and storing
data
– More than 4000 reports to run the business
– Manual, intensive excel-driven reporting and analysis
– Autonomous operational and financial data, deteriorating operational decision-making
MarketSphere Applied Expertise
• Goal: Align multiple financial systems across the globe and address the numerous
versions of data from disparate systems
• Leveraged the Analytical Assessment Approach (A3)™
– Develop detailed technology & systems strategy for each subject area, including Financials,
Projects, Human Resources, Clinical Trials and Sales Reporting
– Created One-Certified & Secure View of Data via fully integrated, on-demand solution with
common master data management processes enforced in ERP
– Established data quality and naming standards throughout the enterprise
Benefits & Value Achieved
• Over 1500 end-users worldwide have secured access to converted data in summary
with drill-down to invoice and sub-ledger detail
• Management has needed insight into sales, supporting financial growth strategy
• Eliminated cost of maintaining and reconciling multiple versions of the same info
8
Initiatives #
Financial Analytics – Packaged and Basic & Intermediate Extensions
1
Financial Analytics – Advanced Extensions and Customizations
2
Projects Analytics - Packaged and Basic & Intermediate Extensions
3
Projects Analytics – Advanced Extensions and Customizations
4
HR Analytics - Packaged and Basic & Intermediate Extensions
5
HR Analytics – Advanced Extensions and Customizations
6
COMPASS BI Reporting – Custom 7
Balanced Scorecard 8
Backlog BI Reporting - Custom 9
PSR BI Reporting - Custom 10
Clinical BI Reporting - Custom 11
Budgeting & Planning 12
Costpoint Integration 13
4
8
6
Packaged Oracle BI Applications with
Basic and Intermediate Extensions
DO IT NOW STRATEGIC
SELECTIVE
Valu
e
Effort
Low
Low
High
High
Initiatives Value Matrix
1 2
3
12
Custom BI Work Streams
Budgeting & Planning
SELECTIVE
5
7
Advanced Custom Development
10
11
13
9
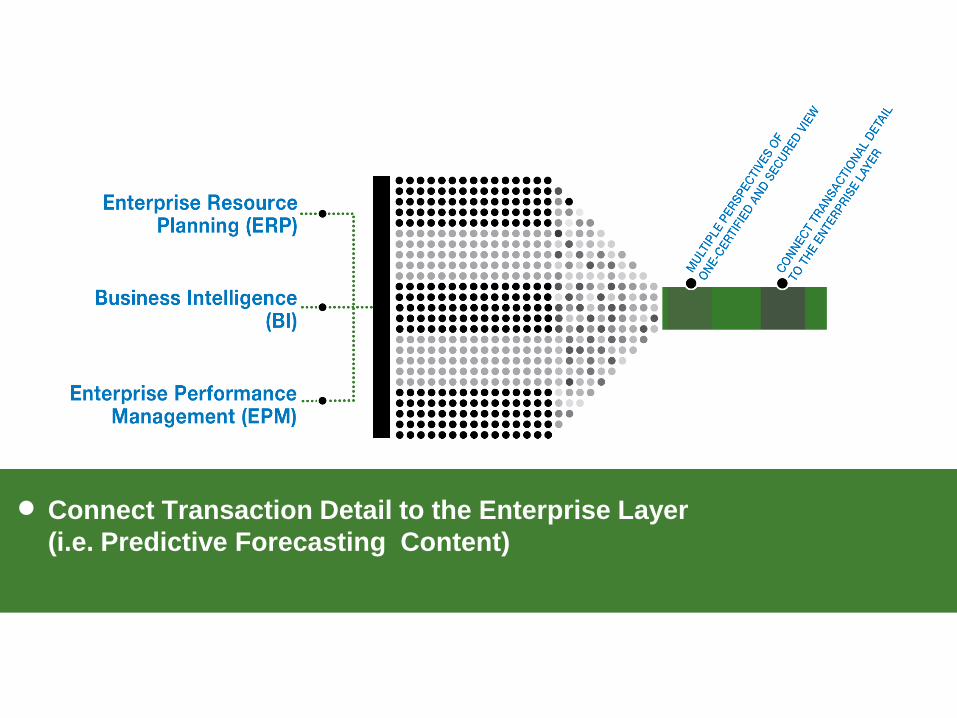
Connect Transaction Detail to the Enterprise Layer
(i.e. Predictive Forecasting Content)

Connecting the Transactional
10
Current Day-In-Life
• Report needed to understand
numbers impacting GL, inventory,
customer, etc.
• Additional resources needed for
account reconciliation
• Need access to trading or order
system for full story
• By time report created, data out-of-
date or obsolete
• IMPACT:
• Unproductive use of time
• Increased dissatisfaction
• Decreased confidence in
information
• Create data strategy to pull data
from up- & down-stream
• Reporting across all subjects
available- GL, inventory, customers,
receivables
• Interactive experience with cash
management, working capital, DSO,
vendor rates, etc.
• IMPACT:
• Improved accuracy in
information and decision-
making
• Advances job performance and
satisfaction
Day-in-Life with
Harmony
ERP systems address most complex business requirements, but the ability to categorize
data & interpret information in a meaningful way is grueling. Accessing information outside
the ERP is also difficult.
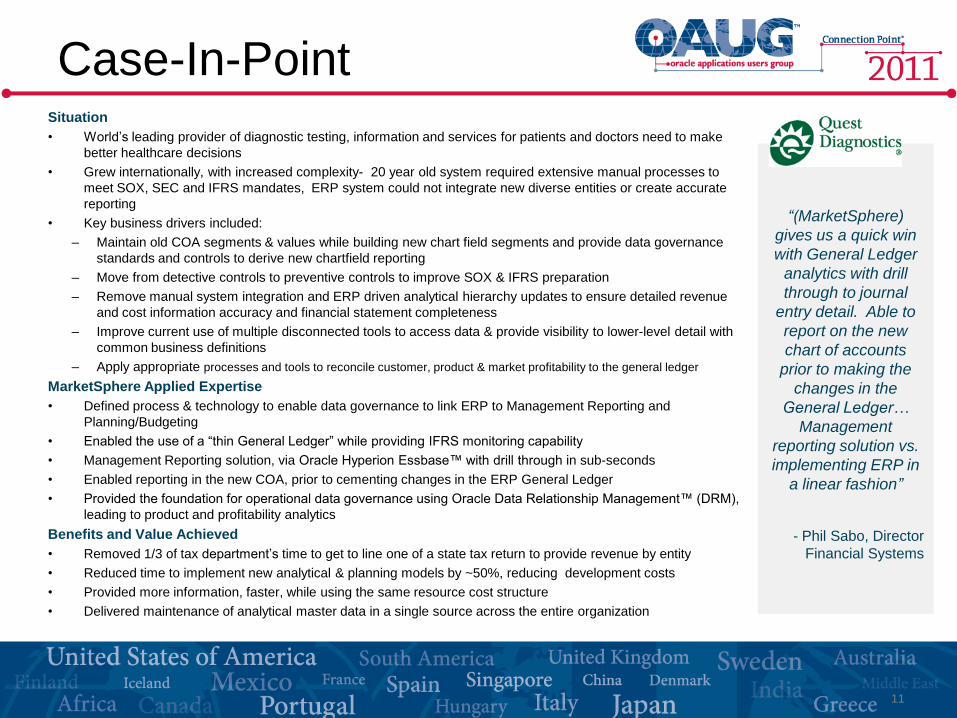
Case-In-Point Situation
• World‟s leading provider of diagnostic testing, information and services for patients and doctors need to make
better healthcare decisions
• Grew internationally, with increased complexity- 20 year old system required extensive manual processes to
meet SOX, SEC and IFRS mandates, ERP system could not integrate new diverse entities or create accurate
reporting
• Key business drivers included:
– Maintain old COA segments & values while building new chart field segments and provide data governance
standards and controls to derive new chartfield reporting
– Move from detective controls to preventive controls to improve SOX & IFRS preparation
– Remove manual system integration and ERP driven analytical hierarchy updates to ensure detailed revenue
and cost information accuracy and financial statement completeness
– Improve current use of multiple disconnected tools to access data & provide visibility to lower-level detail with
common business definitions
– Apply appropriate processes and tools to reconcile customer, product & market profitability to the general ledger
MarketSphere Applied Expertise
• Defined process & technology to enable data governance to link ERP to Management Reporting and
Planning/Budgeting
• Enabled the use of a “thin General Ledger” while providing IFRS monitoring capability
• Management Reporting solution, via Oracle Hyperion Essbase™ with drill through in sub-seconds
• Enabled reporting in the new COA, prior to cementing changes in the ERP General Ledger
• Provided the foundation for operational data governance using Oracle Data Relationship Management™ (DRM),
leading to product and profitability analytics
Benefits and Value Achieved
• Removed 1/3 of tax department‟s time to get to line one of a state tax return to provide revenue by entity
• Reduced time to implement new analytical & planning models by ~50%, reducing development costs
• Provided more information, faster, while using the same resource cost structure
• Delivered maintenance of analytical master data in a single source across the entire organization
11
“(MarketSphere)
gives us a quick win
with General Ledger
analytics with drill
through to journal
entry detail. Able to
report on the new
chart of accounts
prior to making the
changes in the
General Ledger…
Management
reporting solution vs.
implementing ERP in
a linear fashion”
- Phil Sabo, Director
Financial Systems
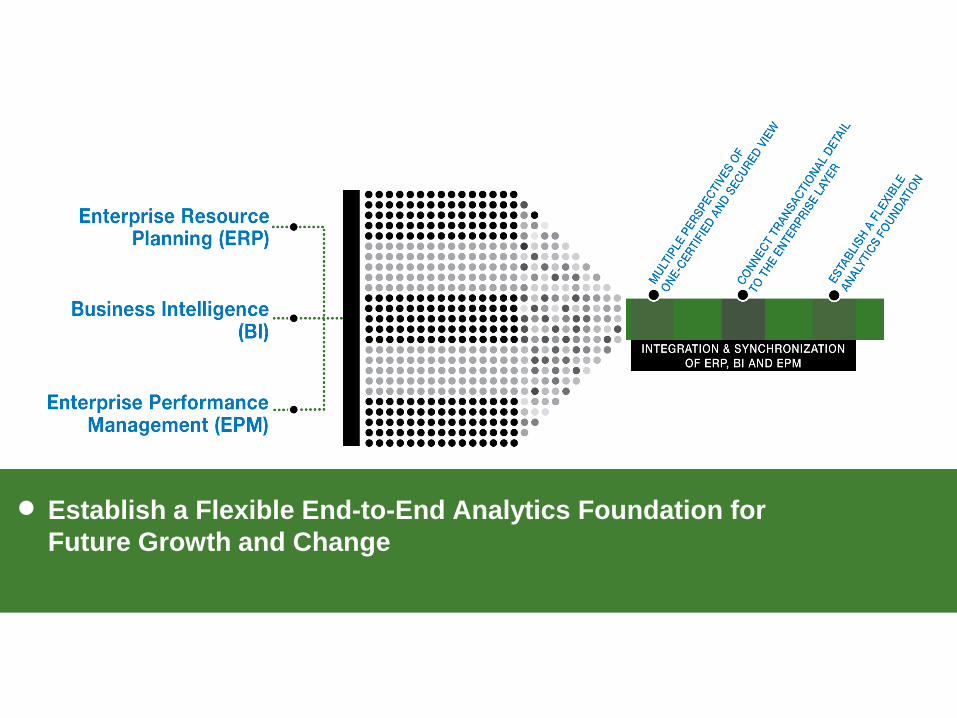
Establish a Flexible End-to-End Analytics Foundation for
Future Growth and Change

Establish an End-to-End Foundation
13
• Organizations have implemented numerous BI, ERP and EPM solutions & created
„Mountains of information, Oceans of systems and Islands of data‟
• The issue is not only how to pull all of it together, but how they should use the
landscape to support the needs of the business and answer the question: “How do
we make money?”
• You cannot make money when people are spending more time using different
oceans to access different mountains and islands- or create 600 spreadsheets in
Excel

Establish an End-to-End Foundation • Framework or platform where operational systems come together with analytic systems & provide
optimal performance for the strategic and tactical use of information
• Location where essential tools are leveraged to collect & manipulate data for decisions to take
place
• Allows people within an organization to perform the right activity at the right time- allowing those
that transact, to create transactions and those that report, to use reporting, such as scorecards,
dashboards and scenario-based analysis.
• Done properly, will allow an organization to change and grow, organically and/or by acquisitions or
mergers, without disruption in performance or in the integrity of its information
• Improves speed to receive information & process changes and react to opportunities
14
Current Day-In-Life
If your sales team spends all their time
in your CRM system, searching for the
best clients, when will they be able to
create an action plan and meet these
clients?
If information was pulled from your
mountains and islands, without
disrupting the performance of your
oceans, the best clients could be
presented via a dashboard accessed
anywhere and at any time, allowing
your sales team to outperform your
plans- and make more money!
Day-in-Life with
Harmony

Establish an End-to-End Foundation
15
Oracle Fusion Applications will create the beautiful landscape underneath the mountains,
ocean and islands allowing operational systems to come together with analytic systems
and provide optimal performance for the strategic and tactical use of information.
Enable Cross-Domain Analysis of Common Business Subject
Areas

Enable Cross-Domain Analysis
• Ability for users to pivot and create multiple views
• Visual format, accessed quickly
Functionality
• Drive confidence in the data
• Provide access to the invoice line or employee level detail
Transparency
• ERP reporting may take > 6hrs
• Deliver reports in seconds
Performance
17
• Are we managing cash in an optimal manner?
• How is bad debt trending with revenue?
• Is our working capital turnover improving?
• How are my payment terms trending?
• Can we improve rates and discounts from vendors?
• What is the margin for our top customers by region?
• Which products and customers are most profitable?
• How can we minimize inventory on hand?
• How can we reduce Days Sales Outstanding (DSO)?
• What is our employee retention by geography?
• How can we change the organizations behavior to align with our current strategies?
Answer critical business questions using data across multiple transactional modules - Finance,
Projects, Supply Chain, Sales and Human Resources:
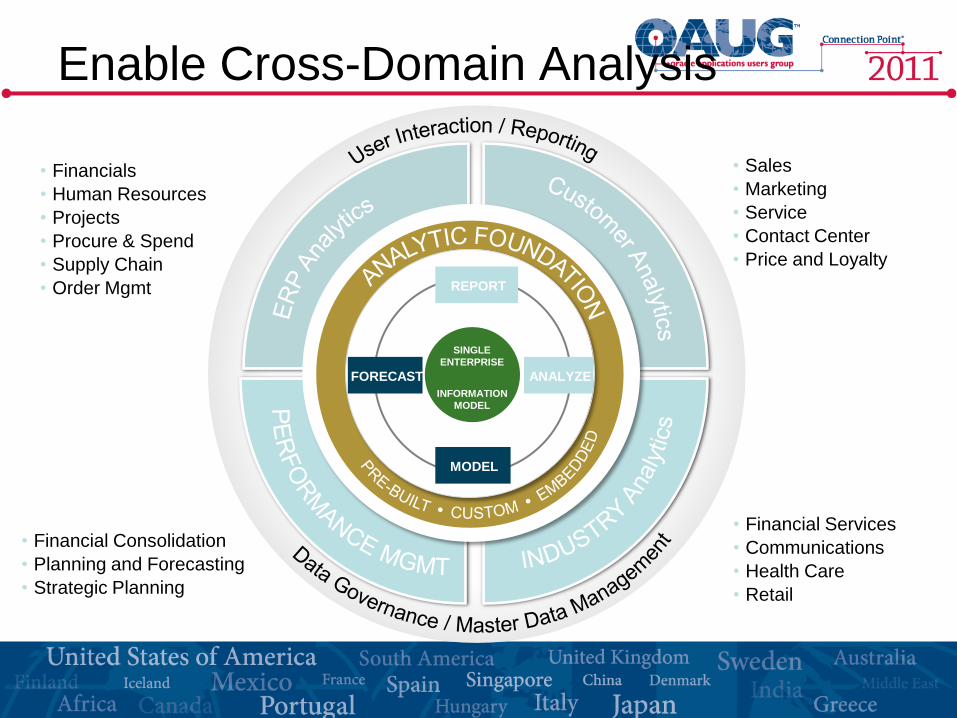
Enable Cross-Domain Analysis
• Sales
• Marketing
• Service
• Contact Center
• Price and Loyalty
• Financial Services
• Communications
• Health Care
• Retail
• Financials
• Human Resources
• Projects
• Procure & Spend
• Supply Chain
• Order Mgmt
• Financial Consolidation
• Planning and Forecasting
• Strategic Planning
REPORT
ANALYZE FORECAST
MODEL
INFORMATION
MODEL
SINGLE
ENTERPRISE
Case-In-Points
19
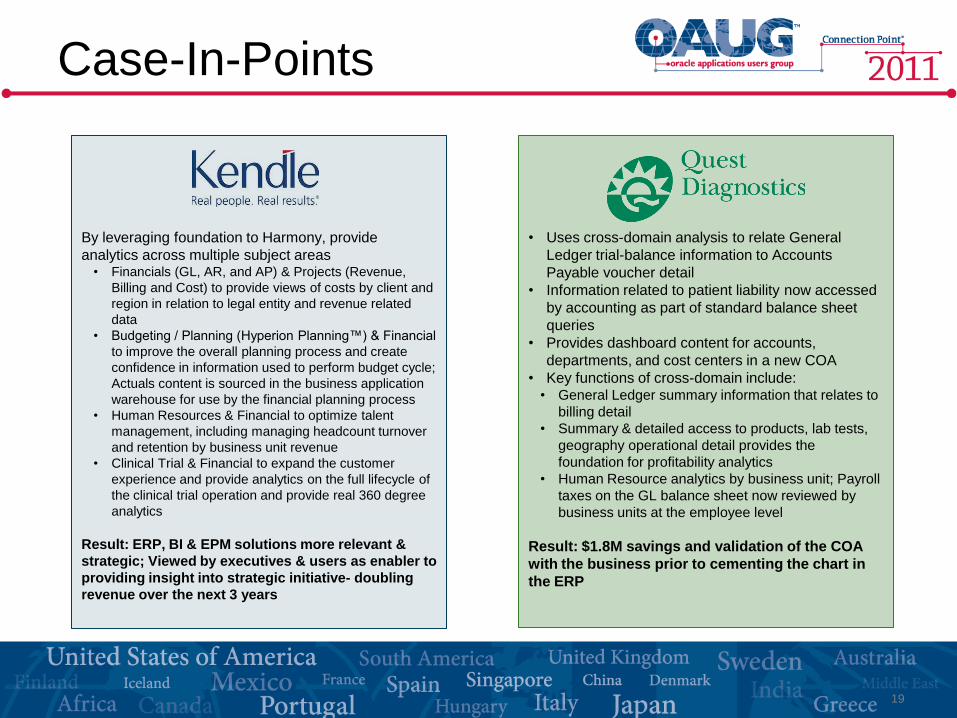
By leveraging foundation to Harmony, provide
analytics across multiple subject areas • Financials (GL, AR, and AP) & Projects (Revenue,
Billing and Cost) to provide views of costs by client and
region in relation to legal entity and revenue related
data
• Budgeting / Planning (Hyperion Planning™) & Financial
to improve the overall planning process and create
confidence in information used to perform budget cycle;
Actuals content is sourced in the business application
warehouse for use by the financial planning process
• Human Resources & Financial to optimize talent
management, including managing headcount turnover
and retention by business unit revenue
• Clinical Trial & Financial to expand the customer
experience and provide analytics on the full lifecycle of
the clinical trial operation and provide real 360 degree
analytics
Result: ERP, BI & EPM solutions more relevant &
strategic; Viewed by executives & users as enabler to
providing insight into strategic initiative- doubling
revenue over the next 3 years
• Uses cross-domain analysis to relate General
Ledger trial-balance information to Accounts
Payable voucher detail
• Information related to patient liability now accessed
by accounting as part of standard balance sheet
queries
• Provides dashboard content for accounts,
departments, and cost centers in a new COA
• Key functions of cross-domain include: • General Ledger summary information that relates to
billing detail
• Summary & detailed access to products, lab tests,
geography operational detail provides the
foundation for profitability analytics
• Human Resource analytics by business unit; Payroll
taxes on the GL balance sheet now reviewed by
business units at the employee level
Result: $1.8M savings and validation of the COA
with the business prior to cementing the chart in
the ERP
Provide the Ability to Design New Analytic Models
Ability to Develop New Analytic Models • The recent financial crisis revealed the price of unreasoned assumptions-- Success simply will not
tolerate intuition and chance
• Pioneering companies are thriving on analytics and competing in a tough global economy by
developing variable models to support root cause analysis, predictive modeling, and ad-hoc
analysis
• The outcome is a logical approach to solving business problems based on fact and supported by
documented business drivers
• Harmony creates a new opportunity for automation and insight into continuous improvement efforts
– Identifying performance measures, establishing realistic targets and tracking results for any
business process can be facilitated by multi-dimensional analytics
– The integration of ERP, BI and EPM also provides ability to layer multiple levels of complex
data while reducing time required to perform updates to models
– Ultimately, organizations will have faster access to data delivered in one-certified view
Example: Income Statement Modeling
• Completed by layering in actuals from one or multiple ERP systems, as well as acquisition targets
• Optimization models can be created that can solve questions to capacity, headcount, profitability,
or capital investments
• Improved insight into customer and products can be created with models incorporating these
dimensions that may exist only as an attribute in the ERP system
21
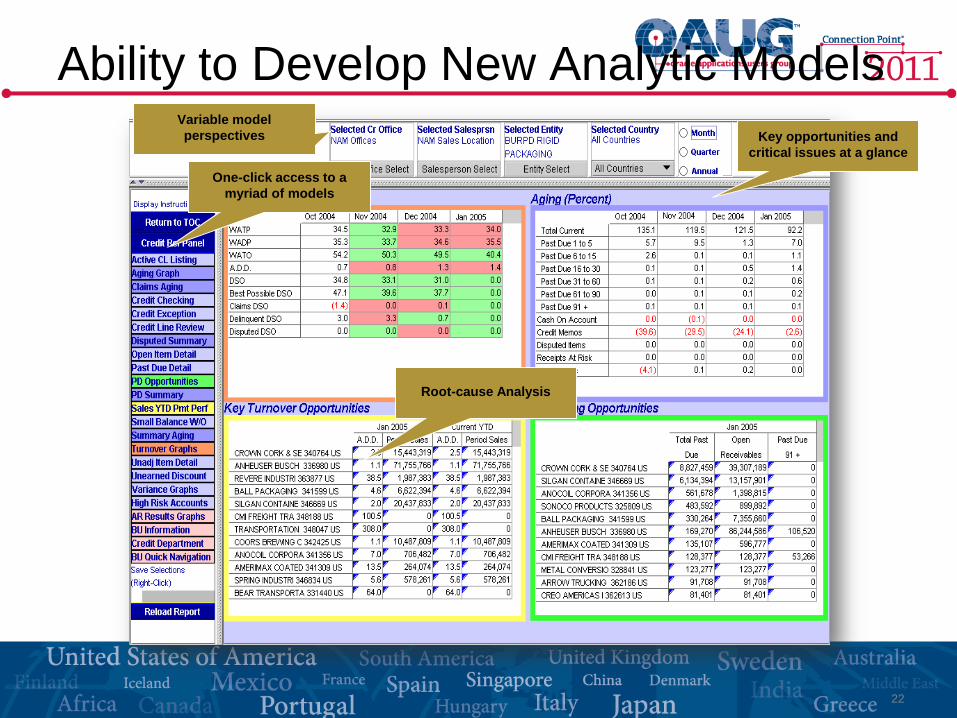
Key opportunities and
critical issues at a glance
One-click access to a
myriad of models
Root-cause Analysis
Variable model
perspectives
22
Ability to Develop New Analytic Models
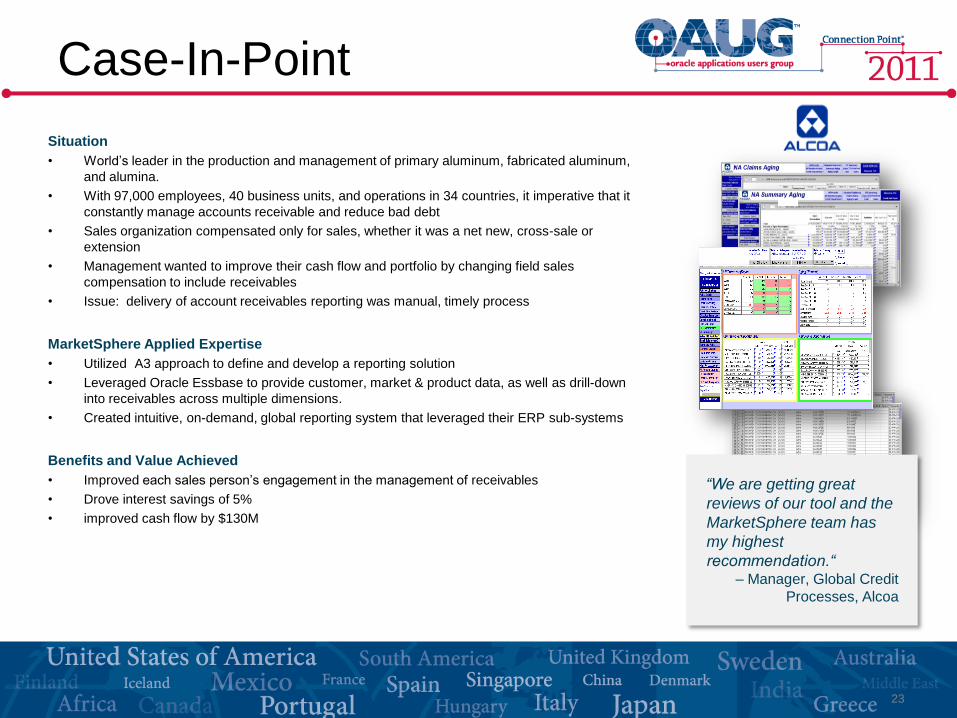
Case-In-Point
Situation
• World‟s leader in the production and management of primary aluminum, fabricated aluminum,
and alumina.
• With 97,000 employees, 40 business units, and operations in 34 countries, it imperative that it
constantly manage accounts receivable and reduce bad debt
• Sales organization compensated only for sales, whether it was a net new, cross-sale or
extension
• Management wanted to improve their cash flow and portfolio by changing field sales
compensation to include receivables
• Issue: delivery of account receivables reporting was manual, timely process
MarketSphere Applied Expertise
• Utilized A3 approach to define and develop a reporting solution
• Leveraged Oracle Essbase to provide customer, market & product data, as well as drill-down
into receivables across multiple dimensions.
• Created intuitive, on-demand, global reporting system that leveraged their ERP sub-systems
Benefits and Value Achieved
• Improved each sales person‟s engagement in the management of receivables
• Drove interest savings of 5%
• improved cash flow by $130M
23
“We are getting great
reviews of our tool and the
MarketSphere team has
my highest
recommendation.“ – Manager, Global Credit
Processes, Alcoa
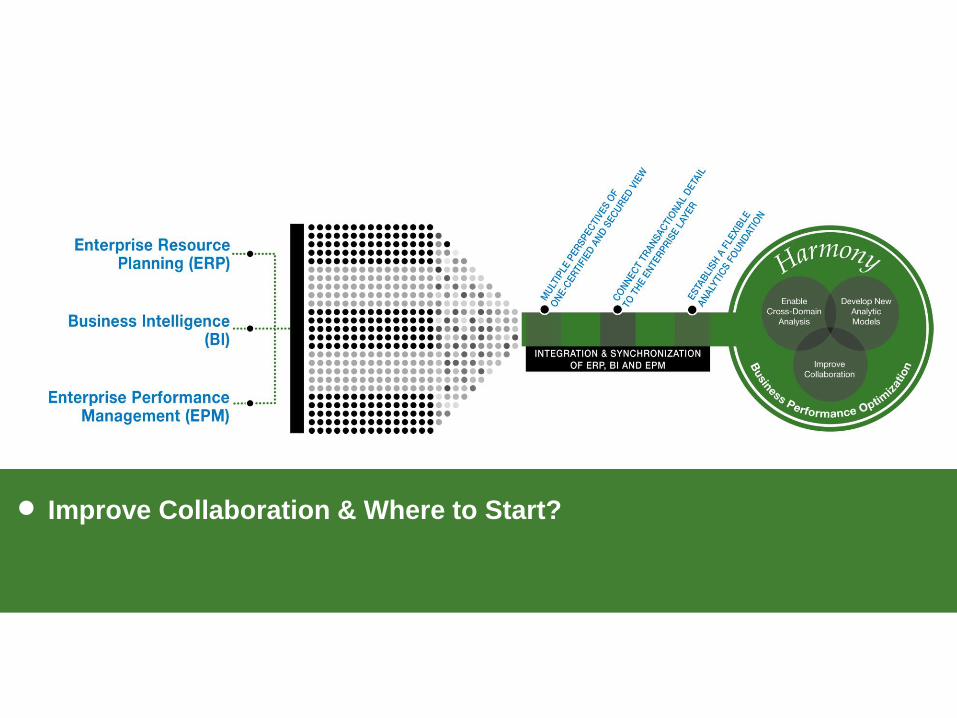
Improve Collaboration & Where to Start?

Improve Collaboration
Enhances ability to attack critical business problems
Drives future, forward thinking behavior
Improves overall strategic and tactical planning
Produces better, faster decision-making
Leads to superior business understanding
Improves processes and aligns talent to support on-going progress
Reduces job dissatisfaction
Improves confidence in the numbers
Creates synergy between IT and business
Reduces IT resources in creating multiple reports
25
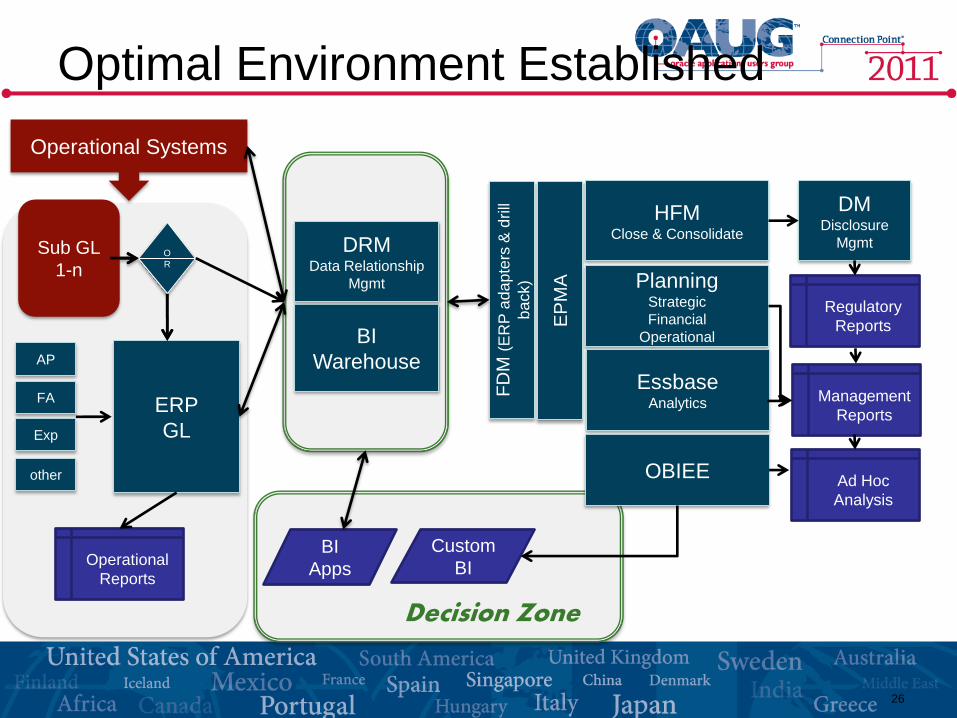
ERP
GL
Operational
Reports
other
Exp
FA
AP
Sub GL
1-n
Operational Systems
O
R
BI
Apps
Custom
BI
HFM Close & Consolidate
DM Disclosure
Mgmt
Regulatory
Reports
OBIEE
Management
Reports
Planning Strategic
Financial
Operational
FD
M (
ER
P a
da
pte
rs &
drill
ba
ck)
Essbase
Analytics
EP
MA
Ad Hoc
Analysis
Decision Zone
26
Optimal Environment Established
BI
Warehouse
DRM Data Relationship
Mgmt

Harmony: Where to Start
27
Ask us how to identify a successful roadmap to Harmony!
At your pace and on your terms, based on today‟s needs.
• Upgrade to latest releases
• Leverage advancements in application
functionality
• Keep organization current on
technology
1. Optimize Current
Applications
Leverage A3 to define
needs of:
• Cross-Domain
Analysis
• Analytic Modeling
2. Assess Analytic
Needs
Implement to expedite ROI: • Financial Management
• Human Capital Management
• Procurement
• Project Management
• Supply Chain Management
• Governance/Risk/Compliance
• Customer Relationship Management
3. Identify Oracle
Fusion Modules • Expertise for future flexibility
optimization
• Reduce IT &sourcing costs
4. Develop Next
Generation Skills
Questions?