Embed Size (px)
Citation preview

Creating innovation networks among manufacturing firms: How effective
extension programs work
Susan Helper and Marcus Stanley, Case Western Reserve University1
October 2004
Appeared in Scott Shane, ed. Economic Development Through Entrepreneurship:
Government, University And Business Linkages , Edward Elgar, 2006
I. Introduction
Since its most recent peak employment level in the year 2000, the U.S. manufacturing
sector has lost over 2.5 million jobs. This represents almost one fifth of its pre-recession
total. The question of how to stop this catastrophic employment loss is clearly a critical
one, but there are no easy answers.
Manufacturers are eligible for a variety of general business subsidies; the vast
majority of these are tax abatements for locating or expanding an operation in a particular
area (Lynch, 2004). These tax incentives, however, do not increase manufacturing
efficiency. The main federal program for increasing the efficiency of manufacturing is
the Manufacturing Extension Partnership. Despite its very small level of funding ($106
million in 2003, or $7 per manufacturing worker), it has been hit hard by budget cuts. Its
1 The authors thank Dan Luria for his great generosity in providing valuable insights, much data, and general good-natured cyncism.
2004 appropriation was only $39.6 million.2 There is a lack of consensus on how
government could assist manufacturing, or whether such assistance is even really
possible.
In this paper, we examine data on a subsector of manufacturing, small and medium-
sized (less-than-500-employee) component manufacturing firms. Component
manufacturers typically sell to other firms (rather than to consumers), and thus form a
key part of the manufacturing supply chain. We are able to characterize these firms’
strategies in some detail using national data gathered by the Michigan Manufacturing
Technology Center’s Performance Benchmarking Service. In the first section of this
paper, we describe the sector and some of the data we used to perform our analysis. In
the second section, we summarize some of our previous research on factors that seem to
be correlated with high value-added per worker and high sales growth. Our research has
focused strongly on urban manufacturing firms, and we argue that these firms should be a
special focus for economic development assistance. The third section discusses
arguments for various economic development approaches, and examines how the MEP
program has worked in practice. The fourth section concludes.
SECTION 1: Sector Description and Data
The U.S. Component Manufacturing Sector
The component manufacturing sector has long been important to the economies of
the US Midwest. Firms in this sector fabricate and/or assemble molded, forged, formed, 2 In fall 2004, the House of Representatives approved a FY 2005 budget of $106 million for the program while the Senate Appropriations Committee approved $112 million (Taylor, 2004).
and machined goods made of metal and plastic, principally for sale to other
manufacturers. The sector stands at the base of such industries as automobiles and other
transportation equipment; industrial, farm, and construction machinery; electrical
appliances; and medical instruments. It accounts for more than 10 percent of U.S.
manufacturing employment. The sector is heavily concentrated geographically, with 45
percent of total employment in the Great Lakes states of Wisconsin, Illinois, Indiana,
Michigan, and Ohio (as against these states’ 36 percent of U.S. manufacturing generally).
The customers and suppliers of these firms are also heavily concentrated in those states.
In contrast to the OEMs and large first-tier suppliers they serve, most of these
firms have fewer than 500 employees. In part because of their small size, they are often
deeply anchored in their regions, and dependent on surrounding regional institutions in
obtaining new knowledge. However, this cluster is dispersing, spreading out both within
the US and around the world. For example, in 1975 50% of US employment in the auto
industry (assembly and parts) was concentrated in just 16 of the more than 3,000 US
counties. By 1990, these counties accounted for only 30% of automotive employment, a
dramatic decline.
Like the rest of the US manufacturing sector, the component manufacturing
industry has lost a substantial number of jobs to foreign competition during the recent
recession. US Department of Labor data for the three most relevant industry
classifications shows a loss of almost 20% of the 3.8 million jobs that existed in these
industries in June 2003.3 Interviews with plant managers and some of the data in our
survey indicate that many of these job losses can be ascribed to competition from cheaper
3 Based on data for the Fabricated Metal Products, Machinery, and Electrical Equipment manufacturing sectors, from the Bureau of Labor Statistics B series of establishment payroll data between June 2000 and June 2003 (http://www.bls.gov/webapps/legacy/cesbtab1.htm).
foreign imports. Component manufacturing is thus a good case study in the effects of
globalization on manufacturing in the US.
As our data source in examining this sector, we draw on two surveys conducted as
part of the Michigan Manufacturing Technology Center’s (MMTC) ongoing Performance
Benchmarking Service (http://www.mmtc.org/services/PBS). The project enlists a panel
of about 600 plants to submit benchmarking data on a continuing basis to the MMTC.
Each year, firms in the panel are also mailed a more detailed survey that asks additional
questions about their business practices. The panel is not a random sample (firms must
volunteer to participate), but it is broadly representative of the component manufacturing
industry.
During the winter of 2003, we submitted a survey to all 600 firms that included
detailed questions about the nature of their ties to other firms, including customers and
competitors. Firms also submitted basic accounting data on their revenues, costs,
employment, and wages. 250 surveys were returned by US firms.
We then linked the survey data to data from the U.S. Census Bureau’s Zip Code
Business Patterns file released in the year 2002. This file contains information on the
number of establishments by detailed industry in every zip code in the United States as of
2000. We use this information to create measures of the urban density of the firm’s
location, and whether or not the firm is located in a cluster of firms in similar industries.
SECTION 2: Some Research Findings
There are, of course, numerous determinants of productivity and success in this
sector, as in all of manufacturing. In our research, we have focused on the issue of
agglomeration economies (Stanley and Helper, 2003). These are the productivity
benefits that emerge from locating in areas of concentrated economic activity, either in
the same industry or in an urban location more generally (Rosenthal and Strange, 2003).
Agglomeration economies offer an important potential “lever” in economic development
strategies, since it may be possible to manipulate either the location of firms or the
interconnections among nearby firms so as to generate a productive cluster. Economic
development theorists and practitioners have eagerly adopted the language of
agglomeration, or “cluster economies,” as part of their efforts (Porter, 1998). Our
findings are thus quite relevant to economic development policy. That said, we do not
pretend to fully analyze sources of productivity and success in this sector. Our key
findings are listed below.
This manufacturing sector is characterized by urban economies, but not by cluster
economies. We differentiate between two types of agglomeration economies. One is
associated with location in dense concentrations of other establishments (urban
economies), while the second (cluster economies) results from location close to similar
firms in the same industry. We find that firms located in urban areas have considerably
higher levels of value-added per worker than non-urban firms with similar levels of
capital investment, even after controlling for industry.4 Location in clusters of other
4 Our measure of urban location is the number of non-manufacturing firms located within 10 miles of the plant. Our measure of same-industry clustering is the number of firms in the plant’s same 2-digit industry located within 10 miles of the plant. We derive these from the Zip Codes Business Pattern database.
manufacturing firms in the same or similar industry, however, is associated with no
additional productivity benefit beyond the effects of the urban location.
Urban economies can have a considerable impact on firm productivity. An
increase in our urbanization measure from the 25th to the 75th percentile leads to a 10%
increase in value-added per worker, with capital held fixed.
Many of the benefits of location in urban areas are captured by workers, not firms.
Increases in our urbanization measure seem to be associated with firm payroll premiums
roughly proportional to the extra value-added. This is true even after controlling for
industry and the (limited) measures of worker skill that we have.
Certain types of urban firms appear to earn higher profits in our sample. Because
we do not have perfect measures of the value of capital, we are hesitant to make
definitive statements about profits. But at least in our sample, firms in more urbanized
areas appeared to earn higher profits than other firms. This naturally raises the question
of why all firms do not move to urbanized areas. Preliminary findings indicate that only
smaller firms are able to earn a profit advantage due to urban location; larger firms do not
seem to receive the same kinds of profit benefit. We are continuing to investigate this
finding. A rationale for this finding is that small firms are particularly dependent on their
environment to provide inputs such as skilled workers, specialized inputs, and new ideas.
(The economist Alfred Marshall called these resources provided by a firm’s environment
“external economies”.) In contrast, large firms have enough scale to profitably provide
many services in-house. For example, they can set up a program to train their own
workers, rather than rely on a pool of skilled workers that already resides near the plant.
Self-reported social capital and networking measures do not seem to account for
the agglomeration economies we found. On the smaller supplemental survey, there are a
series of questions that ask firms to self-report both the extent of their networking
contacts with other firms in the same industry, and the perceived value of those contacts.
We found that both the extent and perceived value of inter-firm networking was
completely uncorrelated with location in urban areas, and also with location in clusters of
firms in the same industry. Firms appeared able to network with their peers
independently of their geographic location.
However, information transfer through networking does have an effect on
productivity for single-plant firms. In general, we found no clear effect of either the
extent or value of inter-firm networking for our full sample of firms. But we did find that
single-plant firms – firms that had only a single plant and no branch plants – showed a
strong correlation between the perceived value of inter firm networks and value-added.
A move from the 25th to the 75th percentile on our measure of the value of firm
networking was associated with a jump of over 10% in value-added at these firms. In
contrast, firms with multiple plants showed a negative relationship between information
transfer through networking and value added.
Firms that do extensive amounts of engineering to order and design work appear
to get stronger productivity impacts from urban location. Firms that had a relatively large
fraction of sales from engineered-to-order products (engineering a customized prototype,
as opposed to working with a pre-determined product), or that performed significant
design work, appear to get a larger benefit from urban location than other firms.
Depending on the model specification, the urban impact on productivity could be up to
50% higher for firms in the top quartile on our measures of design intensity. However,
urban location still has a significant productivity impact for other firms as well.
Trends in manufacturing are running against the kind of firms that are most
successful in urban agglomerations. Over the 2001-2003 period, we found that high-
wage firms were particularly likely to lose sales and employment. Among firms that paid
less than the median level of annual earnings in our sample (about $37,000), employment
dropped by about 4% and sales by less than 1% over the 2001-2003 period. In contrast,
sales dropped by 13% and employment by over 14% among firms paying more than the
median annual earnings level. These trends can be seen using skill measures as well.
Sales dropped by only 5% for firms that did high levels of repetitive mass production, a
relatively low-skill production style that requires little customized design. But sales
dropped by 15% for firms below the median on our measure of repetitive mass
production.
Urban location may still provide some protection from the general trend against
high-wage, high-skill firms. High-skill urban firms apparently have been able to weather
the storm better than similar firms located further away from urban concentrations. To
take one striking example, firms that are above the median on our measure of the
percentage of sales from engineered-to-order products and are also located in urban areas
lost 4% of sales and 12% of employment over the 2001-2003 period. Firms that did
similar percentages of engineer to order work but were located in areas that showed less
urban concentration lost 20% of both their sales and employment over the same period.
SECTION 3: What Can (and Should) Economic Development. Policy Do?
Our analysis suggests several ways in which markets may fail to maximize social
welfare, leading to potential improvements from public policy. Below, we describe three
types of market failures: 1) wage externalities, 2) information externalities, 3) training
externalities, 4) coordination problems, and 5) liquidity constraints. These failures lead to
the possibility that government intervention could increase social welfare. That is, a
dollar of public spending might lead to more than a dollar’s worth of benefits. Our
research suggests that at least the first two forms of market failure may be operating, and
that coordination problems may be present as well. It is also possible that government
intervention could reduce social welfare. In this section, we examine these potential
effects of government policy.
We will also examine other research on how the MEP program has performed in
these areas, and present some new information from our survey on the extent of MEP use
among these smaller firms.
First, our findings on urban wages suggest a potential “wage externality” for
highly productive urban firms. Firms that pay a higher wage benefit their workers as
well. Profit-maximizing owners will not take into account the benefits to higher wages
that accrue solely to workers. Luria (1996) has found that certain production practices,
such as capital intensity and distinctive products, are associated with higher wages.
We also found that firms in urban areas are more productive than are other firms, and that
most of these productivity benefits are captured by wage-earners. Assuming the
correlation between urban location and productivity can be interpreted causally, since
firm owners do not benefit much from the increased productivity of urban locations, they
are likely to undervalue the urban productivity advantage, leading to inefficiently low
urban employment. In economic language, the urban productivity advantage is largely an
‘externality’, a benefit not taken into account by those who make firm location decisions.
Policies that benefit urban firms can remedy some of this inefficiency. That is, a dollar of
tax money spent in some way on an urban firm has the potential to return more than a
dollar of benefits to society, in the form of a rise in productivity that is shared among firm
owners, workers, and consumers.
Second, our finding that single-plant firms benefit from networking with other
firms implies potential market failure. Information exchange is subject to many market
failures. A key issue is that knowledge is “expensive to produce, but cheap to reproduce”
(Varian and Shapiro, 1999). That is, if one firm knows something, it is inefficient for
another firm to discover that same thing for itself. Yet, it is usually not profitable for a
firm to give away its knowledge for free5. Therefore, spending a dollar of tax money on
knowledge diffusion may yield more than a dollar of benefits by avoiding duplication of
discovery.
The discovery process is particularly expensive and difficult if changes are
complementary (for example, if two modifications made together yield greater
performance gains that the sum of the two modifications made separately). For example,
adopting Toyota-inspired “lean production techniques” leads to higher quality and lower
inventory—but only if inventory reduction and quality control are coupled (MacDuffie,
1995). Each of these initiatives is complex, but firms that do inventory reduction without
quality control are likely to be plagued by supply shortages.
5 Firms can benefit from ‘know-how trading’ with other firms that reciprocate (von Hippel, xx), or by gaining a reputation as a cooperator (Rege, 2003). However, unless firms gain all of the benefit of the knowledge they share, there will be a partial externality.
A third problem is training externalities. In our data, we find that employees work
for several firms during their careers. As Becker (1975) has pointed out, if workers are
mobile, profit-maximizing firms will provide less than the socially optimal amount of
general training, because they fear that they will not get the full benefit of their training
expenditure because the trained employees will be hired away by other firms.
A fourth problem are liquidity constraints. Adopting the production processes that
lead to high wages and high value-added requires capital and product development
capability. These upgrading activities require fairly large upfront expenditures. Since
many of these expenditures do not result in a tangible asset, banks are usually not willing
to lend money to hep finance them.
A final problem is coordination. Most component manufacturers serve a number
of customers. We found that the typical firm gets only 30% of its sales from its largest
customer. If customers can rely on suppliers to provide timely delivery and high-quality
products, they can adopt more efficient production processes. For example, they can
eliminate receiving inspection and expediters. But if suppliers don’t all invest in these
activities, customers cannot risk running low-inventory production processes.
Our findings on urban agglomeration economies may also imply the potential for
coordination failure, although this is unclear without further investigation of the causes of
the agglomeration economies. If these economies depend on the simultaneous presence
of many different types of firms and institutions, firms may create significant
externalities by locating in urban areas. However, our finding that cluster economies do
not appear to be important for this manufacturing sector does lower the chance that these
externalities are taking place within manufacturing; they are likely present in other
supporting institutions or in urban infrastructure. Further research is necessary here.
The above processes suggest ways that government intervention could improve
welfare. But there also are a variety of ways in which it could reduce welfare. It is
possible that programs such as MEP might be welfare-reducing: 1) by promoting
capabilities that the market does not want, 2) by subsidizing firms to do things they
would otherwise pay for themselves, and 3) by allowing low-wage firms to obtain skills
they would otherwise have to pay higher wages to get.
As we have seen, the trend in component manufacturing appears to go against the
types of firms that do relatively better in urban areas, and those that pay high wages.
Above we considered the possibility that market failures are leading firms to under-invest
(from a social point of view) in training, wages, and capital. But it is also possible that
public money spent on capability improvement does not have an acceptable rate of return
even when these externalities are considered.
A second possibility is that subsidized assistance merely substitutes for
expenditures on training and consulting services that firms (rather than taxpayers) would
otherwise make themselves.
Even worse is the possibility that subsidized assistance helps drive out more
responsible competitors who develop capabilities on their own. In this scenario, the
subsidy would be a negative externality to ‘good’ firms (Luria, 1996).
To summarize briefly, we suggest that policy would be likely to be welfare-
improving if it a) promotes the growth of firms that are urban and high-wage, b) provides
firms with information about techniques that may be useful to them, and c) helps
suppliers and customers coordinate on adopting complementary modern manufacturing
methods. It would be welfare-reducing if a) firms were not able find a use for capabilities
gained through MEP training, b) it duplicated services already available on the private
market, or c) it primarily benefited low-wage firms (and did not lead to higher wages).
To move from theory to more specific policy options, there are three kinds of
policies typically recommended for improving manufacturing. The first set are essentially
transfers, such as tax reduction, from some other group toward manufacturers.. Despite
their strong backing by groups such as the National Association of Manufacturers, these
policies typically do not influence plant location, let alone increase national welfare. The
reason is that a) taxes are a small part of manufacturers’ costs and, b) when taxes fall, so
do public services that manufacturers depend on, such as roads, police protection,
education, etc. (See the review by Lynch, 2004). The second set of policies tries to
improve the supply of high-quality inputs, by subsidizing such activities as training,
R&D, and capital. Many of these policies have positive effects. The third set attempts to
improve the way that the inputs are mixed together. That is, these policies attempt to
change firms’ production functions.
The Manufacturing Extension Partnership has tried to implement the second and
third types of policies. The MEP program was loosely modeled on the agricultural
extension program, although the rate of subsidy was much lower (Shapira, 1995). The
MEP was set up in 1989 and is administered by the National Institute of Standards and
Technology (NIST). Federal support for manufacturing extension activities grew from
$6.1 million in 1988 to $138.4 million in 1995, before dropping to $106.6 million in
recent years. Federal support to individual centers must be at least matched by state and
local sources. Jarmin (1999) describes the activities of the centers:
Manufacturing extension centers provide technical and business assistance to small and medium-sized manufacturers, much as agricultural extension agents do for farmers. This assistance often consists of providing “off-the-shelf” solutions to technical problems. Examples might include helping a plant install a CAD/CAM system or switching to newer, lower cost, higher performance materials. Manufacturing extension centers can also channel more recent innovations generated in government and university laboratories to SMEs that lack access to such information. Besides helping plants adopt modern manufacturing technologies, most centers also offer business, marketing, and other “softer” types of assistance.
How well have MEPs done in improving firm productivity? Jarmin (1999)
conducted a careful study of the early years of the MEP program that is superior to what
is possible with our data. Using the Census Bureau’s Longitudinal Research Database, he
estimated that productivity at MEP client firms rose 3.4-16% more between 1987 and
1992 compared to productivity at non-client firms (depending on the method of
estimation).
Jarmin’s study takes a novel approach to the problem that participation in the
program is not random. Firms who are either more productive than average (and therefore
more aggressive) may be more likely to seek out the program, or firms who are less
productive than average (and therefore more desperate for help) may be more likely to
use the program. In either case, the estimates of the effect of the MEP ‘treatment’ will be
biased. Jarmin corrected for this bias by observing that firms that are closer to an MEP
are more likely to use it. His statistical method thus implicitly compares the productivity
of two firms that are identical except that one is close to an MEP center and one is not.
Jarmin does not attempt to compare these benefits to the costs of the program.
However, a rough estimate is possible using data contained in Jarmin and in Shapira
(2004). Project costs for the client are $67,787; Shapira says that these are typically 1/3
of total costs (1/3 of the total comes from the federal government and 1/3 from the state
match), so total costs would be $191,361. If the increase in value-added is conservatively
estimated at 3.4%, the average firm had $306,340 more value-added as a result of the
program than it would have had otherwise. If we assume that the gain compared to non-
clients dissipates over time, so that after five years value-added is the same as at non-
clients, the payback period is 1.6 years—not a bad investment. If the productivity
advantage continues, then the investment is even more productive.
This result suggests that total benefits to society outweigh the costs. This finding,
plus overwhelming reports by participants that the services provided were useful (Shapira
2004), suggests that MEP is developing capabilities that have market applicability.
However, the case for MEP intervention in the previous section relied heavily on the
existence of externalities—benefits that flow to people other than those who make
decisions for the firm. Benefits that flow to workers could relatively easily be measured
by comparing wages in treatment and control groups. Using a different methodology,
Luria (1997) did this comparison, and found no difference. The benefits to customers
would be hard to measure. To the extent that the MEP program increases the supply of
qualified suppliers, component prices will fall. This effect would cause measured
productivity (dollar value of output/ labor hour) to fall—suggesting that Jarmin’s
estimate of total productivity increase is conservative.
Jarmin also provides data on who participates in MEP programs. Firms are much
more likely to participate if an MEP center is geographically close to them. Since centers
are more likely to be in urban areas, this benefits urban firms.
Small firms benefit more from MEP programs, but participate less. We found that
most of the small firms we surveyed did not appear to take advantage of MEP assistance.
Only 6% of these small manufacturing firms reported receiving external assistance from a
publicly supported manufacturing extension center at any time in the past three years.
Since these centers are especially targeted at small manufacturing firms, this is somewhat
surprising (Shapira, 2003). There may be some recall error here, but use of the centers
does not appear to be widespread in our sample.
Why do small firms make so little use of this resource? MEPs often teach courses
piecemeal, without offering an overall improvement plan to the firm. Even if such a plan
is offered, liquidity constraints and lack of organizational slack make it difficult for small
firms to undertake a sustained program of improvement (Helper and Kiehl, 2004).
Cutbacks in federal funding since the time of Jarmin’s study have caused several MEPs,
such as CAMP, the MEP in Northeast Ohio, to focus efforts even more on large firms,
which may require less subsidy (interview with CAMP president Stephen J. Gage,
January 2004). On the other hand, the Pennsylvania MEPs are serving disprortionately
small firms (Deloitte and Touche, 2004).
Most MEPs focus their work on either remedying information problems or
coordination failures. MEPs offer a wide variety of activities, and the programs
emphasized by centers vary even within states. (For example, in Pennsylvania, some
centers focus almost exclusively on teaching lean production, while others do very little
on lean production, and much more on introducing new technology.) However, MEPs
could do much more to remedy coordination failures by working organizing their work
by value chain rather than focusing on individual firms.
An exception is the consortial model of supply chain modernization used by the
Wisconsin MEP. It set up the Wisconsin Manufacturers’ Development Consortium
(WMDC), which provides a single voice to training providers and trains suppliers in
general (rather than OEM-specific) competences, and promotes mutual learning by
harmonizing supplier certification and encouraging cross-supplier communication. This
framework meets diverse supplier needs through multiple institutional supports. For
example, major improvements at formerly struggling suppliers resulted from a mix of
WMDC supplier training, OEM-led (project-based) development, and internal initiatives
at suppliers (Whitford and Zeitlin, 2004).
It is hard to evaluate the argument that MEPs are keeping alive ‘bad’ competitors
given the available evidence. The argument would be true if MEP clients systematically
provided fewer externalities than did non-clients. For example, they might pay lower
wages for similar work, an argument weakened by the finding that wages of clients and
non-clients did not differ. Other data about the differences between clients and non-
clients is not conclusive either way. For example, Deloitte and Touche (2004) found that
the credit scores of Pennsylvania MEP clients are worse than those of non-clients.
Deloitte and Touche argue that this is a positive finding, since it means that the MEPs are
not cream-skimming. (That is, MEP's are not subsidizing services for firms that would
pay for them anyway.) Jarmin (1999) finds that the typical MEP user is a fast-growing,
low-productivity firm. These firms could either be firms that have a distinctive product
but are inefficient, or are low-cost, ‘commodity’ firms (Luria and Wiarda, 1996). Luria
and Wiarda (1996) found that MEP customers improve faster than non-MEP customers in
adopting most technologies, except information technologies. What can we make of this?
In his review of this literature, Shapira (2003) concludes, “[the studies] suggest that not
all desired policy outcomes can be achieved simultaneously”. This seems correct,
although policy could further reduce the possibility that MEP undercuts good competitors
by targeting MEP subsidies toward firms that either provide or commit to providing large
externalities (for example, by paying above-median wages, or hiring hard-to-employ
workers).
CONCLUSION
This paper has argued that the Manufacturing Extension Program has been a
modest success in its current form. A careful study by Jarmin finds significant
productivity increases for MEP clients. A variety of studies suggest that the benefits to
the public outweigh the costs (Shapira, 2003). Changes to the program could increase
these spillover benefits, by renewing the focus on urban firms, and coordinating more
directly with firms’ customers. It would be useful to restore MEP’s ability to provide
subsidized training, allowing the program to reach out with an integrated program to
small firms that lack the capability to plan a coherent change effort, giving priority to
firms that plan to increase wages as a result of the services.
However, the MEP program is not universally popular. According to the Detroit
Free Press (2004), “critics call the program corporate welfare and say it gives an unfair
advantage to small companies. The Bush administration agrees, and has repeatedly tried
to cut federal funding despite protests from Republicans in key election states like
Michigan and Ohio. Michael LaFaive of the Mackinac Center for Public Policy, a
Midland, Mich., think tank that promotes free markets, said the program uses tax revenue
from companies that might otherwise have spent the money to train their own workers.
‘Robbing Peter to pay Paul is no way to improve the overall economy,’ he said. “
These comments seem to misunderstand the nature of the program. In contrast to
tax abatements, the MEP is not just a transfer from taxpayers to companies. As discussed
above, MEP assistance improves efficiency, providing the potential to make both
companies and taxpayers better off.
However, government intervention should not be the only response to market
failures. The benefits of supplier upgrading accrue most strongly to manufacturers.
Associations of these firms could capture the general interest that manufacturers share in
an improved supply chain, and could internalize the training externality. Firms could
maximize their collective self-interest by changing existing institutions (for example,
by requiring measurable progress at suppliers in order for an OEM to renew its ISO
quality certification ). Private consultants can and do help with knowledge diffusion, but
they will tend to emphasize short-term cash generation rather than long-term capability
development (Helper and Kiehl, 2004).
As Honeck (1998) points out, the US has lacked an effective ‘‘regional
productivity coalition’’ that can lobby for broad-based industrial upgrading.
Countries such as Germany, Italy, and Japan have a more integrated, ‘redundant’
approach to industrial upgrading that the US could learn from. However, even an
excellent program may not be enough to restore the health of sector. There are frequent

reports of Chinese firms that offer finished product for less than US makers’ cost of raw
material, due to cheap labor, subsidized capital and subsidized exchange rate.
Thus, the Manufacturing Extension Program is not a cure-all. A variety of policies
are necessary to deal with a problem as multi-faceted as manufacturing job loss. Such
policies may include re-training for laid-off workers, and revised trade policies as a
complement to an expanded MEP program.

REFERENCES Adler, P., Fruin, P. and Liker, F. 1998: Remade in America: Transplanting and Transforming Japanese Production Systems. New York: Oxford University Press. Barker, J.R. 1993: Tightening the iron cage: concertive control in self-managing teams, Administrative Science Quarterly, 38: 408–437.
Becker, G.S. 1975: Human Capital. New York: National Bureau of Economic Research.
Bivens, Josh. 2004 ‘Shifting blame for manufacturing job loss Effect of rising trade deficit shouldn't be ignored’ Economic Policy Institute Briefing Paper, www.epinet.org (April 8).
Cohen, W.M. and Levinthal, D.A. 1990: Absorptive capacity: a new perspective on learning and innovation, Administrative Science Quarterly, 35(1): 128–152.
Cole, R.E. 1985: The macro-politics of organizational change: small-group activities, Administrative Science Quarterly, 30: 560–586. Cusumano, M. and Takeishi, A. 1991: Supplier relations and supplier management: a survey of Japanese, Japanese-transplant, and U.S. auto plants, Strategic Management Journal, 12:563–588. Deloitte and Touche. 2004 “Pennsylvania Manufacturing Study”. Detroit free press. 2004: Program that helps manufacturers gets election-year attention (October 12): http://www.freep.com/news/statewire/sw105541_20041012.htm Dyer, J. 2002: Collaborative Advantage: Winning Through Extended Enterprise Supplier Networks. Oxford: Oxford University Press. Fine, C. 1998: Clockspeed. Reading, MA: Perseus Books. Helper, S. and Kiehl, ,J.2004: Developing Supplier Capabilities: Market and Non-market Approaches, Industry and Innovation, 11 (1-2): 89-107. Helper, S., MacDuffie, J.P. and Sabel, C.F. 2000: Pragmatic collaborations: advancing knowledge while controlling opportunism, Industrial and Corporate Change, 9(3): 443– 483. Herrigel, G. 2004: Emerging strategies and forms of governance in high-wage component manufacturing regions Industry and Innovation., forthcoming
Honeck, J. 1998: Industrial policy for old industrial regions: a comparative study of Ohio and the Basque Country. Unpublished PhD dissertation, University of Wisconsin–Madison. Jarmin, R. 1999: Evaluating the impact of manufacturing extension on productivity growth Journal of Policy Analysis and Management, 18 (1): 99-119 Kenney, M. and Florida, R. 1993: Beyond Mass Production. New York: Oxford University Press. Luria, D. 1996. “Why Markets Tolerate Mediocre Manufacturing” Challenge, 39 (4):11-17. Luria, Daniel D. (1997). Toward lean or rich? What performance benchmarking tells us about SME performance, and some implications for extension center services and mission. In: Shapira, P. and Youtie, J. (editors), Manufacturing Modernization: Learning from Evaluation Practices and Results. Atlanta, GA: School of Public Policy and Economic Development Institute, Georgia Institute of Technology. Luria, D. and Wiarda, E. 1996: Performance benchmarking and measuring program’s impacts on customers: lessons from the Michigan Manufacturing Technology Center, Research Policy, 25(2): 233–246. MacDuffie, J.P. 1995: Human resource bundles and manufacturing performance, Industrial and Labor Relations Review, 48: 197–221. Lynch, Robert. 2004: Rethinking growth strategies: How state and local taxes affect economic development. Washington: Economic Policy Institute Rege, Mari. 2003: Networking Strategy: Cooperate Today in Order to Meet a Cooperator Tomorrow. Case Western Reserve University Department of Economics Working Paper. Rosenthal, Stuart S. and William C. Strange, "The Micro-Empirics of Agglomeration Economies," prepared for the Blackwell Companion to Urban Economics, R. Arnott and D. McMillen, eds., 2003. Sako, M. 1999: From individual skills to organizational capability in Japan, Oxford Review of Economic Policy, 15(1): 114–126. Sako, M. 2002: Supplier development at Honda, Nissan, and Toyota. Available at: http:// www.sbs.ox.ac.uk/downloads/Sako4.pdf. Shapira, Philip (1995): "Manufacturing Extension:Performance, Challenges, and Policy Issues" in Branscomb, L. and J. Keller, 1998. Investing in Innovation: Creating a Research and Innovation Policy. Cambridge, Mass., MIT Press.

Shapira, P. 2003 “Evaluating Manufacturing Extension Services in the United States: Experiences and Insights”, in Learning from Science and Technology Policy. Editors: P. Shapira and S. Kuhlmann (Edward Elgar, 2003). Carl Shapiro and Hal R. Varian (1998) Information Rules: A Strategic Guide to the Network Economy. Harvard Business School Press, Boston. Stanley, Marcus and Susan Helper 2003: Industrial Clusters, social capital, and international competition in the US component manufacturing industry. Presented to “Clusters, Industrial Districts and Firms: the Challenge of Globalization. Conference in honour of Professor Sebastiano Brusco Modena, Italy. (September) Taylor, Michael. 2004: Just-In-Time Funding-- Congressional budgeters approve emergency funding for popular program for manufacturers. INC magazine (October 7) no volume number available: 22. von Hippel, Eric (1988) The Sources of Innovation (New York: Oxford University Press). Whitford, J. and Zeitlin, J. 2004: “Governing Decentralized Production: Institutions, Public Policy, and the Prospects for Inter-firm Collaboration in US Manufacturing, 11 (1-2): 11-44
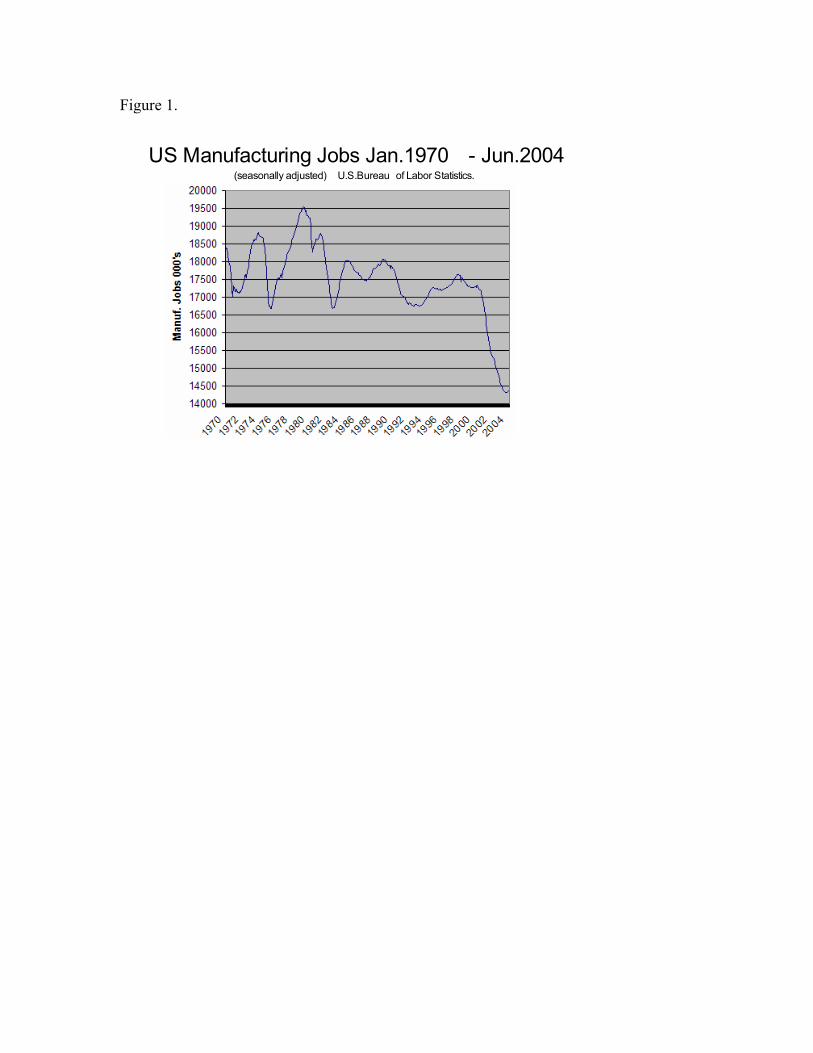
Figure 1.
US Manufacturing Jobs Jan.1970 - Jun.2004(seasonally adjusted) U.S.Bureau of Labor Statistics.