Embed Size (px)
Citation preview
Creating, managing and utilizing a 3D Virtual City in ArcGIS 10.1
Tamrat Belayneh ([email protected]) Eric Wittner ([email protected] )
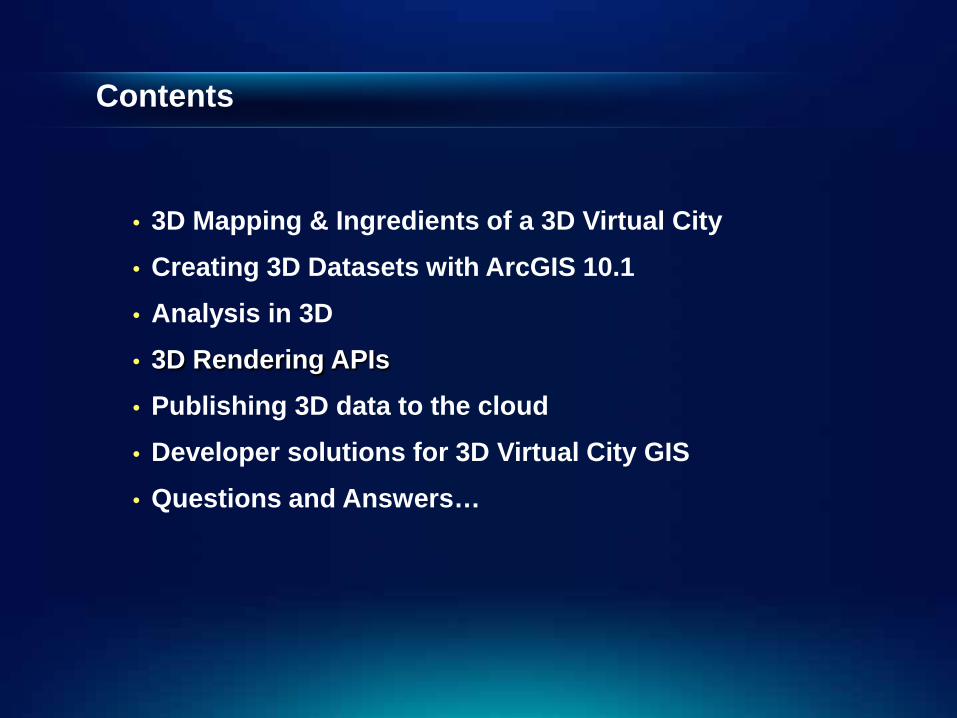
Contents
• 3D Mapping & Ingredients of a 3D Virtual City • Creating 3D Datasets with ArcGIS 10.1 • Analysis in 3D • 3D Rendering APIs • Publishing 3D data to the cloud • Developer solutions for 3D Virtual City GIS • Questions and Answers…

What is 3D Mapping?
• Viewing & Analysis of spatial data in 3D: raster, vector, elevation
• Seamless transitions between global, local and street-level scale data
• Performing GIS analysis within a 3D context

What can 3D Mapping do for you?
• Accurately represent real-world GIS entities • Create realistic 3D virtual cities • Visualize ‘what if’ scenarios • Gain insights into your data, including:
– 3D spatial relationships
– Sizes / Scales
– Visual Sensitivity (LOS, Skyline, Shadows)

Esri’s Solution for 3D Mapping & Visualization
• Desktop: – ArcGIS 3D Analyst (ArcGlobe and ArcScene)
– ArcGIS City Engine (new at 10.1)
– ArcReader / ArcGIS Explorer (available at no cost)
• ArcGIS Engine Solutions: – Globe Control
– Scene Control
• ArcGIS Server Solution: – Globe Server
– Allows analysts to publish rich GIS web Services
– No programming required

Creating 3D Data Sets
• Data Collection • Data Conversion • Data Authoring
- Out of the Box (using GUI) - Symbology
- 3D Marker Symbols - Style Gallery - Using 3D Graphics - Extruding 2D datasets – Attribute Driven
- Custom Solutions - Develop 3D objects using multipatches
- MultiPatch Geometry

Data Collection
Elevation Imagery Types of Data
Facility City Regional / Global
Topographic Subsurface
Models/Multipatches
Across Scales
Points and lines
BIM/IFC
LIDAR
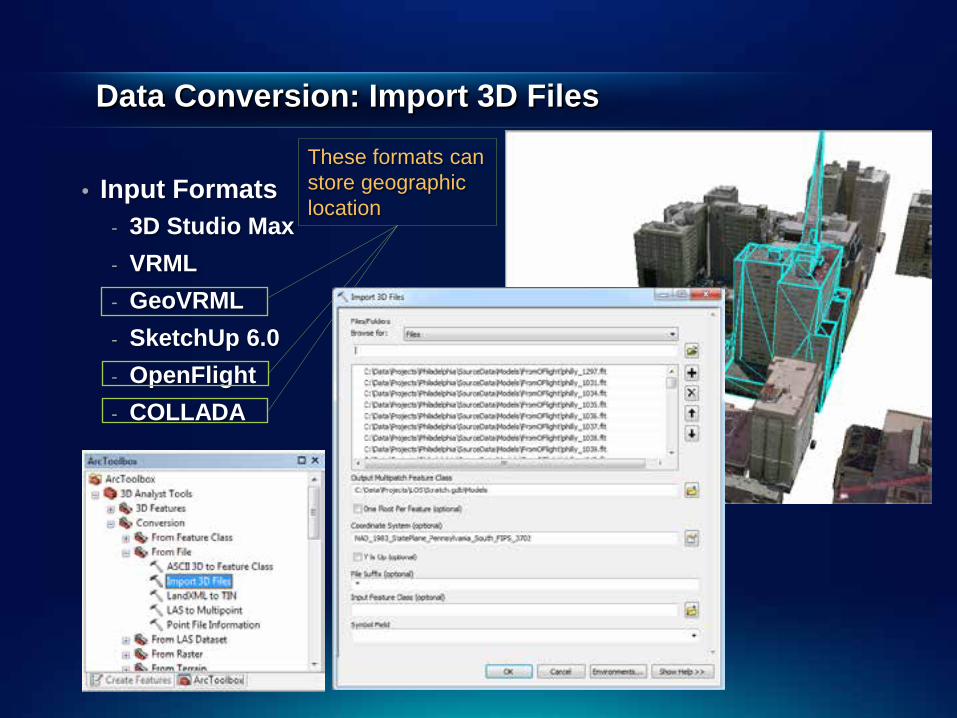
Data Conversion: Import 3D Files
• Input Formats - 3D Studio Max - VRML - GeoVRML - SketchUp 6.0 - OpenFlight - COLLADA
These formats can store geographic location

Data Conversion: Layer 3D to Feature Class • 3D Symbology • Extrusion Settings • Texture Downsampling

Data Authoring – Procedural Techniques
• CityEngine - A platform for authoring rules capable of
generating a variety of 3D Data. - 3D Content from scratch, or driven by
GIS data
- Types of output: - Buildings - Floors - Streets - Vegetation - Street Furniture - Cars - Pedestrians

Authoring – 3D Symbology
• Points – 3D Geometric primitives – 3D Models: Street furniture, etc. – 3D Character Markers – 3D Billboarded Markers
• Lines – 3D Texture Line Symbols – 3D Geometric primitives
–Polygons – 3D Texture Fill Symbols
–Multipatches

Authoring: Adding Visualization elements
• UI based - 3D Graphics Toolbar
- Digitize a point, line, polygons and text graphics - Apply 3D Symbology to the graphic elements
- KML support
• Code Based – 3D Graphics Layer API

Authoring: 3D Templates Provides a guide for how to author a 3D City • Includes:
- Globe document - Layers with pre-design symbology - Example data for exploration - Documentation
Search key word: “3D Virtual City: Philadelphia”
• Additional data management,
authoring and analysis
templates available

3D Data Management and Analysis
• Managing LIDAR Data - LAS Datasets - Classification tools
• Shadow maps on the earth’s surface: - Skyline and Skyline Barrier - Intersect 3D
• Cumulative Line of Sight, using: - Construct Site Lines - Line of Sight - 3D Spatial Join And many more …

Demonstration 1 & 2 Creating and Analyzing
3D Virtual Cities

3D Rendering APIs
• GlobeGraphics API – GraphicsLayer
– GraphicsElement
• Customization API – Application Customization
– Support for CustomGlobe Layer
• OpenGL API – Globe framework provides mechanism to plug-in
OpenGL calls
• 3D Solutions Engineering • Write your own App

//Create a new graphics layer m_ipGlobeGraphicsLayer.CreateInstance(CLSID_GlobeGraphicsLayer); ILayerPtr (m_ipGlobeGraphicsLayer)->put_Name(L“3DGraphicsLayer"); //Add the new graphic layer to the globe IGlobePtr ipGlobe; m_ipGlobeDisplay->get_Globe(&ipGlobe); IScenePtr (ipGlobe)->AddLayer(ILayerPtr(m_ipGlobeGraphicsLayer),
VARIANT_TRUE);
//Activate the new graphics layer IScenePtr (ipGlobe)-
>ActiveGraphicsLayer(ILayerPtr(m_ipGlobeGraphicsLayer));
3D Graphics Layer API Usage (C++)
//Create the element’s geometry IPointPtr ipPoint(CLSID_Point); IZAwarePtr (ipPoint)->put_ZAware(VARIANT_TRUE); ipPoint->PutCoords(position.longitude, position.latitude); ipPoint->put_Z(position.altitude);
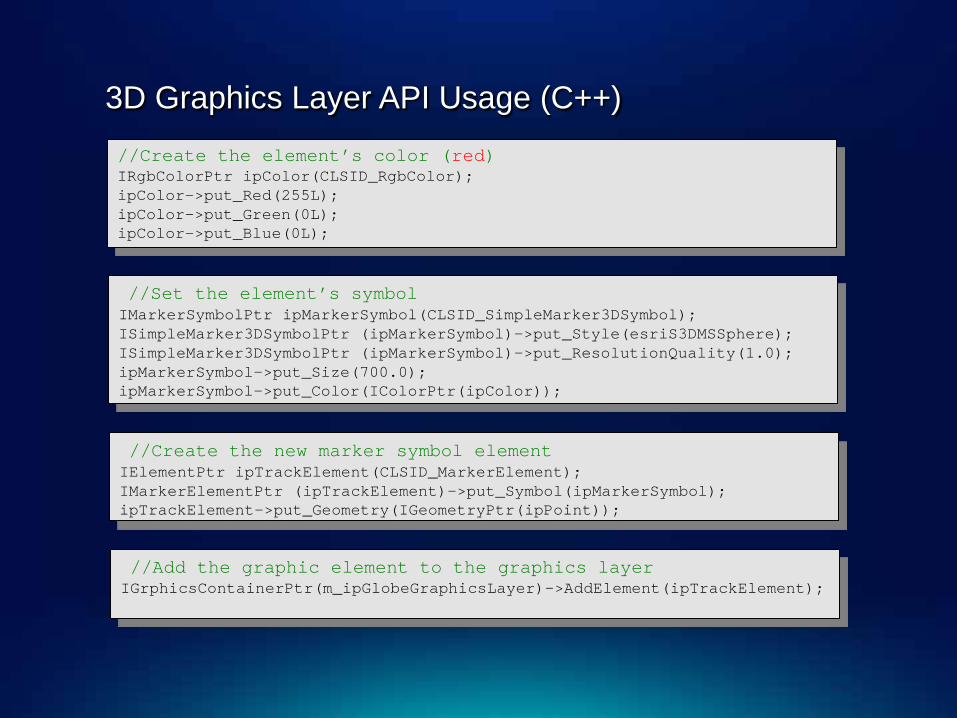
//Create the element’s color (red) IRgbColorPtr ipColor(CLSID_RgbColor); ipColor->put_Red(255L); ipColor->put_Green(0L); ipColor->put_Blue(0L); //Set the element’s symbol IMarkerSymbolPtr ipMarkerSymbol(CLSID_SimpleMarker3DSymbol); ISimpleMarker3DSymbolPtr (ipMarkerSymbol)->put_Style(esriS3DMSSphere); ISimpleMarker3DSymbolPtr (ipMarkerSymbol)->put_ResolutionQuality(1.0); ipMarkerSymbol->put_Size(700.0); ipMarkerSymbol->put_Color(IColorPtr(ipColor));
//Create the new marker symbol element IElementPtr ipTrackElement(CLSID_MarkerElement); IMarkerElementPtr (ipTrackElement)->put_Symbol(ipMarkerSymbol); ipTrackElement->put_Geometry(IGeometryPtr(ipPoint));
//Add the graphic element to the graphics layer IGrphicsContainerPtr(m_ipGlobeGraphicsLayer)->AddElement(ipTrackElement);
3D Graphics Layer API Usage (C++)

Serving the 3D View: ArcGIS Server
• Publish the ArcGlobe document as a GlobeService
• Supports Web-based access
• All ArcGlobe supported data types can be served
• Supports Identify and Searching of features
• Animation is also supported

Serving the 3D View: Sharing at ArcGIS 10.1

Demonstration 3 Consuming 3D content
and performing analysis
in the cloud

Demonstration 4 write your own 3D app