Embed Size (px)
Citation preview

Creating the global leader in Rare Diseases Q1 Results 2016 4
Flemming Ornskov, MD, MPH CEO
Jeff Poulton CFO
April 29, 2016

2
Statements included herein that are not historical facts, including without limitation statements concerning our announced business combination with Baxalta and the timing and financial and strategic benefits thereof, our 20x20 ambition that targets $20 billion in combined product sales by 2020, as well as other targets for future financial results, capital structure, performance and sustainability of the combined company, the combined company’s future strategy, plans, objectives, expectations and intentions, the anticipated timing of clinical trials and approvals for, and the commercial potential of, inline or pipeline products are forward-looking statements. Such forward-looking statements involve a number of risks and uncertainties and are subject to change at any time. In the event such risks or uncertainties materialize, Shire’s results could be materially adversely affected. The risks and uncertainties include, but are not limited to, the following: • the proposed combination with Baxalta Incorporated (“Baxalta”) may not be completed due to a failure to satisfy certain closing conditions, including any shareholder or regulatory
approvals or the receipt of applicable tax opinions; • disruption from the proposed transaction with Baxalta may make it more difficult to conduct business as usual or maintain relationships with patients, physicians, employees or suppliers; • the combined company may not achieve some or all of the anticipated benefits of Baxalta’s spin-off from Baxter International, Inc. (“Baxter”) and the proposed transaction may have an
adverse impact on Baxalta’s existing arrangements with Baxter, including those related to transition, manufacturing and supply services and tax matters; • the failure to achieve the strategic objectives with respect to the proposed combination with Baxalta may adversely affect the company’s financial condition and results of operations; • products and product candidates may not achieve commercial success; • product sales from ADDERALL XR and INTUNIV are subject to generic competition; • the failure to obtain and maintain reimbursement, or an adequate level of reimbursement, by third-party payers in a timely manner for the company’s products may affect future revenues,
financial condition and results of operations, particularly if there is pressure on pricing of products to treat rare diseases; • supply chain or manufacturing disruptions may result in declines in revenue for affected products and commercial traction from competitors; regulatory actions associated with product
approvals or changes to manufacturing sites, ingredients or manufacturing processes could lead to significant delays, an increase in operating costs, lost product sales, an interruption of research activities or the delay of new product launches;
• the successful development of products in various stages of research and development is highly uncertain and requires significant expenditures and time, and there is no guarantee that these products will receive regulatory approval;
• the actions of certain customers could affect the company’s ability to sell or market products profitably, and fluctuations in buying or distribution patterns by such customers can adversely affect the company’s revenues, financial condition or results of operations;
• investigations or enforcement action by regulatory authorities or law enforcement agencies relating to the company’s activities in the highly regulated markets in which it operates may result in significant legal costs and the payment of substantial compensation or fines;
• adverse outcomes in legal matters, tax audits and other disputes, including the company’s ability to enforce and defend patents and other intellectual property rights required for its business, could have a material adverse effect on the company’s revenues, financial condition or results of operations;
• Shire is undergoing a corporate reorganization and was the subject of an unsuccessful acquisition proposal and the consequent uncertainty could adversely affect the company’s ability to attract and/or retain the highly skilled personnel needed to meet its strategic objectives;
• failure to achieve the strategic objectives with respect to Shire’s acquisition of NPS Pharmaceuticals Inc.(“NPS”) or Dyax Corp. (“Dyax”) may adversely affect the company’s financial condition and results of operations;
• the company is dependent on information technology and its systems and infrastructure face certain risks, including from service disruptions, the loss of sensitive or confidential information, cyber-attacks and other security breaches or data leakages that could have a material adverse effect on the company’s revenues, financial condition or results of operations;
• the company may be unable to retain and hire key personnel and/or maintain its relationships with customers, suppliers and other business partners; • difficulties in integrating Dyax or Baxalta into Shire may lead to the company not being able to realize the expected operating efficiencies, cost savings, revenue enhancements, synergies
or other benefits at the time anticipated or at all; and other risks and uncertainties detailed from time to time in Shire’s, Dyax’s or Baxalta’s filings with the Securities and Exchange Commission (“SEC”), including those risks outlined in “ITEM 1A: Risk Factors” in Shire’s and Baxalta’s Annual Reports on Form 10-K for the year ended December 31, 2015. All forward-looking statements attributable to us or any person acting on our behalf are expressly qualified in their entirety by this cautionary statement. Readers are cautioned not to place undue reliance on these forward-looking statements that speak only as of the date hereof. Except to the extent otherwise required by applicable law, we do not undertake any obligation to republish revised forward-looking statements to reflect events or circumstances after the date hereof or to reflect the occurrence of unanticipated events.
“SAFE HARBOR” Statement Under the Private Securities Litigation Reform Act of 1995

3
Flemming Ornskov, MD MPH
Business update
Jeff Poulton Financial review
Flemming Ornskov, MD MPH
Summary
Q & A All
Agenda

4
2013 2014 2015 2016 2017 2018 2019 2020+
2013-2015 Becoming OneShire • Step-change in performance • Effective and efficient
organization • Established foundation for
long-term growth
2014-2016 Building a leading global biotech company • Creating scale and momentum • Culture of bold innovation – internal
and external • Patient-centric Rare Diseases mindset
2016+ Global Leadership in Rare Diseases • Multiple, durable, best-in-class products • Compelling financial profile • Enhanced diversification and optionality
Building a high-growth biotechnology company focused on rare diseases

5
Drive strong growth and financial results
• Strong double digit top & Non GAAP bottom line growth • Strong cash flow generation, efficient operating margin • Investing in future growth drivers
• Lifitegrast launch planning in full stride(1)
• 14 Phase 3 and Phase 3 ready programs including four starts in Q1 2016
• SHP465 positive data; on track for NDA resubmission by end of 2016
• Continue to expand the Rare Disease portfolio • Dyax integration progressing well • Significant progress on Baxalta integration planning
Progress innovative pipeline
Build through value-creating acquisitions
(1) Subject to regulatory approval.
Significant progress achieved in Q1 towards both near and long term goals

6
Q1 2015
Q1 2016
Product Sales $1,627M
$1,423M
16% CER(2)(3)
Non GAAP EPS ADS(1)(3)
Q1 2015
Q1 2016 $3.19
$2.84
12% CER(2)(3)
GROWTH INNOVATION
Strong double digit sales growth; 46% non GAAP EBITDA margin maintained
Lifitegrast PDUFA date July 22, 2016; Launch planned for Q3 2016(4)
VYVANSE, LIALDA, CINRYZE and FIRAZYR all continuing to deliver strong growth, driven by increased volumes
Positive results in adolescents safety and efficacy trial for SHP465; resubmission planned for Q4 2016
New product launches GATTEX and NATPARA performing well SHP643 (DX2930) Phase 3 studies enrolling
(1) This is a Non GAAP financial measure. The most directly comparable measure under US GAAP is EPS-ADS (Q1 2016: $2.12, Q1 2015: $2.08). (2) This is a Non GAAP financial measure. Constant exchange rates ("CER") performance is determined by comparing 2016 performance (restated using average 2015 foreign exchange rates for
the relevant period) to actual 2015 reported performance. (3) See slide 32 for a list of items excluded from the US GAAP equivalent used to calculate all Non GAAP measures detailed above. A reconciliation of Non GAAP financial measures to the most
directly comparable measure under US GAAP is presented in Shire’s Q1 2016 earnings release on pages 19 to 22. (4) Subject to regulatory approval.
Continuing to deliver strong results while investing in our future

7
(1) Growth rates are at Constant exchange rates (“CER”), a Non GAAP financial measure. CER performance is determined by comparing 2016 performance (restated using 2015 exchange rates for the relevant period) to actual 2015 reported performance. See slide 32 for a list of items excluded from the US GAAP equivalent used to calculate all Non GAAP measures detailed above. A reconciliation of Non GAAP financial measures to the most directly comparable measure under US GAAP is presented in Shire's Q1 2015 earnings release on pages 19 to 22.
(2) GATTEX refers to pro-forma growth including product sales recorded by NPS prior to acquisition by Shire on a CER basis.
• Performing strongly in US adult market, with TRx up 9.8% YoY • International growth continues to benefit from gains in established
markets
VYVANSE sales $509m; +23%(1)
• Continued market share growth in US; +4.6% percentage points vs March 2015, ending the quarter with a 38.4% share of the US 5-ASA class
LIALDA/MEZAVANT sales $168m; +14%(1)
• More patients on therapy and higher utilization driving volume growth
CINRYZE sales $164m; +11%(1)
• Increased number of patients on therapy and higher utilization driving strong volume growth
FIRAZYR sales $128m; +40%(1)
• Strong performance in US since acquisition of NPS, driven by new patient uptake and the addition of the LIALDA salesforce to support promotion
GATTEX/REVESTIVE sales $52m; +98%(2)
• Strong US launch continues • European CHMP discussions progressing well
NATPARA sales $16m
Growth across the product portfolio

8
Expand
Build
Sustain Ensure leadership over time through LCM, Commercial Excellence and strong defense of Intellectual Property Examples: • Neuroscience • GI/Endocrine Deepen and strengthen existing
categories by developing and acquiring new assets Examples: • Ophthalmics • Hereditary Angioedema (HAE)
Broaden footprint into new categories with high potential and that fit our model Examples: • Hemophilia(1)
• Immunology(1) • Oncology(1) • Transplant
(1) Hemophilia, Oncology and Immunology are conditioned on the closing of the Baxalta acquisition.
Our approach to driving innovation and long-term growth

9
Preclinical Phase 1 Phase 2 Phase 3 Registration
27 Research Programs
SHP627 Focal Segmental
Glomerulosclerosis
SHP631 Hunter Syndrome
SHP616 (CINRYZE SC)
HAE Prophylaxis
SHP623 (rC1-INH)
HAE prophylaxis
SHP626 Non-Alcoholic
Steatohepatitis
SHP622 Friedreich’s Ataxia
SHP616 (CINRYZE)* Acute Neuromyelitis
Optica (Ph2/3)
SHP610
Sanfilippo A
LDX (Japan) ADHD (Ph2/3)
SHP607 Prevention of ROP
SHP625 Progressive Familial
Intrahepatic Cholestasis
SHP625 Alagille Syndrome
SHP616 (CINRYZE)
Acute Antibody Mediated Rejection
SHP625 Primary Sclerosing
Cholangitis
SHP625 Primary Biliary Cirrhosis
SHP621 Eosinophilic esophagitis
FIRAZYR (Japan)
HAE (Ph2/3)
SHP616 (CINRYZE) (Japan)*
HAE prophylaxis
NATPAR (EU) Hypoparathyroidism
SHP606 (lifitegrast)
Dry eye disease
Rare Diseases Programs
SHP640 * Infectious Conjunctivitis
SHP620 (maribavir)* CMV in transplant
patients
SHP609 Hunter IT (Ph 2/3)
SHP611 MLD
(Ph 1/2)
Programs are Phase 3 ready *
SHP643 (DX2930)
Prophylaxis of HAE
SHP465 ADHD
SHP555 (US) Chronic Constipation
REVESTIVE (Japan)
Short bowel syndrome
SHP608
Dystrophic E.Bullosa (clinical hold)
SHP630 adRP
SHP637 MRT for CF
SHP639 Glaucoma
SHP641 MRT for UCD
INTUNIV (Japan) ADHD
TH / GCH1 GenePod
Parkinson’s Subset
Changes since Q4 2015 • Totality of SHP625 data being assessed; programs under review
R&D Pipeline most robust in Shire’s history

10
• Prescription Drug User Fee Act (PDUFA) date July 22, 2016
• Anticipate potential launch in Q3 2016(6)
• Continued engagement with international regulatory authorities
• Build out of commercial infrastructure underway
• Increasing awareness of Shire at key society meetings (ophthalmology and optometry)
• Disease state education initiatives ongoing
DED: one of the most common eye diseases in the US(1)
~29 million affected Incidence may be growing: aging population, menopause, use of other irritating medications, improved awareness/diagnosis
14 million diagnosed(2) ▪ ~1/3 of diabetics may have DED(3)
Existing Rx treatments: ~$1.3B(4) ▪ No treatment indicated for signs and
symptoms ▪ Possibility of ocular burning(5)
▪ May need several months before onset of effect(5)
(1) The epidemiology of dry eye disease: report of the Epidemiology Subcommittee of the International Dry Eye WorkShop (2007). - Ocul Surf. 2007 Apr;5(2):93-107. Review. (2) Internal Shire market research. (3) Cafrey BE, et al, Adv Exp Med Biol 1998. (4) Proforma sales, Allergan Q4 and FY 2015 Results Presentation. (5) Restasis Prescribing Information. (6) Subject to regulatory approval.
Lifitegrast: a potential innovative product for Dry Eye Disease

11
Top 5 Products in Adult Market (by Market Share (1))
Total ADDERALL IR 39%
Total ADDERALL XR 22%
VYVANSE 17%
Methylphenidate 13%
Total Concerta 6%
(1) IMS TRx data, March 2016.
• Concentrated HCP customer base
• Clear target patient population
• Powerful value proposition
~ 10% of the adult patients are using a combination of extended release with an immediate release treatment, most often for additional duration
SHP465: Advancing a new treatment option for patients with ADHD
• Completed a key FDA trial study requirement for a Class 2 approval re-submission; on track for a potential 2H 2017 US launch
• Study reported positive results in safety and efficacy study in children and adolescents
• An important step in providing a new treatment option for patients with ADHD, and sustaining the growth of our NeuroScience franchise
• Expected, on approval, to have 3 years of Hatch-Waxman exclusivity and at least 3 patents listed in the FDA Orange Book, expiring as late as May 2029

12
Core opportunity Secondary opportunities
2016
2015
2014
SHP643 (DX2930) for HAE • First patient dosed in Phase 3 study
in Q1 2016; results expected 2017
GATTEX for SBS • Sales increased 53% in 2015
to $142m(1)
NATPARA for hypoparathyroidism • Strong April 2015 US launch • Expected MAA approval in Q4 2016
CINRYZE for HAE • Sales increased 23% in 2015
to $618m
• Meaningful revenues from Kalbitor for HAE; Dyax achieved sales of $67m in 2015
• Royalty stream from licensed Dyax Phage technology
• Meaningful royalty stream from Sensipar; $115m in 2015
• Cinryze new indications • SHP620 (maribavir) for CMV
(Phase 3 ready) • SHP621 for EoE (Phase 3) • Buccolam sales increased 82%
in 2015
Shire has a strong track record of driving growth and innovation through M&A
(1) GATTEX refers to pro-forma growth including product sales recorded by NPS prior to acquisition by Shire on a CER basis.

13
High
Low An
ticip
ated
deg
ree
of c
hang
e
• Commercial excellence executed • Customer interactions preserved • Salesforces retained
Sales & Marketing,
Patient Support
• Clinical expertise preserved • High-priority programs allocated
appropriate resources • Ongoing disciplined prioritization
including rationalization and divestitures where appropriate
Research & Development
• Expertise retained • Optimized geographic footprint Manufacturing
• Lean and nimble operating structure across combined organization
General & Administrative
Shire approach to integration follows an inverted pyramid structure
14
Integration planning
2 companies, 2 organizations
Integration (continued planning and execution)
1 company merging into 1 organization
Jan 11 Transaction announced
Mid-2017 All integration activities
completed / initiated
Expected close on or
around June 3
Jan 27-Feb 5 Integration
kick-off
Day 100 May 27 Shareholder
votes
Today
Apr 18 - Class 1 circular and
prospectus approved
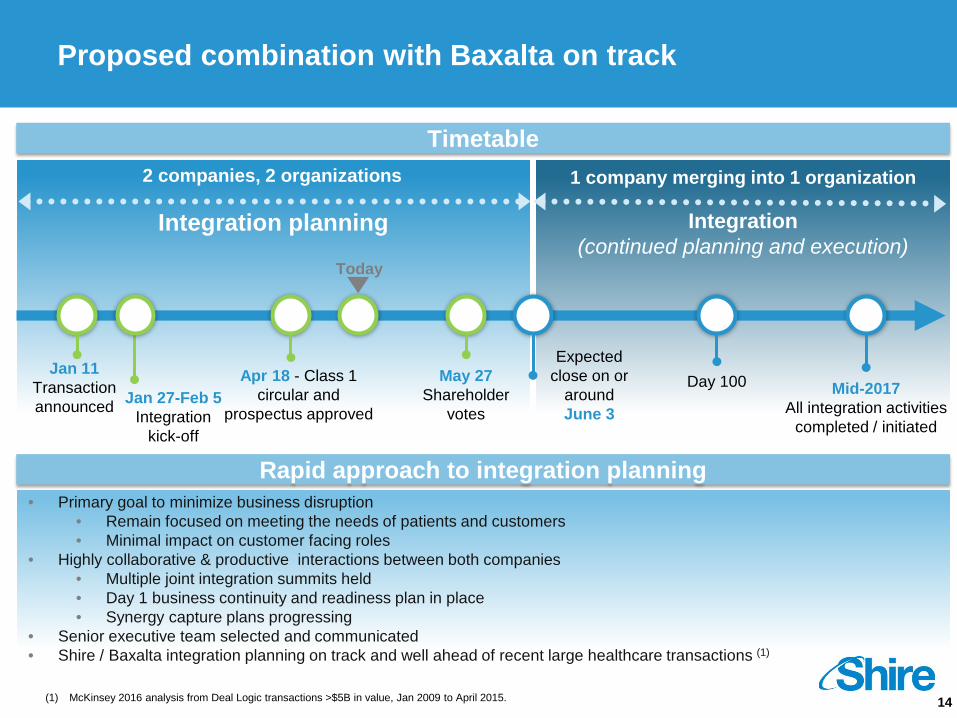
• Primary goal to minimize business disruption • Remain focused on meeting the needs of patients and customers • Minimal impact on customer facing roles
• Highly collaborative & productive interactions between both companies • Multiple joint integration summits held • Day 1 business continuity and readiness plan in place • Synergy capture plans progressing
• Senior executive team selected and communicated • Shire / Baxalta integration planning on track and well ahead of recent large healthcare transactions (1)
Rapid approach to integration planning
Timetable
(1) McKinsey 2016 analysis from Deal Logic transactions >$5B in value, Jan 2009 to April 2015.
Proposed combination with Baxalta on track

Our purpose We enable people with life-altering conditions to lead better lives.
Financial Review Jeff Poulton, Chief Financial Officer

16
(1) Results include NPS in 2015 (acquired on February 21, 2015) and Dyax in 2016 (acquired January 22, 2016). (2) This is a Non GAAP financial measure. Constant exchange rates ("CER") performance is determined by comparing 2016 performance (restated using average 2015 foreign exchange rates for the relevant period) to
actual 2015 reported performance. (3) This is a Non GAAP financial measure. The most directly comparable measure under US GAAP is Net Income (Q1 2016: $419m, Q1 2015: $410m). (4) This is a Non GAAP financial measure. The most directly comparable measure under US GAAP is Net Income margin (Q1 2016: 25%, Q1 2015: 28%). (5) Non GAAP earnings before interest, tax, depreciation and amortization (“EBITDA”) as a percentage of product sales, excluding royalties and other revenues. (6) This is a Non GAAP financial measure. The most directly comparable measure under US GAAP is EPS-ADS (Q1 2016: $2.12, Q1 2015: $2.08). (7) This is a Non GAAP financial measure. The most directly comparable measure under US GAAP is Net Cash provided by operating activities (Q1 2016: $390m, Q1 2015: $562m). (8) See slide 32 for a list of items excluded from the US GAAP equivalent used to calculate all Non GAAP measures detailed above. A reconciliation of Non GAAP financial measures to the most directly comparable measure
under US GAAP is presented in Shire's Q1 2016 earnings release on pages 19 to 22.
Q1 2016 $m(1)
Q1 2015 $m(1)
Reported Growth
CER Growth(2)(8)
Product Sales 1,627 1,423 +14% +16%
Royalties and Other Revenues 82 65 +26% +26%
Total Revenue 1,709 1,488 +15% +17%
Non GAAP EBITDA(3)(8) 831 715 +16% +16%
Non GAAP EBITDA margin(4)(5)(8) 46% 46% 0% point -1% point
Non GAAP diluted EPS – ADS(6)(8) 3.19 2.84 +12% +12%
Non GAAP Cash Generation(7)(8) 492 516 -5%
Strong start to the year, with Non GAAP EPS of $3.19 up 12%
17
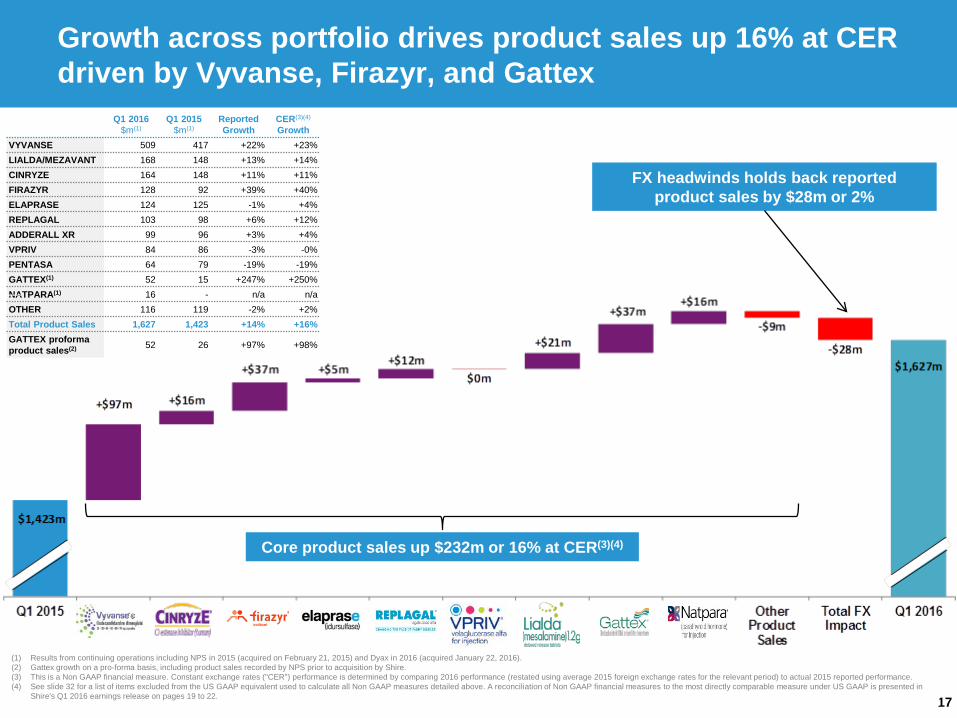
(1) Results from continuing operations including NPS in 2015 (acquired on February 21, 2015) and Dyax in 2016 (acquired January 22, 2016). (2) Gattex growth on a pro-forma basis, including product sales recorded by NPS prior to acquisition by Shire. (3) This is a Non GAAP financial measure. Constant exchange rates ("CER") performance is determined by comparing 2016 performance (restated using average 2015 foreign exchange rates for the relevant period) to actual 2015 reported performance. (4) See slide 32 for a list of items excluded from the US GAAP equivalent used to calculate all Non GAAP measures detailed above. A reconciliation of Non GAAP financial measures to the most directly comparable measure under US GAAP is presented in
Shire's Q1 2016 earnings release on pages 19 to 22.
FX headwinds holds back reported product sales by $28m or 2%
Core product sales up $232m or 16% at CER(3)(4)
Growth across portfolio drives product sales up 16% at CER driven by Vyvanse, Firazyr, and Gattex
Q1 2016 $m(1)
Q1 2015 $m(1)
Reported Growth
CER(3)(4) Growth
VYVANSE 509 417 +22% +23% LIALDA/MEZAVANT 168 148 +13% +14% CINRYZE 164 148 +11% +11% FIRAZYR 128 92 +39% +40% ELAPRASE 124 125 -1% +4% REPLAGAL 103 98 +6% +12% ADDERALL XR 99 96 +3% +4% VPRIV 84 86 -3% -0% PENTASA 64 79 -19% -19% GATTEX(1) 52 15 +247% +250% NATPARA(1) 16 - n/a n/a OTHER 116 119 -2% +2% Total Product Sales 1,627 1,423 +14% +16% GATTEX proforma product sales(2) 52 26 +97% +98%

18
(1) Results from continuing operations including NPS in 2015 (acquired on February 21, 2015) and Dyax in 2016 (acquired January 22, 2016). (2) This is a Non GAAP financial measure. The most directly comparable measure under US GAAP is R&D (Q1 2016: +12%, Q1 2015: -46%). (3) This is a Non GAAP financial measure. The most directly comparable measure under US GAAP is SG&A (Q1 2016: +20%, Q1 2015: +18%). (4) This is a Non GAAP financial measure. The most directly comparable measure under US GAAP is Combined R&D and SG&A (Q1 2016: +18%, Q1 2015: -11%). (5) This is a Non GAAP financial measure. The most directly comparable measure under US GAAP is Gross Margin (Q1 2016: 84.7%, Q1 2015: 84.0%). (6) This is a Non GAAP financial measure. The most directly comparable measure under US GAAP is R&D (Q1 2016: 13%, Q1 2015: 14%). (7) This is a Non GAAP financial measure. The most directly comparable measure under US GAAP is SG&A (Q1 2016: 37%, Q1 2015: 36%). (8) This is a Non GAAP financial measure. The most directly comparable measure under US GAAP is Net income Margin (Q1 2016: 25%, Q1 2015: 28%). (9) Excluding Royalties and Other Revenues. (10) See slide 32 for a list of items excluded from the US GAAP equivalent used to calculate all Non GAAP measures detailed above. A reconciliation of Non GAAP financial measures to the most directly comparable measure under US GAAP is presented in
Shire's Q1 2016 earnings release on pages 19 to 22.
Year on Year Change: Q1 2016(1)
Product Sales +14%
Non GAAP R&D(2)(10) +14%
Non GAAP SG&A(3)(10) +14%
Combined Non GAAP R&D and SG&A(4)(10) +14%
Ratios: % of Product Sales Q1 2016(1) Q1 2015(1)
Non GAAP Gross Margin(5)(10) 86.0% 85.8%
Non GAAP R&D(6)(10) 13% 13%
Non GAAP SG&A(7)(10) 27% 27%
Non GAAP EBITDA(8)(9)(10) 46% 46%
Delivery of strong Non GAAP EBITDA margins in Q1 2016

19
Continued strong Non GAAP cash generation; Non GAAP net debt increases following Q1 2016 close of Dyax acquisition
(67)
(22)
5,310
(5,693)
338
(52)
(102)
492
March 31, 2016 $m
December 31, 2015 $m
Cash and cash equivalents 69 136
Long term borrowings (4,654) (70)
Short term borrowings (2,211) (1,512)
Other debt (13) (13)
Non GAAP net debt(2) (6,809) (1,459)
Non GAAP Cash Generation(1)(3)
Non GAAP Free Cash Flow(1)(3)
Net draw down of facility and term loans
Other investing and financing
Net Cash outflow
Tax and Interest payments
Capital expenditure
Payments for business combinations
(1) This is a Non GAAP financial measure. The most directly comparable measure under US GAAP is Net cash provided by operating activities (Q1 2016: $390m, Q1 2015: $562m). (2) Non GAAP net debt represents US GAAP cash and cash equivalents less US GAAP short and long term borrowings and other debt (see above for details). (3) See slide 32 for a list of items excluded from the US GAAP equivalent used to calculate all Non GAAP measures detailed above. A reconciliation of Non GAAP financial measures to the most directly comparable
measure under US GAAP is presented in Shire's Q1 2016 earnings release on pages 19 to 22.

20
2016 Guidance: Includes Dyax / Excludes Baxalta
(1) Results from continuing operations including NPS in 2015 (acquired on February 21, 2015) and Dyax in 2016 (acquired January 22, 2016). (2) Based on a latest assumption of a full year 2016 weighted average number of ordinary shares of approximately 595 million. (3) This is a Non GAAP financial measure. Constant exchange rates ("CER") performance is determined by comparing 2016 performance (restated using average 2015 foreign exchange rates for the relevant period) to actual 2015 reported performance. (4) See slide 32 for a list of items excluded from the US GAAP equivalent used to calculate all Non GAAP measures detailed above. A reconciliation of Non GAAP financial measures to the most directly comparable measure under US GAAP is presented in
Shire's Q1 2016 earnings release on pages 19 to 22.
Full Year 2016 Dynamics
CER Growth(3)(4)
Impact of FX Rates on Guidance
Guidance(1)
Total Product Sales 13-17% -2 to -3% points 11-14% higher than in 2015
Royalties & Other Revenues 5-10% higher than in 2015
Non GAAP Gross Margins(4) Similar to 2015 levels
Non GAAP Combined R&D and SG&A(4) 12-14% higher than in 2015
Non GAAP Net Interest/Other(4) 1.5 to 2 times 2015 levels
Non GAAP Tax Rate(4) Core effective tax rate of 16-18%
Non GAAP Diluted Earnings per ADS(2)(4) 9-13% -2 to -3% points 7-10% higher than in 2015
Capital Expenditure ~$300m
Our 2016 Outlook is based on January 31, 2016 exchange rates holding through 2016:
Exchange Rate
EUR $1.08
GBP $1.42
CHF $0.98
CAD $0.71

Our purpose We enable people with life-altering conditions to lead better lives.
Summary
Flemming Ornskov, MD MPH, Chief Executive Officer

22
Execution of strategy is delivering
(1) Pending completion of Baxalta acquisition. (2) Subject to approval by regulatory authorities.
Continued execution 2016 priorities
Expand and strengthen manufacturing
Launch lifitegrast(2)
Advance SHP607 (ROP), SHP643 (HAE) and SHP465 (ADHD)
Advance Shire’s largest number of Phase 3 trials
Integrate Dyax and Baxalta(1) GROWTH
EFFICIENCY
INNOVATION
PEOPLE
Creating a global leader in Rare Diseases
Delivering results
Growth in revenues
and earnings

Questions and Answers

Our purpose We enable people with life-altering conditions to lead better lives.
APPENDIX
25
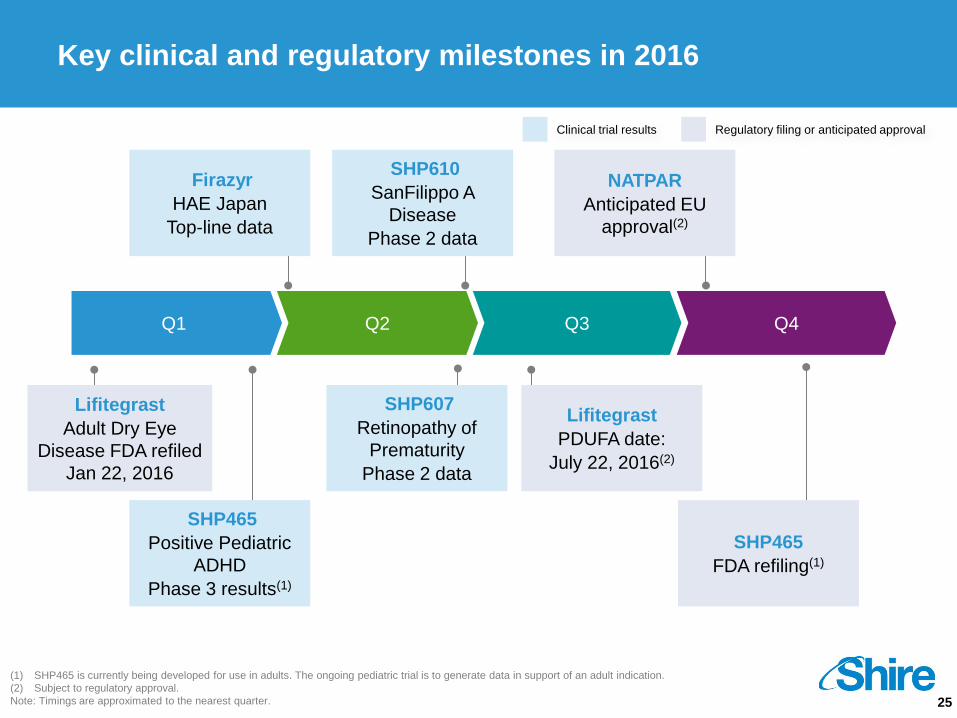
Q1 Q2 Q3 Q4
SHP610 SanFilippo A
Disease Phase 2 data
Firazyr HAE Japan
Top-line data
SHP465 Positive Pediatric
ADHD Phase 3 results(1)
Lifitegrast Adult Dry Eye
Disease FDA refiled Jan 22, 2016
SHP607 Retinopathy of
Prematurity Phase 2 data
Lifitegrast PDUFA date:
July 22, 2016(2)
SHP465 FDA refiling(1)
NATPAR Anticipated EU
approval(2)
Clinical trial results Regulatory filing or anticipated approval
(1) SHP465 is currently being developed for use in adults. The ongoing pediatric trial is to generate data in support of an adult indication. (2) Subject to regulatory approval. Note: Timings are approximated to the nearest quarter.
Key clinical and regulatory milestones in 2016

26
(1) Results from continuing operations including NPS in 2015 (acquired on February 21, 2015) and Dyax in 2016 (acquired January 22, 2016).
Product Sales – Regional Analysis
US Europe LATAM Other Total Q1 2016 Product Sales $m(1) 1,228 269 29 101 1,627 % of Product Sales 75% 17% 2% 6% 100% YoY Growth +18% +6% +6% +4% +14%
FY 2015 Product Sales $m(1) 4,454 1,043 202 401 6,100 % of Product Sales 73% 17% 3% 7% 100% YoY Growth +9% -9% -6% +4% +5%

27 (1) Results include NPS in 2015 (acquired on February 21, 2015) and Dyax in 2016 (acquired January 22, 2016).
Royalties and Other Revenues
Q1 2016 $m(1)
Q1 2015
$m(1) Reported Growth
SENSIPAR 38 10 +264%
3TC and ZEFFIX 15 8 +100%
FOSRENOL 9 8 +10%
ADDERALL XR 6 9 -32%
Other 11 28 -60%
Royalties 79 63 +26%
Other Revenues 3 2 +17%
Royalties & Other Revenues 82 65 +26%

28
Shire income statement growth analysis
2015 Q1(1)
2015 Q2(1)
2015 Q3(1)
2015 Q4(1)
2015 FY(1)
2016 Q1(1)
FY 2016 Dynamics(7)
Guidance
Total Product Sales $1,423m $1,476m $1,577m $1,624m $6,100m $1,627m 11%-14% higher than in 2015
versus prior year +9% +0% +2% +8% +5% +14%
Royalties & Other Revenues $65m $82m $78m $92m $317m $82m 5%-10% higher than in 2015
versus prior year +68% +150% +73% +22% +65% +26%
Total Revenue $1,488m $1,558m $1,655m $1,716m $6,417m $1,709m
versus prior year +11% +4% +4% +9% +7% +15%
Non GAAP Gross Margin (2)(8) 86% 86% 84% 86% 86% 86% Similar to 2015 levels
Combined Non GAAP R&D and SG&A (3)(8) $571m $697m $652m $688m $2,608m $651m 12%-14% higher than in 2015
versus prior year +6% +16% +5% +2% +7% +14%
Non GAAP EBITDA Margin(4)(8) 46% 39% 43% 43% 43% 46%
Non GAAP Tax Rate(5)(8) 17% 13% 10% 21% 16% 18% Core effective tax rate of 16-18%
Non GAAP diluted Earnings per ADS(6)(8) $2.84 $2.63 $3.24 $2.97 $11.68 $3.19 7%-10% higher than in 2015
versus prior year +20% -2% +11% +13% +10% +12%
(1) Results from continuing operations including NPS in 2015 (acquired on February 21, 2015) and Dyax in 2016 (acquired January 22, 2016). (2) This is a Non GAAP financial measure. The most directly comparable measure under US GAAP is Gross Margin (Q1 2016: 84.7%, Q1 2015: 84.0%) (3) This is a Non GAAP financial measure. The most directly comparable measure under US GAAP is Combined R&D and SG&A (Q1 2016: +18%, Q1 2015: -11%) (4) This is a Non GAAP financial measure. The most directly comparable measure under US GAAP is Net income Margin (Q1 2016: 25%, Q1 2015: 28%) (5) This is a Non GAAP financial measure. The most directly comparable measure under US GAAP is Tax rate (Q1 2016: 17%, Q1 2015: 12%) (6) This is a Non GAAP financial measure. The most directly comparable measure under US GAAP is EPS-ADS (Q1 2016: $ 2.12, Q1 2015: $2.08) (7) FY 2016 guidance includes the effect of Dyax, but excludes the effect of Baxalta. (8) See slide 32 for a list of items excluded from the US GAAP equivalent used to calculate all Non GAAP measures detailed above. A reconciliation of Non GAAP financial measures to the most directly comparable measure under US GAAP is presented in
Shire's Q1 2016 earnings release on pages 19 to 22.

29
(1) This is a Non GAAP financial measure. The most directly comparable measure under US GAAP is Net cash provided by operating activities (see details above). (2) See slide 32 for a list of items excluded from the US GAAP equivalent used to calculate all Non GAAP measures detailed above. A reconciliation of Non GAAP
financial measures to the most directly comparable measure under US GAAP is presented in Shire's Q1 2016 earnings release on pages 19 to 22.
Non GAAP cash flow measures
Non GAAP cash generation(1)(2) and Non GAAP free cash flow(1)(2) reconciliation
Q1 2016
$m Q1 2015
$m Reported Growth
Non GAAP cash generation(1)(2) 492 516 -5%
Tax and interest (receipts)/payments, net (102) 46
US GAAP Net cash provided by operating activities 390 562 -31%
Capital expenditure (52) (20)
Non GAAP free cash flow(1)(2) 338 542 -38%

30
(1) Non GAAP net debt represents US GAAP cash and cash equivalents less US GAAP short and long term borrowings and other debt (see above for details). (2) See slide 32 for a list of items excluded from the US GAAP equivalent used to calculate all Non GAAP measures detailed above. A reconciliation of Non GAAP financial measures to
the most directly comparable measure under US GAAP is presented in Shire's Q1 2016 earnings release on pages 19 to 22.
At March 31, 2016 Shire had a $2.1bn revolving credit facility that matures in December 2020. Shire also had a $5.6bn term loan facility and a $18bn bridge loan. The term loan facility has been fully utilized to finance the acquisition of Dyax and amortizes over its 3 year life, maturing in 2018. The $18bn bridge loan arranged to fund the Baxalta acquisition has not been utilized. It matures in 2017, although the maturity date may be extended at Shire’s option by twelve months.
Non GAAP net (debt)/cash
March 31, 2016
$m December 31, 2015
$m
Cash and cash equivalents 69 136
Long term borrowings (4,654) (70)
Short term borrowings (2,211) (1,512)
Other debt (13) (13)
Non GAAP net debt (1)(2) (6,809) (1,459)

31
(1) Results include NPS in 2015 (acquired on February 21, 2015) Dyax in 2016 (acquired January 22, 2016). (2) This is a Non GAAP financial measure. The most directly comparable measure under US GAAP is US GAAP Operating income (see details below). (3) See slide 32 for a list of items excluded from the US GAAP equivalent used to calculate all Non GAAP measures detailed above. A reconciliation of Non
GAAP financial measures to the most directly comparable measure under US GAAP is presented in Shire's Q1 2016 earnings release on pages 19 to 22.
Q1 2016 – Operating Income US GAAP and Non GAAP
Q1 2016
$m(1) Q1 2015
$m(1) Reported Growth
Non GAAP Operating Income(2)(3) from continuing operations 797 683 +17%
Intangible asset amortisation (135) (88)
Legal and litigation costs (15) (1)
Integration and acquisition costs (104) (87)
Gains on sale of product rights 4 5
Reorganization costs (3) (15)
Other - (22)
US GAAP Operating Income from continuing operations 544 475 +15%

32
This presentation contains financial measures not prepared in accordance with US GAAP. These measures are referred to as “Non GAAP” measures and include: Non GAAP operating income; Non GAAP net income; Non GAAP diluted earnings per ADS; effective tax rate on Non GAAP income before income taxes and earnings/(losses) of equity method investees (“effective tax rate on Non GAAP income”); Non GAAP cost of product sales; Non GAAP gross margin; Non GAAP R&D; Non GAAP SG&A; Non GAAP other income/(expense); Non GAAP interest income; Non GAAP interest expense; Non GAAP cash generation; Non GAAP free cash flow, Non GAAP net debt, Non GAAP EBITDA and Non GAAP EBITDA margin (excluding royalties and other revenues). These Non GAAP measures exclude the effect of certain cash and non-cash items that Shire's management believes are not related to the core performance of Shire’s business. These Non GAAP financial measures are used by Shire’s management to make operating decisions because they facilitate internal comparisons of Shire’s performance to historical results and to competitors’ results. Shire’s Remuneration Committee uses certain key Non GAAP measures when assessing the performance and compensation of employees, including Shire’s executive directors. The Non GAAP measures are presented in this presentation as Shire’s management believe that they will provide investors with a means of evaluating, and an understanding of how Shire’s management evaluates, Shire’s performance and results on a comparable basis that is not otherwise apparent on a US GAAP basis, since many non-recurring, infrequent or non-cash items that Shire’s management believe are not indicative of the core performance of the business may not be excluded when preparing financial measures under US GAAP. These Non GAAP measures should not be considered in isolation from, as substitutes for, or superior to financial measures prepared in accordance with US GAAP. Where applicable the following items, including their tax effect, have been excluded when calculating Non GAAP earnings for both 2016 and 2015, and from our Outlook: Amortization and asset impairments: • Intangible asset amortization and impairment charges; and • Other than temporary impairment of investments. Acquisitions and integration activities: • Up-front payments and milestones in respect of in-licensed and acquired products; • Costs associated with acquisitions, including transaction costs, fair value adjustments on contingent consideration and acquired inventory; • Costs associated with the integration of companies; and • Noncontrolling interests in consolidated variable interest entities. Divestments, reorganizations and discontinued operations: • Gains and losses on the sale of non-core assets; • Costs associated with restructuring and reorganization activities; • Termination costs; and • Income/(losses) from discontinued operations. Legal and litigation costs: • Net legal costs related to the settlement of litigation, government investigations and other disputes (excluding internal legal team costs). Other: • Net income tax credit (being income tax, interest and estimated penalties) related to the settlement of certain tax positions with the Canadian revenue authorities; and • Costs associated with AbbVie’s terminated offer for Shire, including costs of employee retention awards. Depreciation, which is included in Cost of product sales, R&D and SG&A costs in our US GAAP results, has been separately disclosed for the presentation of 2016 and 2015 Non GAAP earnings. Cash generation represents net cash provided by operating activities, excluding up-front and milestone payments for in-licensed and acquired products, tax and interest payments. Free cash flow represents net cash provided by operating activities, excluding up-front and milestone payments for in-licensed and acquired products, but including capital expenditure in the ordinary course of business. Non GAAP net debt represents US GAAP cash and cash equivalents less US GAAP short and long term borrowings and other debt. Growth at CER, which is a Non GAAP measure, is computed by restating 2016 results using average 2015 foreign exchange rates for the relevant period. Average exchange rates used by Shire for Q1 2016 were $1.43:£1.00 and $1.09:€1.00 (2015: $1.54:£1.00 and $1.15:€1.00). A reconciliation of Non GAAP financial measures to the most directly comparable measure under US GAAP is presented in Shire’s Q1 2016 earnings release on pages 19 to 22.
Non GAAP measures