Embed Size (px)
Citation preview

Creating user interfaces for econometric routineswith JStatCom: An example for Gauss
Markus Kratzig
Humboldt-Universitat zu Berlin, Institute for Statistics and Econometrics
First version: 11 November 2004
Abstract
JStatCom is a new software framework that simplifies the creation of graphical user inter-face components for mathematical procedures. 1 It is written in Java and offers a coherentapproach to creating applications for data based analysis. Programming with JStatCom isefficient, because existing algorithms written in various popular matrix languages can bereused with little or no changes required. The paper shows how this system can be appliedto provide an existing Gauss program with a feature-rich graphical user interface with rel-atively little effort. One of the advantages of the presented approach is the strict separationof user interface and algorithm code. Although the framework provides standard solutionsfor common tasks, it can be extended and customized in various directions.
Key words:Java, Object-Oriented Programming, Gauss, Econometrics, Software Engineering
1 Introduction
This text gives an introductory example on how to use the software framework JS-tatCom. The example demonstrates, how a graphical user interface for a statisticaltest could be implemented. This is a relatively simple but realistic scenario. Theunderlying algorithm is implemented in the Gauss programming language which istypical for econometrics. Readers who consider using the software framework forsimilar purposes are encouraged to follow the described steps and try it out.
The example uses the Eclipse Integrated Development Environment (IDE) whichis an open-source project sponsored by IBM. This software is very popular in the
1 The URL is www.jstatcom.com.
Java community, also because it is freely available. But it should be stressed thatthis is just one tool among others and that the use of JStatCom is by no meansrelated to any specific software development tool. Although not recommended, asimple text editor for Java coding would also be sufficient. Because this exampleshould be reproducible, every step is documented including the setup of a projectfor the Eclipse IDE. Experienced Java developers can certainly skip those sections.Furthermore, it should be mentioned that the example is done under the WindowsXP operating system.
2 A Step-by-Step Example
The example will implement a graphical user interface (GUI) for the ARCH-LMtest (Engle, 1982) which provides the option to select a variable to test, as wellas the number of lags to include. By pressing a button the test result should becomputed and printed to a text area.
2.1 System Requirements for this Example
• Windows 2000/XP• working Gauss installation version 3.2 or higher
Although the Java part of JStatCom can be run on almost any platform, this demon-stration requires an installed Gauss. The communication scheme between Gaussand Java has only been implemented for the Windows operating system. However,Gauss code could also be executed on other platforms with the help of the GaussRuntime Engine (GRTE), which is a special Gauss distribution provided by Aptech.The GRTE allows for royalty free redistribution of compiled Gauss code that canbe executed without an installed Gauss, thus enabling developers to ship stand-alone applications to their customers. JStatCom distinguishes between Gauss andthe GRTE, although the two engines can execute the same Gauss code. But to de-velop with the GRTE one has to purchase a specific license first, therefore it wouldnot be a very good candidate for this introductory example. At least, it is morelikely to have a working Gauss installation available.
It should be mentioned, that the Gauss installation is only required to incorporateexternal code. But this example can also be run without this specific algorithmimplementation. In this case the procedure for the test should be implemented inJava, which is also an option. Therefore readers are nevertheless encouraged tofollow the remaining steps to get an idea about the workings of JStatCom.
2

2.2 Step 1: Download/Install the Java Software Development Kit (J2SE SDK)
Because Java code needs to be compiled and the created binary files (classes) mustbe executed with the Java Virtual Machine (JVM), it is necessary to downloadand install the current J2SE SDK from Sun, the URL is www.java.sun.com. 2 Thissoftware is also required to run the Eclipse IDE software, because it is written inthe Java programming language as well. The installation follows a standard setuproutine and should pose no problems.
2.3 Step 2: Download/Install the Eclipse IDE and some Plug-ins
As already mentioned, the Eclipse IDE is just a suggestion for use as a develop-ment tool. One of the great strengths of the Java platform is that there is excellenttool support. Therefore it would equally be possible to apply other tools with verysimilar steps.
First the IDE needs to be downloaded from www.eclipse.org/downloads. There areusually many different packages for various purposes available which might be abit confusing. At the time of this writing the needed package iseclipse-SDK-3.0.1-win32.zip. It is likely that the version number will alreadyhave changed when reading this text. The software just needs to be unpacked tosome directory and will install itself when it is first started.
Because programming with JStatCom typically involves the layout of GUIs, a vi-sual interface builder can speed up development significantly. Such a tool is notpart of the standard Eclipse package, but can be installed as a plug-in. The follow-ing additional packages need to be downloaded fromwww.eclipse.org/tools. The names of the relevant archives are given in brackets,although the version numbers are likely to have changed already:
• EMF (emf-sdo-runtime-2.0.1.zip)• GEF (GEF-SDK-3.0.1.zip)• VE (VE-runtime-1.0.1.1.zip)
Installing those plug-ins merely requires to unpack the archives to the Eclipse in-stallation directory and to restart the IDE. All mentioned tools can be downloadedfree of charge.
2 The most recent release is J2SE 5.0. With this version the term SDK (Software Develop-ment Kit) changed to JDK (Java Development Kit).
3

2.4 Step 3: Download JStatCom and unpack it
The last required download is the JStatCom software framework itself, which canbe found under www.jstatcom.com. The archive jstatcom win-1.0.zip just needsto be extracted to some folder. By default it creates a directory jstatcom. It is rec-ommended to rename this directory to something more descriptive for the respec-tive project. For the current example the name testproject is used.
2.5 Step 4: Create an Eclipse Project
Fig. 1. Selecting a new Java project in the Eclipse IDE
In the following it is assumed that JStatCom is located in the directoryc:\testproject. Now the Eclipse software should be started, the option to changethe workspace directory can be ignored. At first startup a help screen is presented,it can be closed. The first step should be to create a new Java project via File -New. The resulting dialog is presented in Figure 1. When Next is pressed Figure 2is shown where the project name should be given, as well as the directory with theresources. The created project can then be seen in the package browser, see Figure3. All jar archives in the project directory have automatically been included inthe build class path, for example jstatcom.jar, jama.jar, junit.jar, etc.. Bydefault, all classes that will be compiled go in a subdirectory bin. But no classeshave been created so far.
4

Fig. 2. Setting project name and directory
Fig. 3. Display of the new project testproject in the package explorer
2.6 Step 5: Create a new Package and a new Class
Programming with Java usually starts with creating a class. The class to create forthis example should hold the GUI for the test and should itself be a so called internal
5

Fig. 4. Creating a new class
Fig. 5. Creating a new package
frame. This is a special component that is displayed as a window within a desktopapplication.
6

Fig. 6. Specifying the new class
Fig. 7. Generated Java code for a new class
Before a new class can be created, the IDE software requires to define a directorywith the source code to compile. It will look for Java source files only there andcompiles them when changes are made. Figure 4 shows the menu that appears on aright mouse click over the project name testproject. By selecting Source Foldera small dialog will appear asking for the directory name which can freely be chosen,but is typically src.
Afterwards the same menu should be used over the just created src folder, butthis time with the option Package to create a new Java package. The dialog forthis is shown in Figure 5. It is not strictly required to define packages, but it isgood programming practice. The standard for this is the reverse domain name of
7

the organization or firm that develops the Java code. Here com.myorg was usedas a placeholder. As a starting point one could also use a descriptive name, liketestproject. It can be changed at a later stage easily.
Now everything is prepared to create the first Java class. Again, the right mousemenu should be used, this time over the newly created packagesrc/com.myorg with the Class option. Figure 6 shows the dialog to specify theclass to create. The name of the class can freely be chosen, but class naming conven-tions for Java suggest that it should consist of nouns, each of them beginning with acapital letter, for example TestFrame. As a second step it is important to choose thesuperclass that the new class inherits from. By default this is just Object, the top-level superclass of all classes in Java. However, some more functionality is neededbecause the class should be a frame holding the GUI for the test. Therefore oneshould select the class ModelFrame with the help of the Browse button in the su-perclass field. It is then necessary to remove the default Object entry first and typein the first letters of ModelFrame. The dialog will immediately display all possibleoptions. Figure 6 shows the result. All other options can be left unchanged.
After finishing the dialog, a Java editor window with the code for the newly createdclass is shown, see Figure 7. Also, the new file is added to the package browserin the source directory src under the Java package name com.myorg. The classTestFrame is a subclass of ModelFrame, which is a component from the JStat-Com system. The generated code is very short, because the new class does not yetdefine own methods or fields. It inherits all functionality from its superclass. Oneshould consider documenting the header of TestFrame with some remarks aboutthe function of this component. In the example, only the author is mentioned.
8

2.7 Step 6: Layout the GUI with the Visual Editor
Fig. 8. Open class in visual builder tool
Fig. 9. Initial display, frame needs to be resized
After having set up the skeleton of the new module, the GUI should be laid out withthe help of the visual editor (VE) that has been installed via the mentioned plug-ins.
To use the VE tool in Eclipse, it is first necessary to close the Java editor windowthat is currently showing TestFrame.java. Afterwards the same file should be
9

opened again in the VE by right clicking over the file TestFrame.java in thepackage explorer and selecting Visual Editor, see Figure 8.
After invoking this operation, it might take a while until the VE is set up, becausethis is a computationally intense operation. The initial display is shown in Figure9. There is an area at the top where the actual state of the GUI is shown as itwould look like during runtime. The frame is displayed with its minimal size inthe beginning. The Java editor underneath shows the code that is generated by theVE, which is nothing so far. After all, the VE is just a code generating tool andit is also possible to do manual adjustments by editing the Java code directly. Onthe right edge there is the so called Palette which provides access to many standardJava components that can be picked and placed in the VE. It can also be used toaccess all components provided by the JStatCom framework, although those arenot displayed with an icon but must be chosen via the button Choose Bean from thepalette.
Having introduced the basic features of the VE, editing can be started by resizingthe frame with the mouse and choosing a title. The title can be set by clicking in theheader of the frame, or by directly editing the properties of that component. For thatpurpose, there exists the property editor of the VE, see Figure 10 at the bottom. Itshould be noted, that most properties do not need to be changed from their defaultvalue, but the title property has been set to TestFrame, lacking more innovativeideas here. By changing the size of the frame with the mouse, the size propertyis automatically changed. Properties are used to customize components and help tospeed up programming, especially for GUI layout.
Now that the TestFrame has a title and a proper size, it is required to add a panelto hold all other components. Therefore one should select the class JPanel fromthe palette and place it in the frame. Because panels are container elements, theycan be found under the Swing Containers tab, see Figure 11. Adding a JPanel isnot a very exciting operation, because visually nothing changes. It is just an emptycontainer. However, by looking at the Java editor one can see that some code hasbeen generated and the property editor is now showing the properties of the addedJPanel.
Now a small technicality is required to avoid confusions when adding new compo-nents to the panel. By default every panel has a layout manager which computeshow components are being placed inside the container. It also adjusts their size andplacement when the container is resized. The default manager for the JPanel isa FlowLayout. However, for this example layout management should not be dis-cussed and it is easier to switch it off for the initial design. Therefore the propertyeditor should be used to set the layout property of this panel to null as shown inFigure 12.
Having prepared the panel to hold the components, one should now select the class
10
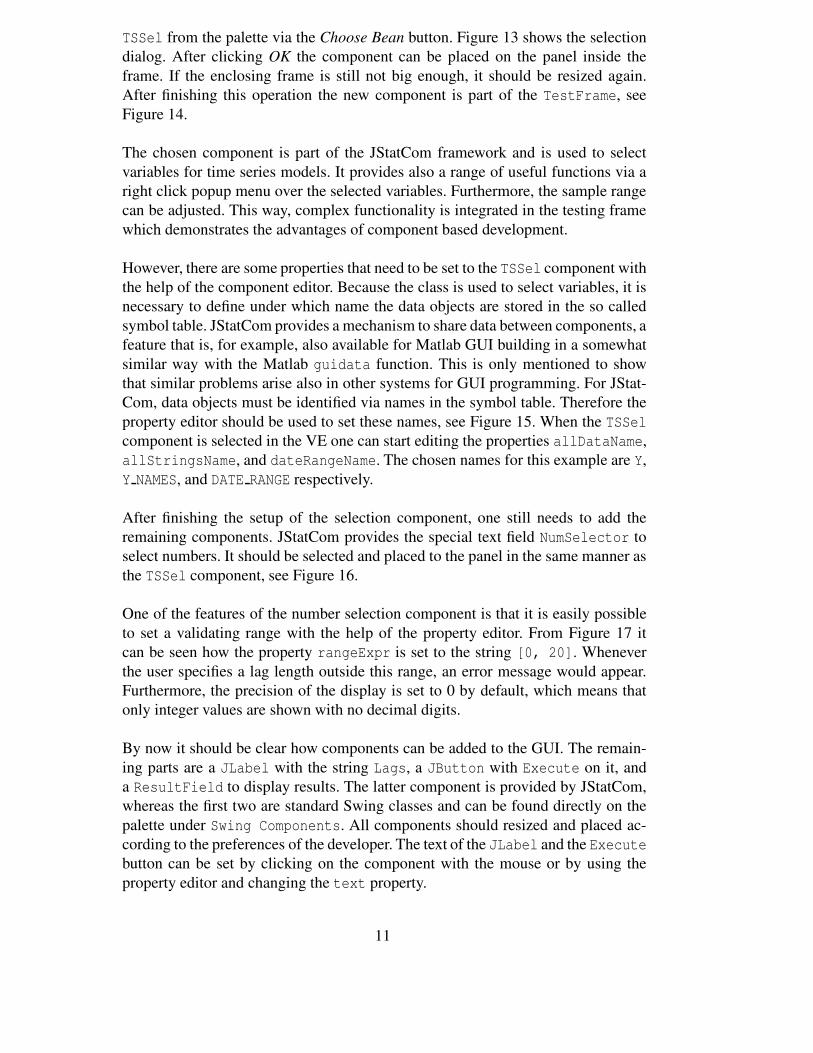
TSSel from the palette via the Choose Bean button. Figure 13 shows the selectiondialog. After clicking OK the component can be placed on the panel inside theframe. If the enclosing frame is still not big enough, it should be resized again.After finishing this operation the new component is part of the TestFrame, seeFigure 14.
The chosen component is part of the JStatCom framework and is used to selectvariables for time series models. It provides also a range of useful functions via aright click popup menu over the selected variables. Furthermore, the sample rangecan be adjusted. This way, complex functionality is integrated in the testing framewhich demonstrates the advantages of component based development.
However, there are some properties that need to be set to the TSSel component withthe help of the component editor. Because the class is used to select variables, it isnecessary to define under which name the data objects are stored in the so calledsymbol table. JStatCom provides a mechanism to share data between components, afeature that is, for example, also available for Matlab GUI building in a somewhatsimilar way with the Matlab guidata function. This is only mentioned to showthat similar problems arise also in other systems for GUI programming. For JStat-Com, data objects must be identified via names in the symbol table. Therefore theproperty editor should be used to set these names, see Figure 15. When the TSSelcomponent is selected in the VE one can start editing the properties allDataName,allStringsName, and dateRangeName. The chosen names for this example are Y,Y NAMES, and DATE RANGE respectively.
After finishing the setup of the selection component, one still needs to add theremaining components. JStatCom provides the special text field NumSelector toselect numbers. It should be selected and placed to the panel in the same manner asthe TSSel component, see Figure 16.
One of the features of the number selection component is that it is easily possibleto set a validating range with the help of the property editor. From Figure 17 itcan be seen how the property rangeExpr is set to the string [0, 20]. Wheneverthe user specifies a lag length outside this range, an error message would appear.Furthermore, the precision of the display is set to 0 by default, which means thatonly integer values are shown with no decimal digits.
By now it should be clear how components can be added to the GUI. The remain-ing parts are a JLabel with the string Lags, a JButton with Execute on it, anda ResultField to display results. The latter component is provided by JStatCom,whereas the first two are standard Swing classes and can be found directly on thepalette under Swing Components. All components should resized and placed ac-cording to the preferences of the developer. The text of the JLabel and the Executebutton can be set by clicking on the component with the mouse or by using theproperty editor and changing the text property.
11

One should not forget to save the file TestFrame.java after adding components.This can easily be done by pressing the Ctrl-S key combination. Saving a Javasource file in the IDE automatically invokes the compilation.
12

Fig. 10. TestFrame after resize with title, properties at the bottom
13

Fig. 11. TestFrame after a JPanel has been added
Fig. 12. Setting layout manager to null, easier to handle for initial design
14

Fig. 13. Selecting the TSSel component
15

Fig. 14. TSSel component has been placed on the panel
Fig. 15. Editing properties of TSSel component
16

Fig. 16. Selecting the NumSelector component for number input
Fig. 17. Setting a validating range [0,20] to the NumSelector component
17

2.8 Step 7: Add an Action to the Execute Button
Fig. 18. Placing a JButton and creating an action
Fig. 19. Default action handler for execute button
After the basic layout of the GUI has finished, it is necessary to program an actionthat is invoked when the Execute button is pressed. Without this, nothing wouldhappen at all. The VE also supports this task via a menu that appears on a rightclick over the button, see Figure 18. The item Events - actionPerformed should bechosen to install a default action to that component.
Figure 19 shows the Java code that has been generated by this operation. There is anactionPerformed method which just prints out some default string. This method
18
must later be programmed ’by hand’ to gather the input from the GUI controls, tocall the external Gauss procedure, and to print the results.
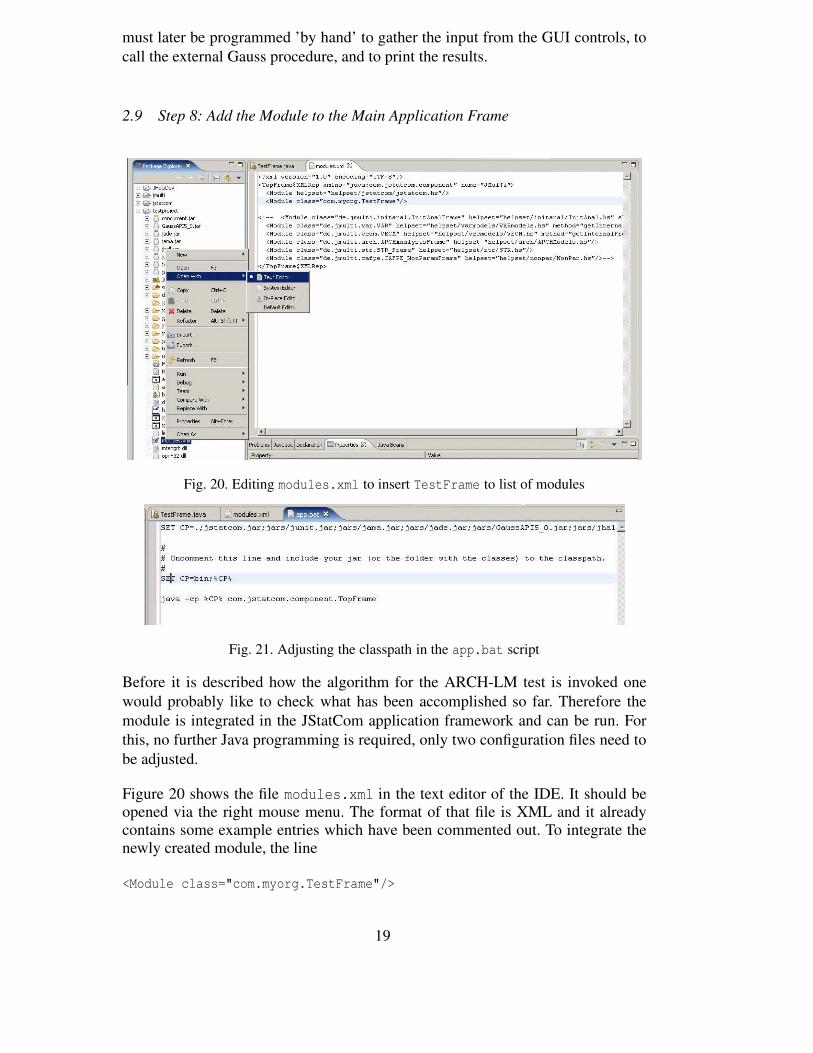
2.9 Step 8: Add the Module to the Main Application Frame
Fig. 20. Editing modules.xml to insert TestFrame to list of modules
Fig. 21. Adjusting the classpath in the app.bat script
Before it is described how the algorithm for the ARCH-LM test is invoked onewould probably like to check what has been accomplished so far. Therefore themodule is integrated in the JStatCom application framework and can be run. Forthis, no further Java programming is required, only two configuration files need tobe adjusted.
Figure 20 shows the file modules.xml in the text editor of the IDE. It should beopened via the right mouse menu. The format of that file is XML and it alreadycontains some example entries which have been commented out. To integrate thenewly created module, the line
<Module class="com.myorg.TestFrame"/>
19

Fig. 22. Running application with new TestFrame module, execute method still needs tobe coded
should be added and the file should be saved. Note that the slash at the end isneeded. Afterwards the file app.bat has to be edited to add the location of theclasses to the classpath, see Figure 21. The folder with the compiled classes is binby default, therefore the line
SET CP = bin;%CP%
must be added. Finally, one can now start the application by clicking on the fileapp.bat from outside the IDE software. It will invoke the application and themodule can be accessed via the menu item Modules. Figure 22 shows the runningprogram. Although nothing happens yet when Execute is clicked, except that somestring is printed to the standard output, there are already a lot of features availableprovided by the framework.
For example, it is possible to import datasets, to use the time series calculator forcombining variables with arithmetic operations, and to edit and transform seriesthat have been read in. It is also possible to create dummy variables conveniently.In the module TestFrame one can select variables, and the text field for the numberof lags validates input according to the interval set. All this general functionality isprovided by JStatCom and it is now up to the developer to use this infrastructurefor implementing calls to specific algorithms.
20

2.10 Step 9: Integrate Gauss Algorithm
After having programmed the GUI in Java, one has to prepare the Gauss code withthe algorithm. JStatCom provides a communications interface to an installed Gauss,but the code has to be compiled as a gcg file first and it has to be put in a speciallocation. The Gauss procedure to compute the ARCH-LM test is given in the codeexample. If one is only interested in the general workings of this example, onecould also use some shorter procedure or return just a number.
/*** ARCH-LM test (Engle 82).** resid - Tx1 vector with residuals* q - number of lags to include in test regression** result - Chi2_stat˜prob_chi2˜F_stat˜prob_F*/proc(1) = archlm_mytest(resid, q);
local y,ylags,Tnew,b,sigma,rsq,f,XX,r,prob_chi,prob_F;y = (resid - meanc(resid))ˆ2;ylags = shiftr((ones(1,q) .*. y)’,seqa(1,1,q),-exp(20))’;ylags = delif(ylags,ylags[.,cols(ylags)] .== -exp(20));Tnew = rows(ylags);y = y[rows(y)-Tnew+1:rows(y)];ylags = ones(rows(ylags),1)˜ylags;b = inv(ylags’ylags)*ylags’*y;sigma = (y-ylags*b)’(y-ylags*b)/rows(y);rsq = 1-sigma/((y - meanc(y))’(y - meanc(y))/rows(y));XX = ylags’ylags;R = zeros(q,1) ˜ eye(q);F = (R*b)’inv(R*inv(XX)*R’)*(R*b) / (q*sigma);prob_F = cdffc(F,q,rows(ylags)-rows(b));prob_chi= cdfchic(rows(ylags)*rsq,q);
retp(rows(ylags)*rsq˜prob_chi˜F˜prob_F);endp;
It is assumed that the code is stored in the file mytest.src. This file should be putin the subdirectory jgauss/src of the project directory. There are also some othersource files which are needed by the communications library. One should be awarethat Gauss procedure names should be unique across all files, therefore the namearchlm mytest was chosen. The convention is, that the filename is used as a suffixto the descriptive name of the procedure.
As a last step, one must compile the source code together with the other files inthe directory to a file jgauss.gcg. This could be done manually with Gauss, butJStatCom provides the batch script jgauss gcg.bat to make it easier to compile
21
also a large number of source files. For this the file jgauss/compile.xml has tobe edited:
<?xml version="1.0" encoding="UTF-8"?><GCGSet xmlns="java:com.jstatcom.engine.gauss" gcgfile="jgauss.gcg">
<GCGSet$SRCFile filename="src/jmplot.dec"/><GCGSet$SRCFile filename="src/jgauss.src"/><GCGSet$SRCFile filename="src/jgrte.src"/><GCGSet$SRCFile filename="src/tools.src"/><GCGSet$SRCFile filename="src/plot.src"/><GCGSet$SRCFile filename="src/mytest.src"/>
</GCGSet>
Only the last line has been added. By clicking on jgauss gcg.bat all source filesare compiled and the file jgauss/jgauss.gcg is being created. When the batchscript is started first it is likely that some settings for the Gauss software have to beset. Those settings could also be set manually in the filejgauss/engine config.xml. JStatCom needs to know the correct version numberand the location of the Gauss executable.
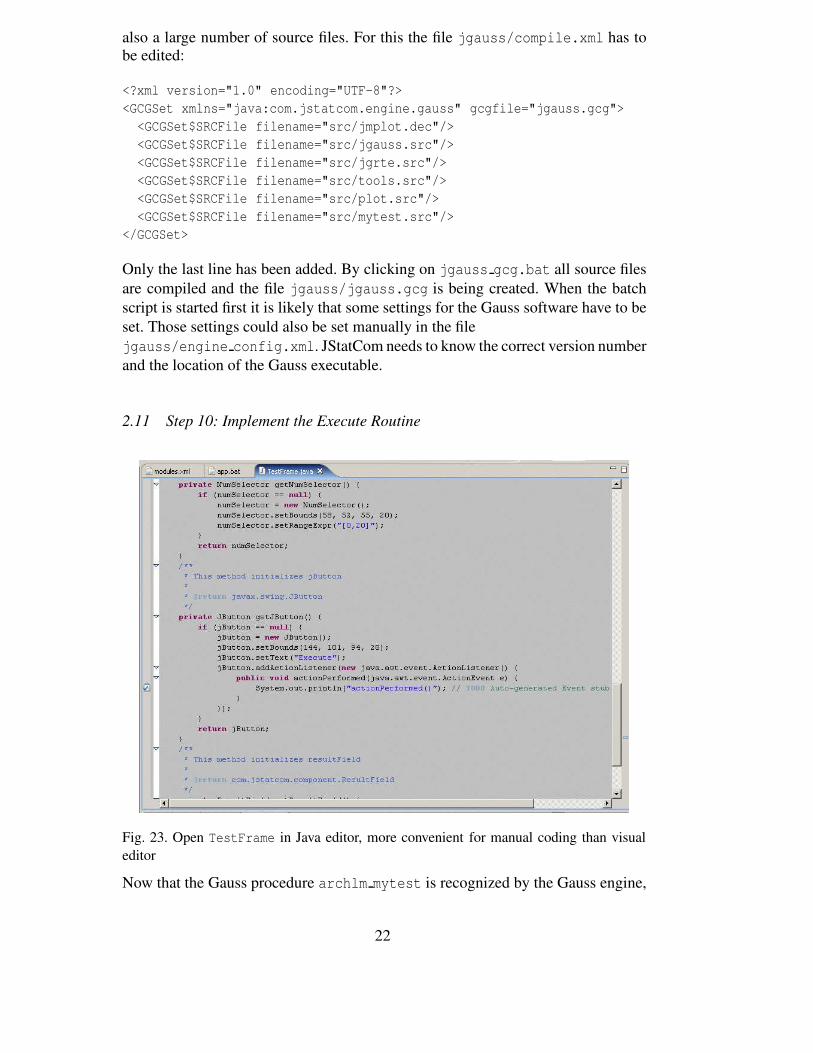
2.11 Step 10: Implement the Execute Routine
Fig. 23. Open TestFrame in Java editor, more convenient for manual coding than visualeditor
Now that the Gauss procedure archlm mytest is recognized by the Gauss engine,
22

Fig. 24. Hidden method body that should be expanded by clicking on arrow to the left
Fig. 25. Red underline and symbol to the left indicating some compilation problem
Fig. 26. A left mouse click on the error symbol gives a menu with possible error fixes, thefirst option should be chosen here
it is possible to implement the Java call to that procedure. It should be mentionedthat JStatCom has its own data model to represent numbers, matrices, strings, stringarrays, dates, and date ranges. All data classes start with the prefix JSC, which isshort for JStatCom. For example, JSCNArray represents an m× n number array,whereas JSCInt stores an integer scalar. The basic steps for the execute call are:
(1) Get Gauss engine instanceEngine engine = EngineTypes.GAUSS.getEngine();
(2) Retrieve the input data objects (// starts a Java comment)// retrieves shared symbol by nameJSCNArray y = global().getSymbol("Y").getJSCNArray();
23

Fig. 27. Implementation of the execute call
// creates new integer object with the selected lagsJSCInt lags = new JSCInt("LAGS", getNumSelector().getIntNumber());
(3) Create an empty data object for the result of the computationJSCNArray result = new JSCNArray("TESTRESULT");
(4) Call the Gauss procedure// call the procedure with input and output parametersengine.call("archlm_mytest", new JSCData[]{y, lags},
new JSCData[]{result});(5) Display the result and set it to the symbol table
getResultField().append(result.display());global().set(result);
Some manual Java programming is required here. This is done more easily withthe Java editor instead of the visual editor in the IDE. Therefore the VE shouldbe closed and the Java editor should be opened via the right click menu over theTestFrame.java file, see Figure 23. It should be noted that by default this methodis hidden in the editor and should be expanded first, see Figure 24. When edit-ing is started, one could use the automatic expansion mechanism by pressing theCtrl-Space keys together. If any typos occur, the editor indicates this by underlin-ing the respective element and showing an error symbol at the left edge, see Figure25. Often problems occur because a class name is only recognized after it has beenimported. However, by clicking on the error symbol one can easily fix those prob-lems automatically, see Figure 26. The full method body is seen in Figure 27.
24

2.12 Step 11: Check running Module
Fig. 28. Running module with output from computation
Fig. 29. Symbol Control after the computation has finished
Now that everything has been programmed, the module should be checked againvia clicking on the app.bat script. After a series has been imported and selected,a click on the Execute button will invoke the computation and the result will beprinted to the text area. The resulting numbers include the Chi-squared and F statis-tics together with the corresponding p-values, see Figure 28. Furthermore, the re-
25

sult has been set to the symbol table of the module. This can be checked with theSymbol Control which is accessible via the Control menu, see Figure 29.
Another small customization of the new application could be done by editing thefile app.properties in the project directory. It is possible to change the title, thesplash screen, the version number, as well as the about information of the software.
3 Final Remarks
This example should have motivated the use of JStatCom, although it has onlyscratched the surface of what can be done with the framework. The module that hasbeen programmed could still be refined in several ways. There should be an inputcheck before the procedure call is actually carried out. Output formatting could beimproved as well. Furthermore, one should use a layout manager to make the GUIlook more professional, especially when it is being resized. Another important pointis that the module consists of only one class, which is appropriate for this simpleexample, but which should be changed if more features are to be added. In that caseone should consider creating a separate class which only holds the panel. It couldthen be added to the frame. If more features are implemented, the frame could geta tabbed pane or a menu bar, and it could hold many panels instead of just one.
An important point is that the execute routine in its current form is defined insidethe GUI class. In general this is not recommended and JStatCom provides the socalled PCall system to encapsulate the calling logic in separate classes. This hasthe advantage that the procedure calls could be maintained separately and that theycould also be used independently of the GUI classes. However, having this intro-ductory example running is a good starting point for many possible enhancements.
References
Engle, R. F. (1982). Autoregressive conditional heteroscedasticity, with estimatesof the variance of United Kingdoms inflations, Econometrica 50: 987–1007.
26