Embed Size (px)
Citation preview
Supplementary Information to
Creating water soluble luminescent graphene quantum dots via exfoliating and disintegrating carbon nanotubes and graphite flakes Liangxu Lina and Shaowei Zhang*b
aDepartment of Materials Science and Engineering, University of Sheffield, Sheffield S1 3JD, UK
bCollege of Engineering, Mathematics and Physical Sciences, University of Exeter, Exeter EX4 4QF, UK. E-mail:
*To whom correspondence should be addressed.
Electronic Supplementary Material (ESI) for Chemical CommunicationsThis journal is © The Royal Society of Chemistry 2012
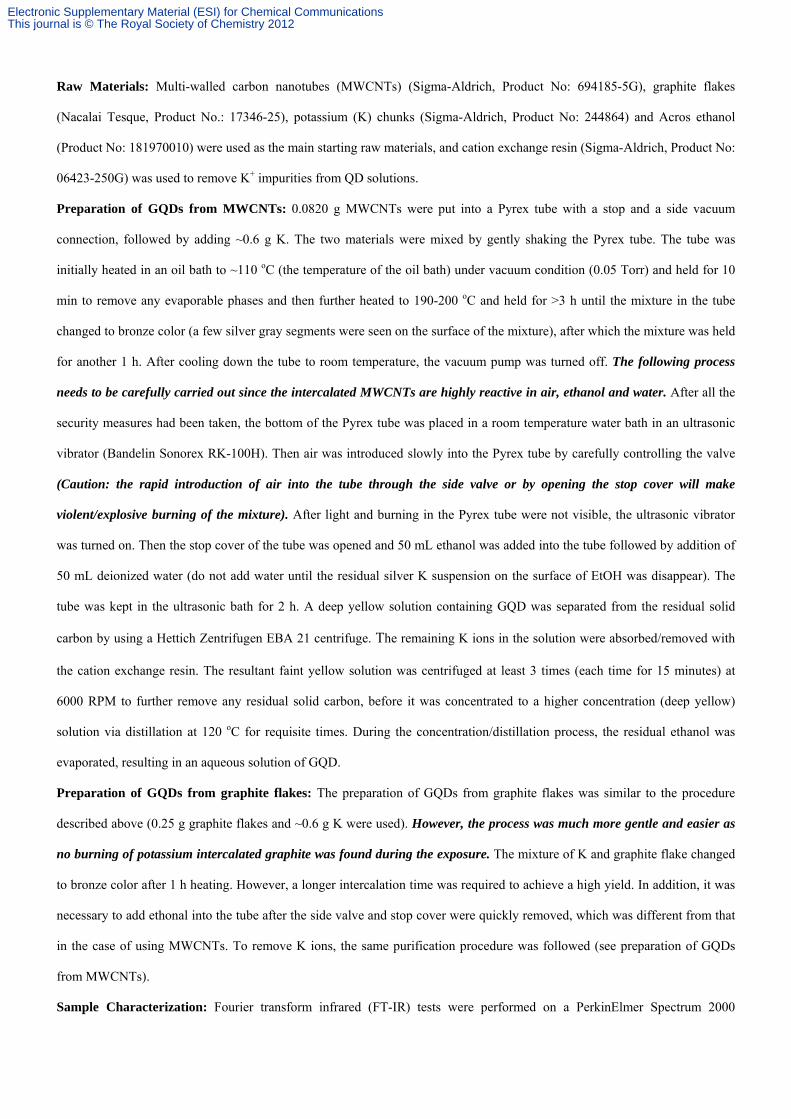
Raw Materials: Multi-walled carbon nanotubes (MWCNTs) (Sigma-Aldrich, Product No: 694185-5G), graphite flakes
(Nacalai Tesque, Product No.: 17346-25), potassium (K) chunks (Sigma-Aldrich, Product No: 244864) and Acros ethanol
(Product No: 181970010) were used as the main starting raw materials, and cation exchange resin (Sigma-Aldrich, Product No:
06423-250G) was used to remove K+ impurities from QD solutions.
Preparation of GQDs from MWCNTs: 0.0820 g MWCNTs were put into a Pyrex tube with a stop and a side vacuum
connection, followed by adding ~0.6 g K. The two materials were mixed by gently shaking the Pyrex tube. The tube was
initially heated in an oil bath to ~110 oC (the temperature of the oil bath) under vacuum condition (0.05 Torr) and held for 10
min to remove any evaporable phases and then further heated to 190-200 oC and held for >3 h until the mixture in the tube
changed to bronze color (a few silver gray segments were seen on the surface of the mixture), after which the mixture was held
for another 1 h. After cooling down the tube to room temperature, the vacuum pump was turned off. The following process
needs to be carefully carried out since the intercalated MWCNTs are highly reactive in air, ethanol and water. After all the
security measures had been taken, the bottom of the Pyrex tube was placed in a room temperature water bath in an ultrasonic
vibrator (Bandelin Sonorex RK-100H). Then air was introduced slowly into the Pyrex tube by carefully controlling the valve
(Caution: the rapid introduction of air into the tube through the side valve or by opening the stop cover will make
violent/explosive burning of the mixture). After light and burning in the Pyrex tube were not visible, the ultrasonic vibrator
was turned on. Then the stop cover of the tube was opened and 50 mL ethanol was added into the tube followed by addition of
50 mL deionized water (do not add water until the residual silver K suspension on the surface of EtOH was disappear). The
tube was kept in the ultrasonic bath for 2 h. A deep yellow solution containing GQD was separated from the residual solid
carbon by using a Hettich Zentrifugen EBA 21 centrifuge. The remaining K ions in the solution were absorbed/removed with
the cation exchange resin. The resultant faint yellow solution was centrifuged at least 3 times (each time for 15 minutes) at
6000 RPM to further remove any residual solid carbon, before it was concentrated to a higher concentration (deep yellow)
solution via distillation at 120 oC for requisite times. During the concentration/distillation process, the residual ethanol was
evaporated, resulting in an aqueous solution of GQD.
Preparation of GQDs from graphite flakes: The preparation of GQDs from graphite flakes was similar to the procedure
described above (0.25 g graphite flakes and ~0.6 g K were used). However, the process was much more gentle and easier as
no burning of potassium intercalated graphite was found during the exposure. The mixture of K and graphite flake changed
to bronze color after 1 h heating. However, a longer intercalation time was required to achieve a high yield. In addition, it was
necessary to add ethonal into the tube after the side valve and stop cover were quickly removed, which was different from that
in the case of using MWCNTs. To remove K ions, the same purification procedure was followed (see preparation of GQDs
from MWCNTs).
Sample Characterization: Fourier transform infrared (FT-IR) tests were performed on a PerkinElmer Spectrum 2000
Electronic Supplementary Material (ESI) for Chemical CommunicationsThis journal is © The Royal Society of Chemistry 2012
spectrometer. Ultraviolet-visible (UV/Vis) spectra were recorded by a PerkinElmer Lambda 900 Spectrometer at room
temperature. Raman spectra were recorded on a Renishaw in plus laser Raman spectrometer with λexc = 785 nm. X-ray
powder diffraction (XRD) patters were carried out on a Siemens D5000 X-ray diffractometer (for MWCNTs, residual
MWCNTs and resultant GQDs) and Philips PW1830 powder diffractometer (for graphite flakes, residual graphite flakes and
resultant GQDs, Cu Kα). The data were collected with a scanning step of 2o/min. The data (Co Kα) were calibrated to the
standard data with (Cu Kα) before analysis. X-ray photoelectron spectroscopy (XPS) was performed on a Kratos AXIS Ultra
“DLD” X-ray photoelectron spectrometer with an exciting source of Al Ka. Prior to the test, the areas to be examined were
cleaned with argon etching for a few minutes. Atomic force microscopy (AFM) images were taken by using a VEECO
Dimension 3100 Atomic Force Microscope in a tapping mode with a scan rate of 0.5 HZ. A mica substrate was used. GQDs
size and height were analyzed by using the Scanning Probe Image Processor (SPIP) Software. Transmission electron
microscopy (TEM) images were taken on a Phillips 420 transmission electron microscope operated at 120 KV and JEOL
2100 transmission electron microscope operated at 200 KV. Fluorescence spectra and photoluminescence excitation spectra
were recorded by a Hitachi F-4500 Fluorescence Spectrophotometer at room temperature.
Calculation of Production Yields: As-prepared GQDs from MWCNTs were oven-dried overnight at 120 oC. After cooling in
a sealed amber glass, their weights (“gross” weights) were weighed. The yield described in the paper (22.96 wt%) was
calculated by dividing the weight of dried GQD product by the weight of the starting MWCNTs. By using the same method,
the yield of GQD prepared from graphite flakes was calculated as 9.9 wt%. However, since the GQDs contained some oxygen-
containing groups, their “net” weights excluding oxygen are also calculated based on the “gross” weight of as-prepared GQDs
and the C1s XPS results. The corresponding “net” yields of GQDs created from MWCNTs and graphite flakes were calculated
as 17.2 wt% and 8.8% wt %, respectively.
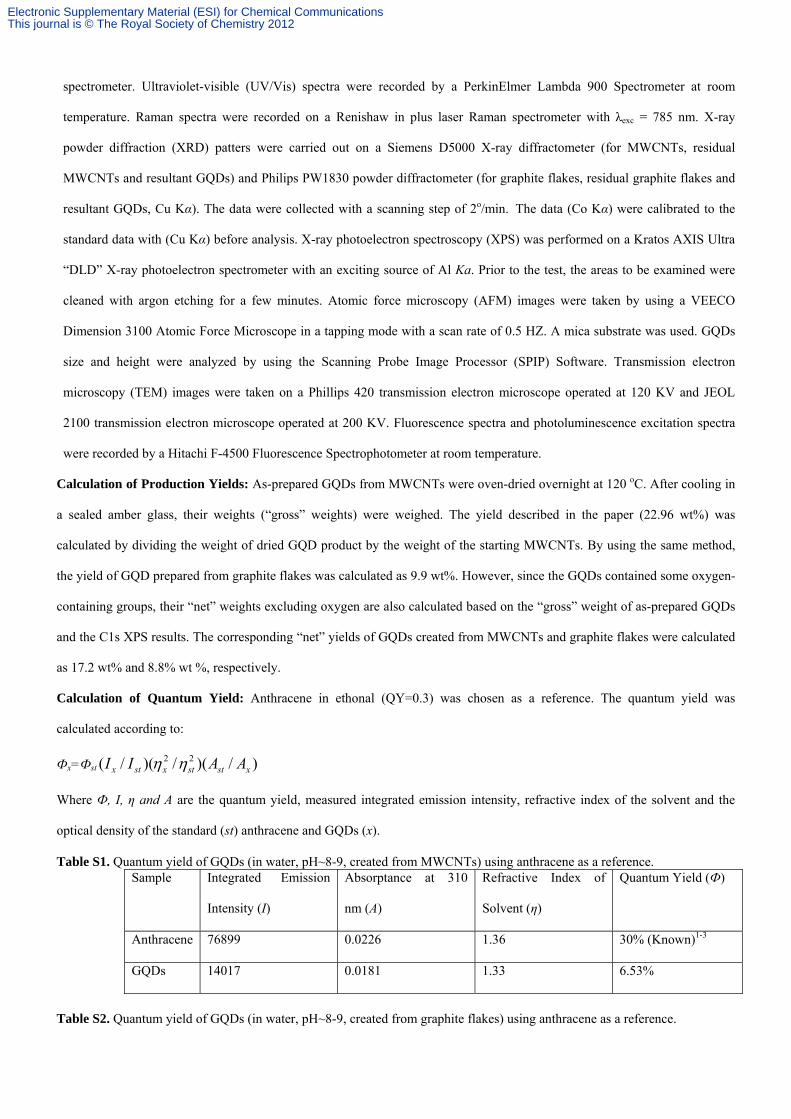
Calculation of Quantum Yield: Anthracene in ethonal (QY=0.3) was chosen as a reference. The quantum yield was
calculated according to:
Фx=Фst )/)(/)(/( 22xststxstx AAII
Where Ф, I, η and A are the quantum yield, measured integrated emission intensity, refractive index of the solvent and the
optical density of the standard (st) anthracene and GQDs (x).
Table S1. Quantum yield of GQDs (in water, pH~8-9, created from MWCNTs) using anthracene as a reference. Sample Integrated Emission
Intensity (I)
Absorptance at 310
nm (A)
Refractive Index of
Solvent (η)
Quantum Yield (Ф)
Anthracene 76899 0.0226 1.36 30% (Known)1-3
GQDs 14017 0.0181 1.33 6.53%
Table S2. Quantum yield of GQDs (in water, pH~8-9, created from graphite flakes) using anthracene as a reference.
Electronic Supplementary Material (ESI) for Chemical CommunicationsThis journal is © The Royal Society of Chemistry 2012

Sample Integrated Emission
Intensity (I)
Absorptance at 310
nm (A)
Refractive Index of
Solvent (η)
Quantum Yield (Ф)
Anthracene 76899 0.0226 1.36 30% (Known)1-3
GQDs 26345 0.0312 1.33 7.12%
Electronic Supplementary Material (ESI) for Chemical CommunicationsThis journal is © The Royal Society of Chemistry 2012
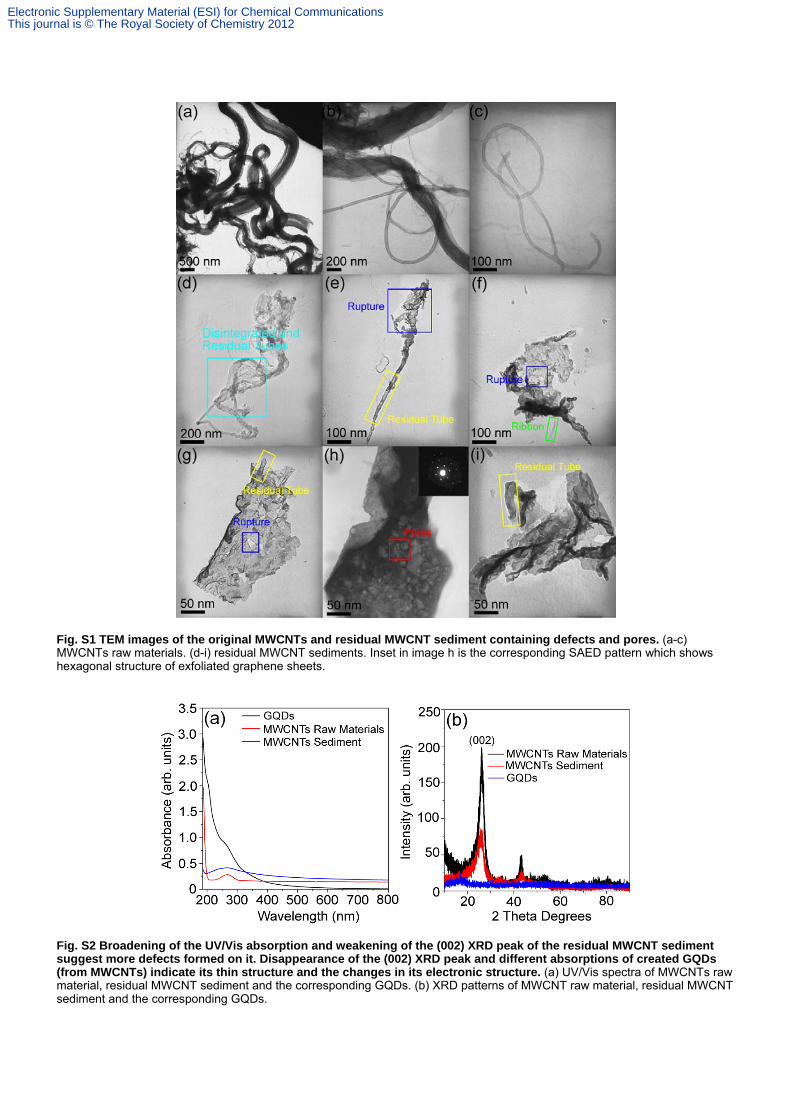
Fig. S1 TEM images of the original MWCNTs and residual MWCNT sediment containing defects and pores. (a-c) MWCNTs raw materials. (d-i) residual MWCNT sediments. Inset in image h is the corresponding SAED pattern which shows hexagonal structure of exfoliated graphene sheets.
Fig. S2 Broadening of the UV/Vis absorption and weakening of the (002) XRD peak of the residual MWCNT sediment suggest more defects formed on it. Disappearance of the (002) XRD peak and different absorptions of created GQDs (from MWCNTs) indicate its thin structure and the changes in its electronic structure. (a) UV/Vis spectra of MWCNTs raw material, residual MWCNT sediment and the corresponding GQDs. (b) XRD patterns of MWCNT raw material, residual MWCNT sediment and the corresponding GQDs.
Electronic Supplementary Material (ESI) for Chemical CommunicationsThis journal is © The Royal Society of Chemistry 2012
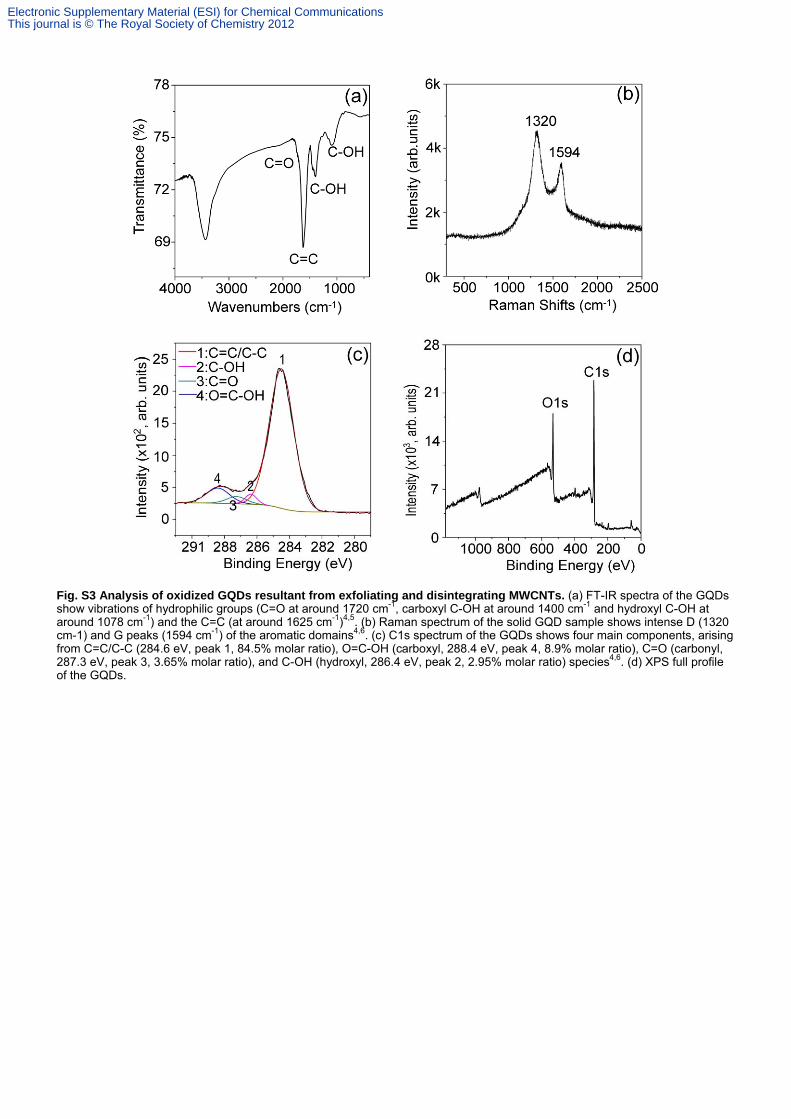
Fig. S3 Analysis of oxidized GQDs resultant from exfoliating and disintegrating MWCNTs. (a) FT-IR spectra of the GQDs show vibrations of hydrophilic groups (C=O at around 1720 cm-1, carboxyl C-OH at around 1400 cm-1 and hydroxyl C-OH at around 1078 cm-1) and the C=C (at around 1625 cm-1)4,5. (b) Raman spectrum of the solid GQD sample shows intense D (1320 cm-1) and G peaks (1594 cm-1) of the aromatic domains4,6. (c) C1s spectrum of the GQDs shows four main components, arising from C=C/C-C (284.6 eV, peak 1, 84.5% molar ratio), O=C-OH (carboxyl, 288.4 eV, peak 4, 8.9% molar ratio), C=O (carbonyl, 287.3 eV, peak 3, 3.65% molar ratio), and C-OH (hydroxyl, 286.4 eV, peak 2, 2.95% molar ratio) species4,6. (d) XPS full profile of the GQDs.
Electronic Supplementary Material (ESI) for Chemical CommunicationsThis journal is © The Royal Society of Chemistry 2012
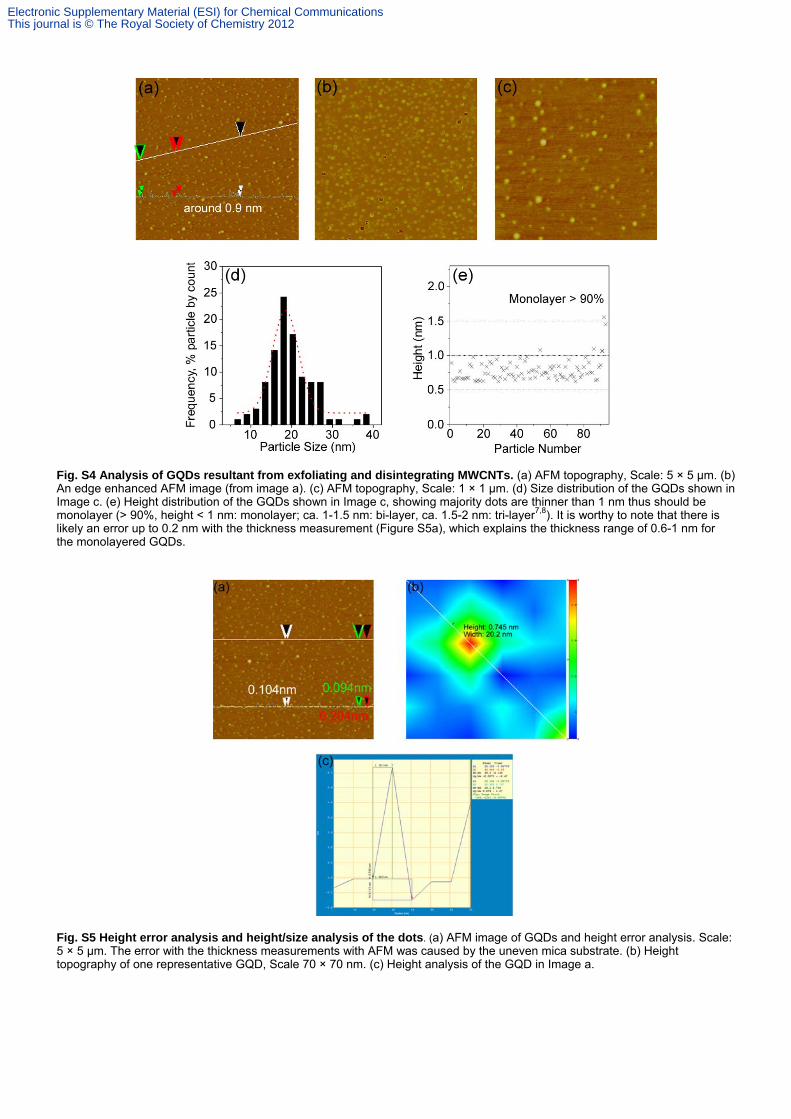
Fig. S4 Analysis of GQDs resultant from exfoliating and disintegrating MWCNTs. (a) AFM topography, Scale: 5 × 5 μm. (b) An edge enhanced AFM image (from image a). (c) AFM topography, Scale: 1 × 1 μm. (d) Size distribution of the GQDs shown in Image c. (e) Height distribution of the GQDs shown in Image c, showing majority dots are thinner than 1 nm thus should be monolayer (> 90%, height < 1 nm: monolayer; ca. 1-1.5 nm: bi-layer, ca. 1.5-2 nm: tri-layer7,8). It is worthy to note that there is likely an error up to 0.2 nm with the thickness measurement (Figure S5a), which explains the thickness range of 0.6-1 nm for the monolayered GQDs.
Fig. S5 Height error analysis and height/size analysis of the dots. (a) AFM image of GQDs and height error analysis. Scale: 5 × 5 μm. The error with the thickness measurements with AFM was caused by the uneven mica substrate. (b) Height topography of one representative GQD, Scale 70 × 70 nm. (c) Height analysis of the GQD in Image a.
Electronic Supplementary Material (ESI) for Chemical CommunicationsThis journal is © The Royal Society of Chemistry 2012
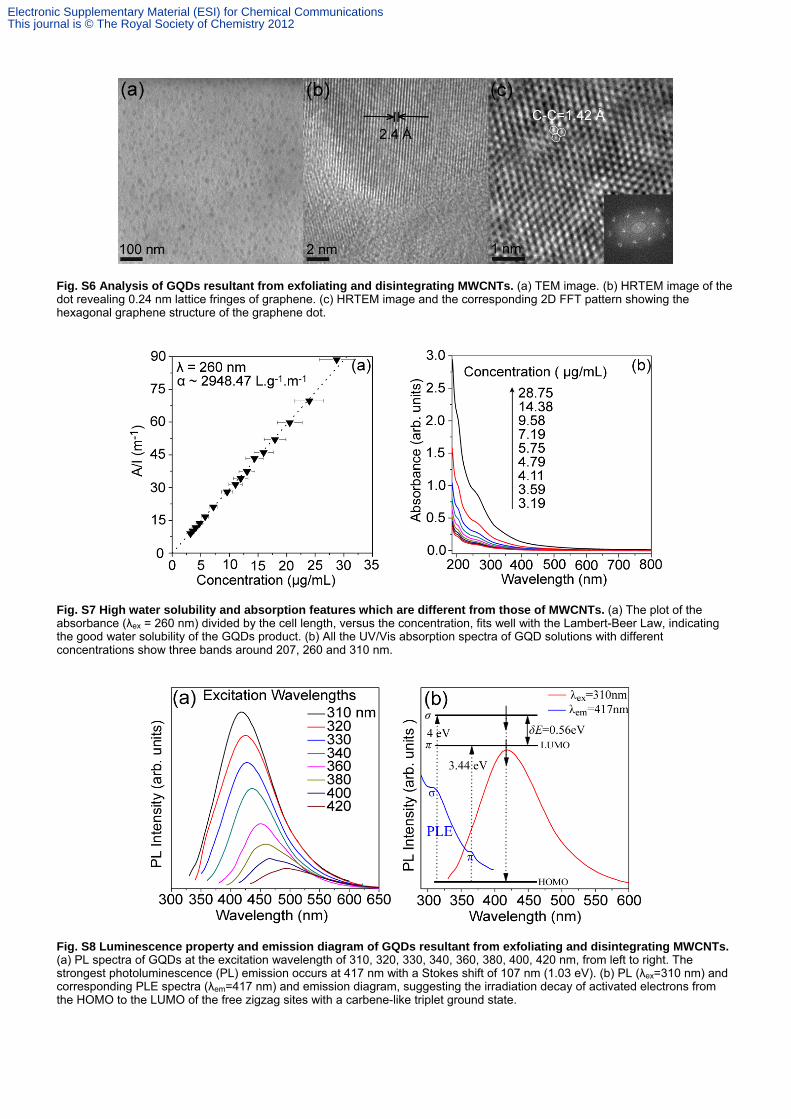
Fig. S6 Analysis of GQDs resultant from exfoliating and disintegrating MWCNTs. (a) TEM image. (b) HRTEM image of the dot revealing 0.24 nm lattice fringes of graphene. (c) HRTEM image and the corresponding 2D FFT pattern showing the hexagonal graphene structure of the graphene dot.
Fig. S7 High water solubility and absorption features which are different from those of MWCNTs. (a) The plot of the absorbance (λex = 260 nm) divided by the cell length, versus the concentration, fits well with the Lambert-Beer Law, indicating the good water solubility of the GQDs product. (b) All the UV/Vis absorption spectra of GQD solutions with different concentrations show three bands around 207, 260 and 310 nm.
Fig. S8 Luminescence property and emission diagram of GQDs resultant from exfoliating and disintegrating MWCNTs. (a) PL spectra of GQDs at the excitation wavelength of 310, 320, 330, 340, 360, 380, 400, 420 nm, from left to right. The strongest photoluminescence (PL) emission occurs at 417 nm with a Stokes shift of 107 nm (1.03 eV). (b) PL (λex=310 nm) and corresponding PLE spectra (λem=417 nm) and emission diagram, suggesting the irradiation decay of activated electrons from the HOMO to the LUMO of the free zigzag sites with a carbene-like triplet ground state.
Electronic Supplementary Material (ESI) for Chemical CommunicationsThis journal is © The Royal Society of Chemistry 2012
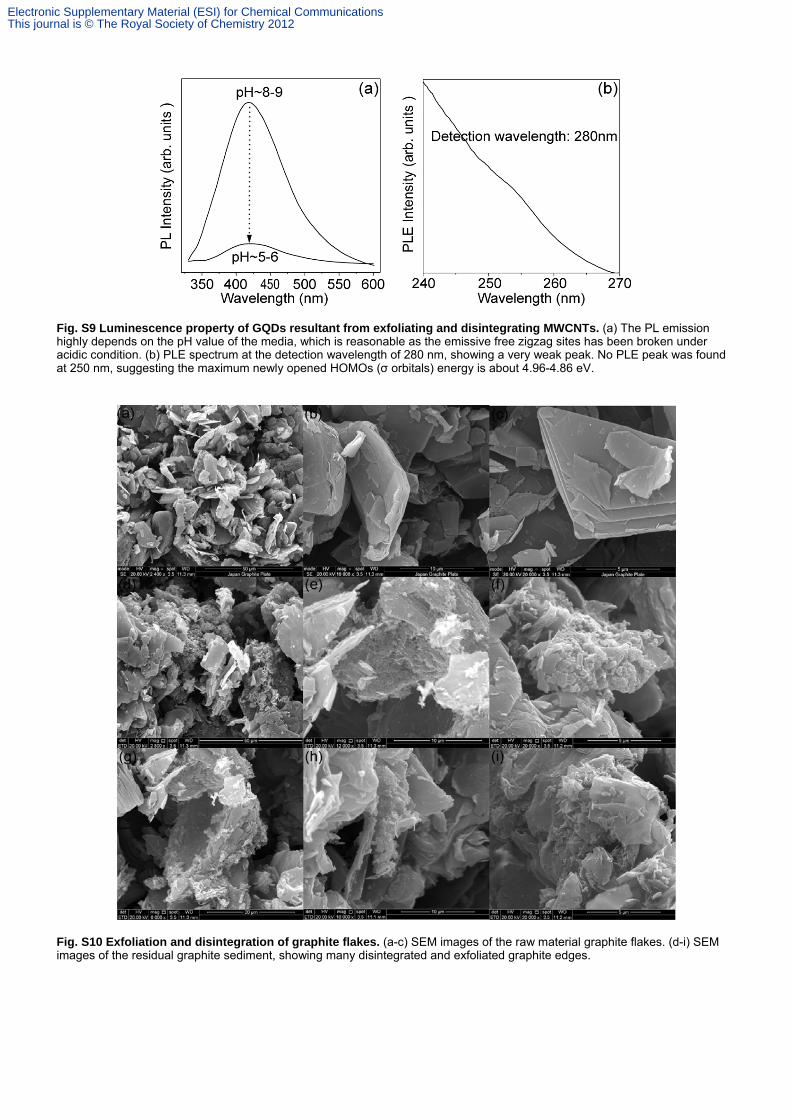
Fig. S9 Luminescence property of GQDs resultant from exfoliating and disintegrating MWCNTs. (a) The PL emission highly depends on the pH value of the media, which is reasonable as the emissive free zigzag sites has been broken under acidic condition. (b) PLE spectrum at the detection wavelength of 280 nm, showing a very weak peak. No PLE peak was found at 250 nm, suggesting the maximum newly opened HOMOs (σ orbitals) energy is about 4.96-4.86 eV.
Fig. S10 Exfoliation and disintegration of graphite flakes. (a-c) SEM images of the raw material graphite flakes. (d-i) SEM images of the residual graphite sediment, showing many disintegrated and exfoliated graphite edges.
Electronic Supplementary Material (ESI) for Chemical CommunicationsThis journal is © The Royal Society of Chemistry 2012
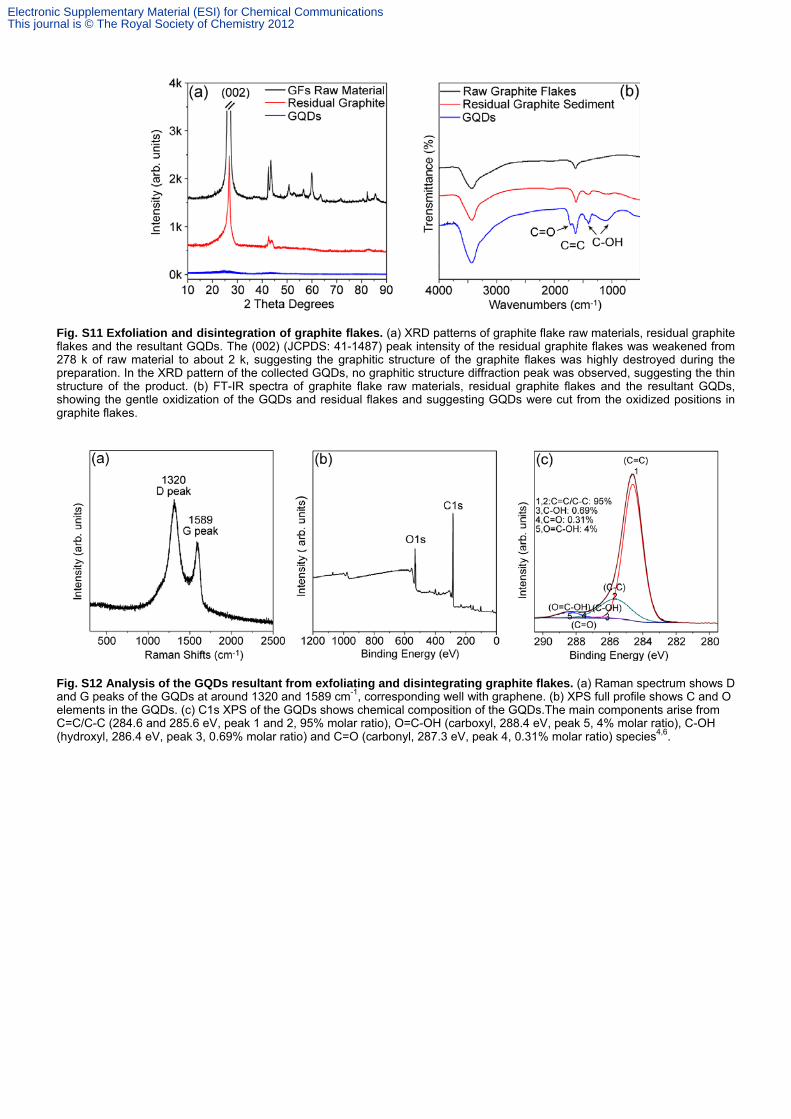
Fig. S11 Exfoliation and disintegration of graphite flakes. (a) XRD patterns of graphite flake raw materials, residual graphite flakes and the resultant GQDs. The (002) (JCPDS: 41-1487) peak intensity of the residual graphite flakes was weakened from 278 k of raw material to about 2 k, suggesting the graphitic structure of the graphite flakes was highly destroyed during the preparation. In the XRD pattern of the collected GQDs, no graphitic structure diffraction peak was observed, suggesting the thin structure of the product. (b) FT-IR spectra of graphite flake raw materials, residual graphite flakes and the resultant GQDs, showing the gentle oxidization of the GQDs and residual flakes and suggesting GQDs were cut from the oxidized positions in graphite flakes.
Fig. S12 Analysis of the GQDs resultant from exfoliating and disintegrating graphite flakes. (a) Raman spectrum shows D and G peaks of the GQDs at around 1320 and 1589 cm-1, corresponding well with graphene. (b) XPS full profile shows C and O elements in the GQDs. (c) C1s XPS of the GQDs shows chemical composition of the GQDs.The main components arise from C=C/C-C (284.6 and 285.6 eV, peak 1 and 2, 95% molar ratio), O=C-OH (carboxyl, 288.4 eV, peak 5, 4% molar ratio), C-OH (hydroxyl, 286.4 eV, peak 3, 0.69% molar ratio) and C=O (carbonyl, 287.3 eV, peak 4, 0.31% molar ratio) species4,6.
Electronic Supplementary Material (ESI) for Chemical CommunicationsThis journal is © The Royal Society of Chemistry 2012
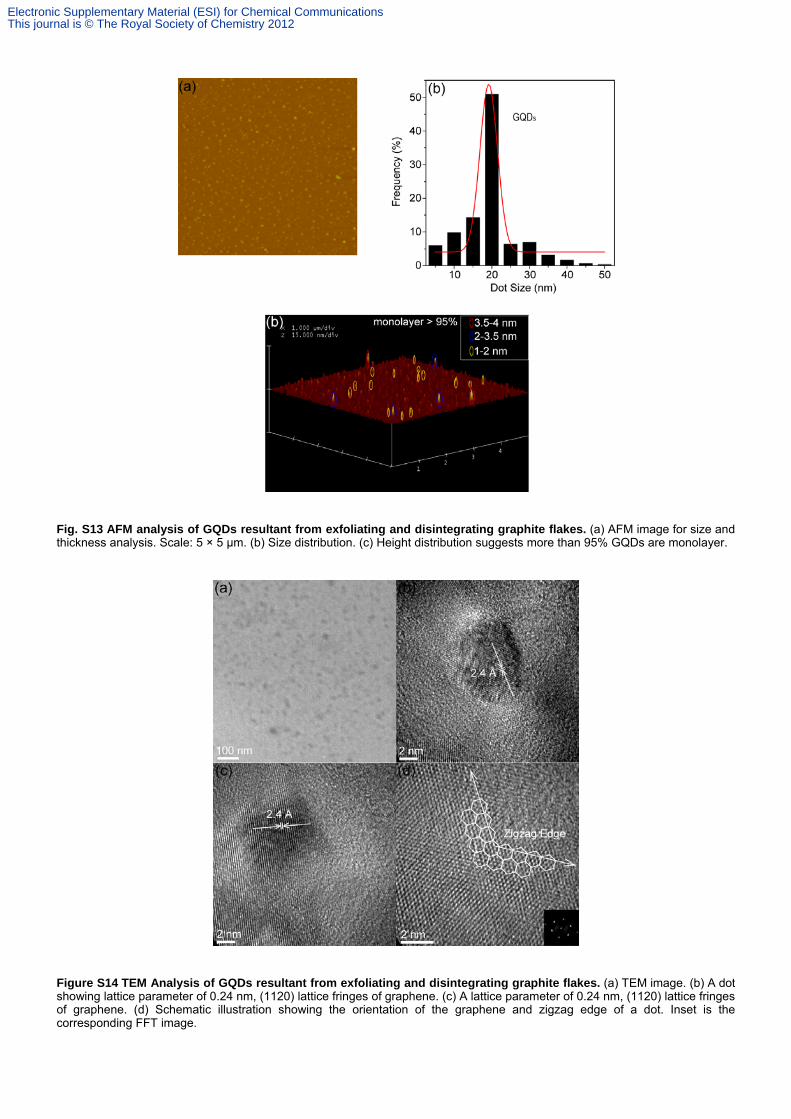
Fig. S13 AFM analysis of GQDs resultant from exfoliating and disintegrating graphite flakes. (a) AFM image for size and thickness analysis. Scale: 5 × 5 μm. (b) Size distribution. (c) Height distribution suggests more than 95% GQDs are monolayer.
Figure S14 TEM Analysis of GQDs resultant from exfoliating and disintegrating graphite flakes. (a) TEM image. (b) A dot showing lattice parameter of 0.24 nm, (1120) lattice fringes of graphene. (c) A lattice parameter of 0.24 nm, (1120) lattice fringes of graphene. (d) Schematic illustration showing the orientation of the graphene and zigzag edge of a dot. Inset is the corresponding FFT image.
Electronic Supplementary Material (ESI) for Chemical CommunicationsThis journal is © The Royal Society of Chemistry 2012

Reference
1. Demas, J. N. & Grosby, G. A. The measurement of photoluminescence quantum yield. A review. J. Phys. Chem. 75, 991-1024 (1971). 2. Dawson, W. R. & Windsor, M. W. Fluorescence yield of aromatic compounds. J. Phys. Chem. 72, 3251-3260 (1968). 3. Weber, G. & Teale, F. W. J. Determination of the absolute quantum yield of fluorescent solutions. Trans. Faraday. Soc. 53, 646-655 (1957). 4. Chen, W., Yan, L. & Bangal, P. R. Chemical reduction of graphene oxide to graphene by sulfur-containing compounds. J. Phys. Chem. C 114, 19885-19890 (2010). 5. Li, J., Lin, H., Yang, Z. & Li, J. A method for the catalytic reduction of graphene oxide at temperature below 150 oC. Carbon 49, 3024-3030 (2011). 6. Stankovich, S. et al. Synthesis of graphene-based nanosheets via chemical reduction of exfoliated graphite oxide. Carbon 45, 1558-1565 (2007). 7. Novoselov, K. S. A. et al. Electric field effect in atomically thin carbon films. Science 306, 666-669 (2004). 8. Li, X., Wang, X., Zhang, L., Lee, S. & Dai, H. Chemically derived, ultrasmooth graphene nanoribbon. Science 319, 1229-1232 (2008).
Electronic Supplementary Material (ESI) for Chemical CommunicationsThis journal is © The Royal Society of Chemistry 2012


![Highly Luminescent Quantum Dots: New Tools for Biological ...polymers, ligand exchange and the direct synthesis of water soluble QDs via aqueous routes[4-6]. Direct synthesises of](https://img.pdfslide.net/doc/110x75/5f381c754c18220b6132db7d/highly-luminescent-quantum-dots-new-tools-for-biological-polymers-ligand-exchange.jpg)