Embed Size (px)
Citation preview
Creative Services, Apps and Banks in Australia
Ben Goldsmith
Senior Research Fellow
ARC Centre of Excellence for Creative Industries and Innovation
Queensland University of Technology
@bengo1379
CREATIVE SERVICES EMPLOYMENT
• The Creative Trident – ‘Core’ and ‘Embedded’ Creatives• Cultural Production and Creative Services
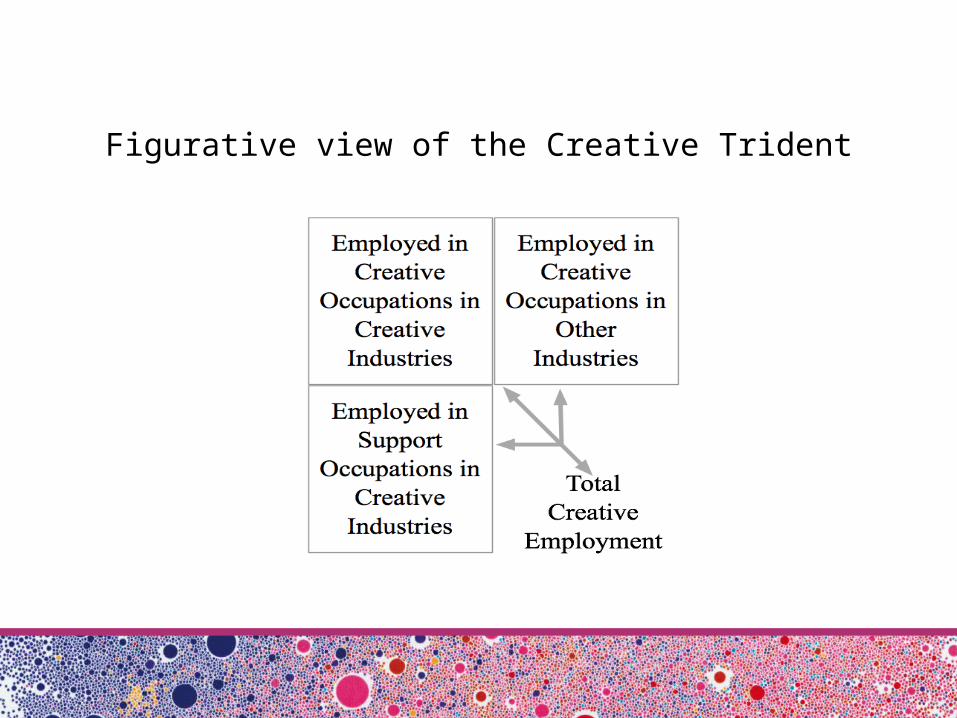
Figurative view of the Creative Trident
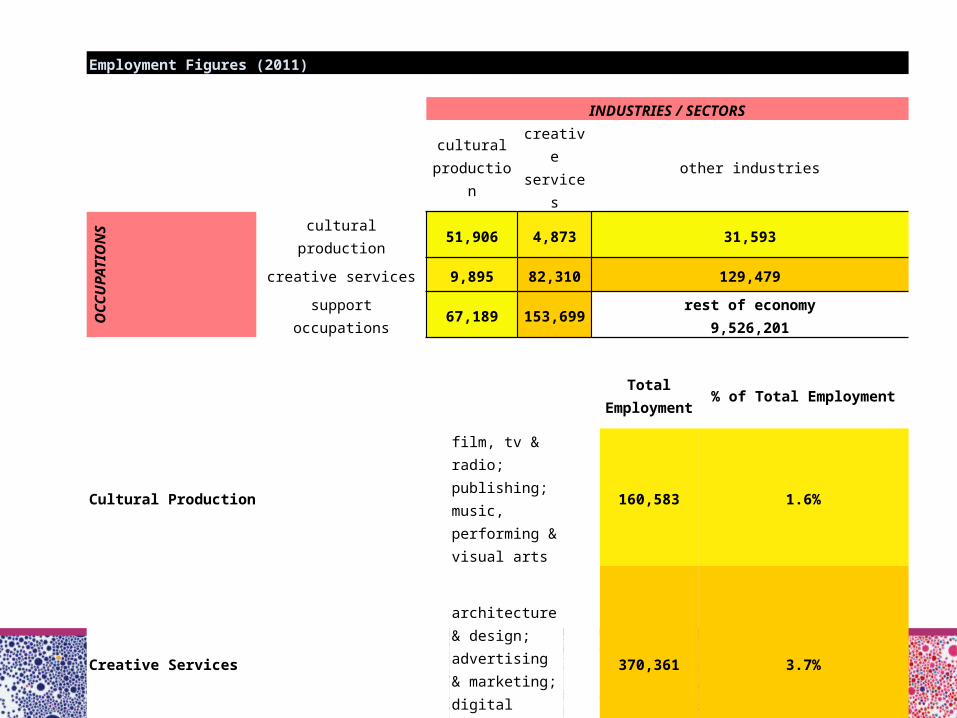
Employment Figures (2011) INDUSTRIES / SECTORS
cultural
productioncreative services
other industries
OCCUPATIONS
cultural production 51,906 4,873 31,593
creative services 9,895 82,310 129,479
support occupations 67,189 153,699rest of economy
9,526,201
Total
Employment
% of Total Employment
Cultural Production
film, tv & radio; publishing; music, performing & visual arts
160,583 1.6%
Creative Services
architecture & design; advertising & marketing; digital content & software
370,361 3.7%
TOTAL CREATIVE ECONOMY 530,944 5.3%
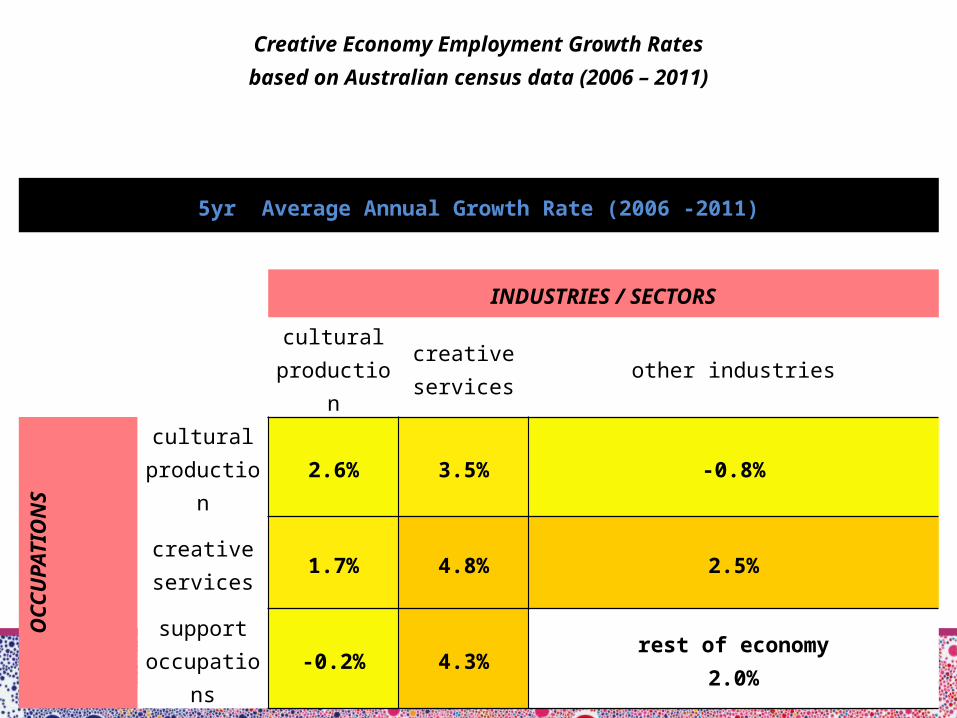
Creative Economy Employment Growth Ratesbased on Australian census data (2006 – 2011)
5yr Average Annual Growth Rate (2006 -2011)
INDUSTRIES / SECTORS
cultural
productioncreative services
other industries
OCCUPATIONS
cultural production
2.6% 3.5% -0.8%
creative services
1.7% 4.8% 2.5%
support occupation
s-0.2% 4.3%
rest of economy2.0%
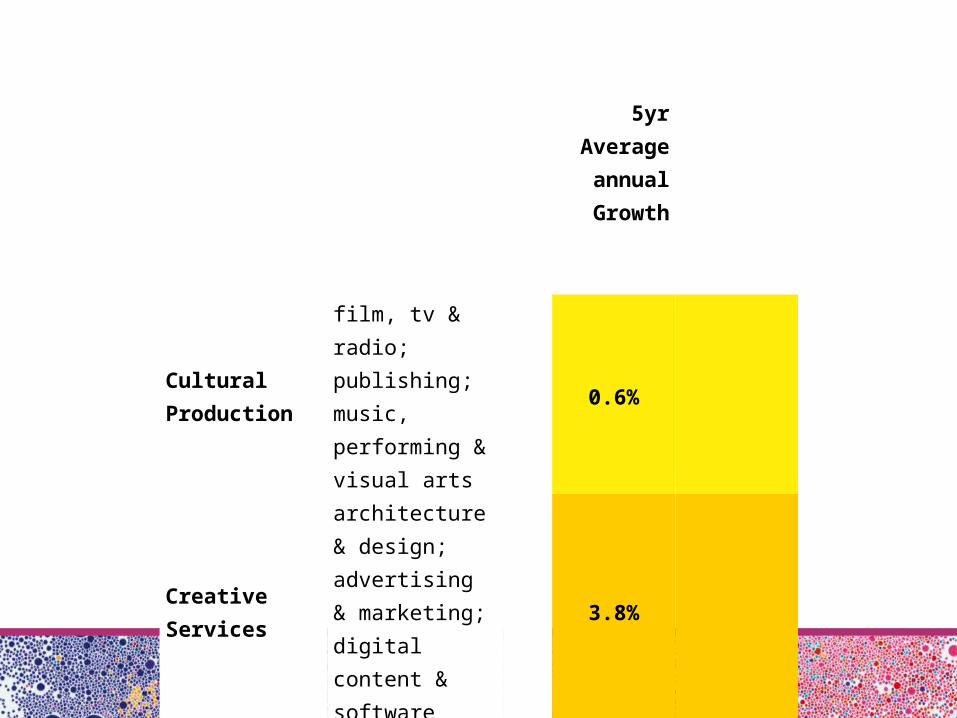
5yr Average
annual Growth
Cultural Production
film, tv & radio; publishing; music, performing & visual arts
0.6%
Creative Services
architecture & design; advertising & marketing; digital content & software
3.8%
TOTAL CREATIVE ECONOMY
2.8%
THE APP ECONOMY
• App Downloads• More than App Stores and Platforms
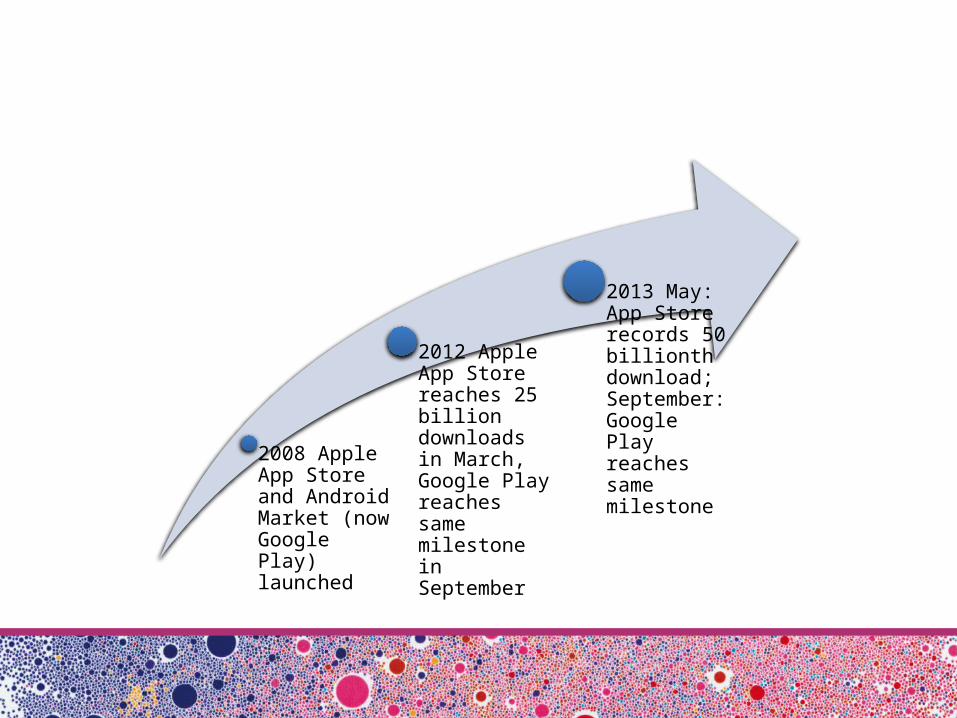
2008 Apple App Store and Android Market (now Google Play) launched
2012 Apple App Store reaches 25 billion downloads in March, Google Play reaches same milestone in September
2013 May: App Store records 50 billionth download; September: Google Play reaches same milestone
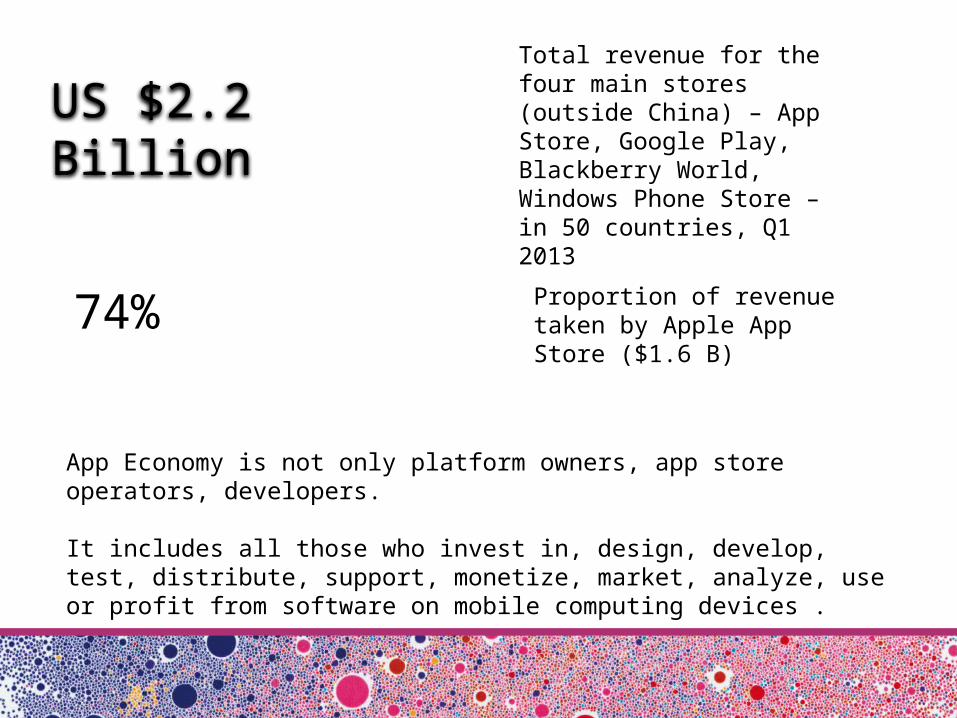
US $2.2 BillionTotal revenue for the four main stores (outside China) – App Store, Google Play, Blackberry World, Windows Phone Store – in 50 countries, Q1 2013
74% Proportion of revenue taken by Apple App Store ($1.6 B)
App Economy is not only platform owners, app store operators, developers.
It includes all those who invest in, design, develop, test, distribute, support, monetize, market, analyze, use or profit from software on mobile computing devices .
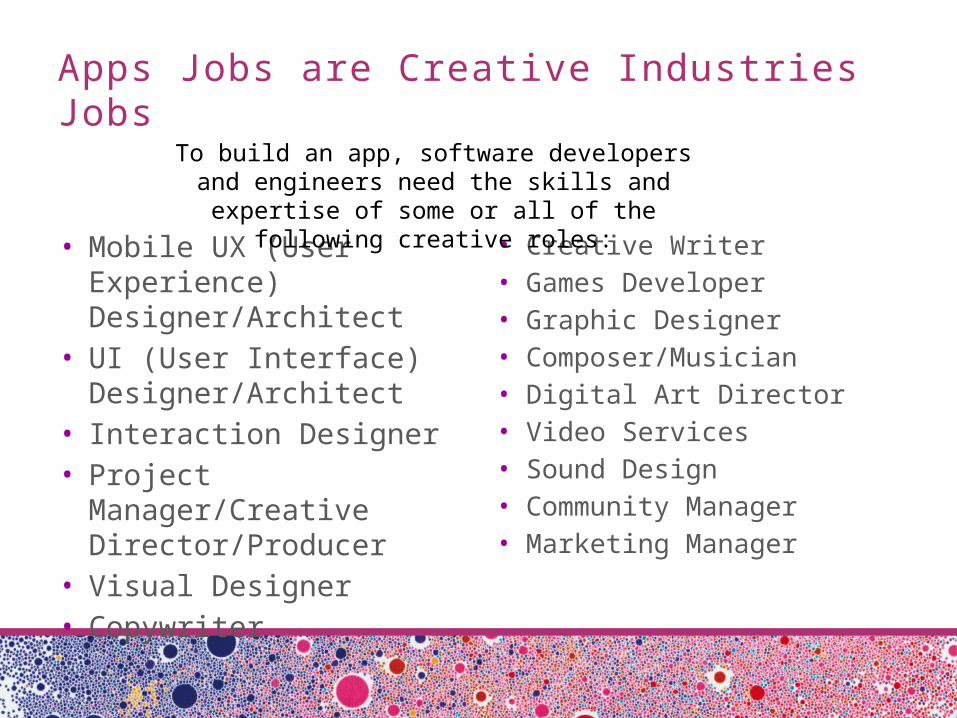
• Creative Writer• Games Developer• Graphic Designer• Composer/Musician• Digital Art Director• Video Services• Sound Design• Community Manager• Marketing Manager
Apps Jobs are Creative Industries Jobs
• Mobile UX (User Experience) Designer/Architect
• UI (User Interface) Designer/Architect
• Interaction Designer• Project Manager/Creative
Director/Producer• Visual Designer• Copywriter
To build an app, software developers and engineers need the skills and expertise of some or all of the following
creative roles:
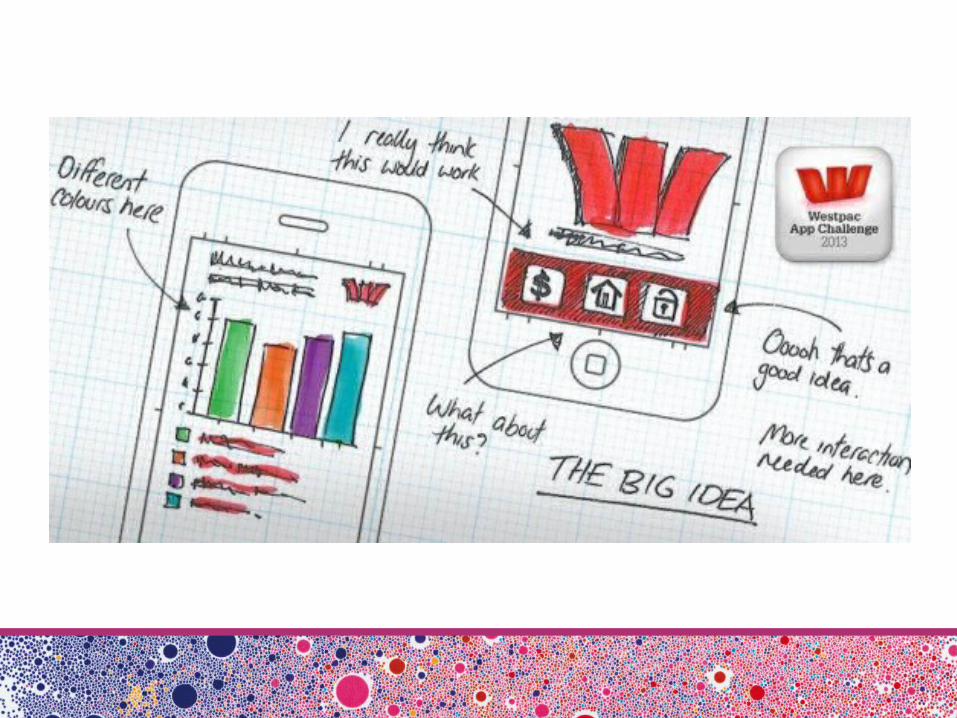
OUTSOURCING, CREATIVE SERVICES, APP DESIGN AND DEVELOPMENT
• “SYDNEY, October 9, 2013: Freelancer.com dominates as the platform small businesses and start-ups rely on to get work done, breaking through 5 million projects posted on the site.”
• “The top category remains websites, IT and software development at 40.0%, as businesses continue to rush online. Rounding out the top 5 categories are design, media and architecture (24.0%), writing and content creation (10.7%), sales and marketing jobs (7.9%) and data entry and administrative jobs (5.9%).”
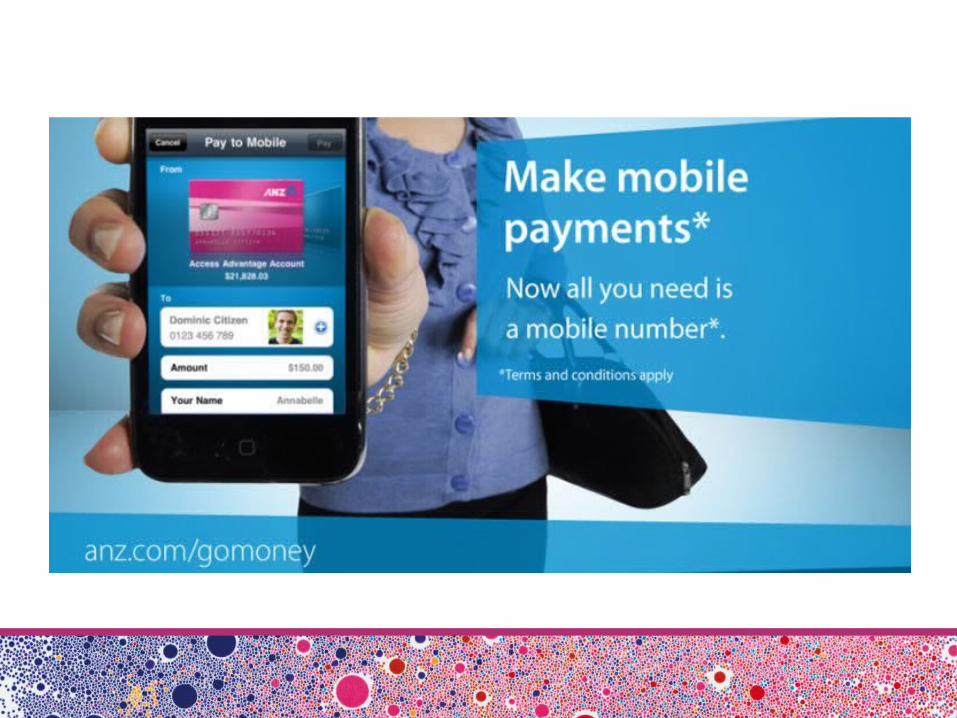
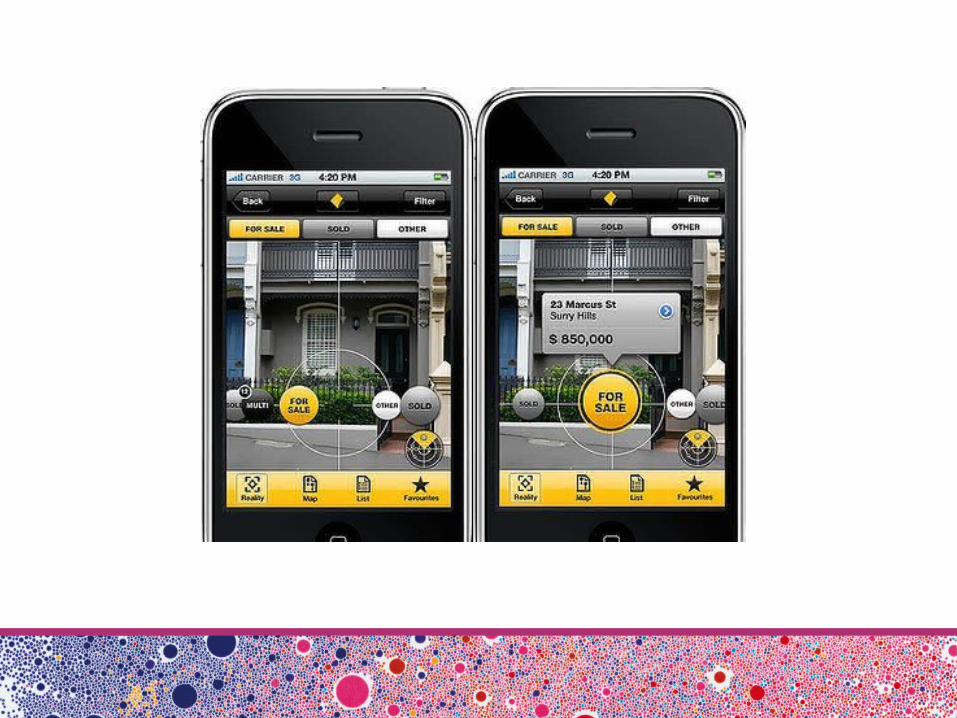
MOBILE BANKING, CREATIVE SERVICES AND APPS
• Mobile banking use• Financial services and mobile• Bank apps
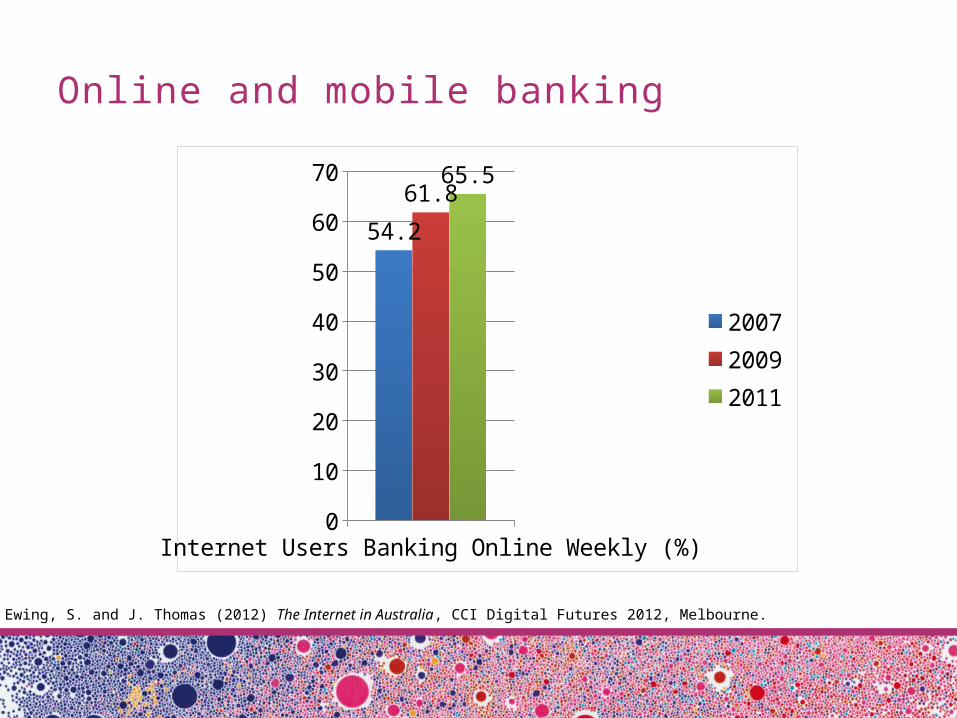
Online and mobile banking
Internet Users Banking Online Weekly (%)0
10
20
30
40
50
60
70
54.2
61.865.5
200720092011
Source: Ewing, S. and J. Thomas (2012) The Internet in Australia, CCI Digital Futures 2012, Melbourne.
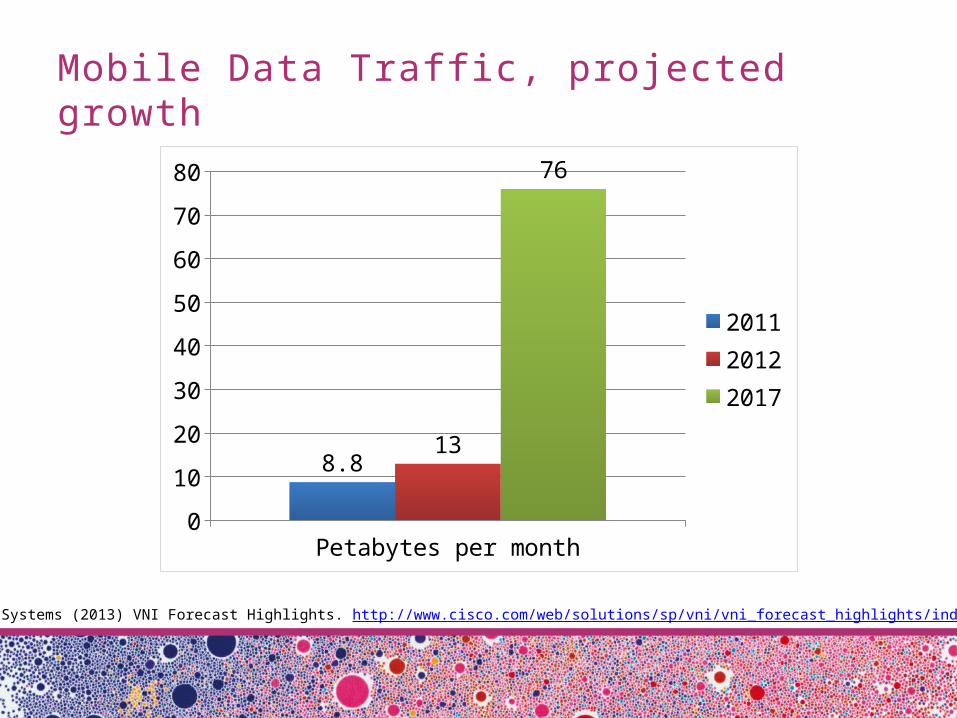
Mobile Data Traffic, projected growth
Petabytes per month0
10
20
30
40
50
60
70
80
8.813
76
201120122017
Source: Cisco Systems (2013) VNI Forecast Highlights. http://www.cisco.com/web/solutions/sp/vni/vni_forecast_highlights/index.html
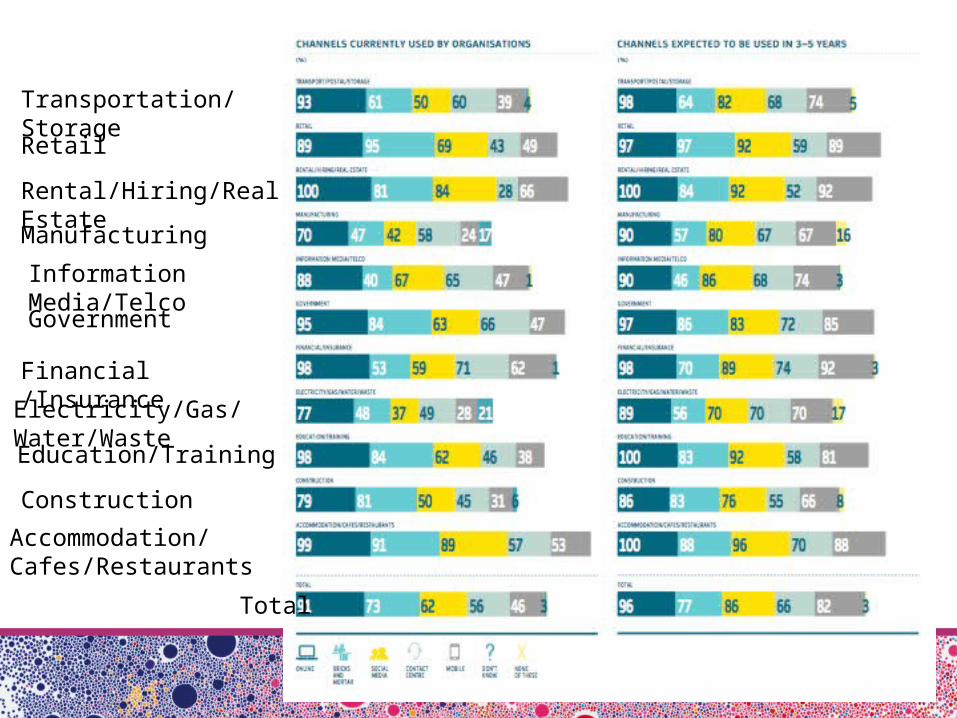
Transportation/Storage
Retail
Rental/Hiring/Real Estate
Manufacturing
Information Media/Telco
Government
Financial /Insurance
Electricity/Gas/Water/Waste
Education/Training
Construction
Accommodation/Cafes/Restaurants
Total
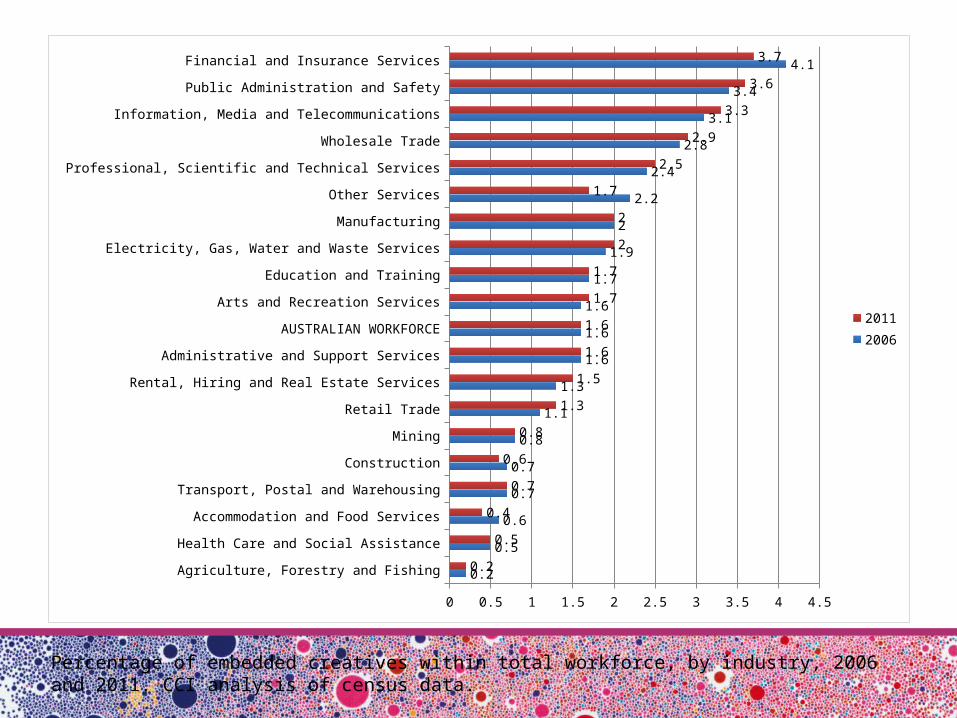
Agriculture, Forestry and Fishing
Health Care and Social Assistance
Accommodation and Food Services
Transport, Postal and Warehousing
Construction
Mining
Retail Trade
Rental, Hiring and Real Estate Services
Administrative and Support Services
AUSTRALIAN WORKFORCE
Arts and Recreation Services
Education and Training
Electricity, Gas, Water and Waste Services
Manufacturing
Other Services
Professional, Scientific and Technical Services
Wholesale Trade
Information, Media and Telecommunications
Public Administration and Safety
Financial and Insurance Services
0 0.5 1 1.5 2 2.5 3 3.5 4 4.5
0.2
0.5
0.6
0.7
0.7
0.8
1.1
1.3
1.6
1.6
1.6
1.7
1.9
2
2.2
2.4
2.8
3.1
3.4
4.1
0.2
0.5
0.4
0.7
0.6
0.8
1.3
1.5
1.6
1.6
1.7
1.7
2
2
1.7
2.5
2.9
3.3
3.6
3.7
20112006
Percentage of embedded creatives within total workforce, by industry, 2006 and 2011. CCI analysis of census data.

![THE CREATIVE SUBURB: A STUDY IN CREATIVE REFLECTIVE …Brisbane, Queensland today. Florida [6], for example, confirmed the ‘creative class’ preference to live and work in ... advertising](https://img.pdfslide.net/doc/110x75/5fa0b79c43148771cb06290a/the-creative-suburb-a-study-in-creative-reflective-brisbane-queensland-today.jpg)