Embed Size (px)
Citation preview
USAID-Funded Economic Governance II Project Credit Risk Workshop - Intermediate March 2006
Funded by:
Credit Analysis
©2006 BearingPoint, Inc.
Table of Contents
MODULE 3: CREDIT ANALYSIS OVERVIEW............................................................................................................................................... 1
LEARNING OBJECTIVES ...................................................................................................................... 1 FINANCIAL STATEMENT ANALYSIS ........................................................................................................ 2 THE INCOME STATEMENT ....................................................................................................................... 7 THE BALANCE SHEET............................................................................................................................ 10 RATIO ANALYSIS................................................................................................................................... 12 CASH FLOW ANALYSIS ......................................................................................................................... 19 THE DIRECT CASH FLOW STATEMENT: CONSTRUCTION STEPS ........................................................... 23 CASH FLOW DRIVERS...................................................................................................................... 33 EXERCISE: NAZRAT............................................................................................................................... 34 SUMMARY ............................................................................................................................................. 35
Central Bank of Iraq 2006
Credit Analysis Overview This module will review the key components of fundamental analysis of a borrower’s creditworthiness. The emphasis will be on the analysis of the income statement, balance sheet, relevant ratios, and cash flow statement, and tying the three statements together. The module is not intended to be an exhaustive discussion, but to provide the examiner with a framework for reviewing the key elements of sound credit analysis, a crucial part of any credit approval process.
Learning Objectives Upon the completion of this module, you will be able to:
♦ Discern best practice credit analysis techniques when reviewing borrower financial statements held by the bank, and
♦ Evaluate the appropriateness, quality and results of the credit analysis techniques used by the bank in its credit process.
Central Bank of Iraq 2-1 2006
Credit Risk Workshop - Intermediate
Financial Statement Analysis There is no substitute for thorough and rigorous analysis of a borrower’s financial statements when attempting to determine a borrower’s creditworthiness. The balance sheet, income statement, cash flow statement, and financial projections all provide critical information about the borrower’s creditworthiness and capacity to repay. Analysis of revenues and profit margins, cash flow, leverage, liquidity, and capitalization is required in sufficient detail to determine strengths that the lender wants to preserve and weaknesses that may impact the borrower’s repayment capacity. If the bank fails to undertake rigorous analysis upfront, its capacity to protect itself against future repayment problems is limited and the quality of the loan portfolio will inevitably suffer. However, despite the importance of financial statement analysis in determining creditworthiness, the final credit decision is subjective because the most important factor in the decision is management of the borrower. An evaluation of management is based on both objective and subjective factors but is, in the end, subjective because there is no ratio or number that will inform the banker of management’s intention or willingness to repay a loan. Therefore, the credit officer should make a serious effort to determine the competence, honesty and integrity of borrower management in each case. This effort should include what is called “due diligence,” that is, the attempt to “know your customer1” through contacting customers, suppliers and others in the industry who have experience with the borrower and its management. Where possible and legal, in the case of smaller companies with single owners where personal guarantees will be required, a credit history should be obtained to determine the owner’s record of fulfilling his/her financial obligations. Court records should be reviewed to determine if there have been any court proceedings against the borrower and/or borrower management. The question is whether or not borrower management, or the business owner, will honor its obligations to the lender in the best case and worst case. If the borrower encounters difficulties in repaying its obligation(s) to the bank, will management, or the owner, be willing to collaborate with the bank to “work out” repayment, however long it requires.
1 In this case, “know your customer” has essentially the same meaning as applied in AMLA.
Central Bank of Iraq 2-2 2006
Credit Risk Workshop - Intermediate
Central Bank of Iraq 2-3 2006
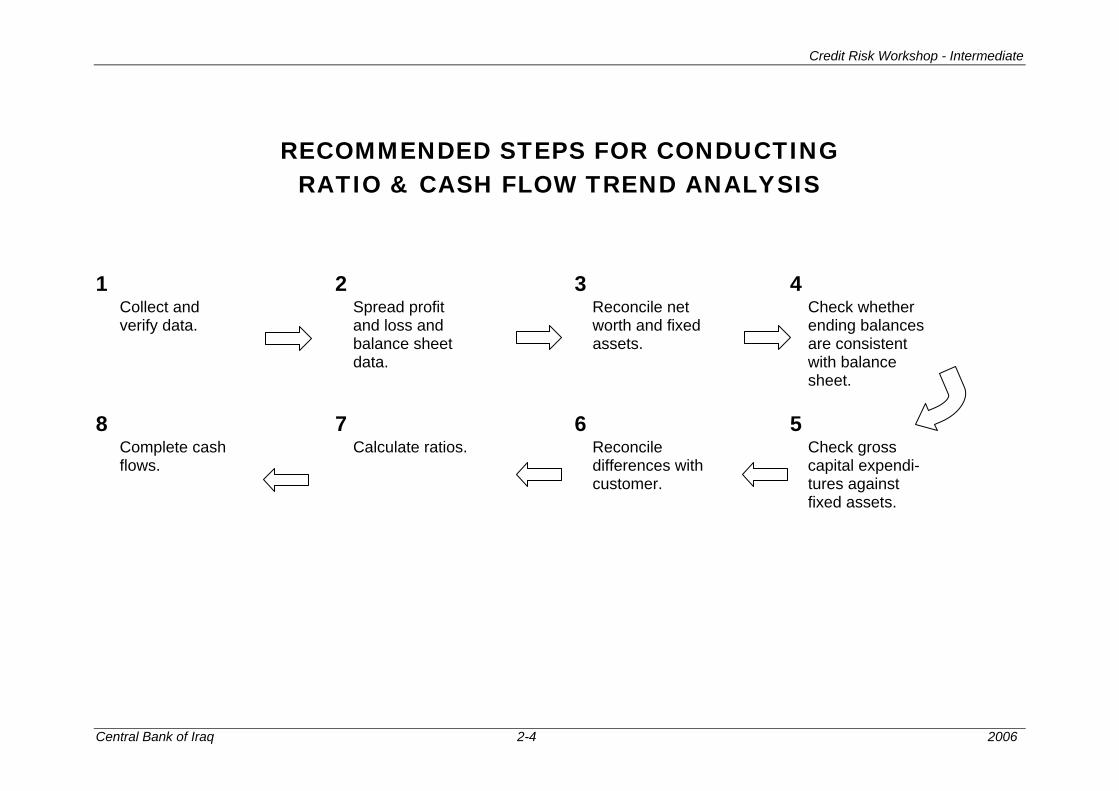
On the following page is a flow chart depicting the key steps required to conduct a well-grounded analysis of creditworthiness. Adoption of this or a similar process flow will facilitate the adoption of the following major requirements for all credit analyses:
♦ Develop a common (spreadsheet) format for organizing financial information to make analysis easier.
♦ Require a standard analysis for the key financial ratios and trends.
♦ Base credit on requirements directly related to actual, identified business needs and cash flow projections. And,
♦ Structure credit facilities to protect the bank against key business, management and financial risks, and match the likely cash inflows and outflows.
Credit Risk Workshop - Intermediate
k of Iraq 2-4 2006
RECOMMENDED STEPS FOR CONDUCTING RATIO & CASH FLOW TREND ANALYSIS
1 2 3 4 Collect and Spread profit Reconcile net Check whether verify data. and loss and worth and fixed ending balances balance sheet assets. are consistent data. with balance sheet.
8 7 6 5 Complete cash Calculate ratios. Reconcile Check gross flows. differences with capital expendi- customer. tures against fixed assets.
Central Ban
Credit Risk Workshop - Intermediate
If the above steps are followed, they will help to:
♦ Eliminate excessive, unquantified risks to the lending bank.
♦ Establish credit requirements based on actual cash flow.
♦ Enable banks to fully evaluate and understand their customers’ creditworthiness. And,
♦ Enable banks to structure credit requirements based on accurate risk assessment.
Central Bank of Iraq 2-5 2006
Credit Risk Workshop - Intermediate
The examiner should always see five key components of analysis. They are;
♦ Income statement
♦ Balance sheet
♦ Net worth and fixed asset reconciliation
♦ Key ratios
♦ Cash flow statement
With regard to interpreting financial ratios and trends, the credit analyst or officer will review the following key ratio groupings to determine borrower trends or issues that may impact creditworthiness:
Profitability: Represents the degree to which a business is able to produce sales greater than the cost of doing business. Companies must be profitable or at least produce positive cash flow to survive. Efficiency: Represents the effectiveness of the company’s management of its resources and activities. Lower efficiency represents a risk to continuing profitability. It also occurs when business owners withdraw excessive compensation or assets in advance of bankruptcy. Leverage: The difference between the funds supplied by the business owners and the financing supplied by creditors. Higher leverage means the bank is taking the risk as opposed to the business owner/borrower. Liquidity: The ability of the company’s management to meet current obligations by generating sufficient cash flow or having the ability to liquidate assets without substantial loss in a short timeframe.
Profitability is reflected in the income statement. Efficiency reflects both balance sheet and income statement items and activities, while leverage and liquidity ratios are balance sheet related. Therefore, when analyzing the above groups of ratios, the analyst moves beyond analysis of the income statement and/or balance sheet alone. When using accrual basis financial statements, cash flow analysis ties together the income statement and balance sheet to provide the analyst with a more complete financial picture of the borrower. Cash flow analysis “looks behind” the accrual basis numbers to identify the actual cash inflows and outflows over a certain period of time. Since cash flow is the first source of repayment, this exercise is critical. We will first address the income statement, then the balance sheet followed by ratio analysis and cash flow. Our assumption is that the financial statements are prepared on the accrual basis.
Central Bank of Iraq 2-6 2006
Credit Risk Workshop - Intermediate
The Income Statement Typically, the lender should have at least three years of income statements to review. The most important item on the income statement is not net, after-tax income but operating income. The key question is whether or not the borrower has demonstrated the capacity to generate consistent net operating income over comparable specific periods of time. The longer the period of review the better because the lender will be able to see if the borrower has the capacity to withstand the business cycle. Operating income reflects the borrower’s ability to produce income from its basic business operations, after all operating expenses, before financing expenses. Another term for consistent operating income is “quality earnings.” Absent consistent operating income, serious doubts will likely arise about the creditworthiness of the borrower. As the credit analyst/officer analyzes the income statement, s/he will look for trends and tendencies, especially stable profit margins. Typically, the credit analyst/officer will analyze gross income and the gross operating margin first, in order to identify trends. Is the gross margin consistent over time? How does growth in cost of goods sold compare with sales growth? This is the first indication of the borrower’s ability to control costs. Second, the credit analyst/officer will analyze operating income, which is income after all selling, general and administrative expenses, and the operating margin. This is the second indicator of the borrower’s ability to control expenses, this time operating expenses. Is the operating margin consistent over time? How does growth in operating expenses compare with sales growth? This is another indication of the borrower’s cost control. Cost control, of course, is the responsibility of the borrower’s management. Finally, the credit analyst/officer will analyze pre-tax and after-tax income. Pre-tax income will reflect other income and expenses, as well as any extraordinary, non-recurring income or expenses. The analyst will observe closely what kind of impact other income and expense items, and extraordinary items have on the borrower’s pre-tax income. IF the borrower depends on other income and extraordinary items for positive pre-tax income, the quality of the earnings is generally poor. Management of the borrower bears the ultimate responsibility, of course, for the earnings of the borrower.
Central Bank of Iraq 2-7 2006
Credit Risk Workshop - Intermediate
One of the key purposes of analyzing the income statement is to identify strengths, weaknesses and trends, which help us to determine the potential risks in lending to the borrower. Strengths might include a leading position in the industry due to a recognized quality product or service, which would likely mean consistent, stable profit margins. Weaknesses might include a product or service that has not yet gained large market share or a large customer base, which is usually reflected in lower, often unstable profit margins. Companies with a small number of key customers or suppliers are generally more susceptible to market shocks. A potentially critical area to explore is credit sales. The credit analyst/officer should determine the breakdown of sales between cash and credit. The higher the percentage of cash the better because the borrower/seller receives full payment immediately. There is no need to await payment in full, which is the case in the event of credit or installment sales. Whatever the percentage of credit sales, the borrower is incurring credit risk, the risk that the buyer will not honor the commitment to pay in full. In addition, the business owner must exercise credit skills, which may not be an area of expertise. Assuming that the borrower has credit sales, on the balance sheet the borrower will reflect accounts receivable and establish a reserve against potential loss in the area of credit sales. This reserve is created and maintained through a provision for credit losses on the income statement. Therefore, large provisions may impact the income statement and reduce earnings. Depending on the borrower’s industry, inventory is another area with the potential to impact the income statement, if inventory must be written off due to shrinkage (theft) or obsolescence. Continual large write-offs of inventory are likely to reduce earnings. This is one area with clear potential for fraudulent activity and the credit officer must be alert to this possibility. This is especially true in retail operations, where finished inventory can “disappear” or obsolete inventory is not saleable, but is not written off and charged against income.
Central Bank of Iraq 2-8 2006
Credit Risk Workshop - Intermediate
One of the potential risks is rapid growth. Rapid growth often leads to loss of control over expenses, which can have a severe impact on earnings and, in turn, erode capital, if losses are incurred. If capital is reduced, leverage is likely to increase, which reduces the capacity of the borrower to absorb normal business risk and places greater reliance on creditors.
Another important potential risk is an extremely competitive business environment, which can squeeze profit margins, thereby reducing the amount of earnings retained and limiting the capacity of the borrower to grow using internally generated funds. In a highly competitive environment, the borrower must have tight control of expenses to be profitable. A peer group comparison is useful to place the borrower within the context of its industry. How do the borrower’s profit margins compare with similar companies in the same industry? Food for thought – Competitive businesses Determine which of the following businesses are competitive and which are not. Why?
♦ Oil production
♦ Ocean shipping
♦ Cell phones
♦ Electricity
♦ Airlines
♦ Coffee shops
Central Bank of Iraq 2-9 2006
Credit Risk Workshop - Intermediate
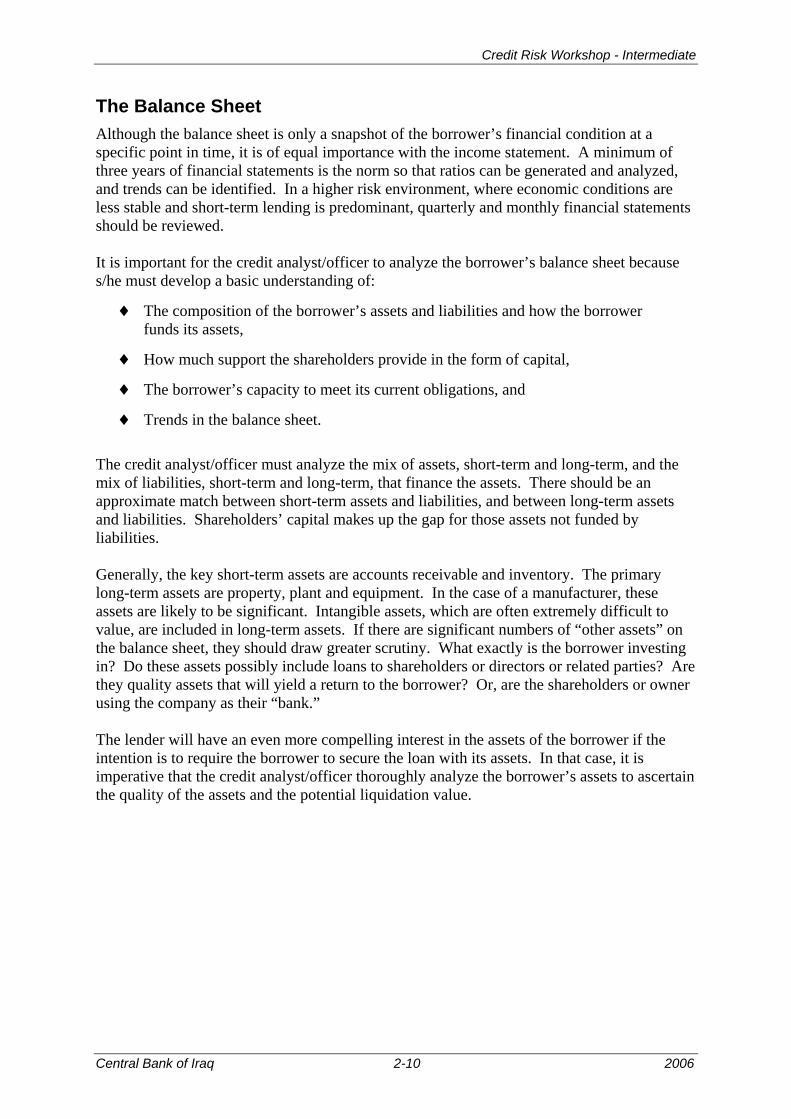
The Balance Sheet Although the balance sheet is only a snapshot of the borrower’s financial condition at a specific point in time, it is of equal importance with the income statement. A minimum of three years of financial statements is the norm so that ratios can be generated and analyzed, and trends can be identified. In a higher risk environment, where economic conditions are less stable and short-term lending is predominant, quarterly and monthly financial statements should be reviewed. It is important for the credit analyst/officer to analyze the borrower’s balance sheet because s/he must develop a basic understanding of:
♦ The composition of the borrower’s assets and liabilities and how the borrower funds its assets,
♦ How much support the shareholders provide in the form of capital,
♦ The borrower’s capacity to meet its current obligations, and
♦ Trends in the balance sheet.
The credit analyst/officer must analyze the mix of assets, short-term and long-term, and the mix of liabilities, short-term and long-term, that finance the assets. There should be an approximate match between short-term assets and liabilities, and between long-term assets and liabilities. Shareholders’ capital makes up the gap for those assets not funded by liabilities. Generally, the key short-term assets are accounts receivable and inventory. The primary long-term assets are property, plant and equipment. In the case of a manufacturer, these assets are likely to be significant. Intangible assets, which are often extremely difficult to value, are included in long-term assets. If there are significant numbers of “other assets” on the balance sheet, they should draw greater scrutiny. What exactly is the borrower investing in? Do these assets possibly include loans to shareholders or directors or related parties? Are they quality assets that will yield a return to the borrower? Or, are the shareholders or owner using the company as their “bank.” The lender will have an even more compelling interest in the assets of the borrower if the intention is to require the borrower to secure the loan with its assets. In that case, it is imperative that the credit analyst/officer thoroughly analyze the borrower’s assets to ascertain the quality of the assets and the potential liquidation value.
Central Bank of Iraq 2-10 2006
Credit Risk Workshop - Intermediate
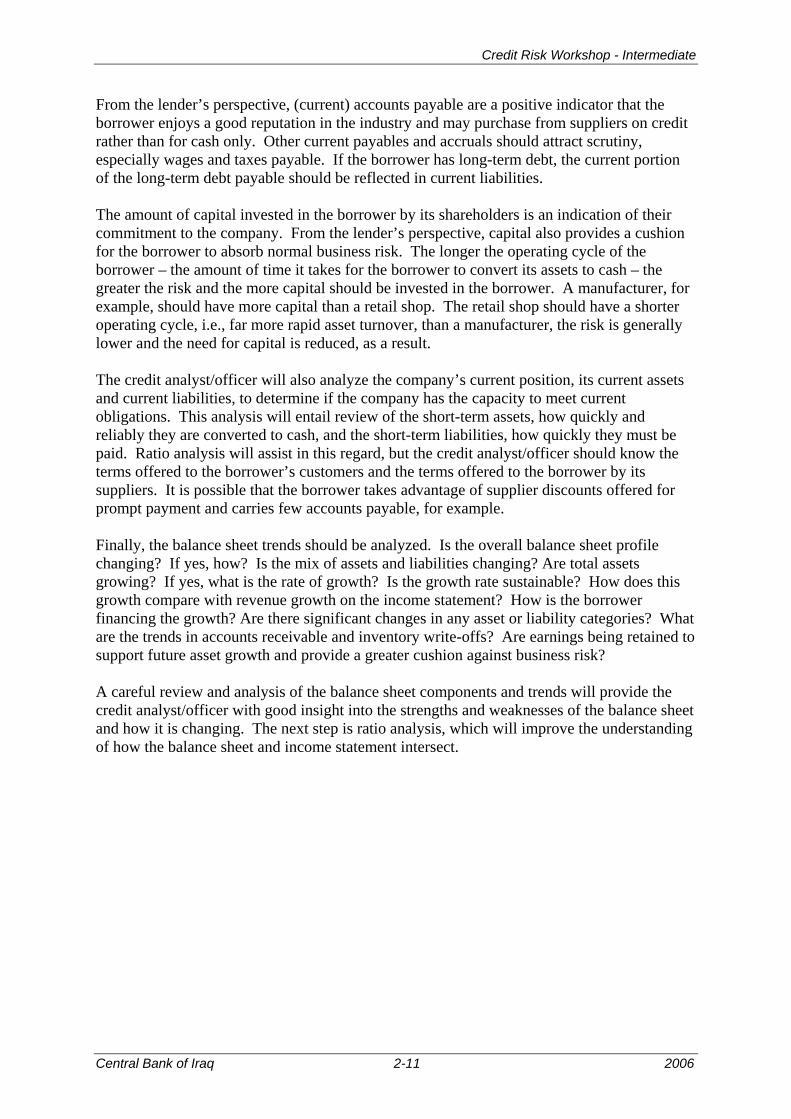
From the lender’s perspective, (current) accounts payable are a positive indicator that the borrower enjoys a good reputation in the industry and may purchase from suppliers on credit rather than for cash only. Other current payables and accruals should attract scrutiny, especially wages and taxes payable. If the borrower has long-term debt, the current portion of the long-term debt payable should be reflected in current liabilities. The amount of capital invested in the borrower by its shareholders is an indication of their commitment to the company. From the lender’s perspective, capital also provides a cushion for the borrower to absorb normal business risk. The longer the operating cycle of the borrower – the amount of time it takes for the borrower to convert its assets to cash – the greater the risk and the more capital should be invested in the borrower. A manufacturer, for example, should have more capital than a retail shop. The retail shop should have a shorter operating cycle, i.e., far more rapid asset turnover, than a manufacturer, the risk is generally lower and the need for capital is reduced, as a result. The credit analyst/officer will also analyze the company’s current position, its current assets and current liabilities, to determine if the company has the capacity to meet current obligations. This analysis will entail review of the short-term assets, how quickly and reliably they are converted to cash, and the short-term liabilities, how quickly they must be paid. Ratio analysis will assist in this regard, but the credit analyst/officer should know the terms offered to the borrower’s customers and the terms offered to the borrower by its suppliers. It is possible that the borrower takes advantage of supplier discounts offered for prompt payment and carries few accounts payable, for example. Finally, the balance sheet trends should be analyzed. Is the overall balance sheet profile changing? If yes, how? Is the mix of assets and liabilities changing? Are total assets growing? If yes, what is the rate of growth? Is the growth rate sustainable? How does this growth compare with revenue growth on the income statement? How is the borrower financing the growth? Are there significant changes in any asset or liability categories? What are the trends in accounts receivable and inventory write-offs? Are earnings being retained to support future asset growth and provide a greater cushion against business risk? A careful review and analysis of the balance sheet components and trends will provide the credit analyst/officer with good insight into the strengths and weaknesses of the balance sheet and how it is changing. The next step is ratio analysis, which will improve the understanding of how the balance sheet and income statement intersect.
Central Bank of Iraq 2-11 2006
Credit Risk Workshop - Intermediate
Central Bank of Iraq 2-12 2006
Ratio Analysis Ratios are a means to an end: greater understanding of trends in the borrower’s financial condition and operations that provide clues to those borrower activities that merit further investigation. Ratios also reflect how the balance sheet and income statement intersect, thereby enhancing the overall understanding of the borrower’s activities and improving the evaluation of its creditworthiness. The ratio groups are as follows:
♦ Liquidity
Current Quick
♦ Efficiency
Receivables turnover Inventory turnover Payables turnover Fixed asset turnover
♦ Profitability
Interest coverage Fixed charge coverage Net profit margin ROA ROE
♦ Leverage
Debt/equity Taken together, all of these ratios reflect the ability and capacity of borrower management to operate the business profitably, while minimizing expenses, maximizing revenues, and providing adequate capital to absorb normal business risk. On the following pages, the various ratio groupings are presented, together with the method of calculation and a brief description of their significance.

Credit Risk Workshop - Intermediate
KEY FINANCIAL RATIOS . . . PROFITABILITY
Ratio Calculation Definition Analysis Operating Profit Margin (Operating Profit/Net Sales)
X 100 • Represents the
percentage of profits retained from each sales dollar
• Ratio should remain stable or increase over time
• Understanding of any changes requires a detailed breakdown of operating expenses
Net Profit Margin (Net Profit/Net Sales) X 100 • Measures the ability of the business to generate profit from each sales dollar
• In general, this ratio should move in the same direction as the gross and operating profit margins
• Variances require a closer look at non-operating expenses, e.g., interest expenses
Direct Cost & Expense Ratios
(Cost of Goods Sold/Net Sales) X 100
• Indicates the percentage of each sales dollar used to fund the expenses
• Upward trends in any of these ratios may indicate reasons for declining profitability
• Downward trends may indicate good cost control
Central Bank of Iraq 2-13 2006
Credit Risk Workshop - Intermediate
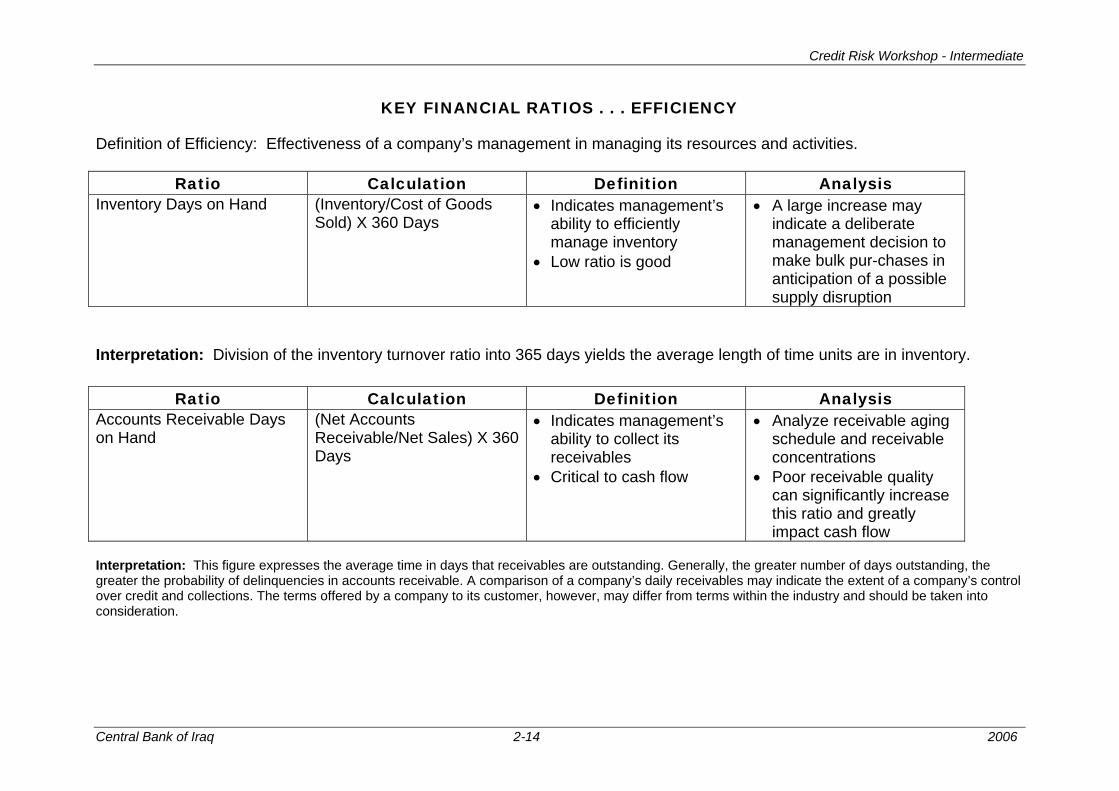
KEY FINANCIAL RATIOS . . . EFFICIENCY
Definition of Efficiency: Effectiveness of a company’s management in managing its resources and activities.
Ratio Calculation Definition Analysis Inventory Days on Hand (Inventory/Cost of Goods
Sold) X 360 Days • Indicates management’s
ability to efficiently manage inventory
• Low ratio is good
• A large increase may indicate a deliberate management decision to make bulk pur-chases in anticipation of a possible supply disruption
Interpretation: Division of the inventory turnover ratio into 365 days yields the average length of time units are in inventory.
Ratio Calculation Definition Analysis Accounts Receivable Days on Hand
(Net Accounts Receivable/Net Sales) X 360 Days
• Indicates management’s ability to collect its receivables
• Critical to cash flow
• Analyze receivable aging schedule and receivable concentrations
• Poor receivable quality can significantly increase this ratio and greatly impact cash flow
Interpretation: This figure expresses the average time in days that receivables are outstanding. Generally, the greater number of days outstanding, the greater the probability of delinquencies in accounts receivable. A comparison of a company’s daily receivables may indicate the extent of a company’s control over credit and collections. The terms offered by a company to its customer, however, may differ from terms within the industry and should be taken into consideration.
Central Bank of Iraq 2-14 2006
Credit Risk Workshop - Intermediate
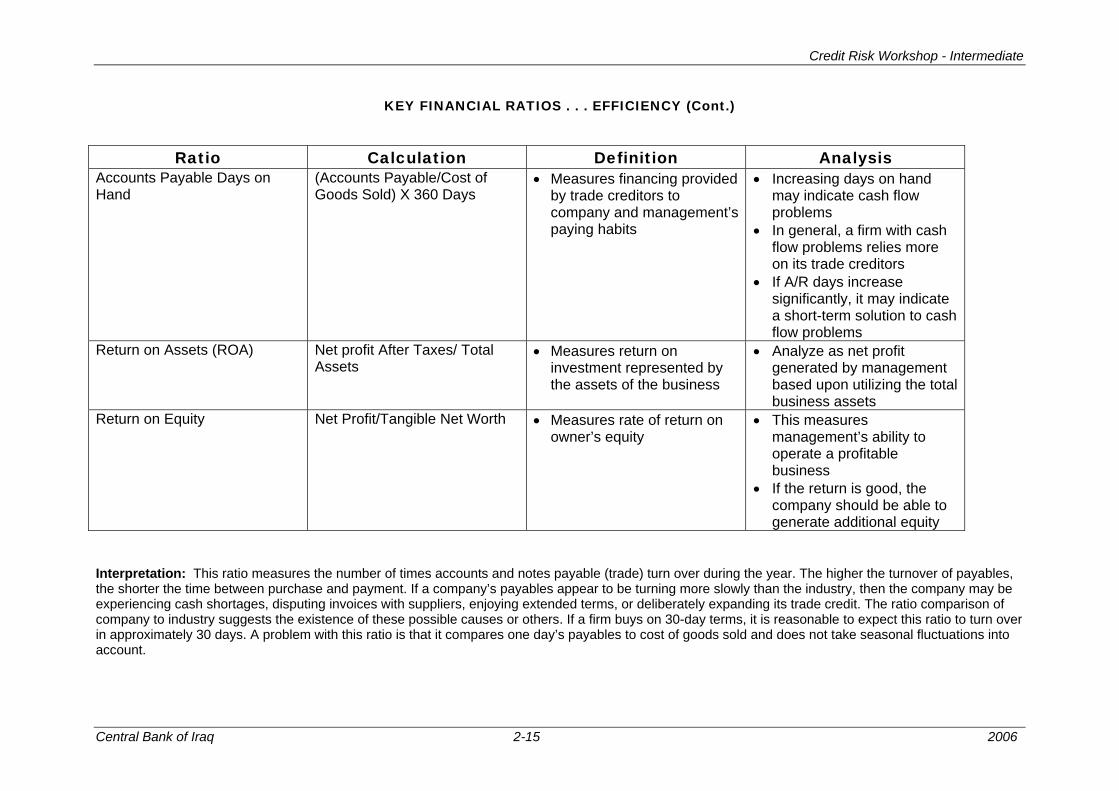
KEY FINANCIAL RATIOS . . . EFFICIENCY (Cont.)
Ratio Calculation Definition Analysis Accounts Payable Days on Hand
(Accounts Payable/Cost of Goods Sold) X 360 Days
• Measures financing provided by trade creditors to company and management’s paying habits
• Increasing days on hand may indicate cash flow problems
• In general, a firm with cash flow problems relies more on its trade creditors
• If A/R days increase significantly, it may indicate a short-term solution to cash flow problems
Return on Assets (ROA) Net profit After Taxes/ Total Assets
• Measures return on investment represented by the assets of the business
• Analyze as net profit generated by management based upon utilizing the total business assets
Return on Equity Net Profit/Tangible Net Worth • Measures rate of return on owner’s equity
• This measures management’s ability to operate a profitable business
• If the return is good, the company should be able to generate additional equity
Interpretation: This ratio measures the number of times accounts and notes payable (trade) turn over during the year. The higher the turnover of payables, the shorter the time between purchase and payment. If a company’s payables appear to be turning more slowly than the industry, then the company may be experiencing cash shortages, disputing invoices with suppliers, enjoying extended terms, or deliberately expanding its trade credit. The ratio comparison of company to industry suggests the existence of these possible causes or others. If a firm buys on 30-day terms, it is reasonable to expect this ratio to turn over in approximately 30 days. A problem with this ratio is that it compares one day’s payables to cost of goods sold and does not take seasonal fluctuations into account.
Central Bank of Iraq 2-15 2006
Credit Risk Workshop - Intermediate
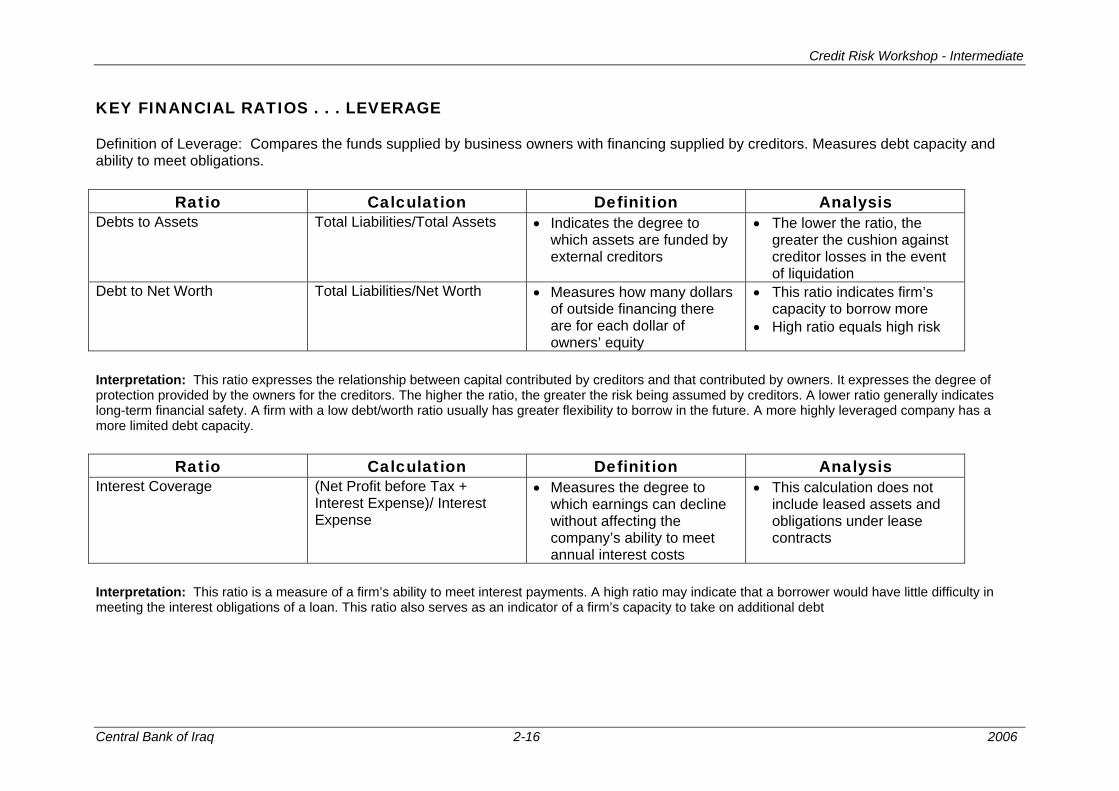
KEY FINANCIAL RATIOS . . . LEVERAGE Definition of Leverage: Compares the funds supplied by business owners with financing supplied by creditors. Measures debt capacity and ability to meet obligations.
Ratio Calculation Definition Analysis Debts to Assets Total Liabilities/Total Assets • Indicates the degree to
which assets are funded by external creditors
• The lower the ratio, the greater the cushion against creditor losses in the event of liquidation
Debt to Net Worth Total Liabilities/Net Worth • Measures how many dollars of outside financing there are for each dollar of owners’ equity
• This ratio indicates firm’s capacity to borrow more
• High ratio equals high risk
Interpretation: This ratio expresses the relationship between capital contributed by creditors and that contributed by owners. It expresses the degree of protection provided by the owners for the creditors. The higher the ratio, the greater the risk being assumed by creditors. A lower ratio generally indicates long-term financial safety. A firm with a low debt/worth ratio usually has greater flexibility to borrow in the future. A more highly leveraged company has a more limited debt capacity.
Ratio Calculation Definition Analysis Interest Coverage (Net Profit before Tax +
Interest Expense)/ Interest Expense
• Measures the degree to which earnings can decline without affecting the company’s ability to meet annual interest costs
• This calculation does not include leased assets and obligations under lease contracts
Interpretation: This ratio is a measure of a firm’s ability to meet interest payments. A high ratio may indicate that a borrower would have little difficulty in meeting the interest obligations of a loan. This ratio also serves as an indicator of a firm’s capacity to take on additional debt
Central Bank of Iraq 2-16 2006
Credit Risk Workshop - Intermediate
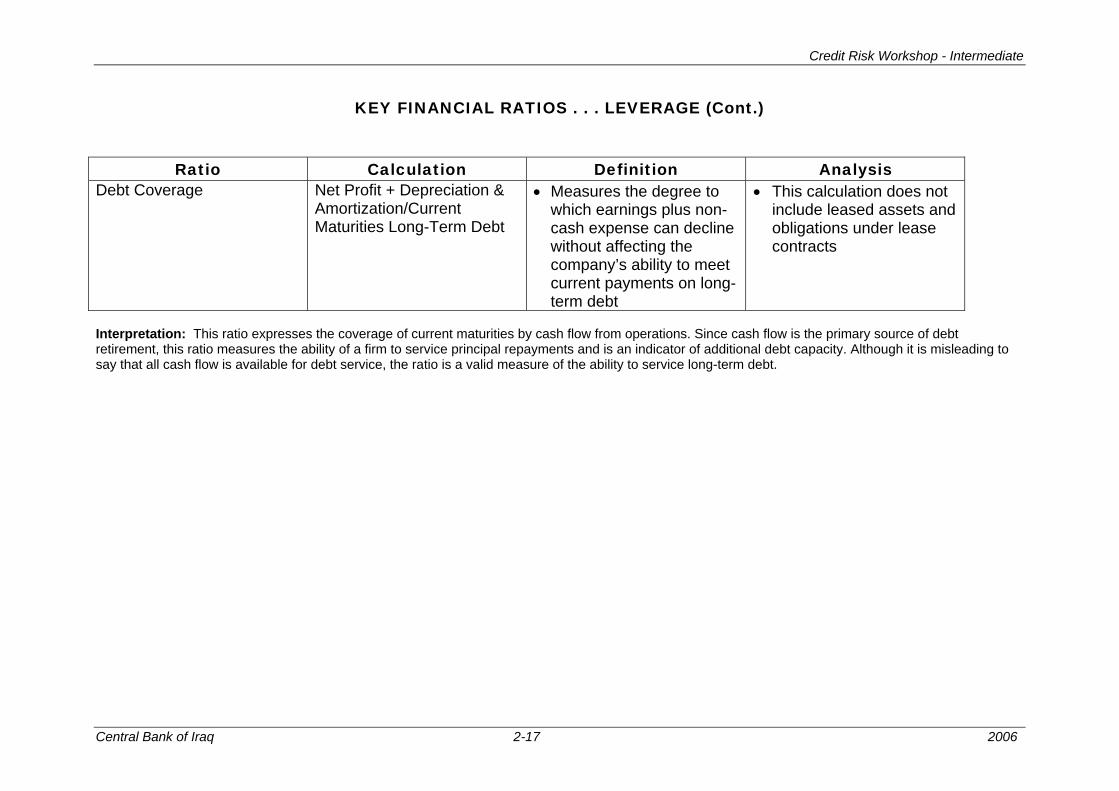
KEY FINANCIAL RATIOS . . . LEVERAGE (Cont.)
Ratio Calculation Definition Analysis
Debt Coverage Net Profit + Depreciation & Amortization/Current Maturities Long-Term Debt
• Measures the degree to which earnings plus non-cash expense can decline without affecting the company’s ability to meet current payments on long-term debt
• This calculation does not include leased assets and obligations under lease contracts
Interpretation: This ratio expresses the coverage of current maturities by cash flow from operations. Since cash flow is the primary source of debt retirement, this ratio measures the ability of a firm to service principal repayments and is an indicator of additional debt capacity. Although it is misleading to say that all cash flow is available for debt service, the ratio is a valid measure of the ability to service long-term debt.
Central Bank of Iraq 2-17 2006
Credit Risk Workshop - Intermediate
k of Iraq 2-18 2006
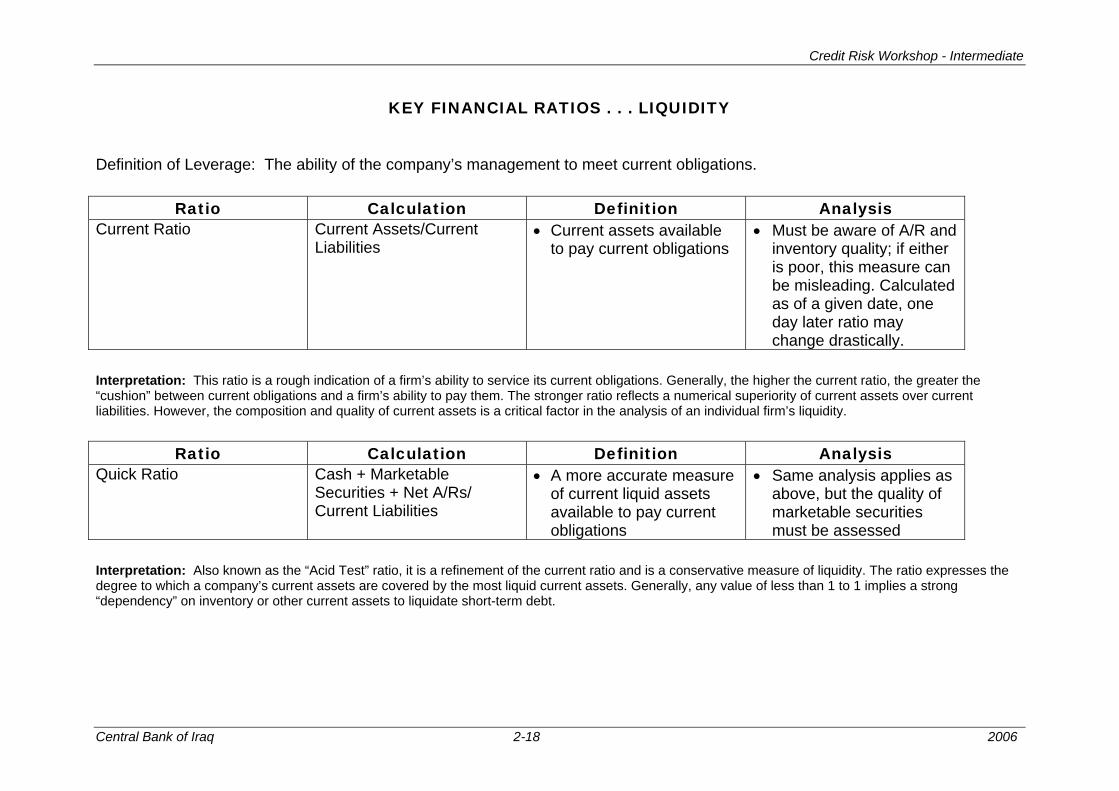
KEY FINANCIAL RATIOS . . . LIQUIDITY Definition of Leverage: The ability of the company’s management to meet current obligations.
Ratio Calculation Definition Analysis Current Ratio Current Assets/Current
Liabilities • Current assets available
to pay current obligations • Must be aware of A/R and
inventory quality; if either is poor, this measure can be misleading. Calculated as of a given date, one day later ratio may change drastically.
Interpretation: This ratio is a rough indication of a firm’s ability to service its current obligations. Generally, the higher the current ratio, the greater the “cushion” between current obligations and a firm’s ability to pay them. The stronger ratio reflects a numerical superiority of current assets over current liabilities. However, the composition and quality of current assets is a critical factor in the analysis of an individual firm’s liquidity.
Ratio Calculation Definition Analysis Quick Ratio Cash + Marketable
Securities + Net A/Rs/ Current Liabilities
• A more accurate measure of current liquid assets available to pay current obligations
• Same analysis applies as above, but the quality of marketable securities must be assessed
Interpretation: Also known as the “Acid Test” ratio, it is a refinement of the current ratio and is a conservative measure of liquidity. The ratio expresses the degree to which a company’s current assets are covered by the most liquid current assets. Generally, any value of less than 1 to 1 implies a strong “dependency” on inventory or other current assets to liquidate short-term debt.
Central Ban
Analysis of Credit Risk
Cash Flow Analysis The importance of cash flow analysis lies in the fact that cash flow is the first source of loan repayment. The task of the credit analyst/officer is to satisfy himself/herself that the borrower has demonstrated the capacity in the past, and is likely to continue to have the capacity in the future, to generate sufficient cash flow to repay the proposed loan plus interest. Cash flow analysis involves the use of the balance sheet and the income statement to identify the sources and uses of cash for the operating needs of the business. By analyzing the changes in cash, a lender gains insight, not only into the effects of past management decisions, but also into the company’s direction. Changes in working capital and capital expenditures are quantified and highlighted. The analysis highlights cash needs directly, thereby showing the competing uses of cash to repay the bank’s debt.
A company may be profitable and growing in sales, but the cash generation from income and non-cash expenses may be insufficient to repay the bank debt.
Central Bank of Iraq 2-19 2006
Credit Risk Workshop - Intermediate
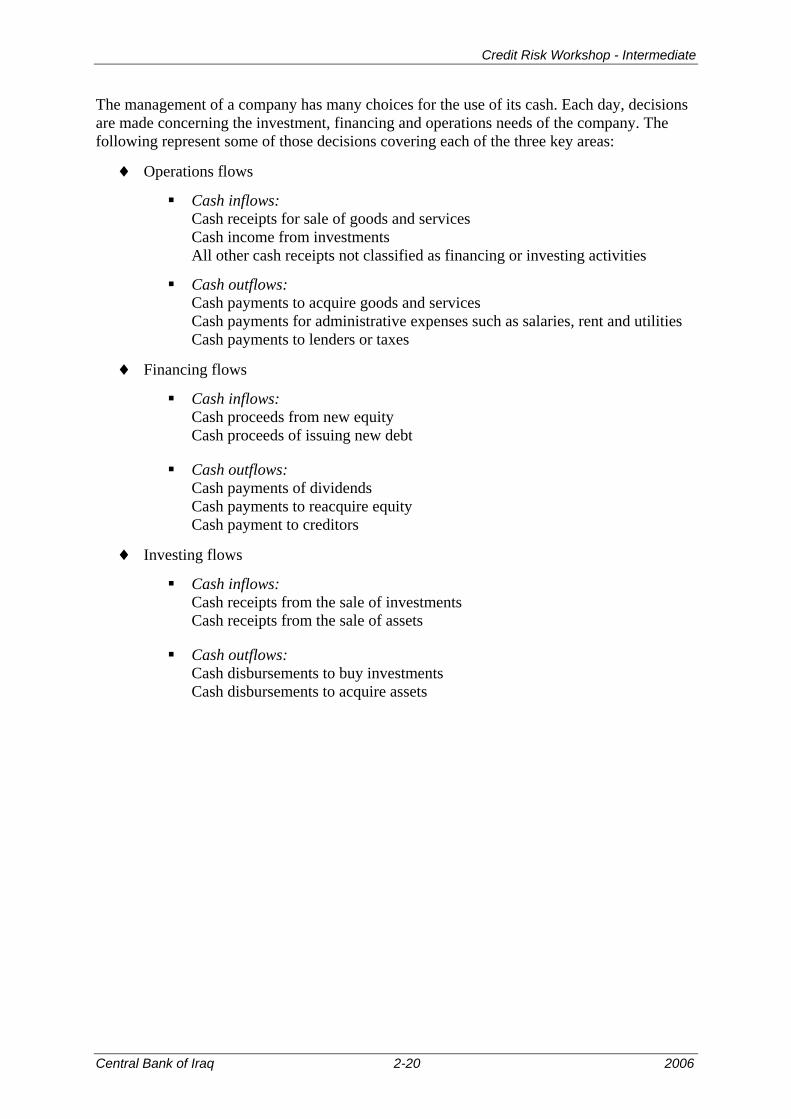
The management of a company has many choices for the use of its cash. Each day, decisions are made concerning the investment, financing and operations needs of the company. The following represent some of those decisions covering each of the three key areas:
♦ Operations flows
Cash inflows: Cash receipts for sale of goods and services Cash income from investments All other cash receipts not classified as financing or investing activities
Cash outflows: Cash payments to acquire goods and services Cash payments for administrative expenses such as salaries, rent and utilities Cash payments to lenders or taxes
♦ Financing flows
Cash inflows: Cash proceeds from new equity Cash proceeds of issuing new debt
Cash outflows: Cash payments of dividends Cash payments to reacquire equity Cash payment to creditors
♦ Investing flows
Cash inflows: Cash receipts from the sale of investments Cash receipts from the sale of assets
Cash outflows: Cash disbursements to buy investments Cash disbursements to acquire assets
Central Bank of Iraq 2-20 2006
Analysis of Credit Risk
Below are the types of questions that lenders should ask when constructing and analyzing the cash flow statement.
♦ Can the borrower service and repay the loan within the intended timeframe?
♦ How has the borrower generated cash flows and invested those cash flows in such uses as working capital needs, capital expenditures, long-term debt repayments, dividend payments, and, where made, stock repurchases?
♦ What are the effects on the borrower’s cash flow of changes in the economy, marketplace, and competitive environment in general, and of management’s actions and reactions to these changes in particular?
♦ What are the borrower’s total financing needs after it has serviced its debt, invested in working capital, made capital expenditures, and paid dividends or repurchased stock?
♦ How has the borrower financed its needs in terms of long-term vs. short-term?
These questions not only address the fundamental and most important question for the lender — is repayment possible? — but they do so in the context of an analysis of the borrower’s whole business and, in particular, how it has generated cash, invested such cash and financed the difference between what it has generated and what it has spent. On the following pages, the direct method of calculating cash flow is presented, together with instructions on how to prepare it. The direct method is generally preferred over the indirect method, although neither method is without flaws. The two methods differ only in the manner in which cash flows from operating activities are presented. Net cash flows from operating activities are equal under both methods. Furthermore, the manner of presentation and the total of net cash flows from investing and financing activities are the same under both methods.
Central Bank of Iraq 2-21 2006
Credit Risk Workshop - Intermediate
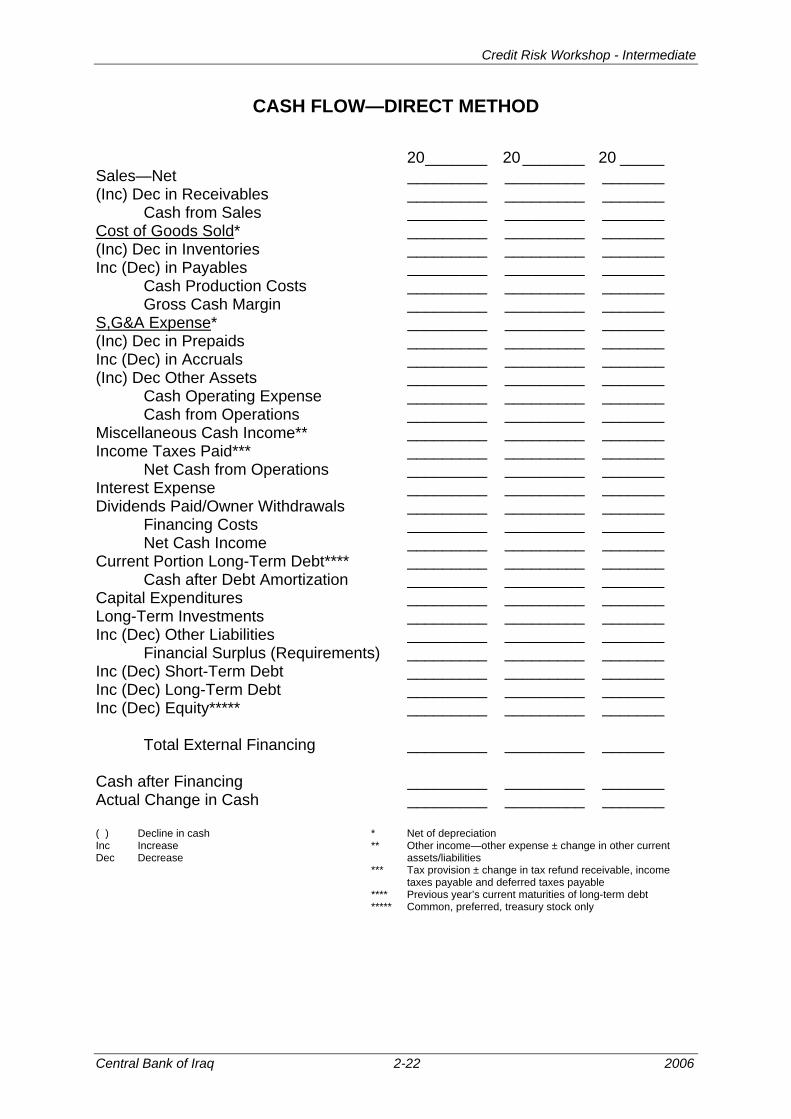
CASH FLOW—DIRECT METHOD
20_______ 20_______ 20 _____ Sales—Net _________ _________ _______ (Inc) Dec in Receivables _________ _________ _______ Cash from Sales _________ _________ _______ Cost of Goods Sold* _________ _________ _______ (Inc) Dec in Inventories _________ _________ _______ Inc (Dec) in Payables _________ _________ _______ Cash Production Costs _________ _________ _______ Gross Cash Margin _________ _________ _______ S,G&A Expense* _________ _________ _______ (Inc) Dec in Prepaids _________ _________ _______ Inc (Dec) in Accruals _________ _________ _______ (Inc) Dec Other Assets _________ _________ _______ Cash Operating Expense _________ _________ _______ Cash from Operations _________ _________ _______ Miscellaneous Cash Income** _________ _________ _______ Income Taxes Paid*** _________ _________ _______ Net Cash from Operations _________ _________ _______ Interest Expense _________ _________ _______ Dividends Paid/Owner Withdrawals _________ _________ _______ Financing Costs _________ _________ _______ Net Cash Income _________ _________ _______ Current Portion Long-Term Debt**** _________ _________ _______ Cash after Debt Amortization _________ _________ _______ Capital Expenditures _________ _________ _______ Long-Term Investments _________ _________ _______ Inc (Dec) Other Liabilities _________ _________ _______ Financial Surplus (Requirements) _________ _________ _______ Inc (Dec) Short-Term Debt _________ _________ _______ Inc (Dec) Long-Term Debt _________ _________ _______ Inc (Dec) Equity***** _________ _________ _______ Total External Financing _________ _________ _______ Cash after Financing _________ _________ _______ Actual Change in Cash _________ _________ _______ ( ) Decline in cash * Net of depreciation Inc Increase ** Other income—other expense ± change in other current Dec Decrease assets/liabilities *** Tax provision ± change in tax refund receivable, income taxes payable and deferred taxes payable **** Previous year’s current maturities of long-term debt ***** Common, preferred, treasury stock only
Central Bank of Iraq 2-22 2006
Credit Risk Workshop - Intermediate
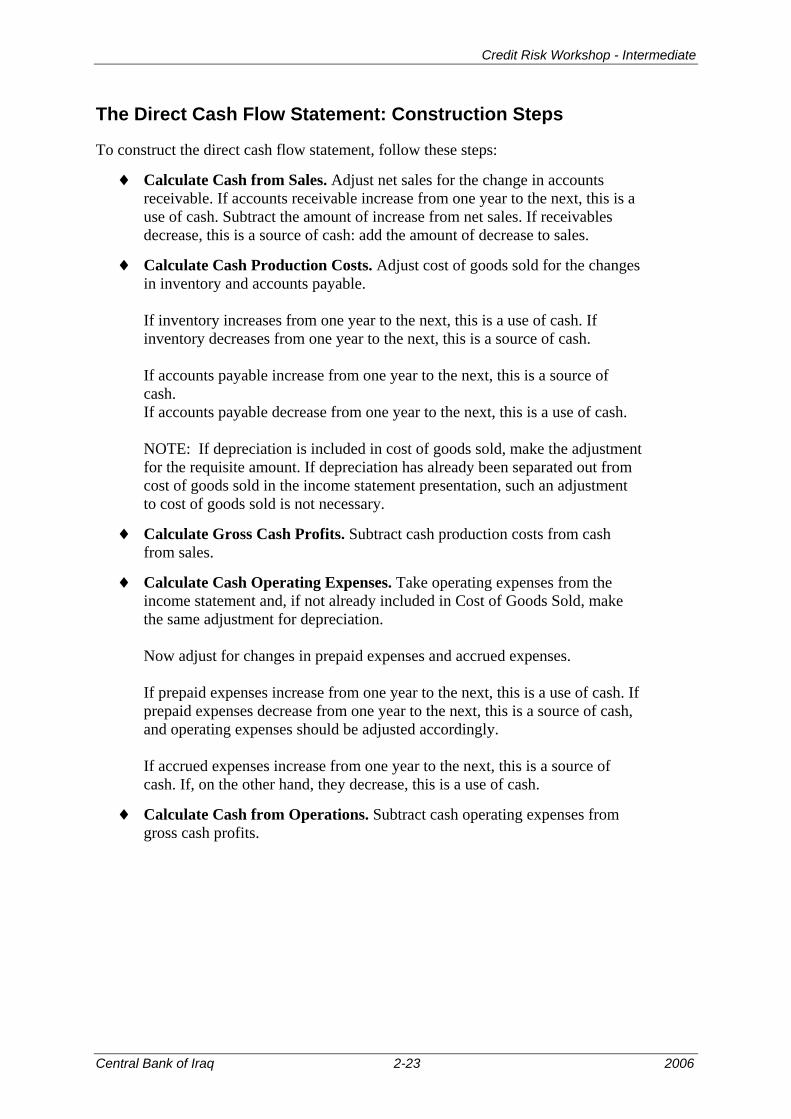
The Direct Cash Flow Statement: Construction Steps
To construct the direct cash flow statement, follow these steps:
♦ Calculate Cash from Sales. Adjust net sales for the change in accounts receivable. If accounts receivable increase from one year to the next, this is a use of cash. Subtract the amount of increase from net sales. If receivables decrease, this is a source of cash: add the amount of decrease to sales.
♦ Calculate Cash Production Costs. Adjust cost of goods sold for the changes in inventory and accounts payable. If inventory increases from one year to the next, this is a use of cash. If inventory decreases from one year to the next, this is a source of cash. If accounts payable increase from one year to the next, this is a source of cash. If accounts payable decrease from one year to the next, this is a use of cash. NOTE: If depreciation is included in cost of goods sold, make the adjustment for the requisite amount. If depreciation has already been separated out from cost of goods sold in the income statement presentation, such an adjustment to cost of goods sold is not necessary.
♦ Calculate Gross Cash Profits. Subtract cash production costs from cash from sales.
♦ Calculate Cash Operating Expenses. Take operating expenses from the income statement and, if not already included in Cost of Goods Sold, make the same adjustment for depreciation. Now adjust for changes in prepaid expenses and accrued expenses. If prepaid expenses increase from one year to the next, this is a use of cash. If prepaid expenses decrease from one year to the next, this is a source of cash, and operating expenses should be adjusted accordingly. If accrued expenses increase from one year to the next, this is a source of cash. If, on the other hand, they decrease, this is a use of cash.
♦ Calculate Cash from Operations. Subtract cash operating expenses from gross cash profits.
Central Bank of Iraq 2-23 2006
Credit Risk Workshop - Intermediate
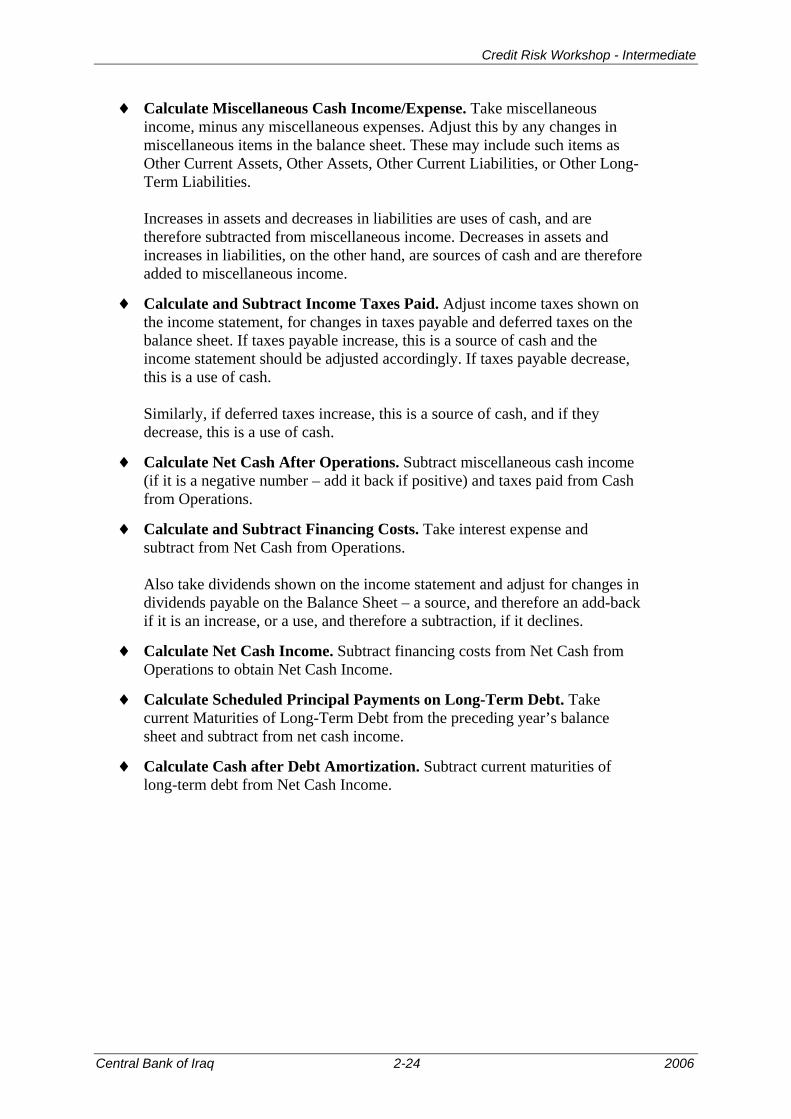
♦ Calculate Miscellaneous Cash Income/Expense. Take miscellaneous income, minus any miscellaneous expenses. Adjust this by any changes in miscellaneous items in the balance sheet. These may include such items as Other Current Assets, Other Assets, Other Current Liabilities, or Other Long-Term Liabilities. Increases in assets and decreases in liabilities are uses of cash, and are therefore subtracted from miscellaneous income. Decreases in assets and increases in liabilities, on the other hand, are sources of cash and are therefore added to miscellaneous income.
♦ Calculate and Subtract Income Taxes Paid. Adjust income taxes shown on the income statement, for changes in taxes payable and deferred taxes on the balance sheet. If taxes payable increase, this is a source of cash and the income statement should be adjusted accordingly. If taxes payable decrease, this is a use of cash. Similarly, if deferred taxes increase, this is a source of cash, and if they decrease, this is a use of cash.
♦ Calculate Net Cash After Operations. Subtract miscellaneous cash income (if it is a negative number – add it back if positive) and taxes paid from Cash from Operations.
♦ Calculate and Subtract Financing Costs. Take interest expense and subtract from Net Cash from Operations. Also take dividends shown on the income statement and adjust for changes in dividends payable on the Balance Sheet – a source, and therefore an add-back if it is an increase, or a use, and therefore a subtraction, if it declines.
♦ Calculate Net Cash Income. Subtract financing costs from Net Cash from Operations to obtain Net Cash Income.
♦ Calculate Scheduled Principal Payments on Long-Term Debt. Take current Maturities of Long-Term Debt from the preceding year’s balance sheet and subtract from net cash income.
♦ Calculate Cash after Debt Amortization. Subtract current maturities of long-term debt from Net Cash Income.
Central Bank of Iraq 2-24 2006
Credit Risk Workshop - Intermediate
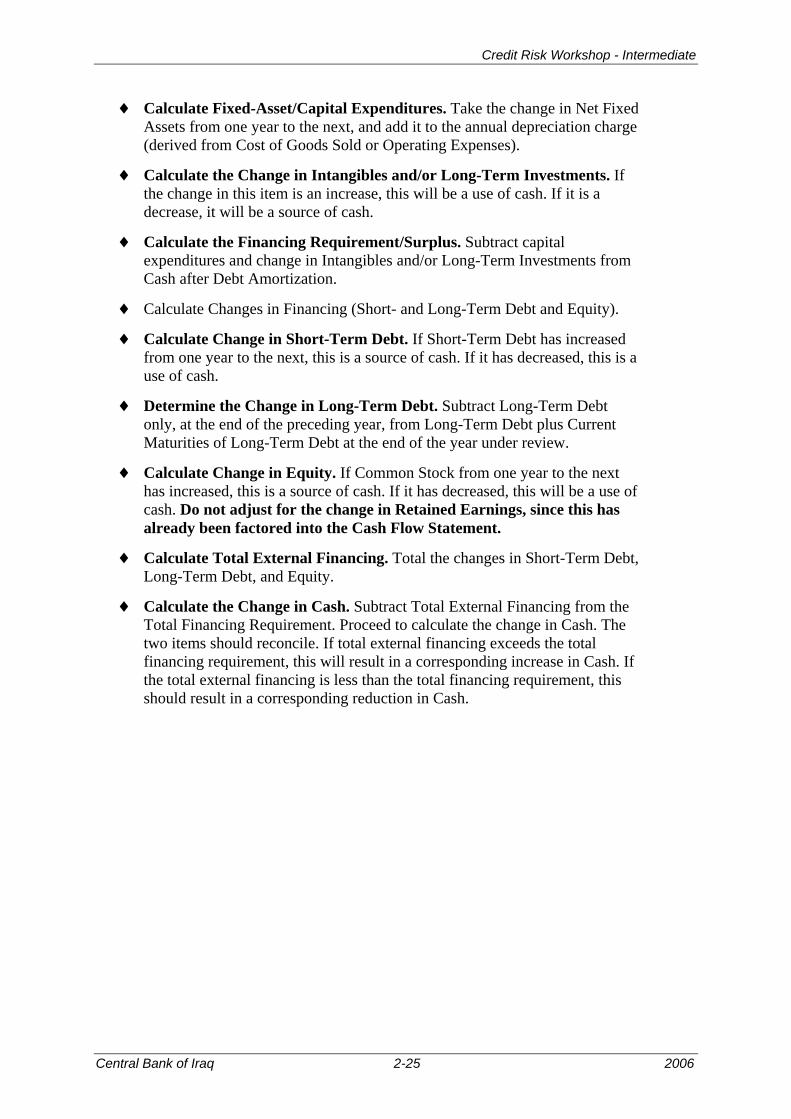
♦ Calculate Fixed-Asset/Capital Expenditures. Take the change in Net Fixed Assets from one year to the next, and add it to the annual depreciation charge (derived from Cost of Goods Sold or Operating Expenses).
♦ Calculate the Change in Intangibles and/or Long-Term Investments. If the change in this item is an increase, this will be a use of cash. If it is a decrease, it will be a source of cash.
♦ Calculate the Financing Requirement/Surplus. Subtract capital expenditures and change in Intangibles and/or Long-Term Investments from Cash after Debt Amortization.
♦ Calculate Changes in Financing (Short- and Long-Term Debt and Equity).
♦ Calculate Change in Short-Term Debt. If Short-Term Debt has increased from one year to the next, this is a source of cash. If it has decreased, this is a use of cash.
♦ Determine the Change in Long-Term Debt. Subtract Long-Term Debt only, at the end of the preceding year, from Long-Term Debt plus Current Maturities of Long-Term Debt at the end of the year under review.
♦ Calculate Change in Equity. If Common Stock from one year to the next has increased, this is a source of cash. If it has decreased, this will be a use of cash. Do not adjust for the change in Retained Earnings, since this has already been factored into the Cash Flow Statement.
♦ Calculate Total External Financing. Total the changes in Short-Term Debt, Long-Term Debt, and Equity.
♦ Calculate the Change in Cash. Subtract Total External Financing from the Total Financing Requirement. Proceed to calculate the change in Cash. The two items should reconcile. If total external financing exceeds the total financing requirement, this will result in a corresponding increase in Cash. If the total external financing is less than the total financing requirement, this should result in a corresponding reduction in Cash.
Central Bank of Iraq 2-25 2006
Credit Risk Workshop - Intermediate
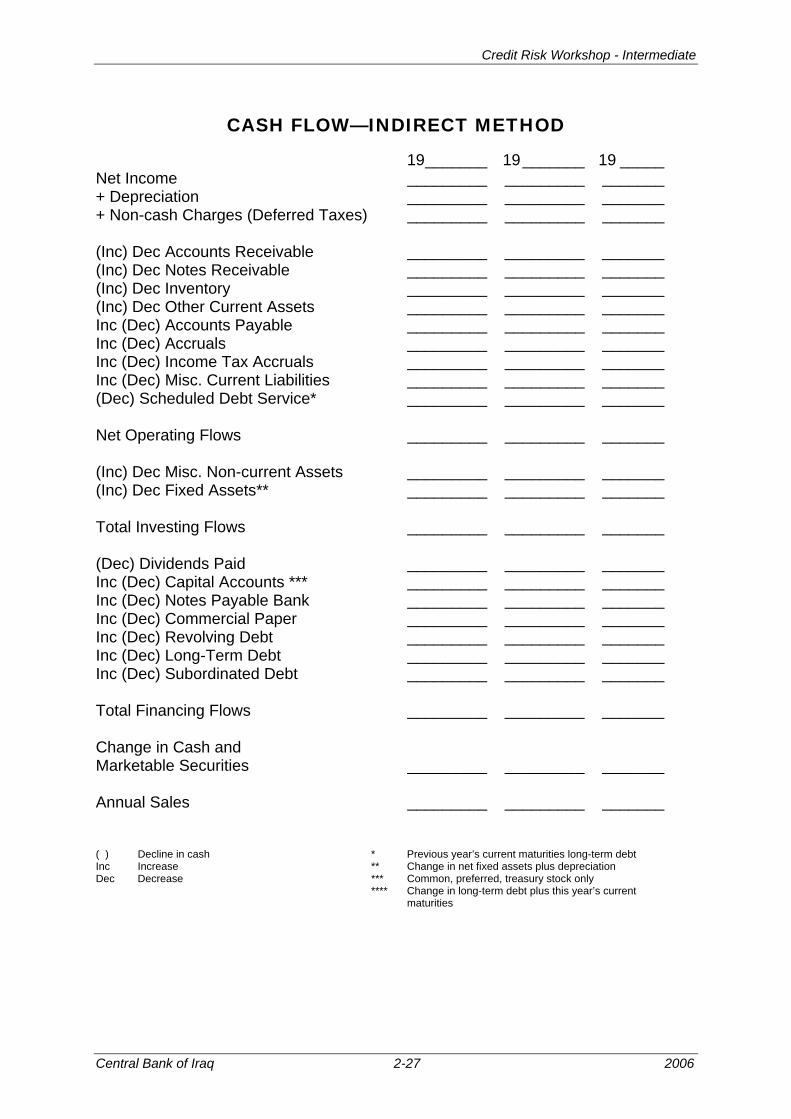
As noted previously, the most important result is cash from operations. This result informs the credit analyst/officer whether or not the borrower generates positive cash flow over time from its basic business operations. For your information, the following page contains the indirect cash flow statement. Note immediately that depreciation is NOT a source of cash. Here, the most important item is net operating flows.
Central Bank of Iraq 2-26 2006
Credit Risk Workshop - Intermediate
CASH FLOW—INDIRECT METHOD
19_______ 19_______ 19 _____ Net Income _________ _________ _______ + Depreciation _________ _________ _______ + Non-cash Charges (Deferred Taxes) _________ _________ _______ (Inc) Dec Accounts Receivable _________ _________ _______ (Inc) Dec Notes Receivable _________ _________ _______ (Inc) Dec Inventory _________ _________ _______ (Inc) Dec Other Current Assets _________ _________ _______ Inc (Dec) Accounts Payable _________ _________ _______ Inc (Dec) Accruals _________ _________ _______ Inc (Dec) Income Tax Accruals _________ _________ _______ Inc (Dec) Misc. Current Liabilities _________ _________ _______ (Dec) Scheduled Debt Service* _________ _________ _______ Net Operating Flows _________ _________ _______ (Inc) Dec Misc. Non-current Assets _________ _________ _______ (Inc) Dec Fixed Assets** _________ _________ _______ Total Investing Flows _________ _________ _______ (Dec) Dividends Paid _________ _________ _______ Inc (Dec) Capital Accounts *** _________ _________ _______ Inc (Dec) Notes Payable Bank _________ _________ _______ Inc (Dec) Commercial Paper _________ _________ _______ Inc (Dec) Revolving Debt _________ _________ _______ Inc (Dec) Long-Term Debt _________ _________ _______ Inc (Dec) Subordinated Debt _________ _________ _______ Total Financing Flows _________ _________ _______ Change in Cash and Marketable Securities _________ _________ _______ Annual Sales _________ _________ _______ ( ) Decline in cash * Previous year’s current maturities long-term debt Inc Increase ** Change in net fixed assets plus depreciation Dec Decrease *** Common, preferred, treasury stock only **** Change in long-term debt plus this year’s current maturities
Central Bank of Iraq 2-27 2006

Credit Risk Workshop - Intermediate
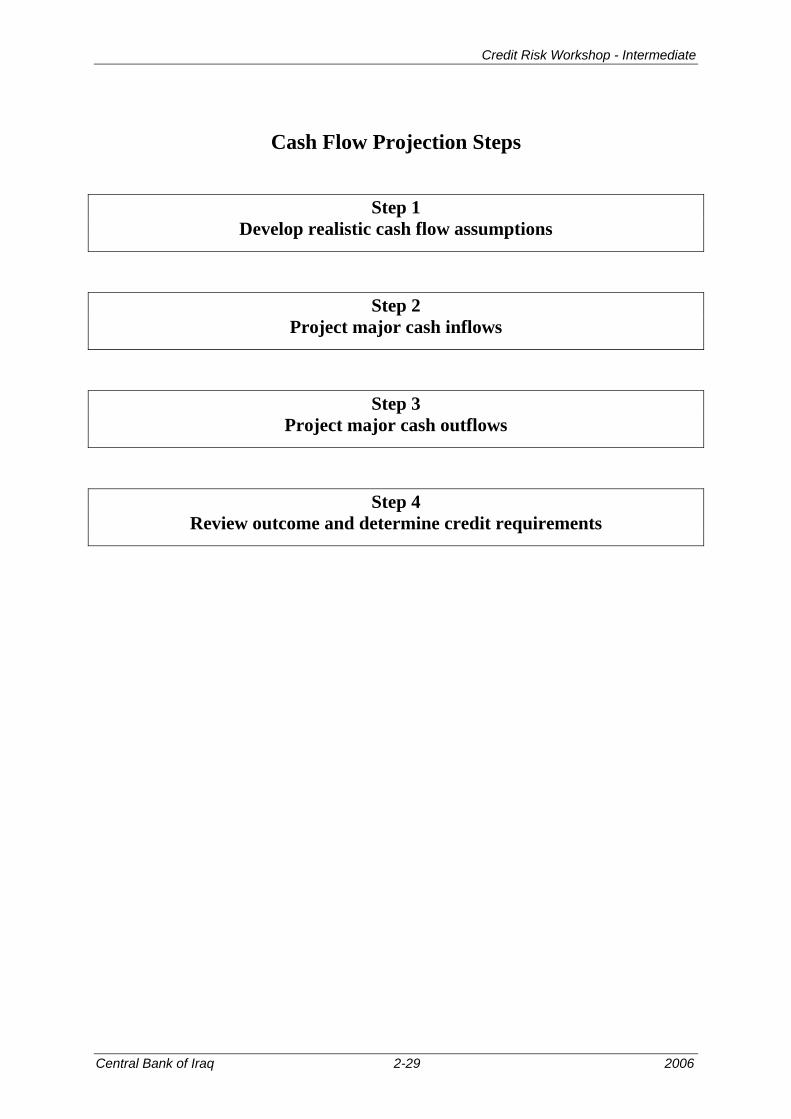
Once the cash flow analysis has been performed, the loan request should be reviewed to confirm that the borrower has generated sufficient cash flow in the past to repay the loan. Second, the credit analyst/officer should develop cash flow projections based on realistic assumptions about the borrower’s activities and identify the real cash requirement. It may or may not match the borrower’s loan amount request. On the following page are the recommended cash flow projection steps.
Central Bank of Iraq 2-28 2006
Credit Risk Workshop - Intermediate
Cash Flow Projection Steps
Step 1
Develop realistic cash flow assumptions
Step 2
Project major cash inflows
Step 3
Project major cash outflows
Step 4
Review outcome and determine credit requirements
Central Bank of Iraq 2-29 2006
Credit Risk Workshop - Intermediate
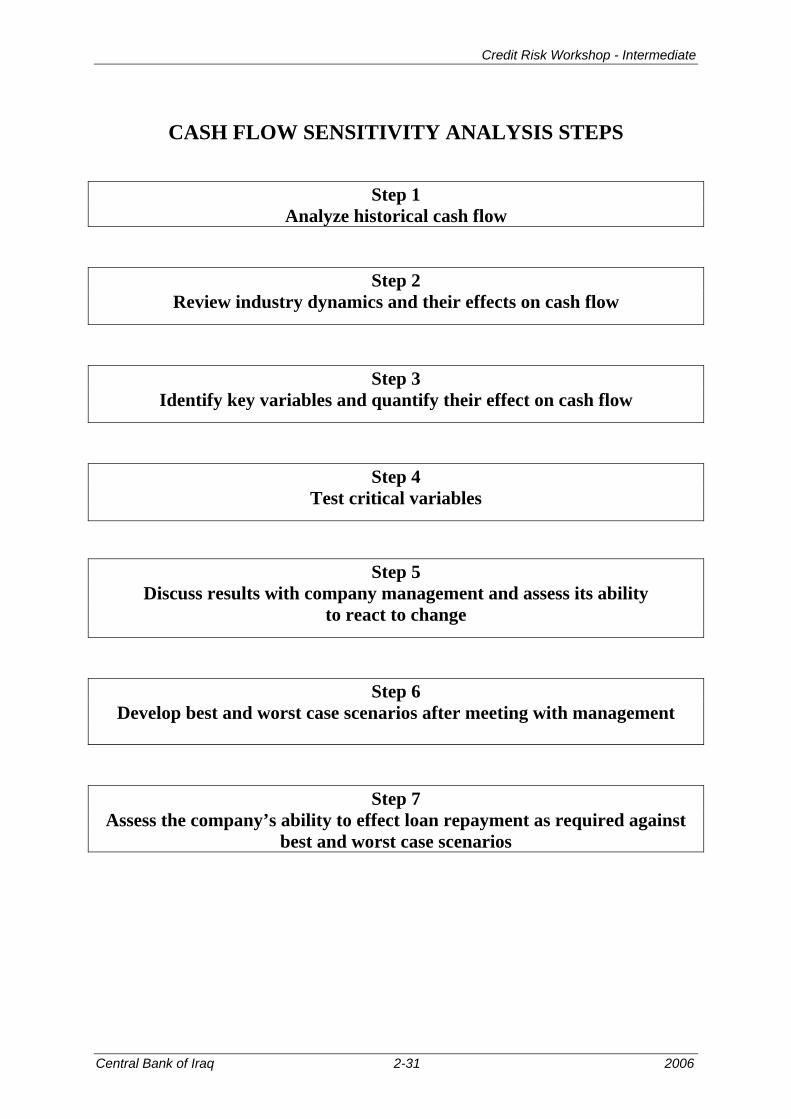
The next step is to conduct sensitivity analysis. Sensitivity analysis tests the potential impact of credit risks on repayment sources. Such analysis is critically important inasmuch as:
♦ Credit analysis focuses on risks and repayment, whereas
♦ Sensitivity analysis identifies particular variables, changes in which help to highlight potential cash flow problems
Sensitivity analysis is therefore fundamental to the credit decision and to the establishment of the appropriate credit structure with its underlying terms and conditions. The cash flow sensitivity analysis steps are shown on the next page.
Central Bank of Iraq 2-30 2006
Credit Risk Workshop - Intermediate
CASH FLOW SENSITIVITY ANALYSIS STEPS
Step 1
Analyze historical cash flow
Step 2
Review industry dynamics and their effects on cash flow
Step 3
Identify key variables and quantify their effect on cash flow
Step 4
Test critical variables
Step 5
Discuss results with company management and assess its ability to react to change
Step 6
Develop best and worst case scenarios after meeting with management
Step 7
Assess the company’s ability to effect loan repayment as required against best and worst case scenarios
Central Bank of Iraq 2-31 2006

Credit Risk Workshop - Intermediate
On the next page is a list of the primary factors that influence cash flow, the cash flow drivers. Note that they are a combination of income statement and balance sheet items. The income statement items reflect revenues, profit margins and expenses, while the balance sheet items reflect turnover of working assets and liabilities. All of these factors can have a significant impact on cash flow.
Central Bank of Iraq 2-32 2006
Credit Risk Workshop - Intermediate
CASH FLOW DRIVERS ♦ Gross margin
♦ Selling/general/administrative expenses
♦ Account receivables in days
♦ Inventory in days
♦ Accounts payable in days
♦ Sales growth
♦ Cost of goods sold growth for inventory
♦ Cost of goods sold growth for accounts payable
Central Bank of Iraq 2-33 2006

Credit Risk Workshop - Intermediate
Exercise: Nazrat Instructions:
1. Complete the Nazrat exercise. Use the handout materials provided. 2. Discuss the exercise results.
Central Bank of Iraq 2-34 2006
Credit Risk Workshop - Intermediate
Summary This module was dedicated to the key components of the credit analysis process, which seeks to determine a borrower’s creditworthiness. The module emphasized analysis of the income statement, balance sheet, relevant ratios, and cash flow statement, and the exercises underscored how the income statement, balance sheet and cash flow statement are tied together. In this module, you learned how to:
♦ Identify best practice credit analysis techniques when reviewing borrower financial statements, and
♦ Evaluate the appropriateness, quality and results of the credit analysis techniques used by the bank in its credit process.
Central Bank of Iraq 2-35 2006