Embed Size (px)
Citation preview
CREDIT-BASED INSURANCE SCORES:
IMPACTS ON CONSUMERS OF AUTOMOBILE INSURANCE
Jesse LearyFederal Trade Commission
Any views expressed are not those of the Federal Trade Commission or any individual Commissioner.
FACT Act of 2003 – Required Study
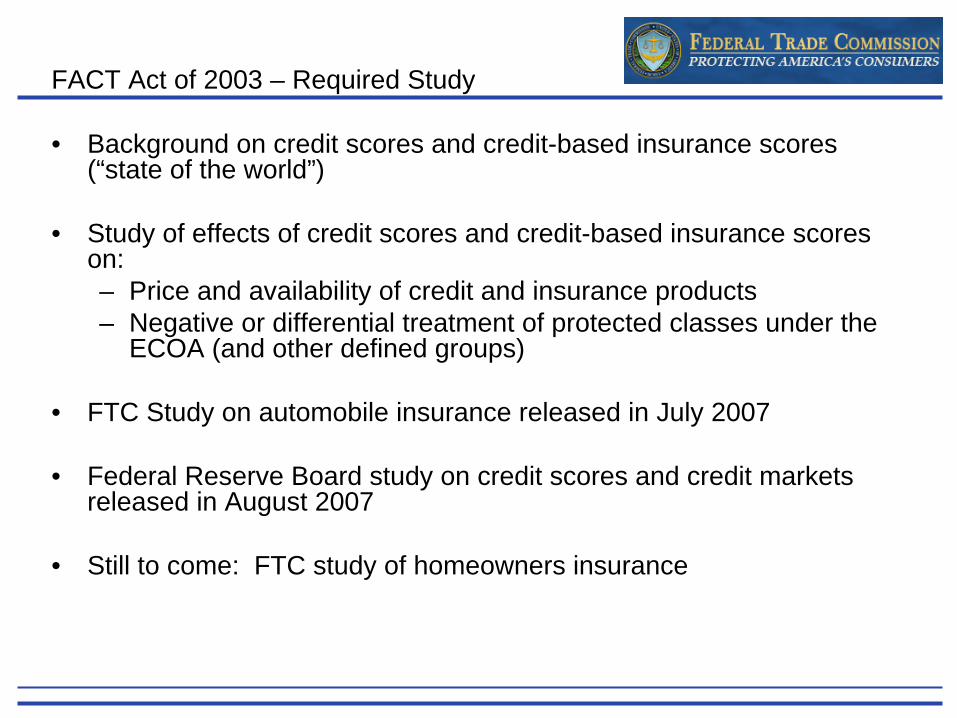
• Background on credit scores and credit-based insurance scores (“state of the world”)
• Study of effects of credit scores and credit-based insurance scores on:– Price and availability of credit and insurance products– Negative or differential treatment of protected classes under the
ECOA (and other defined groups)
• FTC Study on automobile insurance released in July 2007
• Federal Reserve Board study on credit scores and credit markets released in August 2007
• Still to come: FTC study of homeowners insurance

Negative or Differential Treatment (A)
Sec 215 (a)(2): a study of: “the statistical relationship, utilizing a multivariate analysis that controls for prohibited factors under the (ECOA) and other known risk factors, between … credit based insurance scores and the quantifiable risks and actual losses experienced by businesses;”
Sec. 215 (a)(3): a study of “the extent to which, if any, the use of … credit-based insurance scores impact on the availability and affordability of … insurance to the extent information is currently available or is available through proxies, by geography, income, ethnicity, race, color, religion, national origin, age, sex, marital status, and creed, including the extent to which the consideration or lack of consideration of certain factors by credit scoring systems could result in negative or differential treatment of protected classes under the (ECOA), and the extent to which, if any, the use of underwriting systems relying on these models could achieve comparable results through the use of factors with less negative impact;”
Negative or Differential Treatment (B)
Data
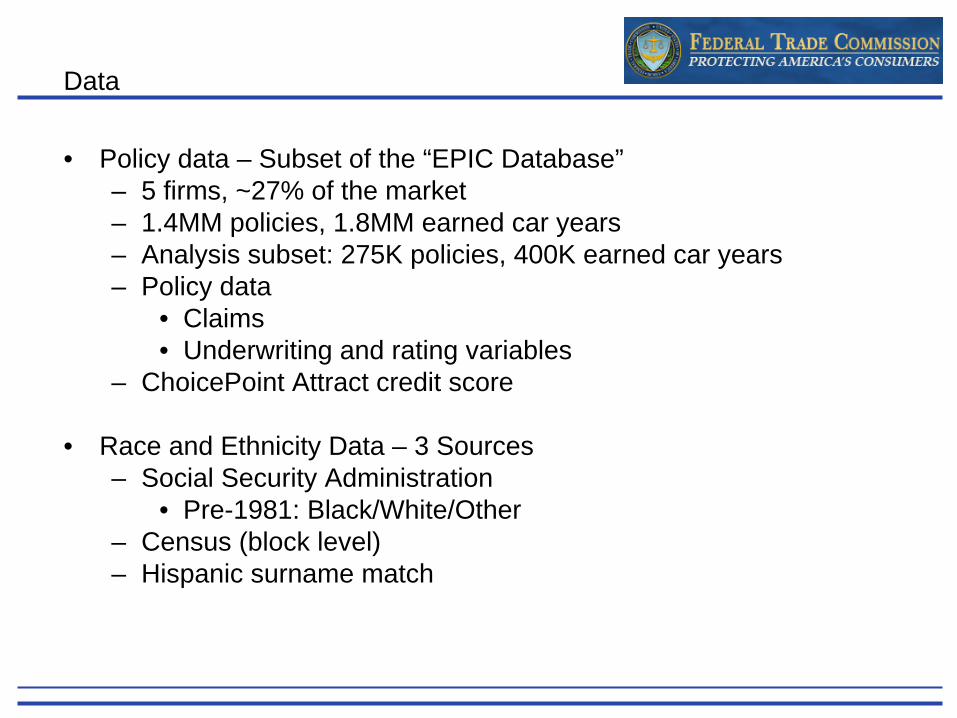
• Policy data – Subset of the “EPIC Database”– 5 firms, ~27% of the market– 1.4MM policies, 1.8MM earned car years– Analysis subset: 275K policies, 400K earned car years– Policy data
• Claims• Underwriting and rating variables
– ChoicePoint Attract credit score
• Race and Ethnicity Data – 3 Sources– Social Security Administration
• Pre-1981: Black/White/Other– Census (block level)– Hispanic surname match

Frequency and Severity of Claims by Credit-Based Insurance Score
Frequency of Claims
Average Severity of Claims
Property Damage Liability Coverage
0.8
1.2
1.6
2.0
2.4
2.8
1LowestScores
10HighestScores
Deciles of ChoicePointCredit-Based Insurance Score
Relative Frequency or Severity
Bodily InjuryLiability Coverage
0.8
1.2
1.6
2.0
2.4
2.8
1LowestScores
10HighestScores
Deciles of ChoicePointCredit-Based Insurance Score
Relative Frequency or Severity
CollisionCoverage
0.8
1.2
1.6
2.0
2.4
2.8
1LowestScores
10HighestScores
Deciles of ChoicePointCredit-Based Insurance Score
Relative Frequency or Severity
ComprehensiveCoverage
0.8
1.2
1.6
2.0
2.4
2.8
1LowestScores
10HighestScores
Deciles of ChoicePointCredit-Based Insurance Score
Relative Frequencyor Severity
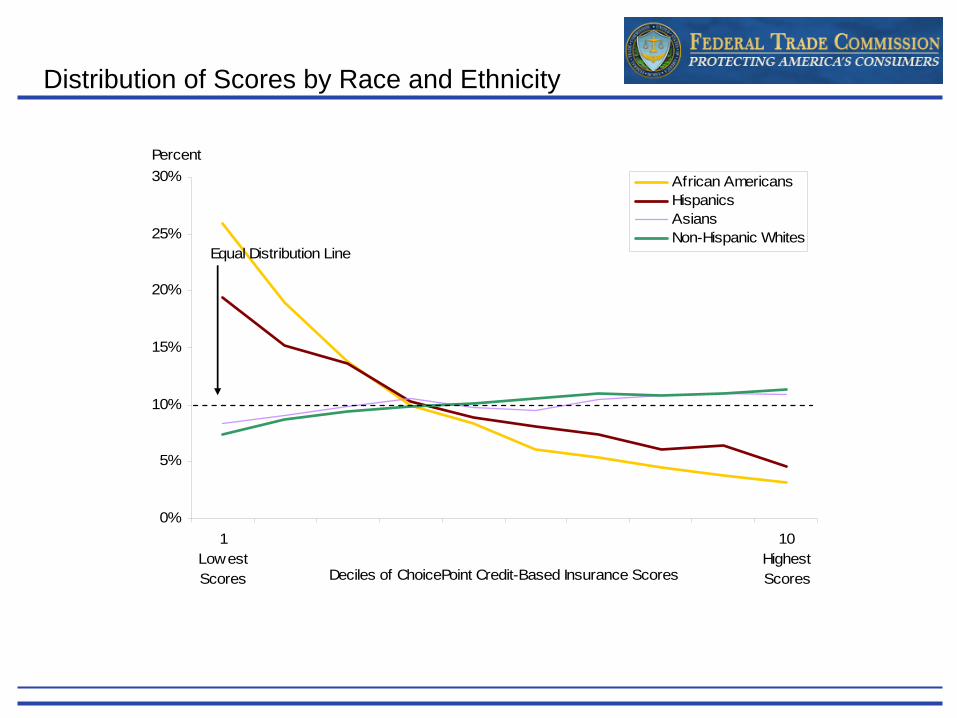
0%
5%
10%
15%
20%
25%
30%
1LowestScores
10HighestScoresDeciles of ChoicePoint Credit-Based Insurance Scores
Percent
African AmericansHispanicsAsiansNon-Hispanic Whites
Equal Distribution Line
Distribution of Scores by Race and Ethnicity
0%
5%
10%
15%
20%
25%
30%
1LowestScores
10HighestScores
Deciles of ChoicePointCredit-Based Insurance Scores
Percent
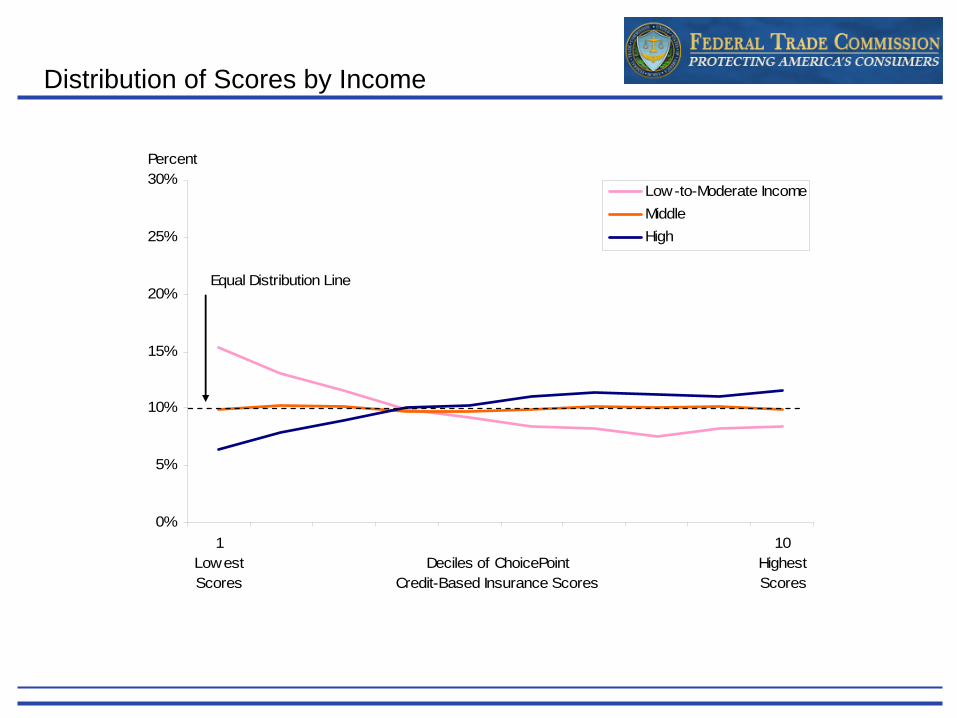
Low-to-Moderate IncomeMiddleHigh
Equal Distribution Line
Distribution of Scores by Income

Distribution of Scores by Race and Ethnicity Controlling for Age, Gender, and Neighborhood Income
With ControlsWithout Controls
Non-Hispanic Whites
0%
5%
10%
15%
20%
25%
30%
1LowestScores
Deciles of ChoicePointCredit-Based Insurance Scores
Percent African Americans
0%
5%
10%
15%
20%
25%
30%
1LowestScores
Deciles of ChoicePointCredit-Based Insurance Scores
Percent
Hispanics
0%
5%
10%
15%
20%
25%
30%
1LowestScores
Deciles of ChoicePointCredit-Based Insurance Scores
Percent Asians
0%
5%
10%
15%
20%
25%
30%
1LowestScores
Deciles of ChoicePointCredit-Based Insurance Scores
Percent
10HighestScores
10HighestScores
10HighestScores
10HighestScores
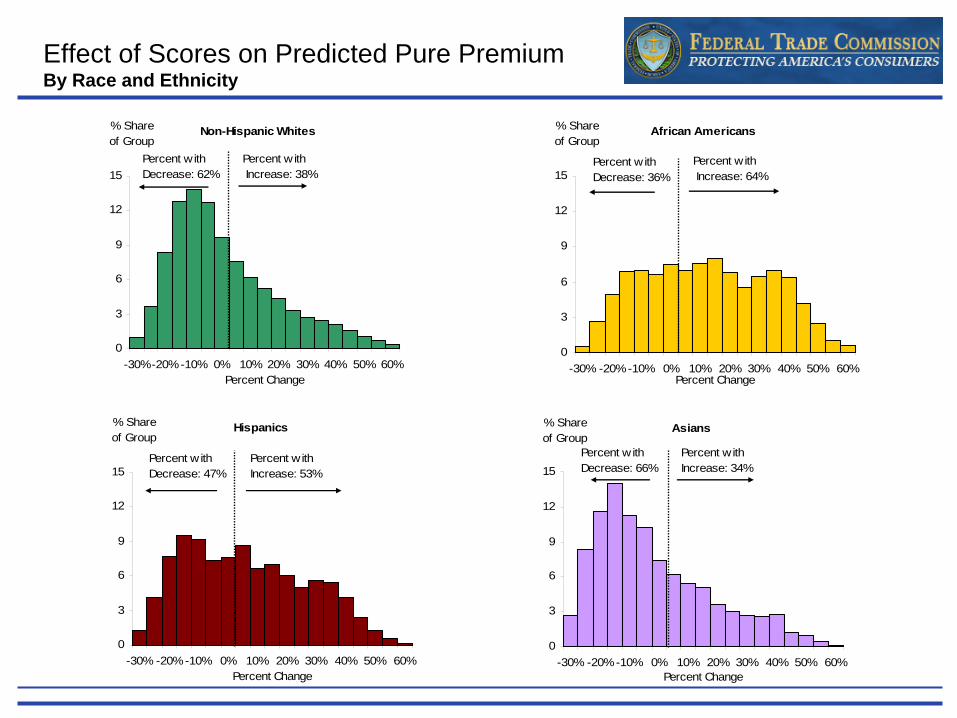
Effect of Scores on Predicted Pure Premium By Race and Ethnicity
Non-Hispanic Whites
0
3
6
9
12
15
-30%-20%-10% 0% 10% 20% 30% 40% 50% 60%Percent Change
% Share of Group
Percent with Decrease: 62%
Percent w ith Increase: 38%
African Americans
0
3
6
9
12
15
-30% -20%-10% 0% 10% 20% 30% 40% 50% 60%Percent Change
% Share of Group
Percent w ith Decrease: 36%
Percent withIncrease: 64%
Hispanics
0
3
6
9
12
15
-30% -20%-10% 0% 10% 20% 30% 40% 50% 60%Percent Change
% Share of Group
Percent w ith Decrease: 47%
Percent withIncrease: 53%
Asians
0
3
6
9
12
15
-30% -20%-10% 0% 10% 20% 30% 40% 50% 60%Percent Change
% Share of Group
Percent w ith Decrease: 66%
Percent withIncrease: 34%
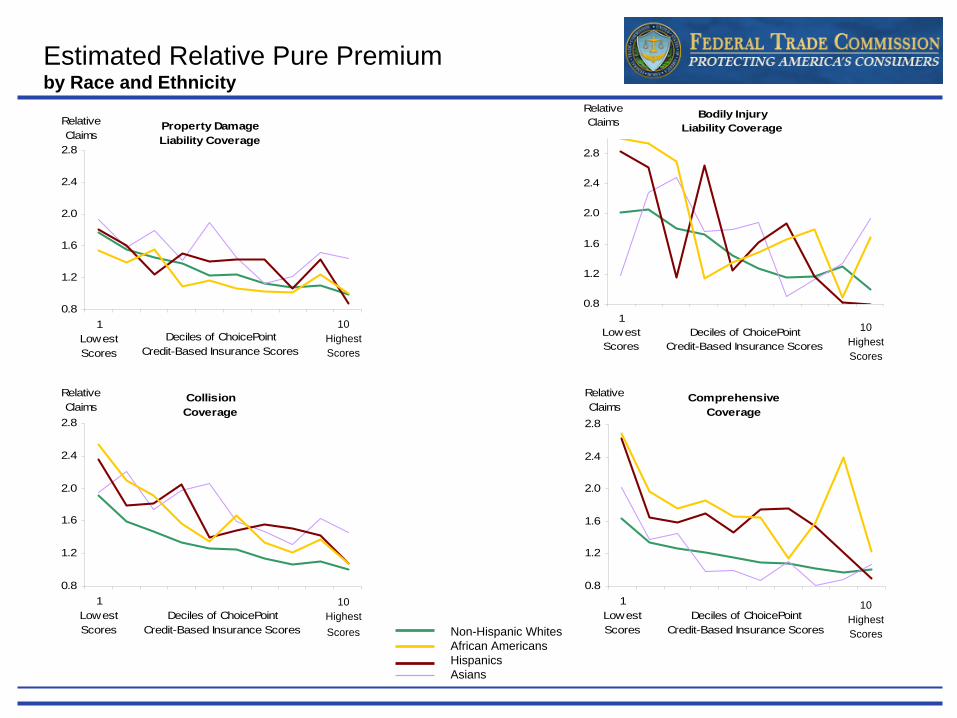
Estimated Relative Pure Premium by Race and Ethnicity
Property Damage Liability Coverage
0.8
1.2
1.6
2.0
2.4
2.8
1LowestScores
Deciles of ChoicePointCredit-Based Insurance Scores
Relative Claims
Bodily InjuryLiability Coverage
0.8
1.2
1.6
2.0
2.4
2.8
1LowestScores
Deciles of ChoicePointCredit-Based Insurance Scores
Relative Claims
CollisionCoverage
0.8
1.2
1.6
2.0
2.4
2.8
1LowestScores
Deciles of ChoicePointCredit-Based Insurance Scores
Relative Claims
ComprehensiveCoverage
0.8
1.2
1.6
2.0
2.4
2.8
1LowestScores
Deciles of ChoicePointCredit-Based Insurance Scores
Relative Claims
Non-Hispanic WhitesAfrican AmericansHispanicsAsians
10HighestScores
10HighestScores
10HighestScores
10HighestScores
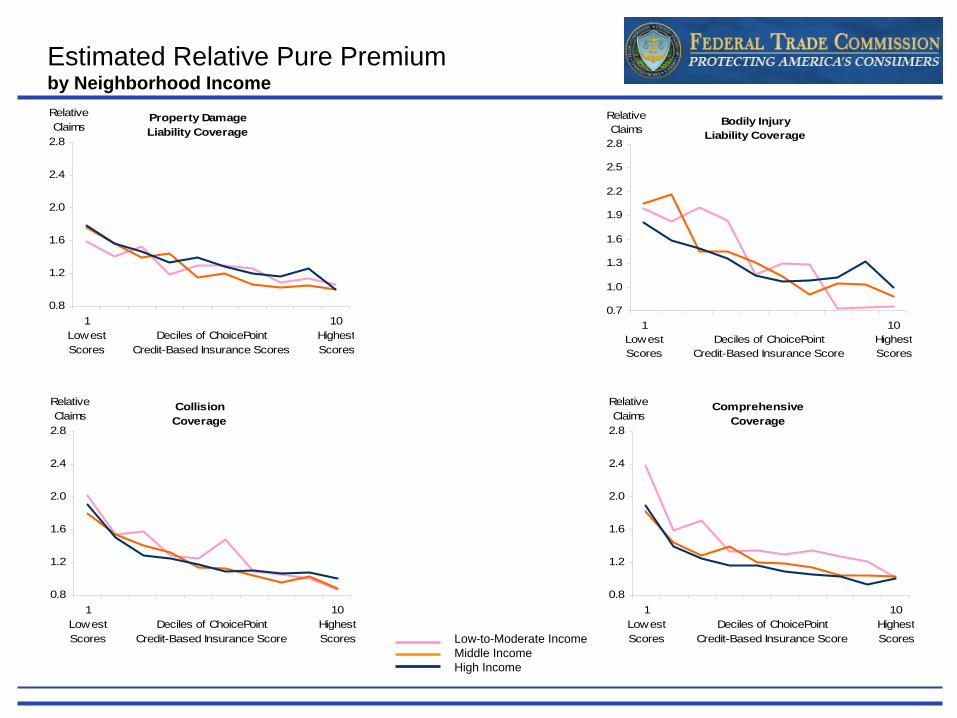
Estimated Relative Pure Premium by Neighborhood Income
Property DamageLiability Coverage
0.8
1.2
1.6
2.0
2.4
2.8
1LowestScores
10HighestScores
Deciles of ChoicePointCredit-Based Insurance Scores
Relative Claims Bodily Injury
Liability Coverage
0.7
1.0
1.3
1.6
1.9
2.2
2.5
2.8
1LowestScores
10HighestScores
Deciles of ChoicePointCredit-Based Insurance Score
Relative Claims
CollisionCoverage
0.8
1.2
1.6
2.0
2.4
2.8
1LowestScores
10HighestScores
Deciles of ChoicePointCredit-Based Insurance Score
Relative Claims
ComprehensiveCoverage
0.8
1.2
1.6
2.0
2.4
2.8
1LowestScores
10HighestScores
Deciles of ChoicePointCredit-Based Insurance Score
Relative Claims
Low-to-Moderate IncomeMiddle IncomeHigh Income

Estimated Relative Pure Premium With Controls for Race, Ethnicity, and Income
Property DamageLiability Coverage
0.8
1.2
1.6
2.0
2.4
2.8
1LowestScores
10HighestScores
Deciles of ChoicePointCredit-Based Insurance Scores
Relative Claims
Bodily InjuryLiability Coverage
0.8
1.2
1.6
2.0
2.4
2.8
1LowestScores
10HighestScores
Deciles of ChoicePointCredit-Based Insurance Scores
Relative Claims
CollisionCoverage
0.8
1.2
1.6
2.0
2.4
2.8
1LowestScores
10HighestScores
Deciles of ChoicePointCredit-Based Insurance Scores
Relative Claims
ComprehensiveCoverage
0.8
1.2
1.6
2.0
2.4
2.8
1LowestScores
10HighestScores
Deciles of ChoicePointCredit-Based Insurance Scores
Relative Claims
Without Race, Ethnicity and Neighborhood Income ControlsWith Race, Ethnicity and Neighborhood Income Controls
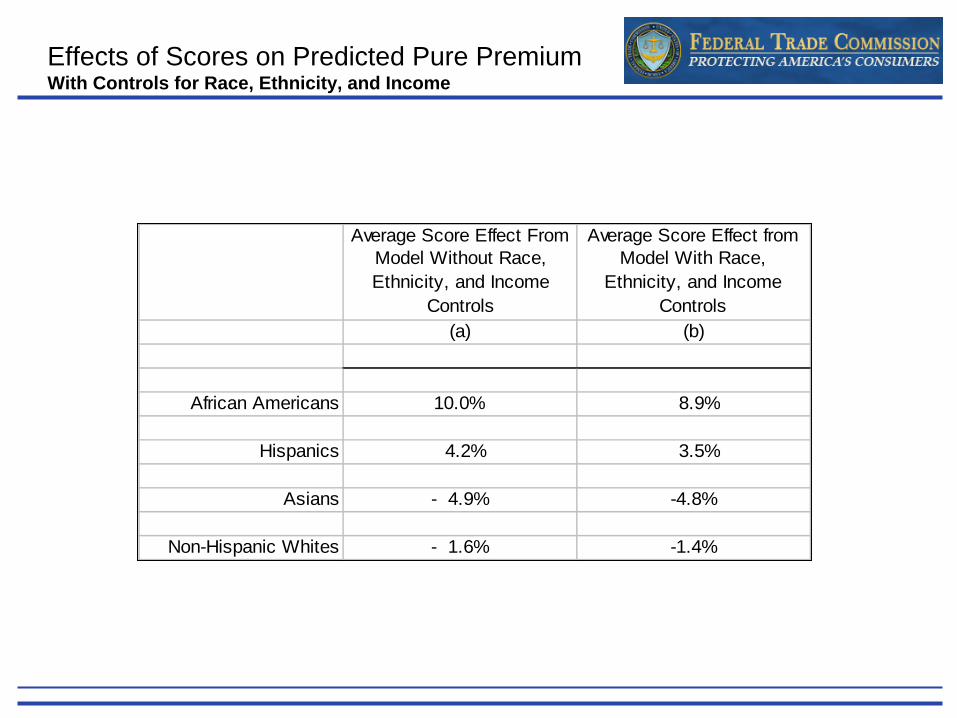
Effects of Scores on Predicted Pure Premium With Controls for Race, Ethnicity, and Income
Average Score Effect From Model Without Race, Ethnicity, and Income
Controls
Average Score Effect from Model With Race,
Ethnicity, and Income Controls
(a) (b)
African Americans 10.0% 8.9%
Hispanics 4.2% 3.5%
Asians - 4.9% -4.8%
Non-Hispanic Whites - 1.6% -1.4%
FTC Score-Building - Data
• Policy database with race, ethnicity, income
• ChoicePoint credit-history variables– Have for all records except “no-hits”– 180 variables designed to capture information in consumer credit
reports• Various delinquency measures• Public records• Inquiries• Length of history• etc.
– Used by ChoicePoint in their model building– Not all variables appear in a ChoicePoint model– Proprietary
FTC Score-Building
• Step 1: Tweedie GLM of pure premium on “usual suspects” risk variables. Use predicted pure premium to create adjusted pure premium.
• Step 2: Bin credit history variables using a mechanical (non- judgmental) procedure.
• Step 3: Forward-selection OLS with adjusted total claims as dependent variable and 180 binned credit history variables as candidate explanatory variables.
• Step 4: Tweedie GLM of pure premiums on “usual suspects” risk variables and “winning” credit history variables. Use estimated parameters on credit history variables to create FTC scorecard.

FTC Baseline Scoring Model
Property DamageLiability Coverage
0.8
1.2
1.6
2.0
2.4
2.8
3.2
1LowestScores
10HighestScores
Deciles of FTCCredit-Based Insurance Scores
Relative Claims
CollisionCoverage
0.8
1.2
1.6
2.0
2.4
2.8
3.2
1LowestScores
10HighestScores
Deciles of FTCCredit-Based Insurance Scores
Relative Claims
ComprehensiveCoverage
0.8
1.2
1.6
2.0
2.4
2.8
3.2
1LowestScores
10HighestScores
Deciles of FTCCredit-Based Insurance Scores
Relative Claims
Bodily Injury Liability Coverage
0.8
1.2
1.6
2.0
2.4
2.8
3.2
3.6
4.0
1LowestScores
10HighestScores
Deciles of FTC Credit-Based Insurance Scores
Relative Claims
Within Sample with ControlsWithin Sample without ControlsOut of Sample without Controls

Distribution of FTC Baseline-Model Scores by Race and Ethnicity
0%
5%
10%
15%
20%
25%
30%
1LowestScores
10HighestScores
Deciles of FTC Credit-BasedInsurance Scores
Percent African AmericansHispanicsAsiansNon-Hispanic Whites
Equal Distribution Line
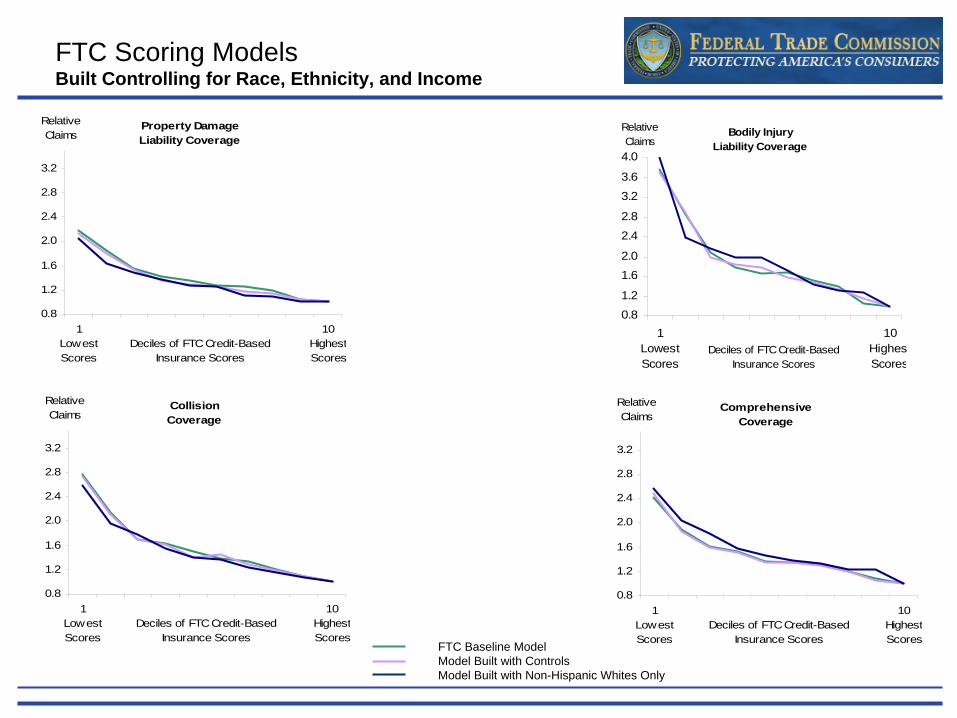
FTC Scoring Models Built Controlling for Race, Ethnicity, and Income
Property DamageLiability Coverage
0.8
1.2
1.6
2.0
2.4
2.8
3.2
1LowestScores
10HighestScores
Deciles of FTC Credit-BasedInsurance Scores
Relative Claims Bodily Injury
Liability Coverage
0.8
1.2
1.62.0
2.4
2.8
3.2
3.6
4.0
1LowestScores
10HighesScores
Deciles of FTC Credit-BasedInsurance Scores
Relative Claims
CollisionCoverage
0.8
1.2
1.6
2.0
2.4
2.8
3.2
1LowestScores
10HighestScores
Deciles of FTC Credit-BasedInsurance Scores
Relative Claims
ComprehensiveCoverage
0.8
1.2
1.6
2.0
2.4
2.8
3.2
1LowestScores
10HighestScores
Deciles of FTC Credit-BasedInsurance Scores
Relative Claims
FTC Baseline ModelModel Built with ControlsModel Built with Non-Hispanic Whites Only
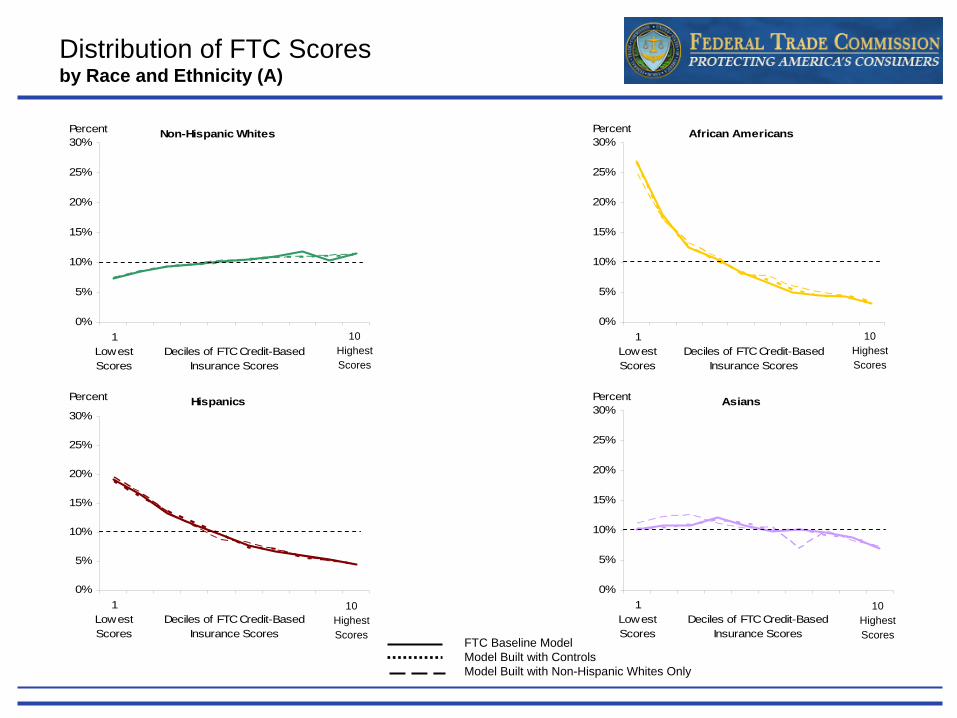
Distribution of FTC Scores by Race and Ethnicity (A)
Non-Hispanic Whites
0%
5%
10%
15%
20%
25%
30%
1LowestScores
Deciles of FTC Credit-BasedInsurance Scores
Percent African Americans
0%
5%
10%
15%
20%
25%
30%
1LowestScores
Deciles of FTC Credit-BasedInsurance Scores
Percent
Hispanics
0%
5%
10%
15%
20%
25%
30%
1LowestScores
Deciles of FTC Credit-BasedInsurance Scores
Percent Asians
0%
5%
10%
15%
20%
25%
30%
1LowestScores
Deciles of FTC Credit-BasedInsurance Scores
Percent
FTC Baseline ModelModel Built with ControlsModel Built with Non-Hispanic Whites Only
10HighestScores
10HighestScores
10HighestScores
10HighestScores
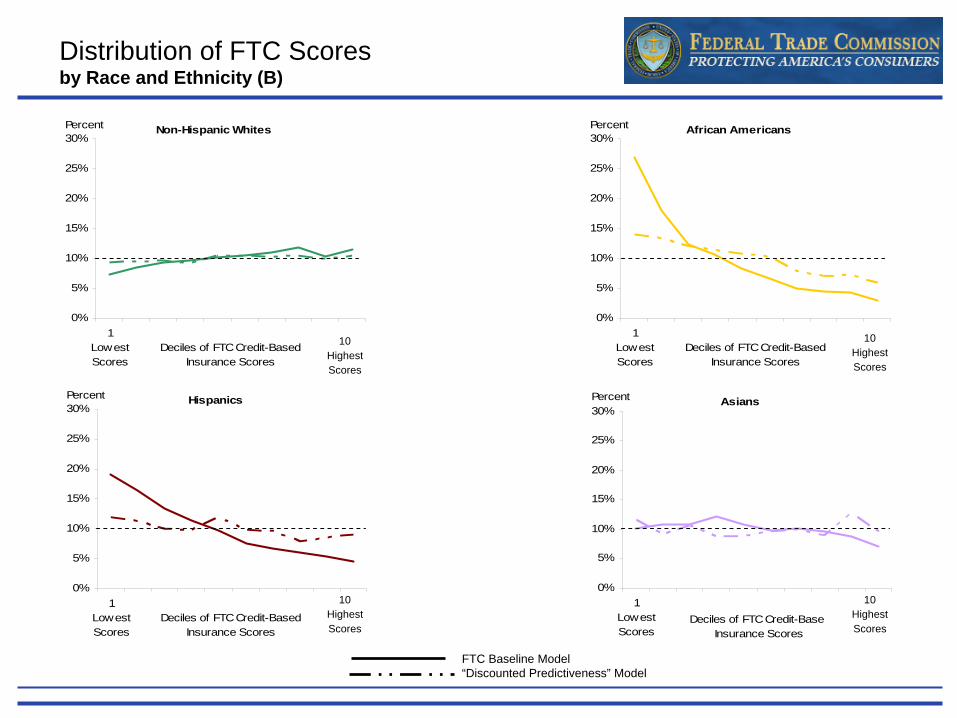
Distribution of FTC Scores by Race and Ethnicity (B)
Non-Hispanic Whites
0%
5%
10%
15%
20%
25%
30%
1LowestScores
Deciles of FTC Credit-BasedInsurance Scores
Percent African Americans
0%
5%
10%
15%
20%
25%
30%
1LowestScores
Deciles of FTC Credit-BasedInsurance Scores
Percent
Hispanics
0%
5%
10%
15%
20%
25%
30%
1LowestScores
Deciles of FTC Credit-BasedInsurance Scores
Percent Asians
0%
5%
10%
15%
20%
25%
30%
1LowestScores
Deciles of FTC Credit-Base Insurance Scores
Percent
FTC Baseline Model“Discounted Predictiveness” Model
10HighestScores
10HighestScores
10HighestScores
10HighestScores

FTC "Discounted Predictiveness" Model
Property DamageLiability Coverage
0.8
1.2
1.6
2.0
2.4
2.8
3.2
1LowestScores
10HighestScores
Deciles of FTC Credit-BasedInsurance Scores
Relative Claims Bodily Injury
Liability Coverage
0.8
1.2
1.62.0
2.4
2.8
3.2
3.6
4.0
1LowestScores
10HighesScores
Deciles of FTC Credit-BasedInsurance Scores
Relative Claims
CollisionCoverage
0.8
1.2
1.6
2.0
2.4
2.8
3.2
1LowestScores
10HighestScores
Deciles of FTC Credit-BasedInsurance Scores
Relative Claims
ComprehensiveCoverage
0.8
1.2
1.6
2.0
2.4
2.8
3.2
1LowestScores
10HighestScores
Deciles of FTC Credit-BasedInsurance Scores
Relative Claims
FTC Baseline Model“Discounted Predictiveness” Model
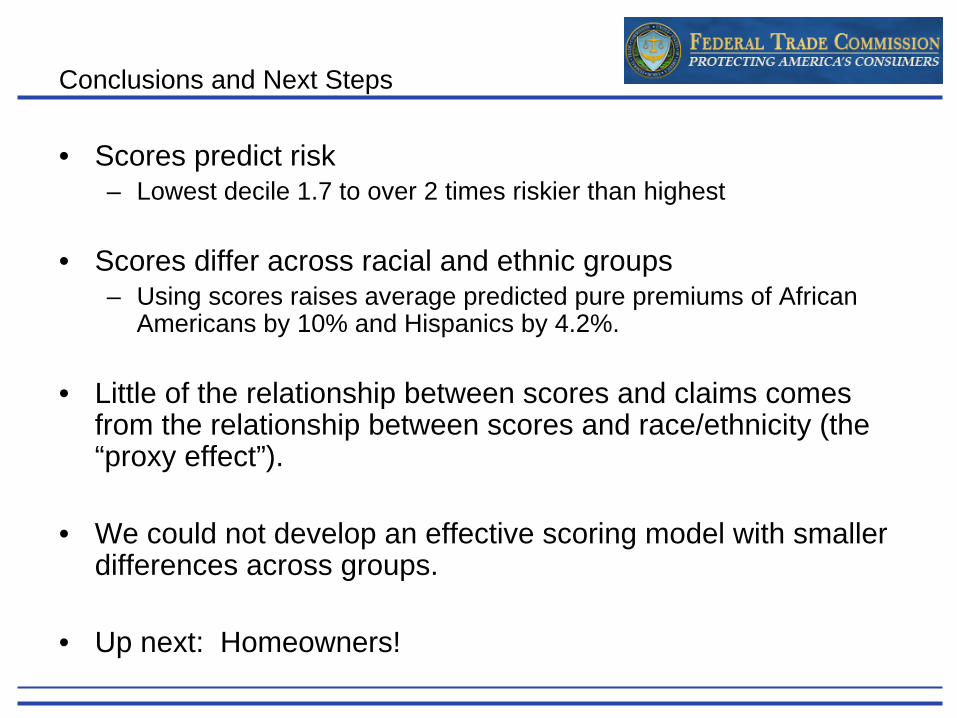
Conclusions and Next Steps
• Scores predict risk– Lowest decile 1.7 to over 2 times riskier than highest
• Scores differ across racial and ethnic groups– Using scores raises average predicted pure premiums of African
Americans by 10% and Hispanics by 4.2%.
• Little of the relationship between scores and claims comes from the relationship between scores and race/ethnicity (the “proxy effect”).
• We could not develop an effective scoring model with smaller differences across groups.
• Up next: Homeowners!