Embed Size (px)
Citation preview

Credit Boom: the Good, the Bad, Credit Boom: the Good, the Bad,
and the Uglyand the Ugly
Adolfo Barajas (Adolfo Barajas (IMFIMF))
Giovanni Giovanni DellDell’’AricciaAriccia ((IMFIMF and and CEPRCEPR))
Andrei Andrei LevchenkoLevchenko (University of Michigan)(University of Michigan)
The views expressed in this presentation are those of the author and do not necessarily
represent those of the IMF.

Financial development, growth, and crisesFinancial development, growth, and crises
�� Financial deepeningFinancial deepening both cause and effect of economic both cause and effect of economic growth (growth (RajanRajan and and ZingalesZingales, 1998). , 1998).
�� However, periods of However, periods of too fasttoo fast credit growth, credit growth, ““lending lending boomsbooms,,”” have been associated with crises in both have been associated with crises in both emerging market and emerging market and advanced economiesadvanced economies
�� Yet, only a few of booms end up in crises and evidence Yet, only a few of booms end up in crises and evidence suggests they suggests they contributecontribute to financial deepeningto financial deepening
�� Objective of this paper:Objective of this paper:�� Find a way to identify dangerous boomsFind a way to identify dangerous booms
�� Investigate potential benefits of Investigate potential benefits of ““goodgood”” booms [to be done]booms [to be done]

Paper Part of Larger Agenda at the FundPaper Part of Larger Agenda at the Fund
�� Several papers on related issues are work in progress at Several papers on related issues are work in progress at the the IMFIMF
�� Study on cyclical properties of booms, looking at both Study on cyclical properties of booms, looking at both macro and micro (firm data) variables (Mendoza and macro and micro (firm data) variables (Mendoza and TerronesTerrones))
�� Paper looking at bank probability of default during Paper looking at bank probability of default during booms (booms (DetragiacheDetragiache, , IganIgan, , TamirisaTamirisa))
�� Work on U.S. subWork on U.S. sub--prime mortgage crisis: a sectoral prime mortgage crisis: a sectoral credit boom gone bad (credit boom gone bad (DellDell’’AricciaAriccia, , IganIgan, , LaevenLaeven))

Credit Booms and Crises: TheoryCredit Booms and Crises: Theory
�� ““Financial acceleratorsFinancial accelerators”” ((KyiotakiKyiotaki and Moore, and Moore, JPEJPE 1997): an 1997): an increase in value of increase in value of collateralizablecollateralizable goods releases credit goods releases credit constraints. Boom fuels further wealth effects etc. Negative constraints. Boom fuels further wealth effects etc. Negative shocks inverts cycle, leaving banking system overexposed. shocks inverts cycle, leaving banking system overexposed.
�� ““Institutional memoryInstitutional memory”” (Berger and (Berger and UdellUdell, , JFIJFI 2004): in periods 2004): in periods of fast credit expansion difficult for banks to recruit enough of fast credit expansion difficult for banks to recruit enough experienced loan officers (especially if there has not been a experienced loan officers (especially if there has not been a crisis for a while). This leads to a deterioration of loan crisis for a while). This leads to a deterioration of loan portfolios.portfolios.
�� Lending booms and credit standardsLending booms and credit standards ((DellDell’’AricciaAriccia and Marquez, and Marquez, JFJF2006): during expansions, adverse selection is less severe and 2006): during expansions, adverse selection is less severe and banks find it optimal to trade quality for market share, banks find it optimal to trade quality for market share, increasing crisis probability. increasing crisis probability.

Credit Booms and Crises: EvidenceCredit Booms and Crises: Evidence
�� Positive, but weak, link between rapid credit growth and Positive, but weak, link between rapid credit growth and
crises: crises: CaprioCaprio and and KlingebielKlingebiel (199(19966), ), DemirgDemirgüçüç--KuntKunt and and
DetragiacheDetragiache (1997), (1997), KaminskyKaminsky and Reinhart (1999).and Reinhart (1999).
�� GourinchasGourinchas et al. (2001): some association between booms et al. (2001): some association between booms
and crises. Many crises preceded by booms, but only some and crises. Many crises preceded by booms, but only some
booms followed by crises. Mendoza and booms followed by crises. Mendoza and TerronesTerrones ((WEOWEO
2004): most episodes of extreme credit growth are associated 2004): most episodes of extreme credit growth are associated
with crises. with crises.
�� However, financial deepening also associated with economic However, financial deepening also associated with economic
growth (Levine, growth (Levine, LoayzaLoayza and Beck, 2000, and Beck, 2000, RajanRajan and and ZingalesZingales, ,
1998)1998)
�� Can we tell Can we tell ““GoodGood”” booms from booms from ““BadBad”” ones?ones?
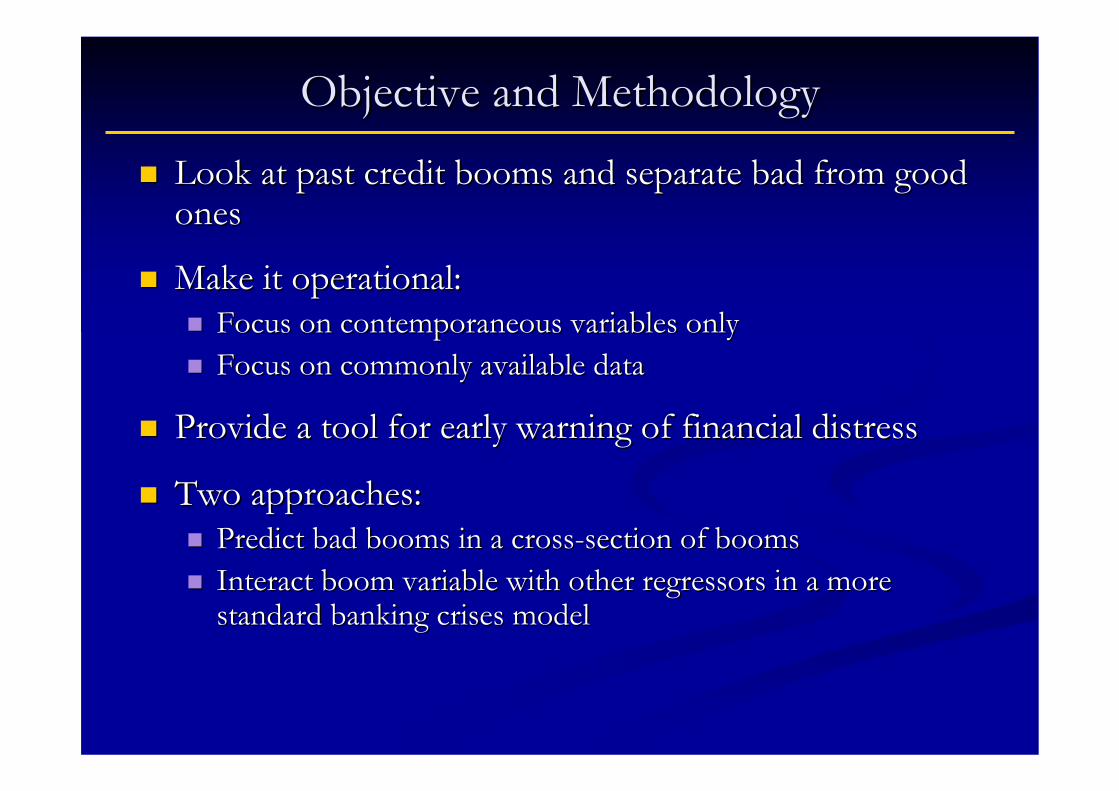
�� Look at past credit booms and separate bad from good Look at past credit booms and separate bad from good onesones
�� Make it operational: Make it operational: �� Focus on contemporaneous variables onlyFocus on contemporaneous variables only
�� Focus on commonly available dataFocus on commonly available data
�� Provide a tool for early warning of financial distressProvide a tool for early warning of financial distress
�� Two approaches:Two approaches:�� Predict bad booms in a crossPredict bad booms in a cross--section of boomssection of booms
�� Interact boom variable with other Interact boom variable with other regressorsregressors in a more in a more standard banking crises modelstandard banking crises model
Objective and MethodologyObjective and Methodology

�� Periods of significantly faster than normal credit growthPeriods of significantly faster than normal credit growth
�� Typically measured relative to GDP to control for inflation Typically measured relative to GDP to control for inflation and economic growth. Mendoza and and economic growth. Mendoza and TerronesTerrones (2004) use (2004) use real credit growthreal credit growth
�� Definition should be to some extent country specific and Definition should be to some extent country specific and path dependent...path dependent...�� Speed and volatility of credit varies across country/timeSpeed and volatility of credit varies across country/time
�� ...but standard enough to allow for cross...but standard enough to allow for cross--country comparisoncountry comparison
�� Link to crises: define a boom as Link to crises: define a boom as ““badbad”” if crisis follows within if crisis follows within two years from its endtwo years from its end
How to define lending boomsHow to define lending booms

How to define lending boomsHow to define lending booms
�� CreditCredit--toto--GDP ratio is typically trended.GDP ratio is typically trended.
�� Approximate its evolution with a rolling nonApproximate its evolution with a rolling non--linear trend linear trend ((GourinchasGourinchas et al., 2001).et al., 2001).
�� Compute rolling standard deviation of deviations from trend. Compute rolling standard deviation of deviations from trend. Allow for country/path dependent patterns (Mendoza & Allow for country/path dependent patterns (Mendoza & TerronesTerrones, 2004)., 2004).
�� Focus on both growth and level of creditFocus on both growth and level of credit--toto--GDP ratio.GDP ratio.
�� ““Lending boomLending boom”” needs to meet needs to meet eithereither of these conditions:of these conditions:�� deviation from trend > 1.5 times SD & growth of creditdeviation from trend > 1.5 times SD & growth of credit--toto--GDP GDP
ratio > 10%.ratio > 10%.
�� growth of creditgrowth of credit--toto--GDP ratio > 20%.GDP ratio > 20%.
�� Alternative definition: growth of creditAlternative definition: growth of credit--toto--GDP ratio > 10%.GDP ratio > 10%.

Bad boom: Finland 1980sBad boom: Finland 1980s
4060
8010
0C
redi
t to
GD
P r
atio
/Tre
nd/b
oom
year
1970 1980 1990 2000year
Cr edit to GDP ratio Trend
boomyear

Good boom: Ireland 1990sGood boom: Ireland 1990s
2040
6080
100
120
Cre
dit t
o G
DP
rat
io/T
rend
/boo
mye
ar
1970 1980 1990 2000year
Credit to GDP ratio Trend
boomyear

DatasetDataset
�� Try to keep to variables that are available cross Try to keep to variables that are available cross
country:country:
�� Credit to the private sector (IFS)Credit to the private sector (IFS)
�� Correct for breaks in the seriesCorrect for breaks in the series
�� Banking crisis data from Banking crisis data from CaprioCaprio et. al (2003)et. al (2003)
�� Control variables from WB and IFSControl variables from WB and IFS
�� AbiadAbiad--ModyMody dataset on financial sector liberalizationdataset on financial sector liberalization
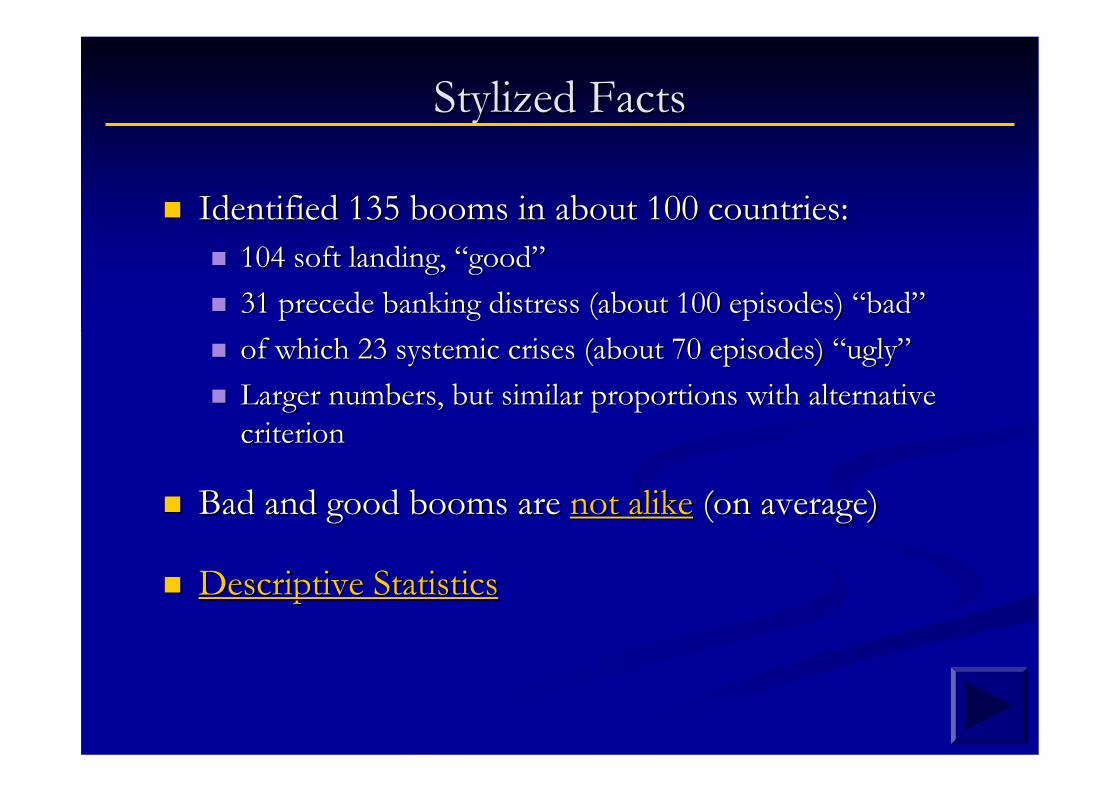
Stylized FactsStylized Facts
�� Identified 135 booms in about 100 countries:Identified 135 booms in about 100 countries:
�� 104 soft landing, 104 soft landing, ““goodgood””
�� 31 precede banking distress (about 100 episodes) 31 precede banking distress (about 100 episodes) ““badbad””
�� of which 23 systemic crises (about 70 episodes) of which 23 systemic crises (about 70 episodes) ““uglyugly””
�� Larger numbers, but similar proportions with alternative Larger numbers, but similar proportions with alternative
criterioncriterion
�� Bad and good booms are Bad and good booms are not alikenot alike (on average)(on average)
�� Descriptive StatisticsDescriptive Statistics

Boom Characteristics MatterBoom Characteristics Matter0
.2.4
.6.8
1m
ean
of
ba
da
ll_fr
eq
1 2 3 4 5 6 7 8 90
.2.4
.6.8
1m
ean
of
ba
da
ll_fr
eq_a
vg_
ab
s1-4 5-8 9-12 Over 13

Bad and Good booms: Descriptive StatsBad and Good booms: Descriptive Stats
SubSub--sample of 79 booms for which all the data is available, and inflsample of 79 booms for which all the data is available, and inflation < 100% ation < 100%
0.430.430.620.62Openness (trade/GDP)Openness (trade/GDP)
0.310.311.031.03Supervisory IndexSupervisory Index
5.15.12.92.9DurationDuration
4.24.24.04.0ΔΔCreditCredit/GDP/GDP
38.438.429.729.7Credit/GDPCredit/GDP
$6350$6350$5675$5675GDP per capitaGDP per capita
--3.03.0--2.92.9CA/GDPCA/GDP
5.45.46.76.7GDP growthGDP growth
19.019.011.911.9InflationInflation
BadBadGoodGood

Results So FarResults So Far
�� LogitLogit regressions indicate that bad booms:regressions indicate that bad booms:�� Are largerAre larger
�� Last longerLast longer
�� Are associated with higher inflation ratesAre associated with higher inflation rates
�� Occur in less open economiesOccur in less open economies
�� Are accompanied by weaker bank supervisionAre accompanied by weaker bank supervision
�� Are accompanied by lower growth (weak significance)Are accompanied by lower growth (weak significance)
�� Are accompanied by larger CA deficits (weaker significance)Are accompanied by larger CA deficits (weaker significance)
�� Coefficients are fairly consistent across boom Coefficients are fairly consistent across boom definitions. definitions.
�� Effects are Effects are economically relevanteconomically relevant::�� 1 year in duration increases crisis probability by 4 percent1 year in duration increases crisis probability by 4 percent

Effects are Economically RelevantEffects are Economically Relevant
Dependent variable: Probability of a crisis to occur within two years form the boom
Base criterionCredit-to-GDP growth over 10
percent
HP filter over entire sample
Duration 0.04* 0.03** 0.06
Size 0.05** 0.05*** 0.06**
Inflation 0.004*** 0.004*** 0.004
Growth (GDP percapita) -1.01** -0.53 -0.61
Current Account Balance 1.05 0.71 1.40
Openness -0.26 -0.18 -0.31
Quality of Supervision -0.24*** -0.22*** -0.41
Episodes of hyperinflation (over 100 percent a year average) are excluded.
Table 3. Marginal Effects

A Few Words of Caution...A Few Words of Caution...
�� While model seems stable across boom definitions, While model seems stable across boom definitions, its fit is not particularly good (Pseudo Rits fit is not particularly good (Pseudo R22: 0.2: 0.2--0.4)0.4)
�� This is to be expected in models of crisesThis is to be expected in models of crises
�� Yet, caution granted when using for forecastingYet, caution granted when using for forecasting
�� Also, some results are not fully consistent across modelsAlso, some results are not fully consistent across models
�� Causality issues should be carefully considered Causality issues should be carefully considered before using results for policy analysisbefore using results for policy analysis
�� Regressions in this paper reflect associations, not Regressions in this paper reflect associations, not necessarily causal linkagesnecessarily causal linkages
�� Comparative Comparative staticsstatics may not applymay not apply

To do...To do...
�� Refine Refine logitlogit regressions:regressions:�� Include additional regulatory and structural variablesInclude additional regulatory and structural variables
�� Improve data coverageImprove data coverage
�� Try alternative models for panel approachTry alternative models for panel approach
�� Duration model?Duration model?
�� Consider policy response:Consider policy response:�� Are there policies that reduce the Are there policies that reduce the likelyhoodlikelyhood of bad booms?of bad booms?
�� Need to expand datasetNeed to expand dataset
�� Investigate potential benefits of Investigate potential benefits of ““goodgood”” boomsbooms

050
100
150
(mea
n) c
ps_g
dp
0 5000 10000 15000 20000 25000(mean) gdp_pc_ppp
Financial intermediation and growthFinancial intermediation and growth

-5
05
1015
Cha
nge
in D
elin
quen
cy R
ate
2004
-200
6 (in
per
cent
)
0 5 10 15 20Growth of Loan Origination Volume 2000-2004 (in percent)
Subprime Crisis: A Credit Boom Gone Bad?Subprime Crisis: A Credit Boom Gone Bad?
MSA level data

Credit Booms and Financial Deepening Credit Booms and Financial Deepening (1985(1985--2004)2004)
U ni ted States
United K ingdom
Aus tria
Bel g ium
D en markFran ce
G ermanyI ta ly
N etherlands
Norw ay
Sw eden
Switzerland
Canada
Ja pa n
F in land
G reece
Ire land
PortugalSpain
Turk ey
Aus tra liaNew Z ea la nd
South A fric a
Argentina
Bolivia
B raz il
C hi leC olombia
C osta R icaD omin ic an R epublic
Ecuador El Sa lvadorG uatem alaHait i
Honduras
M exic o
Nic aragua Panama
ParaguayPeru
U rug ua yVenezuela, Re p. Bol.
Gu yana
J amaic aTrin idad an d Tobago
Bahra in , K ingdom of
Iran, I.R. o f
Israe l
Jo rda n
Kuwait
Saudi A rab ia
EgyptBanglades h
My anmar
S ri Lanka
Ind iaIndones ia
Korea
M alays iaPak istan
Phi li pp in es
S ingapore
T hailand
A lgeria
Botsw anaBurundi
Cam eroon
C entra l A fric an Re p.
Chad
Congo, R epublic o fBenin
E thi op ia
Ga bo nG amb ia , T he
C ôte d 'I vo ire
Kenya
Les otho
LibyaM adagasc arMalaw i
M ali
Maurit ius
Moroc co
N ig erNigeria
Zim babwe
Senegal
Swazil an dTogo
T unisia
Burk ina F asoZ ambiaF ij i
Papua New G uinea
China,P .R .: Main la nd
Hungary
PolandR om ania
-50
05
01
00C
hna
ge
in C
redi
t-to
-GD
P R
atio
(in
per
cent
)
0 50 100 1 50C um ulate d C h an ge in C re di t- to-G D P R atio D ur ing B oo m s ( in perc en t)

Booms and Crises
050
100
150
cps_
gdp
1960 1970 1980 1990 2000year
020
4060
cps_
gdp
1960 1970 1980 1990 2000year
2040
6080
100
cps_
gdp
1960 1970 1980 1990 2000year
1020
3040
50cp
s_gd
p
1960 1970 1980 1990 2000year
Thailand 1997
Philippines1997
Finland 1991
Chile 1982