Embed Size (px)
Citation preview
Credit Card Transaction Fraud Detection
Niall Adams
Department of MathematicsImperial College London
January 2009
Obligatory contents slide
My objective is to report some of the our recent work on frauddetection, mostly sponsored under the EPSRC ThinkCrimeinitiative.
1. Transaction fraud – problem, process, challenge
2. Supervised and unsupervised approaches (and datamanipulation)
3. Combining methods
4. Streaming approach to handle change
Collaborators: David Hand, Dave Weston, Chris Whitrow, PiotrJuszczak, Dimitris Tasoulis, Christoforos Anagnostopoulos.
Collaborating banks: Abbey National, Alliance and Leicester,Capital One, Lloyds TSB
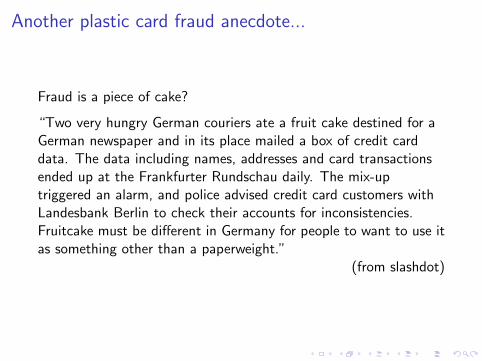
Another plastic card fraud anecdote...
Fraud is a piece of cake?
“Two very hungry German couriers ate a fruit cake destined for aGerman newspaper and in its place mailed a box of credit carddata. The data including names, addresses and card transactionsended up at the Frankfurter Rundschau daily. The mix-uptriggered an alarm, and police advised credit card customers withLandesbank Berlin to check their accounts for inconsistencies.Fruitcake must be different in Germany for people to want to use itas something other than a paperweight.”
(from slashdot)
Transaction fraud
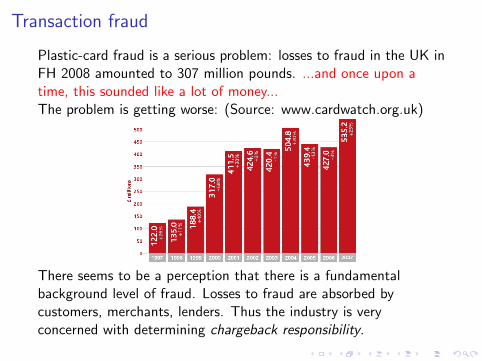
Plastic-card fraud is a serious problem: losses to fraud in the UK inFH 2008 amounted to 307 million pounds. ...and once upon atime, this sounded like a lot of money...The problem is getting worse: (Source: www.cardwatch.org.uk)
There seems to be a perception that there is a fundamentalbackground level of fraud. Losses to fraud are absorbed bycustomers, merchants, lenders. Thus the industry is veryconcerned with determining chargeback responsibility.
Types of fraud
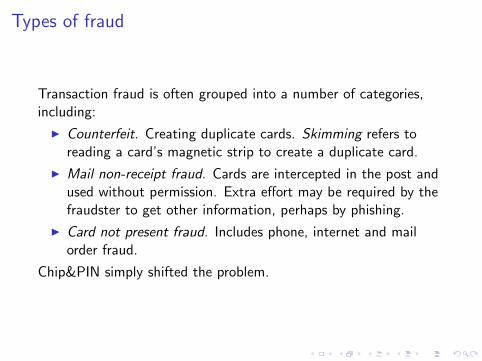
Transaction fraud is often grouped into a number of categories,including:
I Counterfeit. Creating duplicate cards. Skimming refers toreading a card’s magnetic strip to create a duplicate card.
I Mail non-receipt fraud. Cards are intercepted in the post andused without permission. Extra effort may be required by thefraudster to get other information, perhaps by phishing.
I Card not present fraud. Includes phone, internet and mailorder fraud.
Chip&PIN simply shifted the problem.
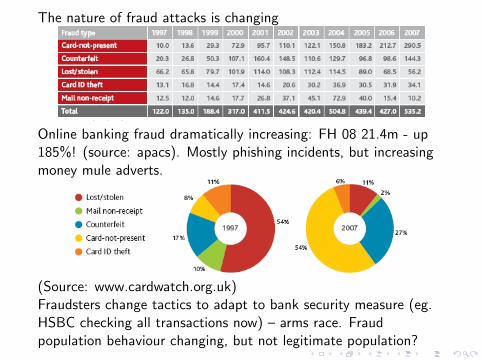
The nature of fraud attacks is changing
Online banking fraud dramatically increasing: FH 08 21.4m - up185%! (source: apacs). Mostly phishing incidents, but increasingmoney mule adverts.
(Source: www.cardwatch.org.uk)Fraudsters change tactics to adapt to bank security measure (eg.HSBC checking all transactions now) – arms race. Fraudpopulation behaviour changing, but not legitimate population?
Transaction stream
Plastic card transaction processing uses a very complicated ISinfrastructure (eg. Visa Europe processes 6000 transactions asecond) to connect banks and merchants.Processing requirements include
I Speed
I fraud filtering while minimizing false positives
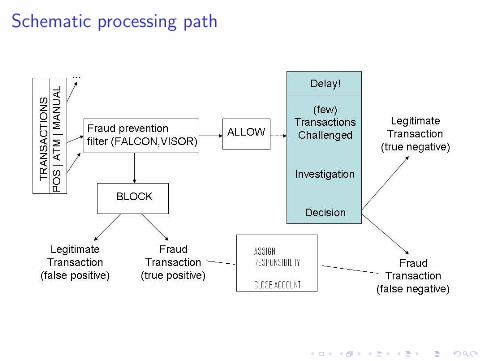
Schematic processing path
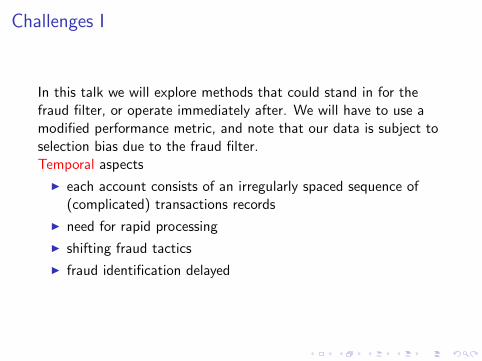
Challenges I
In this talk we will explore methods that could stand in for thefraud filter, or operate immediately after. We will have to use amodified performance metric, and note that our data is subject toselection bias due to the fraud filter.Temporal aspects
I each account consists of an irregularly spaced sequence of(complicated) transactions records
I need for rapid processing
I shifting fraud tactics
I fraud identification delayed
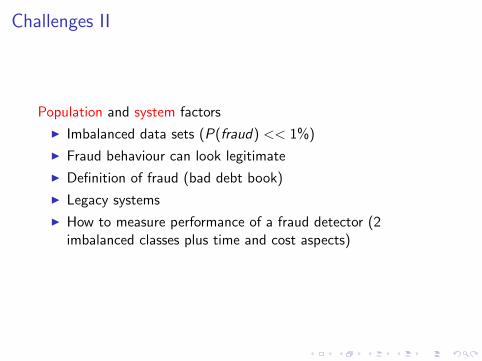
Challenges II
Population and system factors
I Imbalanced data sets (P(fraud) << 1%)
I Fraud behaviour can look legitimate
I Definition of fraud (bad debt book)
I Legacy systems
I How to measure performance of a fraud detector (2imbalanced classes plus time and cost aspects)
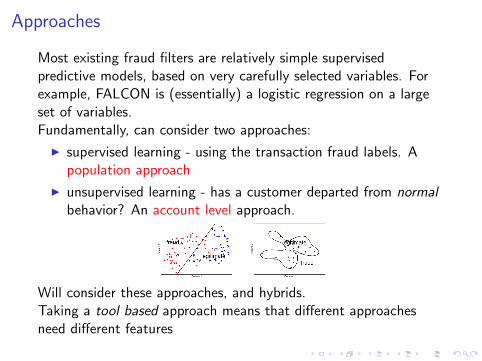
Approaches
Most existing fraud filters are relatively simple supervisedpredictive models, based on very carefully selected variables. Forexample, FALCON is (essentially) a logistic regression on a largeset of variables.Fundamentally, can consider two approaches:
I supervised learning - using the transaction fraud labels. Apopulation approach
I unsupervised learning - has a customer departed from normalbehavior? An account level approach.
Will consider these approaches, and hybrids.Taking a tool based approach means that different approachesneed different features
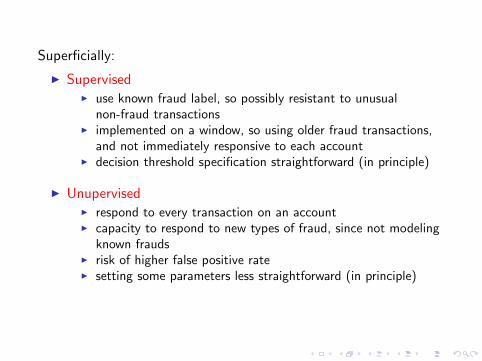
Superficially:
I SupervisedI use known fraud label, so possibly resistant to unusual
non-fraud transactionsI implemented on a window, so using older fraud transactions,
and not immediately responsive to each accountI decision threshold specification straightforward (in principle)
I UnupervisedI respond to every transaction on an accountI capacity to respond to new types of fraud, since not modeling
known fraudsI risk of higher false positive rateI setting some parameters less straightforward (in principle)
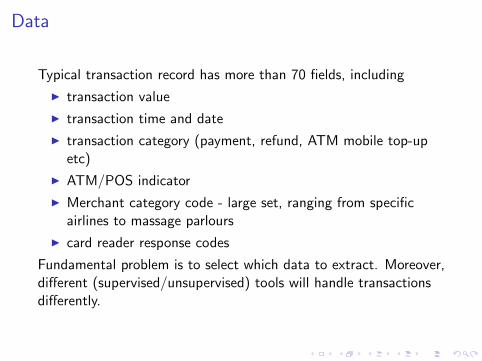
Data
Typical transaction record has more than 70 fields, including
I transaction value
I transaction time and date
I transaction category (payment, refund, ATM mobile top-upetc)
I ATM/POS indicator
I Merchant category code - large set, ranging from specificairlines to massage parlours
I card reader response codes
Fundamental problem is to select which data to extract. Moreover,different (supervised/unsupervised) tools will handle transactionsdifferently.
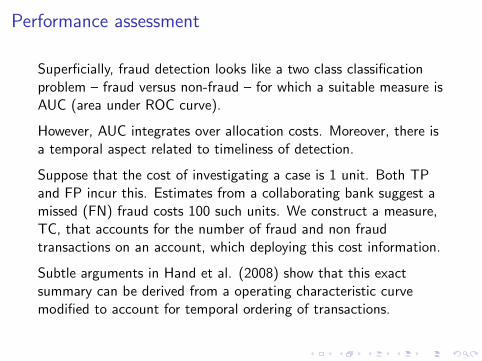
Performance assessment
Superficially, fraud detection looks like a two class classificationproblem – fraud versus non-fraud – for which a suitable measure isAUC (area under ROC curve).
However, AUC integrates over allocation costs. Moreover, there isa temporal aspect related to timeliness of detection.
Suppose that the cost of investigating a case is 1 unit. Both TPand FP incur this. Estimates from a collaborating bank suggest amissed (FN) fraud costs 100 such units. We construct a measure,TC, that accounts for the number of fraud and non fraudtransactions on an account, which deploying this cost information.
Subtle arguments in Hand et al. (2008) show that this exactsummary can be derived from a operating characteristic curvemodified to account for temporal ordering of transactions.
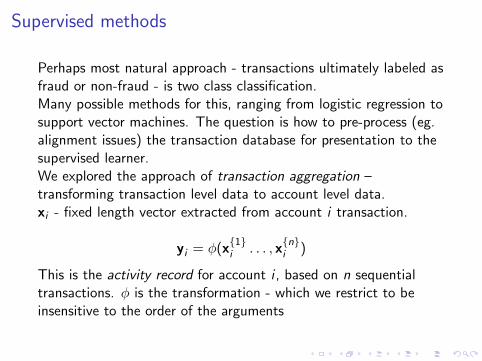
Supervised methods
Perhaps most natural approach - transactions ultimately labeled asfraud or non-fraud - is two class classification.Many possible methods for this, ranging from logistic regression tosupport vector machines. The question is how to pre-process (eg.alignment issues) the transaction database for presentation to thesupervised learner.We explored the approach of transaction aggregation –transforming transaction level data to account level data.xi - fixed length vector extracted from account i transaction.
yi = φ(x{1}i . . . , x
{n}i )
This is the activity record for account i , based on n sequentialtransactions. φ is the transformation - which we restrict to beinsensitive to the order of the arguments
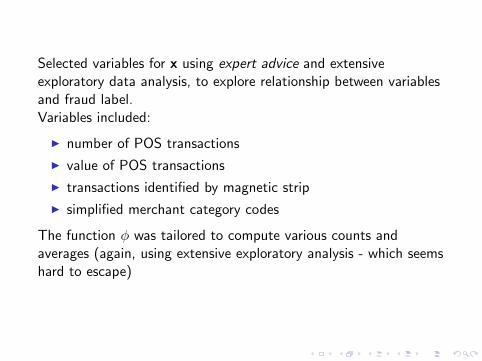
Selected variables for x using expert advice and extensiveexploratory data analysis, to explore relationship between variablesand fraud label.Variables included:
I number of POS transactions
I value of POS transactions
I transactions identified by magnetic strip
I simplified merchant category codes
The function φ was tailored to compute various counts andaverages (again, using extensive exploratory analysis - which seemshard to escape)
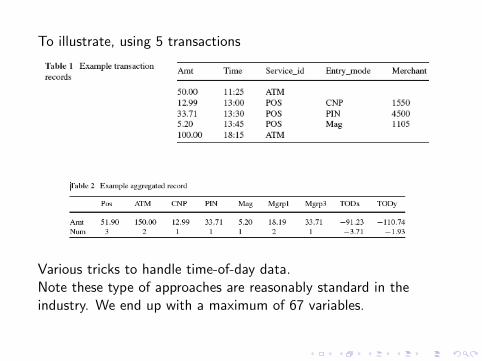
To illustrate, using 5 transactions
Various tricks to handle time-of-day data.Note these type of approaches are reasonably standard in theindustry. We end up with a maximum of 67 variables.
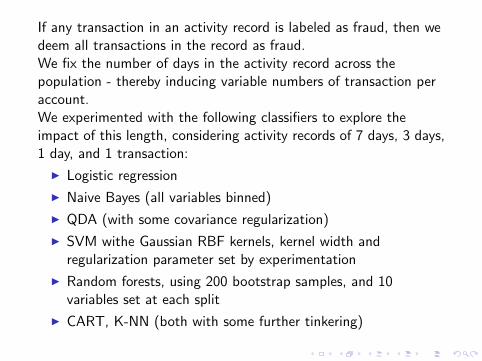
If any transaction in an activity record is labeled as fraud, then wedeem all transactions in the record as fraud.We fix the number of days in the activity record across thepopulation - thereby inducing variable numbers of transaction peraccount.We experimented with the following classifiers to explore theimpact of this length, considering activity records of 7 days, 3 days,1 day, and 1 transaction:
I Logistic regression
I Naive Bayes (all variables binned)
I QDA (with some covariance regularization)
I SVM withe Gaussian RBF kernels, kernel width andregularization parameter set by experimentation
I Random forests, using 200 bootstrap samples, and 10variables set at each split
I CART, K-NN (both with some further tinkering)
To recap, we occupy a feature space with activity records, oflength 1,3,7, built using consecutive windows. each object in thisspace has a fraud label, and we use a variety of classifiers, ofvarious expressive power, to made predictions.
These methods are deployed on real data samples from commercialcollaborators, consisting of tens or hundreds of millions oftransactions.
We try to use the data fairly, so quote out of sample predictionsrepresenting the temporal ordering of the data.
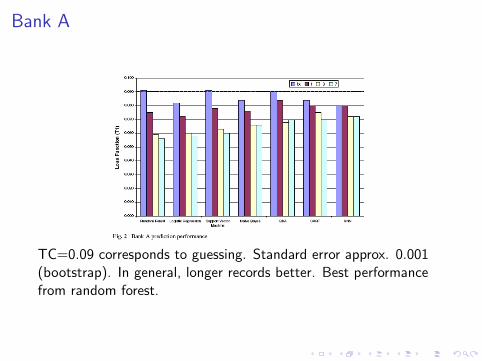
Bank A
TC=0.09 corresponds to guessing. Standard error approx. 0.001(bootstrap). In general, longer records better. Best performancefrom random forest.
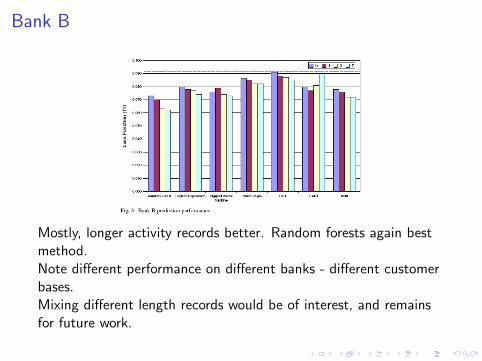
Bank B
Mostly, longer activity records better. Random forests again bestmethod.Note different performance on different banks - different customerbases.Mixing different length records would be of interest, and remainsfor future work.
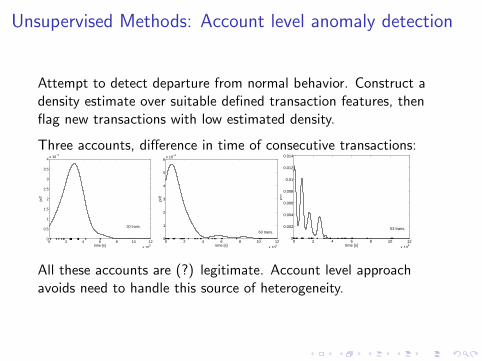
Unsupervised Methods: Account level anomaly detection
Attempt to detect departure from normal behavior. Construct adensity estimate over suitable defined transaction features, thenflag new transactions with low estimated density.
Three accounts, difference in time of consecutive transactions:
0 2 4 6 8 10 12
x 105
0
0.5
1
1.5
2
2.5
3
3.5
4x 10
−3
time [s]
30 trans.
0 2 4 6 8 10 12
x 105
0
1
2
3
4
5
6x 10
−3
time [s]
63 trans.
0 2 4 6 8 10 12
x 105
0
0.002
0.004
0.006
0.008
0.01
0.012
0.014
time [s]
53 trans.
All these accounts are (?) legitimate. Account level approachavoids need to handle this source of heterogeneity.
We consider a two-stage approach.
1. Estimation stage - accumulate enough transactions toconstruct a model of normal behaviour. We use a fixednumber, but this is a free parameter.
2. Operational stage - use the model of behaviour to flagtransactions as normal or abnormal. Treat abnormal as fraud
Generic issues to handle: choice of model, choice of threshold,method of handling temporal nature of data.
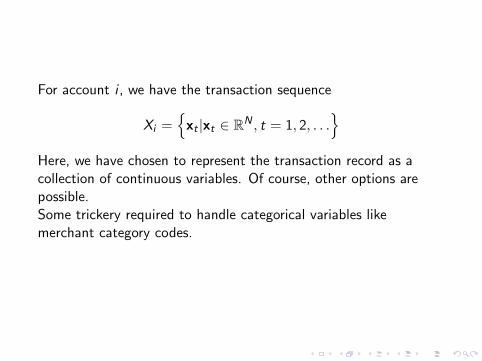
For account i , we have the transaction sequence
Xi ={xt |xt ∈ RN , t = 1, 2, . . .
}Here, we have chosen to represent the transaction record as acollection of continuous variables. Of course, other options arepossible.Some trickery required to handle categorical variables likemerchant category codes.
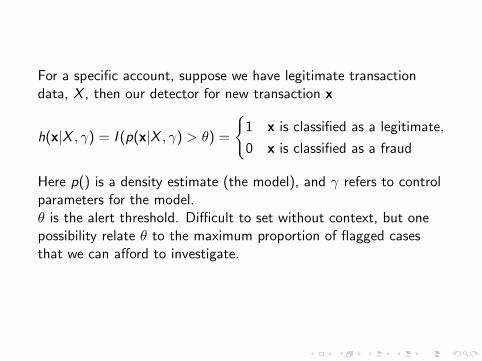
For a specific account, suppose we have legitimate transactiondata, X , then our detector for new transaction x
h(x|X , γ) = I (p(x|X , γ) > θ) =
{1 x is classified as a legitimate,
0 x is classified as a fraud
Here p() is a density estimate (the model), and γ refers to controlparameters for the model.θ is the alert threshold. Difficult to set without context, but onepossibility relate θ to the maximum proportion of flagged casesthat we can afford to investigate.
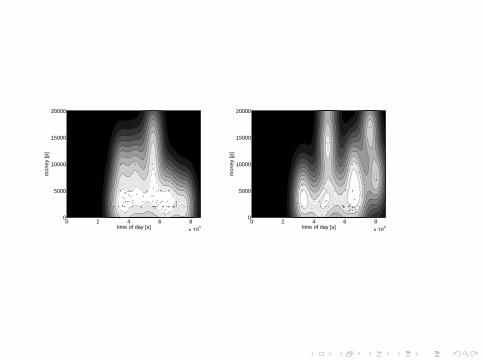
time of day [s]
mon
ey [p
]
0 2 4 6 8
x 104
0
5000
10000
15000
20000
time of day [s]m
oney
[p]
0 2 4 6 8
x 104
0
5000
10000
15000
20000
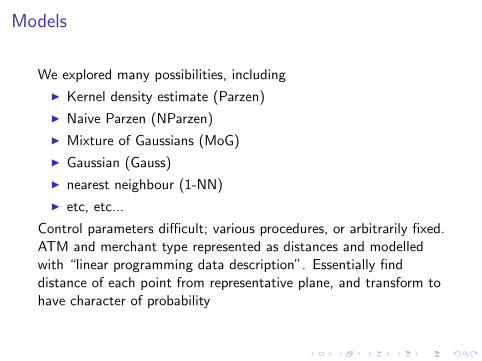
Models
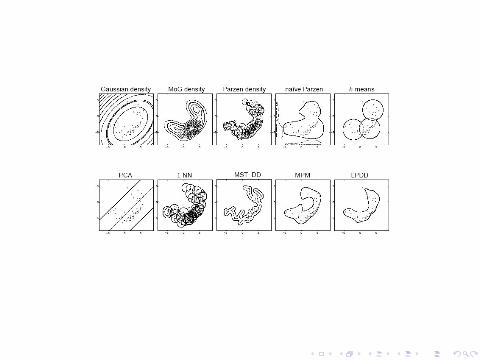
We explored many possibilities, including
I Kernel density estimate (Parzen)
I Naive Parzen (NParzen)
I Mixture of Gaussians (MoG)
I Gaussian (Gauss)
I nearest neighbour (1-NN)
I etc, etc...
Control parameters difficult; various procedures, or arbitrarily fixed.ATM and merchant type represented as distances and modelledwith “linear programming data description”. Essentially finddistance of each point from representative plane, and transform tohave character of probability
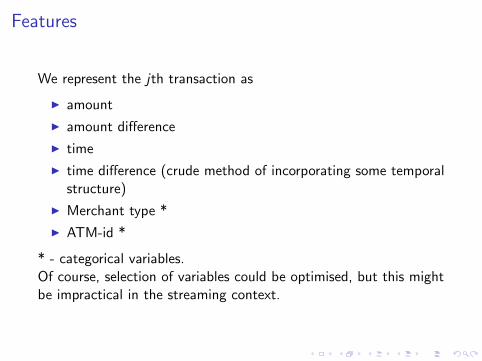
Features
We represent the jth transaction as
I amount
I amount difference
I time
I time difference (crude method of incorporating some temporalstructure)
I Merchant type *
I ATM-id *
* - categorical variables.Of course, selection of variables could be optimised, but this mightbe impractical in the streaming context.
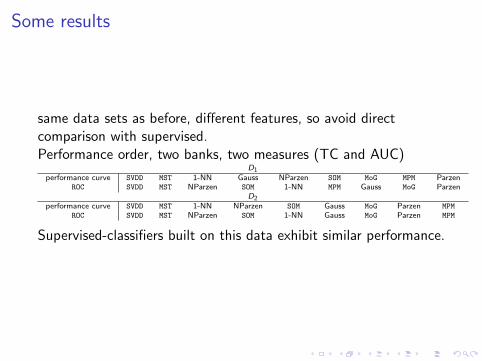
Some results
same data sets as before, different features, so avoid directcomparison with supervised.Performance order, two banks, two measures (TC and AUC)
D1performance curve SVDD MST 1-NN Gauss NParzen SOM MoG MPM Parzen
ROC SVDD MST NParzen SOM 1-NN MPM Gauss MoG ParzenD2
performance curve SVDD MST 1-NN NParzen SOM Gauss MoG Parzen MPM
ROC SVDD MST NParzen SOM 1-NN Gauss MoG Parzen MPM
Supervised-classifiers built on this data exhibit similar performance.
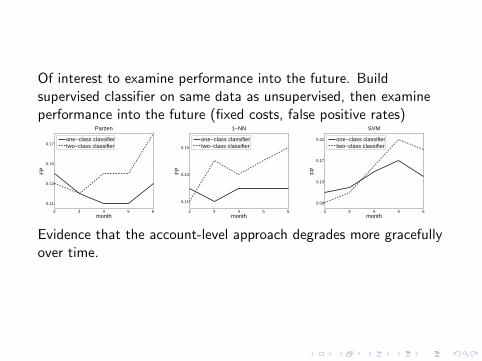
Of interest to examine performance into the future. Buildsupervised classifier on same data as unsupervised, then examineperformance into the future (fixed costs, false positive rates)
2 3 4 5 6
0.11
0.13
0.15
0.17
month
FP
Parzen
one−class classifiertwo−class classifier
2 3 4 5 6
0.11
0.13
0.15
month
FP
1−NN
one−class classifiertwo−class classifier
2 3 4 5 6
0.09
0.13
0.17
0.21
month
FP
SVM
one−class classifiertwo−class classifier
Evidence that the account-level approach degrades more gracefullyover time.
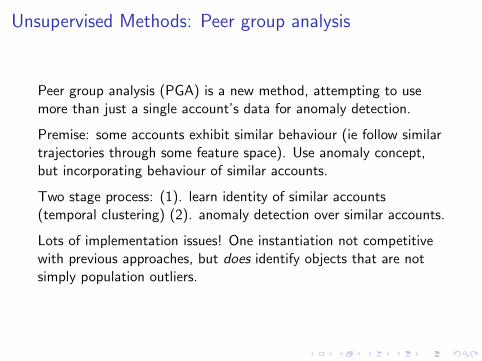
Unsupervised Methods: Peer group analysis
Peer group analysis (PGA) is a new method, attempting to usemore than just a single account’s data for anomaly detection.
Premise: some accounts exhibit similar behaviour (ie follow similartrajectories through some feature space). Use anomaly concept,but incorporating behaviour of similar accounts.
Two stage process: (1). learn identity of similar accounts(temporal clustering) (2). anomaly detection over similar accounts.
Lots of implementation issues! One instantiation not competitivewith previous approaches, but does identify objects that are notsimply population outliers.
Combination
Cannot practically run different detectors in parallel. Combinationessential, and perhaps yield improved performance?
Again, different approaches to combination possible. Perhaps mostelegant is to incorporate unsupervised scores into supervisedmethod. But technically and practically difficult.
Instead, we consider the output of each detector, and consider howto combine them. For each transaction we have a score from eachof Random forest, an SVM-based anomaly detector, and aninstantiation of PGA.Normalize all scores to have character of P(fraud).
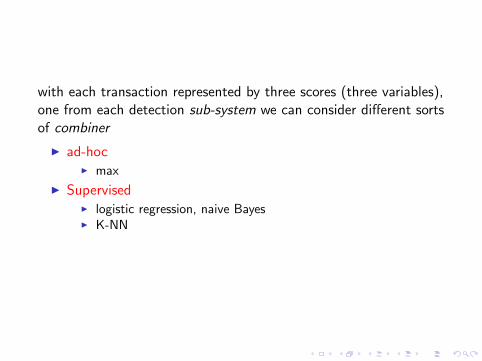
with each transaction represented by three scores (three variables),one from each detection sub-system we can consider different sortsof combiner
I ad-hocI max
I SupervisedI logistic regression, naive BayesI K-NN
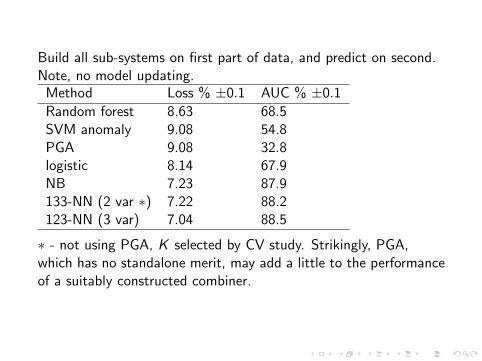
Build all sub-systems on first part of data, and predict on second.Note, no model updating.
Method Loss % ±0.1 AUC % ±0.1
Random forest 8.63 68.5SVM anomaly 9.08 54.8PGA 9.08 32.8logistic 8.14 67.9NB 7.23 87.9133-NN (2 var ∗) 7.22 88.2123-NN (3 var) 7.04 88.5
∗ - not using PGA, K selected by CV study. Strikingly, PGA,which has no standalone merit, may add a little to the performanceof a suitably constructed combiner.
Combination strategies can certainly provide improvedperformance. Still working out why: one point is that PGA workson histories with frequent transactions, account level detectionbetter for infrequent transactions.
So, tools can be put together, but we have ignored the issue ofchange over time. All these methods have been built on staticwindows of data. This is consistent with the industry norm - buildthe detector - monitor performance - rebuild when performance isdeemed to have degraded too far.
Clearly, a static window gives some capacity to handle changingpopulations (old data not relevant). But there may be a betterway to do it...
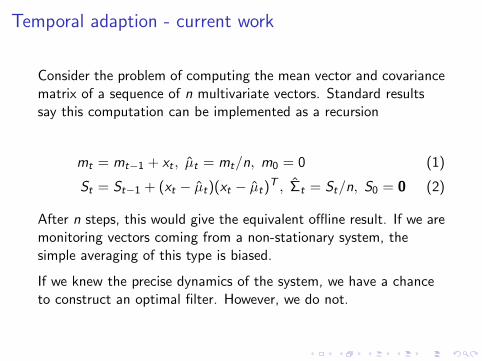
Temporal adaption - current work
Consider the problem of computing the mean vector and covariancematrix of a sequence of n multivariate vectors. Standard resultssay this computation can be implemented as a recursion
mt = mt−1 + xt , µ̂t = mt/n, m0 = 0 (1)
St = St−1 + (xt − µ̂t)(xt − µ̂t)T , Σ̂t = St/n, S0 = 0 (2)
After n steps, this would give the equivalent offline result. If we aremonitoring vectors coming from a non-stationary system, thesimple averaging of this type is biased.
If we knew the precise dynamics of the system, we have a chanceto construct an optimal filter. However, we do not.
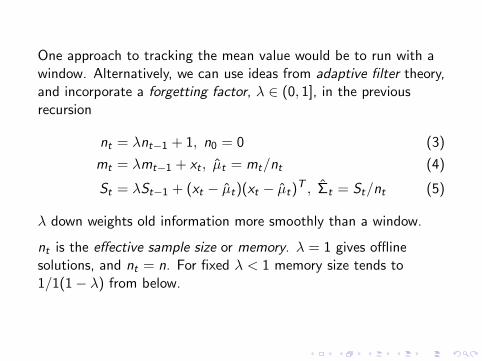
One approach to tracking the mean value would be to run with awindow. Alternatively, we can use ideas from adaptive filter theory,and incorporate a forgetting factor, λ ∈ (0, 1], in the previousrecursion
nt = λnt−1 + 1, n0 = 0 (3)
mt = λmt−1 + xt , µ̂t = mt/nt (4)
St = λSt−1 + (xt − µ̂t)(xt − µ̂t)T , Σ̂t = St/nt (5)
λ down weights old information more smoothly than a window.
nt is the effective sample size or memory. λ = 1 gives offlinesolutions, and nt = n. For fixed λ < 1 memory size tends to1/1(1− λ) from below.
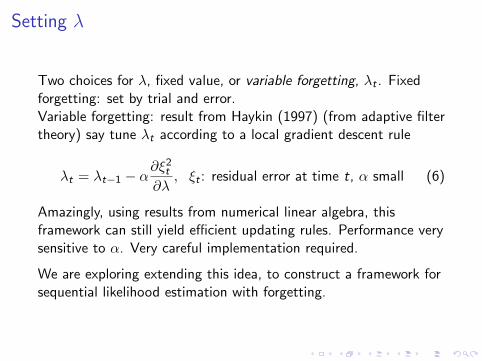
Setting λ
Two choices for λ, fixed value, or variable forgetting, λt . Fixedforgetting: set by trial and error.Variable forgetting: result from Haykin (1997) (from adaptive filtertheory) say tune λt according to a local gradient descent rule
λt = λt−1 − α∂ξ2
t
∂λ, ξt : residual error at time t, α small (6)
Amazingly, using results from numerical linear algebra, thisframework can still yield efficient updating rules. Performance verysensitive to α. Very careful implementation required.
We are exploring extending this idea, to construct a framework forsequential likelihood estimation with forgetting.
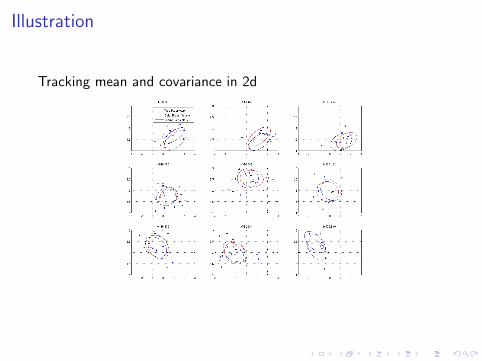
Illustration
Tracking mean and covariance in 2d
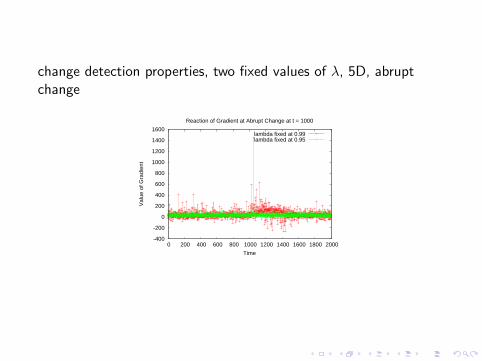
change detection properties, two fixed values of λ, 5D, abruptchange
-400
-200
0
200
400
600
800
1000
1200
1400
1600
0 200 400 600 800 1000 1200 1400 1600 1800 2000
Val
ue o
f Gra
dien
t
Time
Reaction of Gradient at Abrupt Change at t = 1000
lambda fixed at 0.99lambda fixed at 0.95
Streaming classifier
Since we have a method for adaptively and incrementallyestimating mean vectors and covariances matrices, we can nowconsider an adaptive version of Gaussian based classification (sincethese methods only require means and covariances).
Recall
P(c |x) =f (x |c)P(c)
f (x)
Change can happen in various ways, but population drift usuallyrefers to the class prior P(C ) and/or the class conditional densitiesP(x |c).Linear/quadratic discriminant analysis (LDA/QDA) motivated byreasoning that f (x |c) ∼ N(µ,Σ). LDA: assume covariance matrixcommon across classes. QDA: different covariances.
Now, instead of using static estimates of µ and Σ, use the“adaptive estimates”. Can use the same adaptive forgetting factorto handle changing prior probabilities also. This leads to a numberof ways of constructing a stream classifier.
This requires some amount of hack, because the theory requiresregularly-spaced data in time. To handle this, we simply updateevery time an observation arrives.
Also, to test the idea, provide fraud flag immediately afterclassification (unrealistic, but we have some ideas for the realproblem).
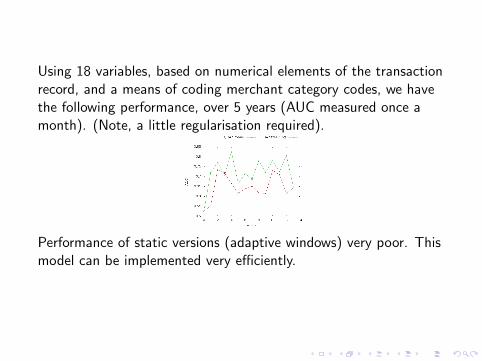
Using 18 variables, based on numerical elements of the transactionrecord, and a means of coding merchant category codes, we havethe following performance, over 5 years (AUC measured once amonth). (Note, a little regularisation required).
Performance of static versions (adaptive windows) very poor. Thismodel can be implemented very efficiently.
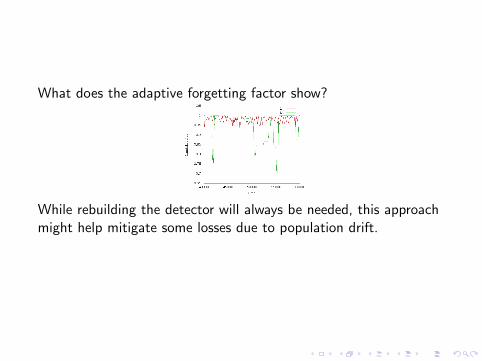
What does the adaptive forgetting factor show?
While rebuilding the detector will always be needed, this approachmight help mitigate some losses due to population drift.
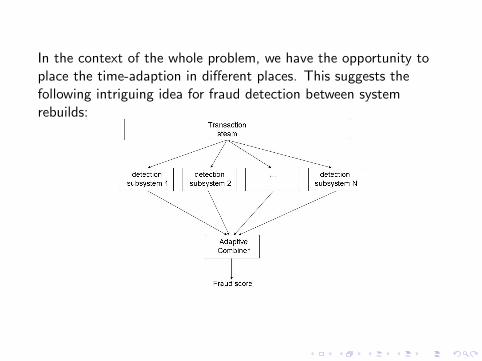
In the context of the whole problem, we have the opportunity toplace the time-adaption in different places. This suggests thefollowing intriguing idea for fraud detection between systemrebuilds:
Conclusions
Transaction fraud detection is an important, but hard, real worldproblem. A significant amount of engineering is required toproduce effective solutions.
Different modeling approaches and tools can have merit - and itappears they can be effectively combined. This suggests that thedifferent tools are capturing the fraud signal in non-overlappingways.
We have the problem of handling changing populations (arms race,economic drift etc). Preliminary results suggest that temporallyadaptive methods may have some utility in this context.
Future Work
I Explore continuous updating and adaption of subsystems andcombiner.
I Extend adaptive classifier to finite mixture model (moreflexible), approximate logistic regression and RBF networks.
I More realistically handle the delayed fraud label.
References
Anagnostopoulos, C., Tasoulis, D.K, Adams, N.M. and Hand, D.J., “Streaming Gaussian classification usingrecursive maximum likelihood with adaptive forgetting”. Technical report.Hand, D.J., Whitrow, C, Adams, N.M., Juszczak, P. and Weston, D.J., “Performance criteria for plastic card frauddetection tools” J. Oper. Res. Soc., 58, (2008), 956-962.Haykin, S., “Adaptive Filter Theory”, third edition, Prentice-Hall.Juszczak, P., Adams, N.M., Hand, D.J., Whitrow, C. and Weston, D.J., “Off-the-peg and bespoke classifiers forfraud detection” Comput. Stat. Data An., 52, (2008), 4521-4532.Tasoulis, D.K., Adams, N.M., Weston, D.J. and Hand, D.J., “Mining information from plastic card transactionstreams”, in COMPSTAT 2008, Proceedings in Computational Statistics: 18th Symposium, P. Brito (ed), 2008,315-322.Weston, D.J., Hand, D.J., Adams, N.M., Whitrow, C., and Juszczak, P., “Plastic card fraud detection using peergroup analysis” Adv. Data An. Classif., 2(1), (2008), 45-62.Whitrow, C., Hand, D.J., Juszczak, P., Weston, D.J., and Adams, N.M., “Transaction aggregation as a strategy forcredit card fraud detection”, Data Min. Knowl. Disc, (2008), in press.Whitrow, C., Hand, D.J., Adams, N.M., Weston, D.J., and Juszczak, P., “Combining transaction fraud detectionmethods”, Technical report (2008)