Embed Size (px)
Citation preview
Index
Introduction Characteristics Instruments Advantages Dangers Creation of credit Process Limitation on credit creation on bank
Characteristics Of Credit
Confidence Capacity Goodwill Security Size of Credit Period of Credit
Instruments of Credit
Cheque Bill Of Exchange Bank Draft Promissory Note Treasury Bills Government Bonds Traveler’s Cheques
ADVANTAGES OF CERDIT
Capital formation Increase Consumption Medium of Exchange Flexible monetary system Increase output and Employment Development of Enterprises Easy Payment
Dangers of credit
Economic Crisis Encourage weakness Excess credit monopoly Inefficiency wasteful expenditure
CREDIT CREATION BY BANKS
Central Bank is the first source of money supply in the form of currency in circulation.
The RESERVE BANK OF INDIA is the note issuing authority of the country. The RBI ensures availability of currency to meet the transaction needs of the economy.
The total volume of money in the economy should be adequate to facilitate the various types of economic activities such as production, distribution & consumption.
The commercial banks are the second most important sources of money supply.
THE MONEY THAT COMMERCIAL BANKS SUPPLY IS CALLED CREDIT MONEY.
The process of ‘CREDIT CREATION’ begins with banks lending money out of primary deposits.
Primary deposits are those deposits which are deposited in banks.
In fact, banks cannot lend the entire primary deposits as they are required to maintain a certain proportion of primary deposits in the form of reserves with the RBI under RBI & BANKING REGULATION ACT.
After maintaining the required reserves, the bank can lend the remaining portion of primary deposits. Here banks lend the money and the process of credit creation starts.
EXAMPLE :-Suppose there are a number of commercial banks in the banking system- bank1, bank2, bank3, so on….
To begin with let us suppose that an individual “A” makes a deposit of Rs.100 in bank1.
Bank1 is required to maintain a cash reserve requirement of 5% (prevailing rate) which is decided by the RBI’s monetary policy, from the deposits made by “A”.
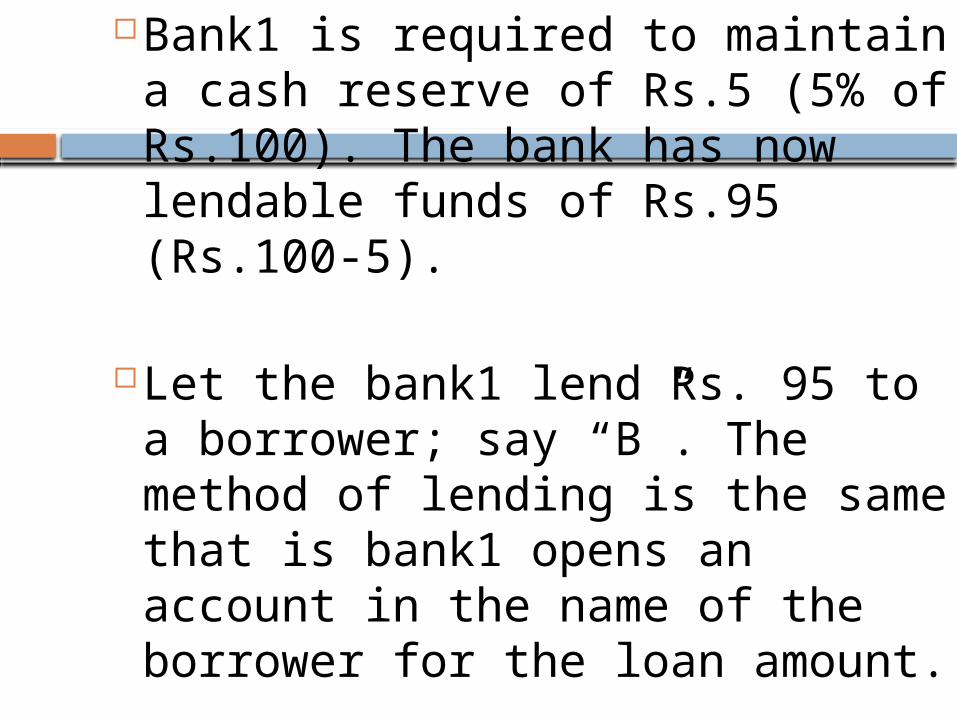
Bank1 is required to maintain a cash reserve of Rs.5 (5% of Rs.100). The bank has now lendable funds of Rs.95 (Rs.100-5).
Let the bank1 lend Rs. 95 to a borrower; say “B”. The method of lending is the same that is bank1 opens an account in the name of the borrower for the loan amount.
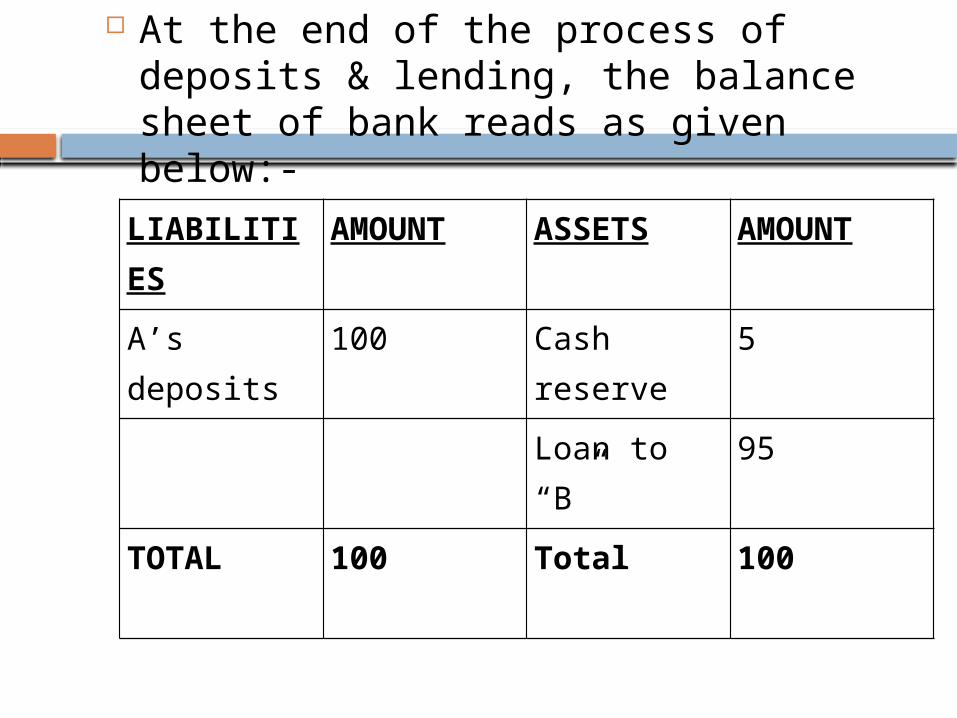
At the end of the process of deposits & lending, the balance sheet of bank reads as given below:-
LIABILITIES AMOUNT ASSETS AMOUNT
A’s deposits 100 Cash reserve 5
Loan to “B” 95
TOTAL 100 Total 100
Now suppose that money borrowed from bank1 is paid to individual “C” in settlement of his past debts.
The individual “C” deposits the money in his bank say, bank2. Now bank2 carries out its banking transaction.
It keeps a cash reserve to the extent of 5%, that is Rs.4.75 (5% of Rs.95) and lend Rs.90.5 to a borrower ‘D’.
At the end of the process the balance sheet of bank2 will look like:-
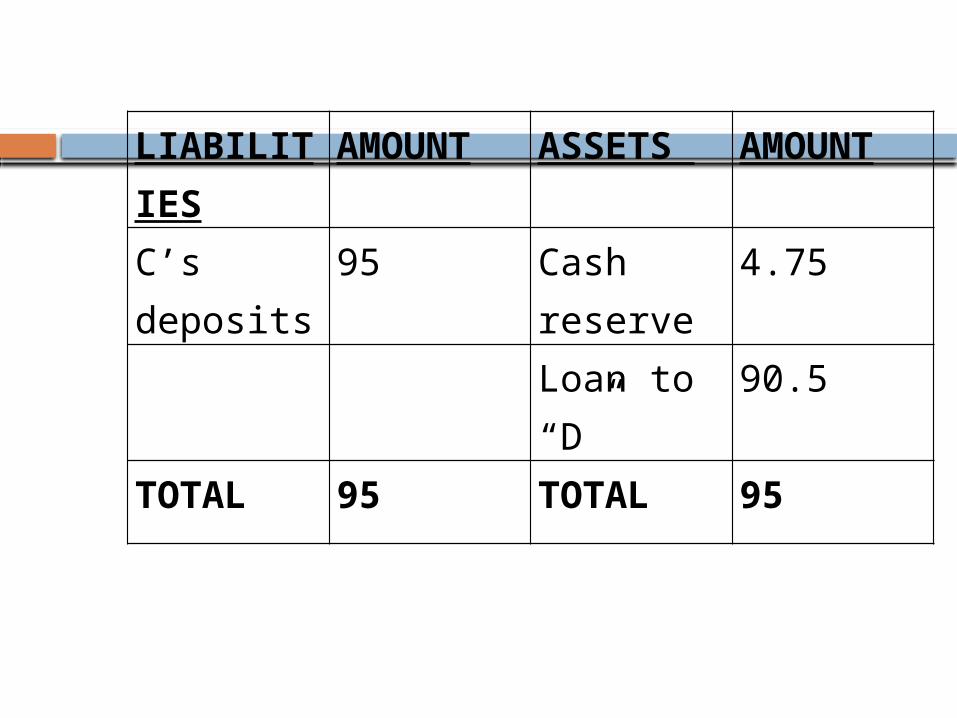
LIABILITIES AMOUNT ASSETS AMOUNT
C’s deposits 95 Cash reserve
4.75
Loan to “D” 90.5
TOTAL 95 TOTAL 95
The amount advanced to ‘D’ will return ultimately to the banking system, as described in case of ‘B’ and the process of deposits and credit creation will continue until the reserve with the banks reduced to zero.
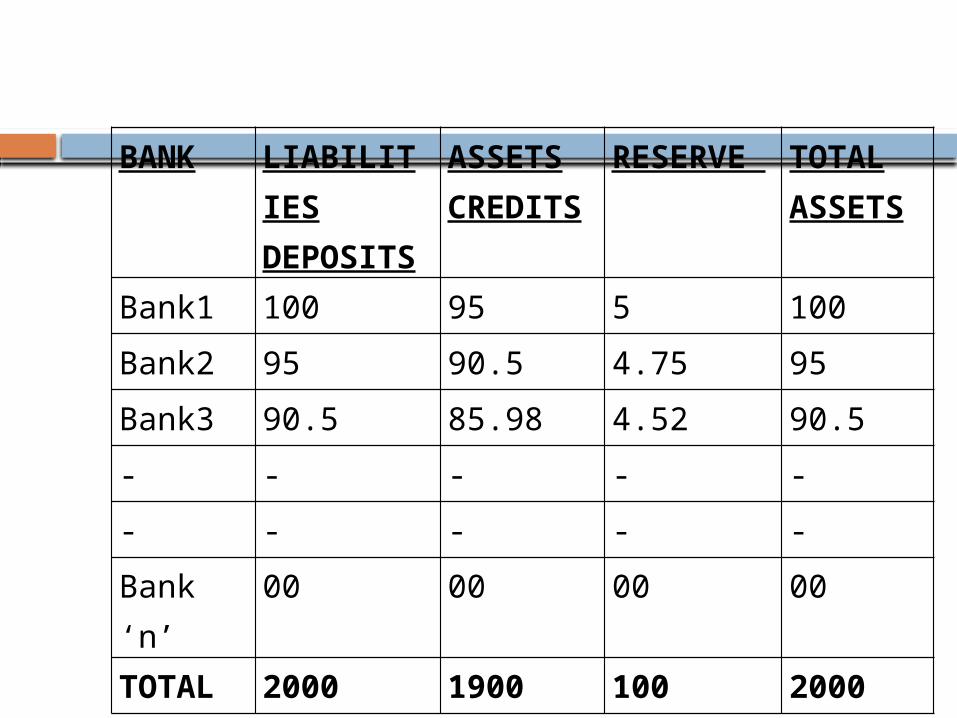
The final picture that would emerge at the end of the process of deposit & credit creation by the banking system is presented in the consolidated balance sheet as under:-
BANK LIABILITIES DEPOSITS
ASSETS CREDITS
RESERVE TOTAL ASSETS
Bank1 100 95 5 100
Bank2 95 90.5 4.75 95
Bank3 90.5 85.98 4.52 90.5
- - - - -
- - - - -
Bank ‘n’ 00 00 00 00
TOTAL 2000 1900 100 2000
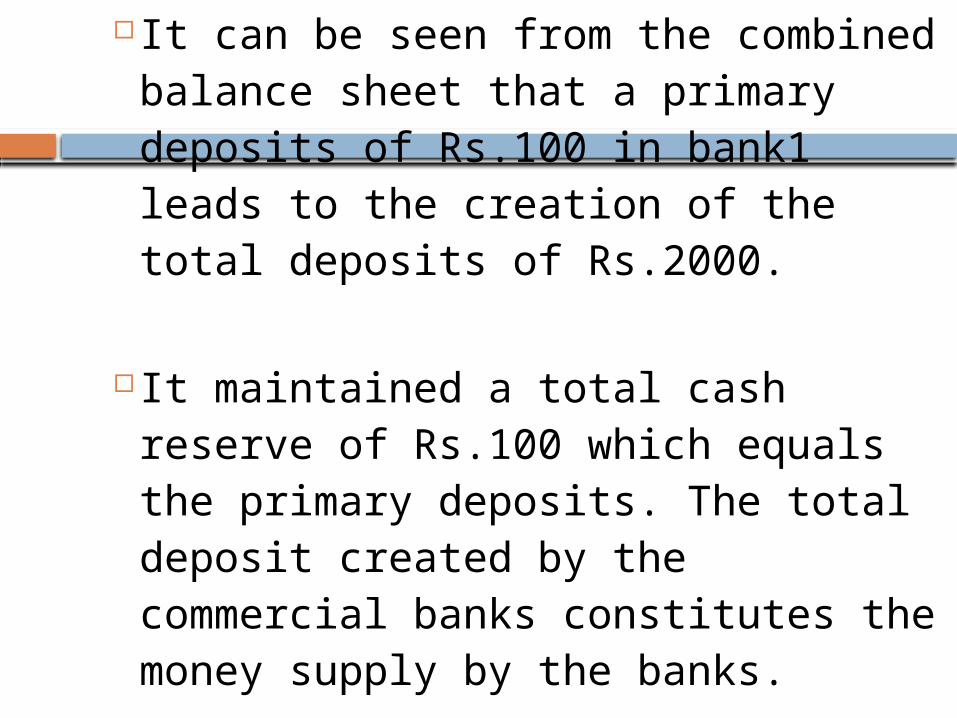
It can be seen from the combined balance sheet that a primary deposits of Rs.100 in bank1 leads to the creation of the total deposits of Rs.2000.
It maintained a total cash reserve of Rs.100 which equals the primary deposits. The total deposit created by the commercial banks constitutes the money supply by the banks.
LIMITATIONS ON CREDIT CREATION BY BANKS
Cash Deposit Ratio of Reverse to deposits Desire of people to hold cash Business Conditions Credit Control
MONEY SUPPLY
Supply of money in an economy is the total quantity of money to exchange goods and services during a given period of time.
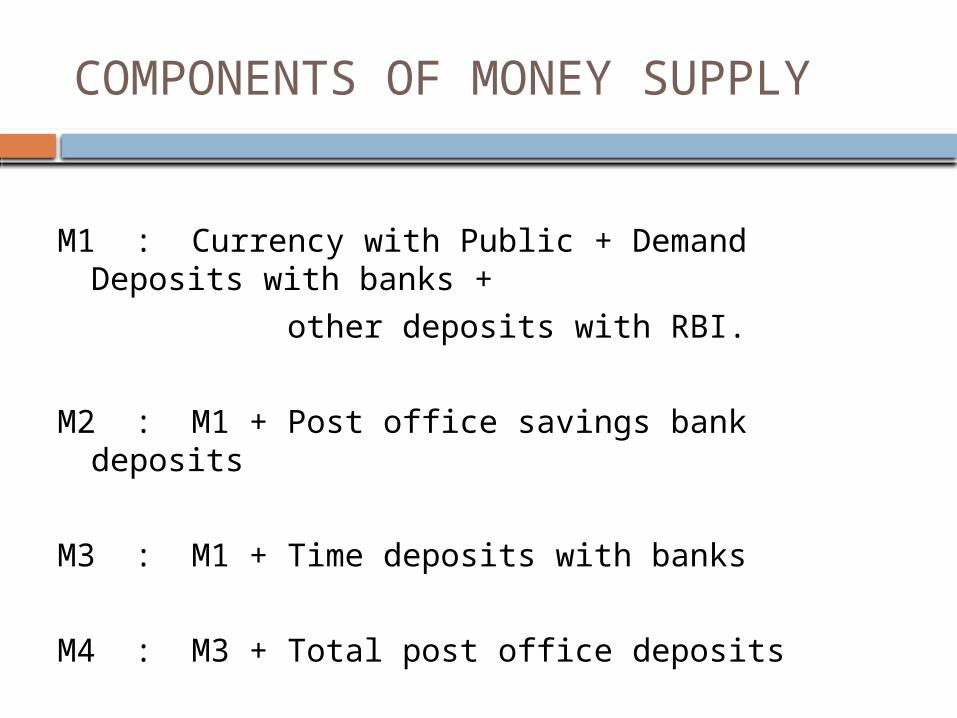
COMPONENTS OF MONEY SUPPLY
M1 : Currency with Public + Demand Deposits with banks +
other deposits with RBI.
M2 : M1 + Post office savings bank deposits
M3 : M1 + Time deposits with banks
M4 : M3 + Total post office deposits
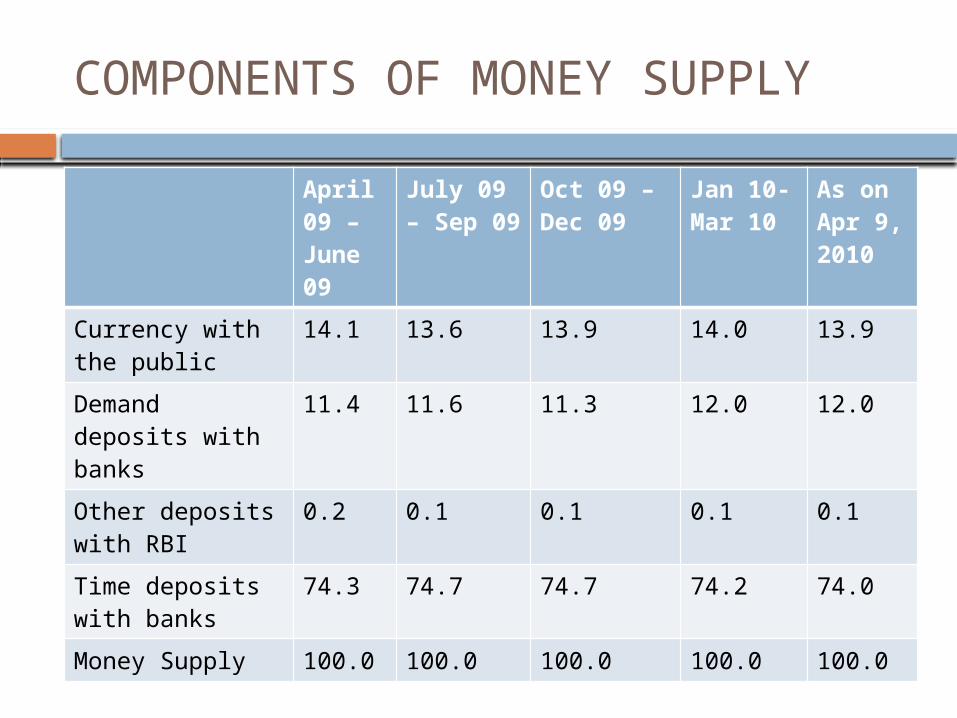
COMPONENTS OF MONEY SUPPLY
April 09 – June 09
July 09 – Sep 09
Oct 09 – Dec 09
Jan 10- Mar 10
As on Apr 9, 2010
Currency with the public
14.1 13.6 13.9 14.0 13.9
Demand deposits with banks
11.4 11.6 11.3 12.0 12.0
Other deposits with RBI
0.2 0.1 0.1 0.1 0.1
Time deposits with banks
74.3 74.7 74.7 74.2 74.0
Money Supply 100.0 100.0 100.0 100.0 100.0
FACTORS AFFECTING MONEY SUPPLY
VELOCITY OF MONEY
VOLUME OF TRADE
CREDIT CREATION BY BANKS
BANKING HABITS
PRICE LEVELS
CASH RESERVE RATIO(CRR)
TRANSACTIONAL DEMAND FOR MONEY
Demand for money made to facilitate the trading activities.
DETERMINANTS OF TRANSACTIONAL DEMAND
LEVEL OF INCOME
PATTERN OF RECEIPT AND PAYMENT EXPENDITURE
SYSTEM OF PAYMENTS
USE OF CREDIT
RESERVE MONEY
Money produced by monetary authorities of a country.
RM = C + R +OD
C: Currency with publicR: Cash Reserves with banksOD: Other deposits with banks
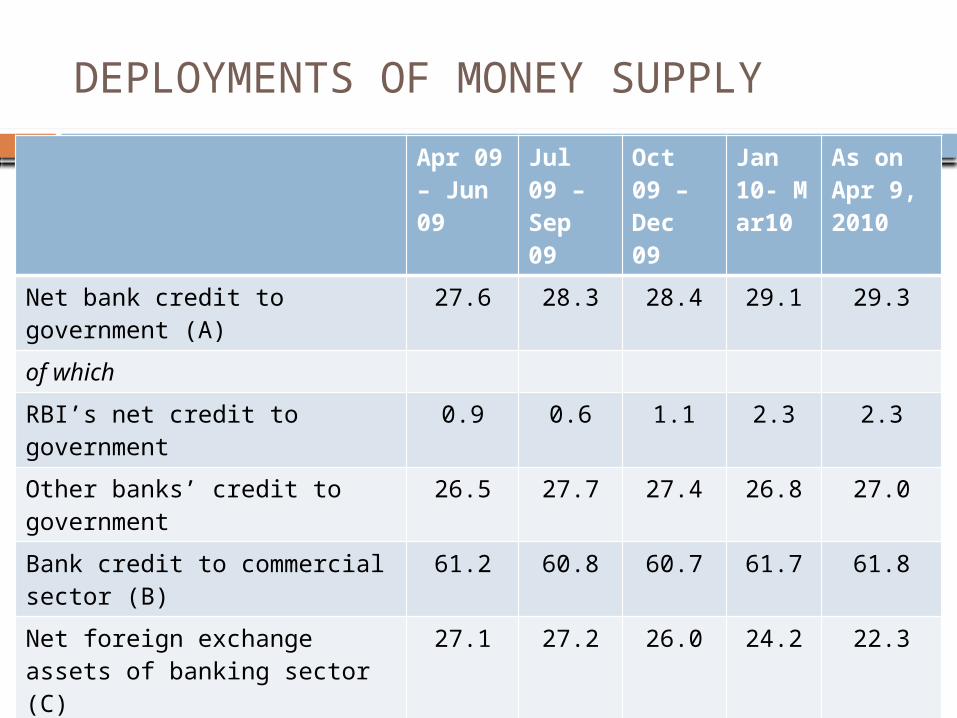
DEPLOYMENTS OF MONEY SUPPLY
Apr 09 – Jun 09
Jul 09 – Sep 09
Oct 09 – Dec 09
Jan 10- Mar10
As on Apr 9, 2010
Net bank credit to government (A)
27.6 28.3 28.4 29.1 29.3
of which
RBI’s net credit to government 0.9 0.6 1.1 2.3 2.3
Other banks’ credit to government
26.5 27.7 27.4 26.8 27.0
Bank credit to commercial sector (B)
61.2 60.8 60.7 61.7 61.8
Net foreign exchange assets of banking sector (C)
27.1 27.2 26.0 24.2 22.3
Government’s currency liabilities to the public (D)
0.2 0.2 0.2 0.2 0.2
Banking sectors net non-monetary liabilities other than time deposits (E)
16.1 16.5 15.3 15.3 13.6
Money Supply (A+B+C+D-E) 100.0 100.0 100.0 100.0 100.0