Embed Size (px)
Citation preview
Credit Earnings Volatility and Share Price Performance: Implications of IFRS 9 and CECL
Portfolio and Balance Sheet Research February, 2019

Credit Earnings Volatility and Share Price Performance 2
Amnon Levy, Managing Director, Moody's Analytics
Dr. Amnon Levy heads the group responsible for research development and quantitative services related to Moody’s Analytics portfolio and balance sheet solutions.
PRESENTERS
Pierre Xu, Director, Moody's Analytics
Pierre Xu is a director of research at Moody's Analytics where he heads portfolio risk analytics in the Portfolio and Balance Sheet Research group.
Anna Krayn, Senior Director, Moody's Analytics
Anna Krayn heads the Risk, Accounting and Insurance Solutions in the Americas. Her team is responsible for solution structuring across Moody’s Analytics products and services.
MODERATOR
Credit Earnings Volatility and Share Price Performance 3
In order for risk management to matter,
stable performance must be valued at a premium,compared to more volatile.
Does Risk Management Add Value?
$
Credit Earnings Volatility and Share Price Performance 4
Today’s Agenda
1
2
Enter CECL and IFRS 9
The relationship between accounting rules, credit earnings volatility and share price performance– How does the market interpret the volatility in financials?
Implications of credit portfolio management on share price performance– To what extent can credit portfolio management help
address volatility under CECL and IFRS 9?
Credit Earnings Volatility and Share Price Performance 5
Why Earnings Volatility Matters
» Impacts capital surplus and solvency
» High volatility is associated with:– Concerns of opacity and questionable
business practices– Concerns of questionable portfolio
composition
» Ultimately, volatility:– Impacts cost of capital– Limits business opportunities – Feeds into valuation and share price
Credit Earnings Volatility and Share Price Performance 6
Market reactions are higher for firms where estimation risk is reduced.
The Accounting ReviewForthcoming
Do the FASB’s Standards Add Shareholder Value?Khan, Li, Rajgopal, and Venkatachalam
Do Accounting Rules Add Value?
Credit Earnings Volatility and Share Price Performance 7
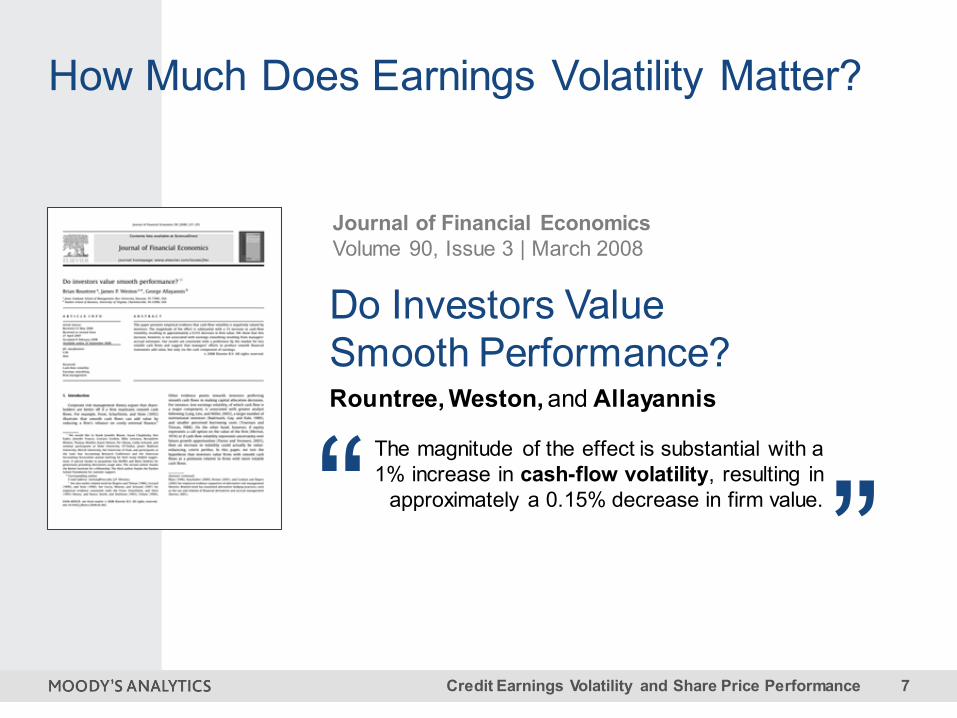
“ ”The magnitude of the effect is substantial with a 1% increase in cash-flow volatility, resulting in
approximately a 0.15% decrease in firm value.
Journal of Financial EconomicsVolume 90, Issue 3 | March 2008
Do Investors Value Smooth Performance?Rountree, Weston, and Allayannis
How Much Does Earnings Volatility Matter?
Credit Earnings Volatility and Share Price Performance 8
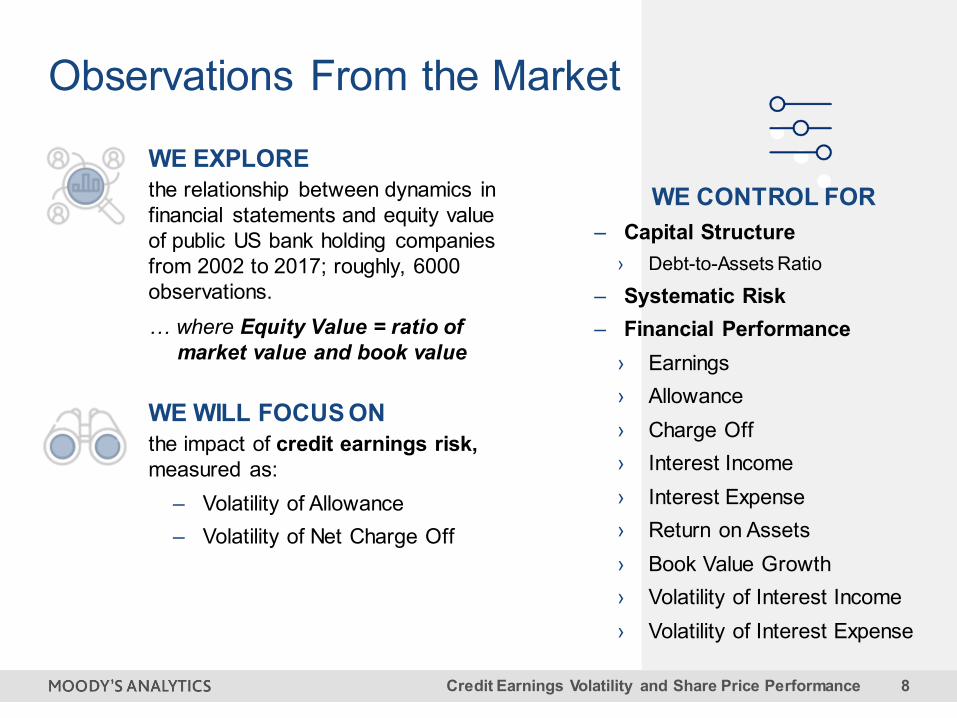
WE EXPLORE the relationship between dynamics in financial statements and equity value of public US bank holding companies from 2002 to 2017; roughly, 6000 observations.… where Equity Value = ratio of
market value and book value
WE WILL FOCUS ONthe impact of credit earnings risk, measured as:
– Volatility of Allowance– Volatility of Net Charge Off
Observations From the Market
WE CONTROL FOR– Capital Structure
› Debt-to-Assets Ratio
– Systematic Risk– Financial Performance
› Earnings› Allowance› Charge Off› Interest Income› Interest Expense› Return on Assets› Book Value Growth› Volatility of Interest Income› Volatility of Interest Expense
Credit Earnings Volatility and Share Price Performance 9
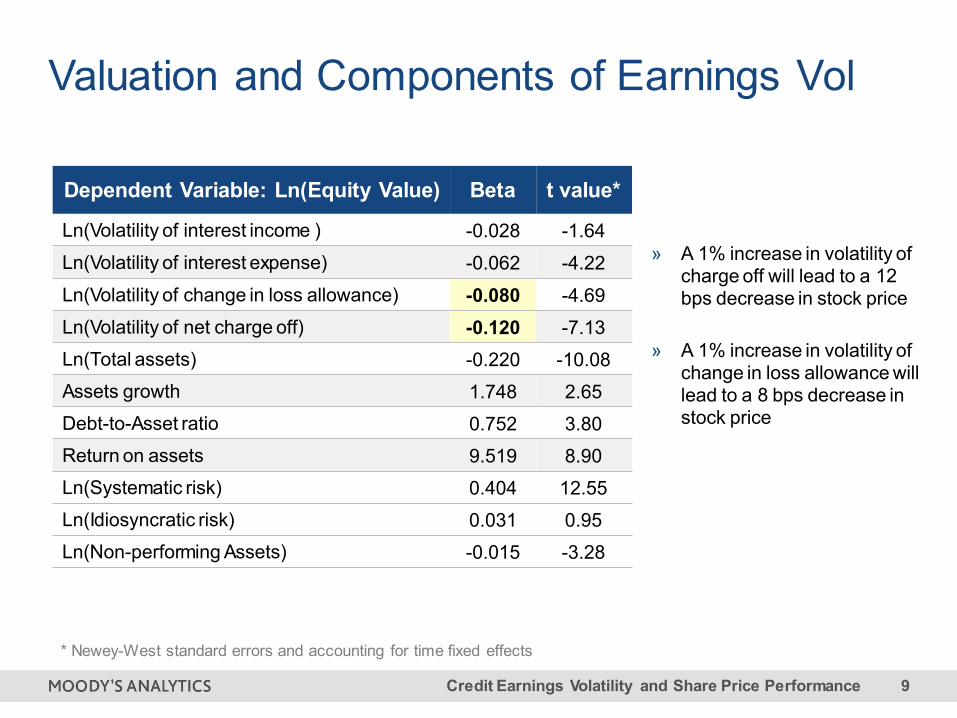
Dependent Variable: Ln(Equity Value) Beta t value*
Ln(Volatility of interest income ) -0.028 -1.64Ln(Volatility of interest expense) -0.062 -4.22Ln(Volatility of change in loss allowance) -0.080 -4.69Ln(Volatility of net charge off) -0.120 -7.13Ln(Total assets) -0.220 -10.08Assets growth 1.748 2.65Debt-to-Asset ratio 0.752 3.80Return on assets 9.519 8.90Ln(Systematic risk) 0.404 12.55Ln(Idiosyncratic risk) 0.031 0.95Ln(Non-performing Assets) -0.015 -3.28
* Newey-West standard errors and accounting for time fixed effects
Valuation and Components of Earnings Vol
» A 1% increase in volatility of charge off will lead to a 12 bps decrease in stock price
» A 1% increase in volatility of change in loss allowance will lead to a 8 bps decrease in stock price
Credit Earnings Volatility and Share Price Performance 10
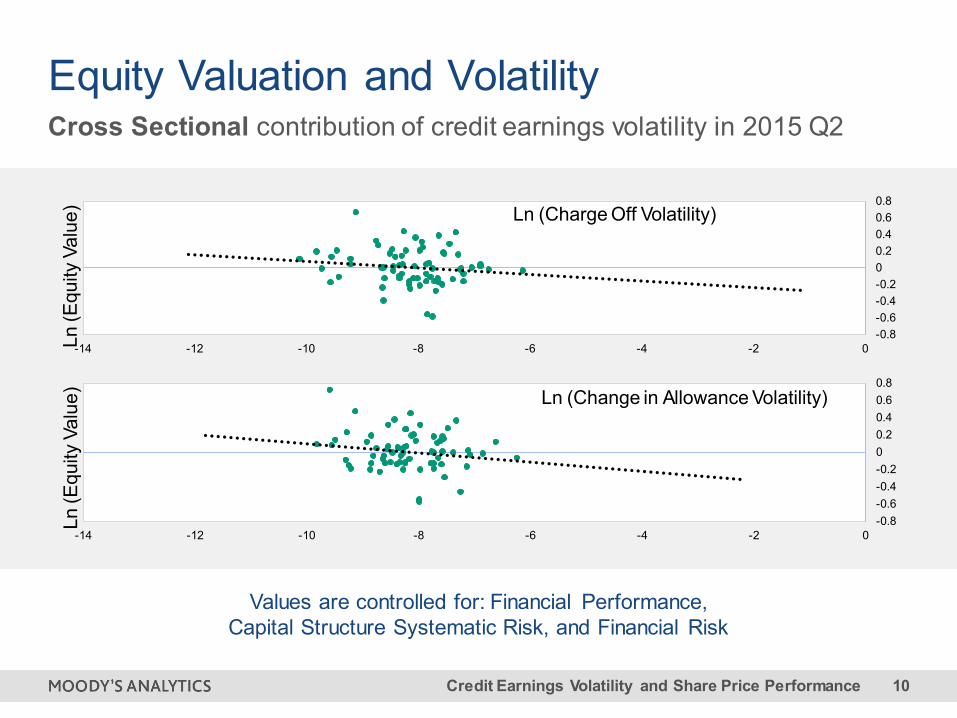
Values are controlled for: Financial Performance, Capital Structure Systematic Risk, and Financial Risk
-0.8-0.6-0.4-0.200.20.40.60.8
-14 -12 -10 -8 -6 -4 -2 0Ln (E
quity
Val
ue) Ln (Charge Off Volatility)
Cross Sectional contribution of credit earnings volatility in 2015 Q2
-0.8-0.6-0.4-0.200.20.40.60.8
-14 -12 -10 -8 -6 -4 -2 0
Ln (E
quity
Val
ue) Ln (Change in Allowance Volatility)
Equity Valuation and Volatility
Credit Earnings Volatility and Share Price Performance 11
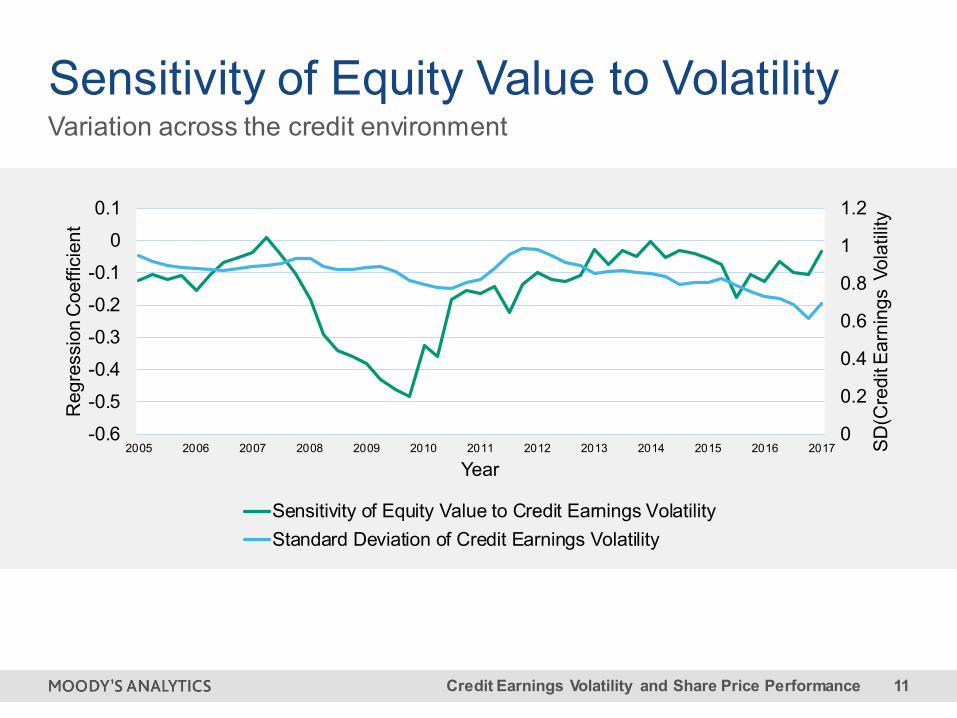
Sensitivity of Equity Value to Volatility
0
0.2
0.4
0.6
0.8
1
1.2
-0.6-0.5-0.4-0.3-0.2-0.1
00.1
2005 2006 2007 2008 2009 2010 2011 2012 2013 2014 2015 2016 2017 SD(C
redi
t Ear
ning
s Vo
latil
ity
Reg
ress
ion
Coe
ffici
ent
Year
Sensitivity of Equity Value to Credit Earnings VolatilityStandard Deviation of Credit Earnings Volatility
Variation across the credit environment
Credit Earnings Volatility and Share Price Performance 12
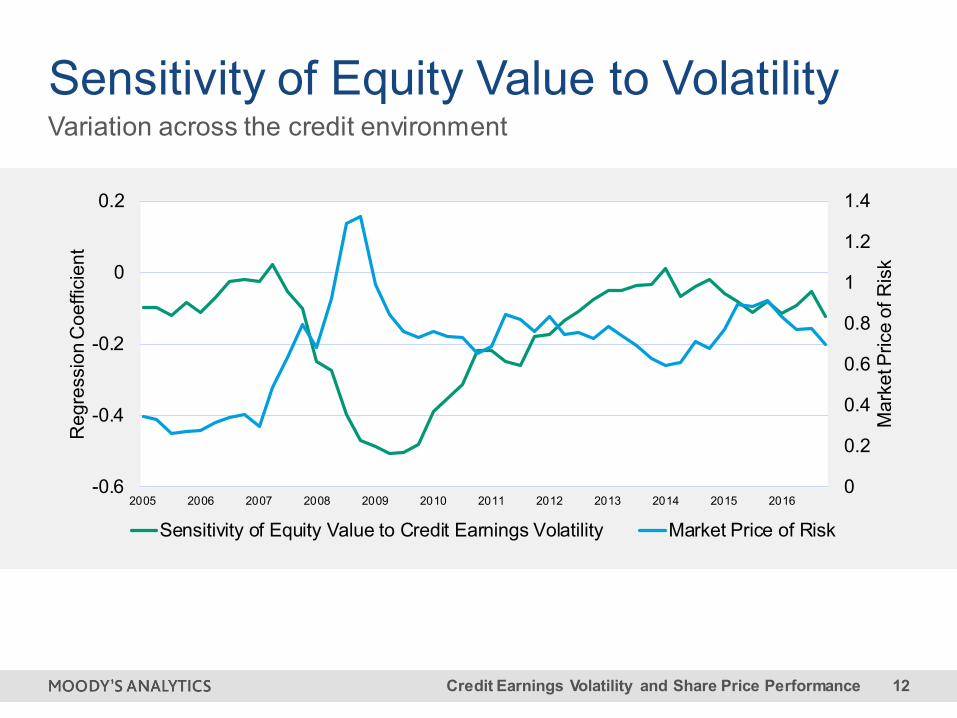
Sensitivity of Equity Value to VolatilityVariation across the credit environment
0
0.2
0.4
0.6
0.8
1
1.2
1.4
-0.6
-0.4
-0.2
0
0.2
2005 2006 2007 2008 2009 2010 2011 2012 2013 2014 2015 2016
Mar
ket P
rice
of R
isk
Reg
ress
ion
Coe
ffici
ent
Sensitivity of Equity Value to Credit Earnings Volatility Market Price of Risk
Credit Earnings Volatility and Share Price Performance 13
Today’s Agenda
1
2
Enter CECL and IFRS 9
The relationship between accounting rules, credit earnings volatility and share price performance– How does the market interpret the volatility in financials?
Implications of credit portfolio management on share price performance– To what extent can credit portfolio management help
address volatility under CECL and IFRS 9?
Credit Earnings Volatility and Share Price Performance 14
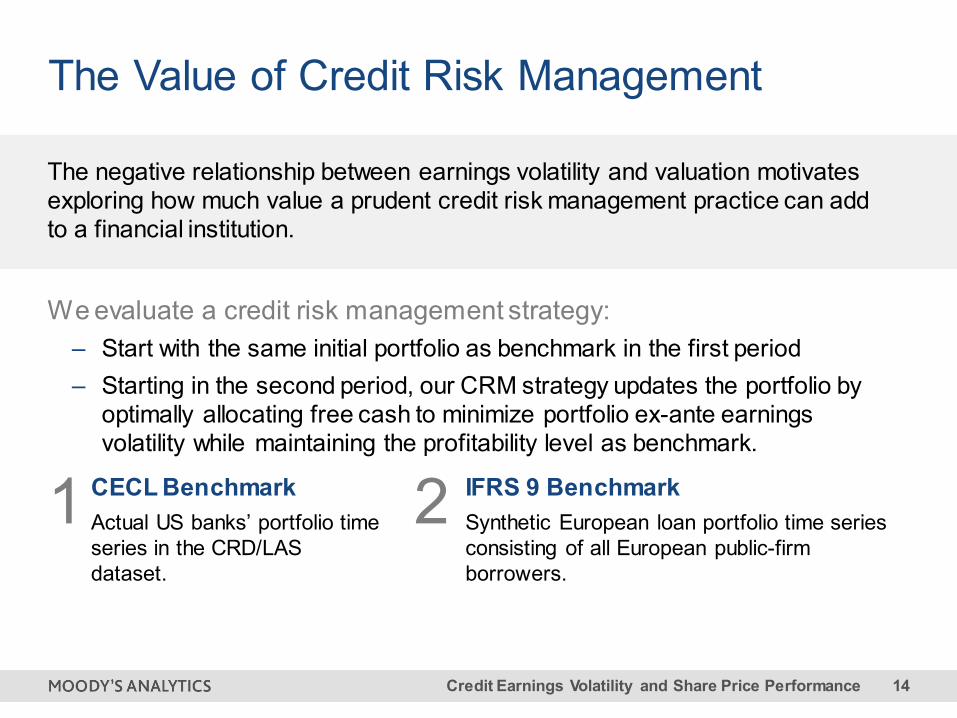
The negative relationship between earnings volatility and valuation motivates exploring how much value a prudent credit risk management practice can add to a financial institution.
We evaluate a credit risk management strategy: – Start with the same initial portfolio as benchmark in the first period – Starting in the second period, our CRM strategy updates the portfolio by
optimally allocating free cash to minimize portfolio ex-ante earnings volatility while maintaining the profitability level as benchmark.
The Value of Credit Risk Management
CECL BenchmarkActual US banks’ portfolio time series in the CRD/LAS dataset.
IFRS 9 BenchmarkSynthetic European loan portfolio time series consisting of all European public-firm borrowers.
21
Credit Earnings Volatility and Share Price Performance 15
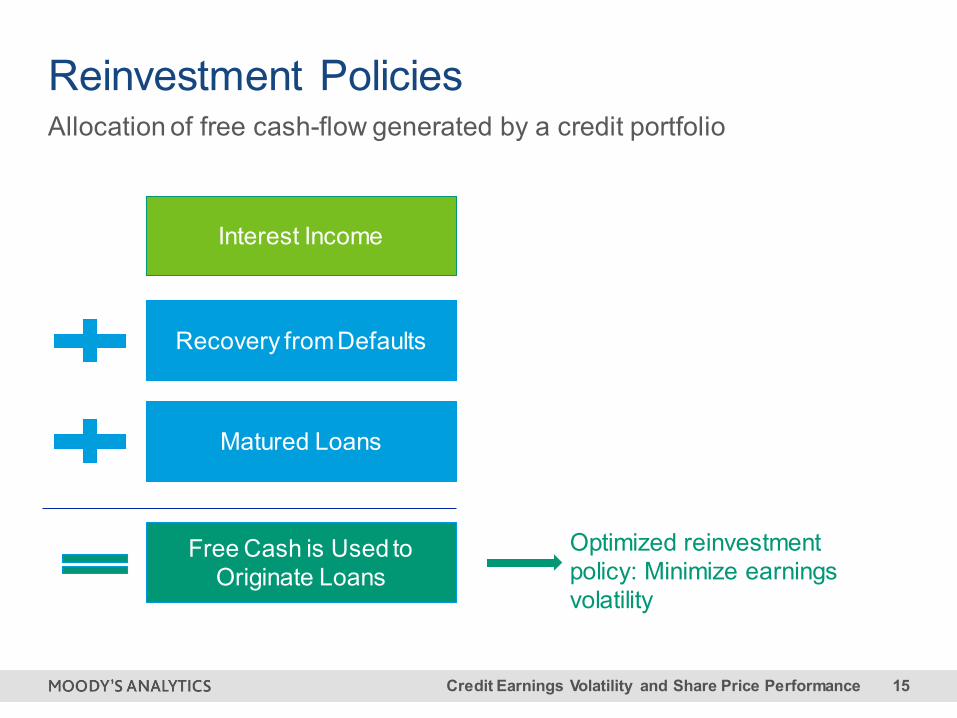
Interest Income
Free Cash is Used to Originate Loans
Recovery from Defaults
Matured Loans
Optimized reinvestment policy: Minimize earnings volatility
Allocation of free cash-flow generated by a credit portfolioReinvestment Policies
Credit Earnings Volatility and Share Price Performance 16
Data for CECL Benchmark PortfoliosSeven US banks’ portfolios from Moody’s CRD/LAS database
» There are seven US banks with data from 2005 to 2016, covering both pre and post crisis periods.
» The benchmark bank portfolios include non-real estate term loans and revolvers that have bank-provided net balance, coupon rates and maturity as well as Moody’s Analytics RiskCalc PDs.
» Loss given default is set to be 25% for secured loans and 45% for non-secured loans.
» Portfolio performance over time is evaluated under CECL rules.
Credit Earnings Volatility and Share Price Performance 17
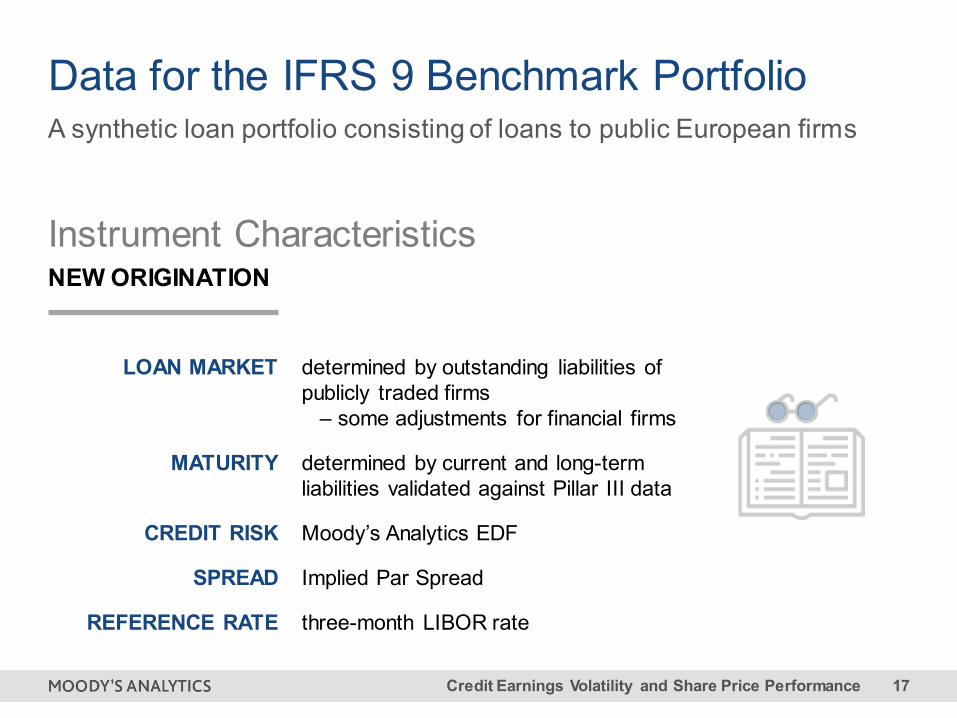
Instrument CharacteristicsNEW ORIGINATION
A synthetic loan portfolio consisting of loans to public European firms
Data for the IFRS 9 Benchmark Portfolio
LOAN MARKET determined by outstanding liabilities ofpublicly traded firms
– some adjustments for financial firms
MATURITY determined by current and long-term liabilities validated against Pillar III data
CREDIT RISK Moody’s Analytics EDF
SPREAD Implied Par Spread
REFERENCE RATE three-month LIBOR rate
Credit Earnings Volatility and Share Price Performance 18
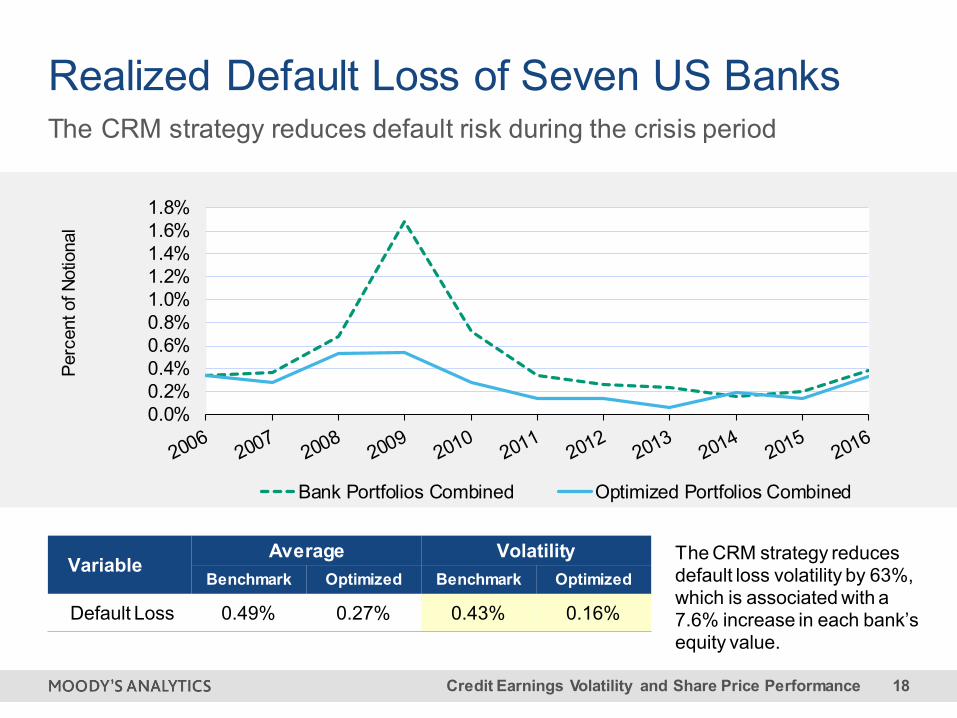
The CRM strategy reduces default loss volatility by 63%, which is associated with a 7.6% increase in each bank’s equity value.
The CRM strategy reduces default risk during the crisis period
Realized Default Loss of Seven US Banks
VariableAverage Volatility
Benchmark Optimized Benchmark Optimized
Default Loss 0.49% 0.27% 0.43% 0.16%
0.0%0.2%0.4%0.6%0.8%1.0%1.2%1.4%1.6%1.8%
Perc
ent o
f Not
iona
l
Bank Portfolios Combined Optimized Portfolios Combined
Credit Earnings Volatility and Share Price Performance 19
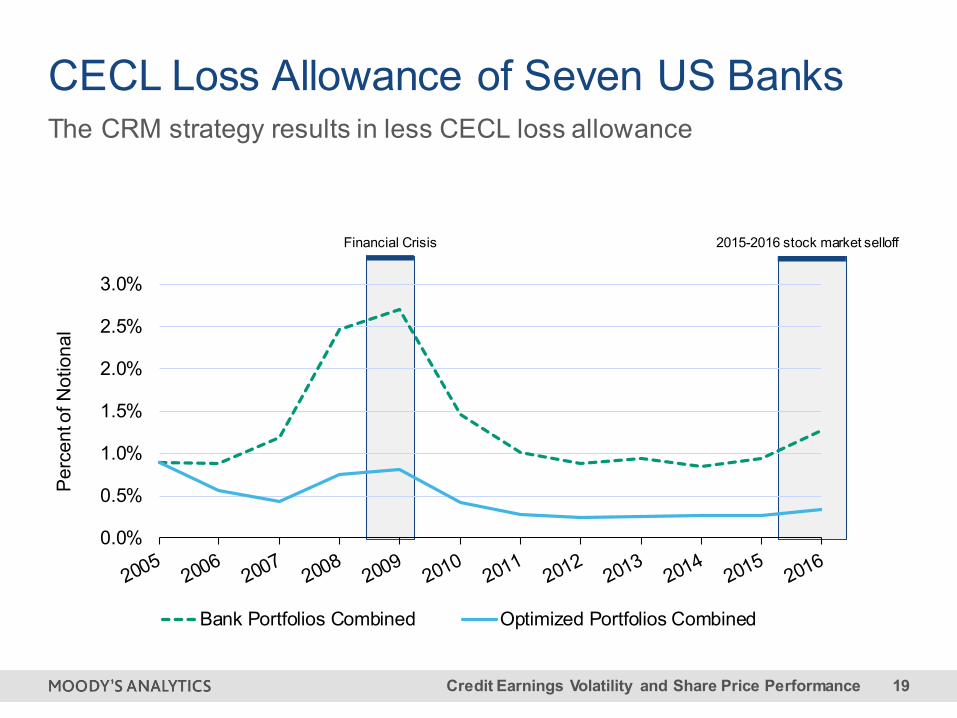
The CRM strategy results in less CECL loss allowance
CECL Loss Allowance of Seven US Banks
Financial Crisis 2015-2016 stock market selloff
0.0%
0.5%
1.0%
1.5%
2.0%
2.5%
3.0%
Perc
ent o
f Not
iona
l
Bank Portfolios Combined Optimized Portfolios Combined
Credit Earnings Volatility and Share Price Performance 20
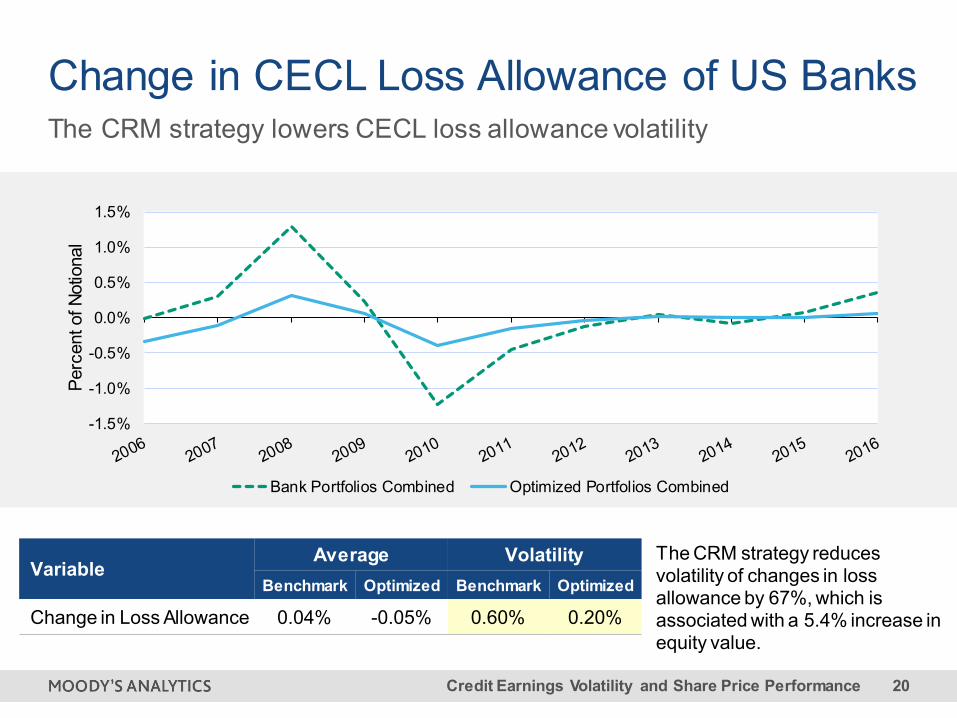
VariableAverage Volatility
Benchmark Optimized Benchmark Optimized
Change in Loss Allowance 0.04% -0.05% 0.60% 0.20%
The CRM strategy lowers CECL loss allowance volatility
Change in CECL Loss Allowance of US Banks
The CRM strategy reduces volatility of changes in loss allowance by 67%, which is associated with a 5.4% increase in equity value.
-1.5%
-1.0%
-0.5%
0.0%
0.5%
1.0%
1.5%
Perc
ent o
f Not
iona
l
Bank Portfolios Combined Optimized Portfolios Combined
Credit Earnings Volatility and Share Price Performance 21
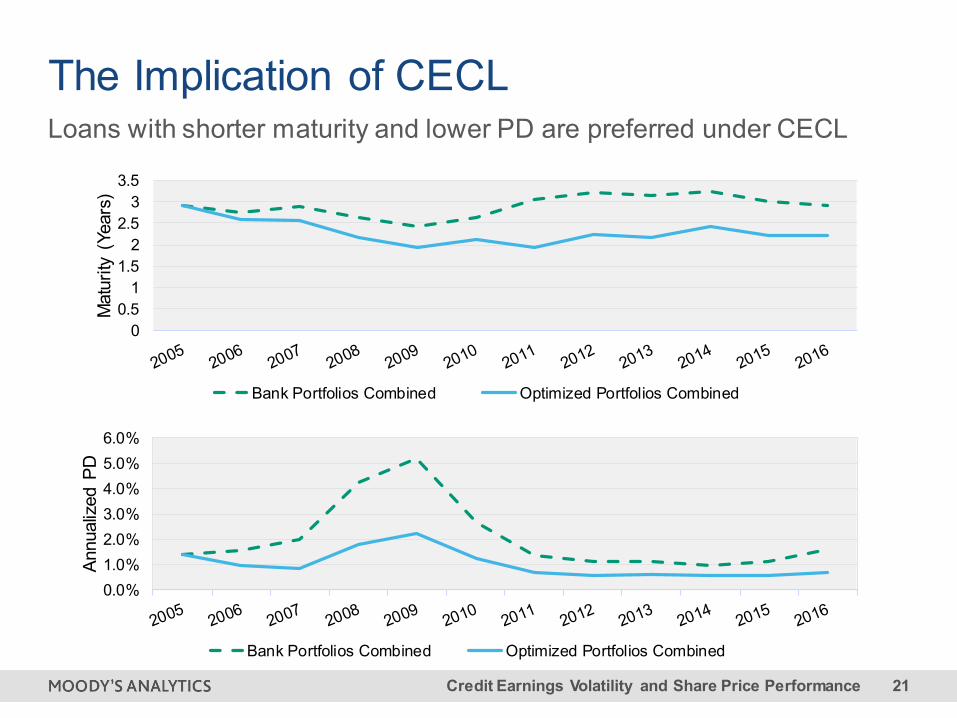
Loans with shorter maturity and lower PD are preferred under CECL
The Implication of CECL
0.0%1.0%2.0%3.0%4.0%5.0%6.0%
Annu
aliz
ed P
D
Bank Portfolios Combined Optimized Portfolios Combined
00.5
11.5
22.5
33.5
Mat
urity
(Ye
ars)
Bank Portfolios Combined Optimized Portfolios Combined
Credit Earnings Volatility and Share Price Performance 22
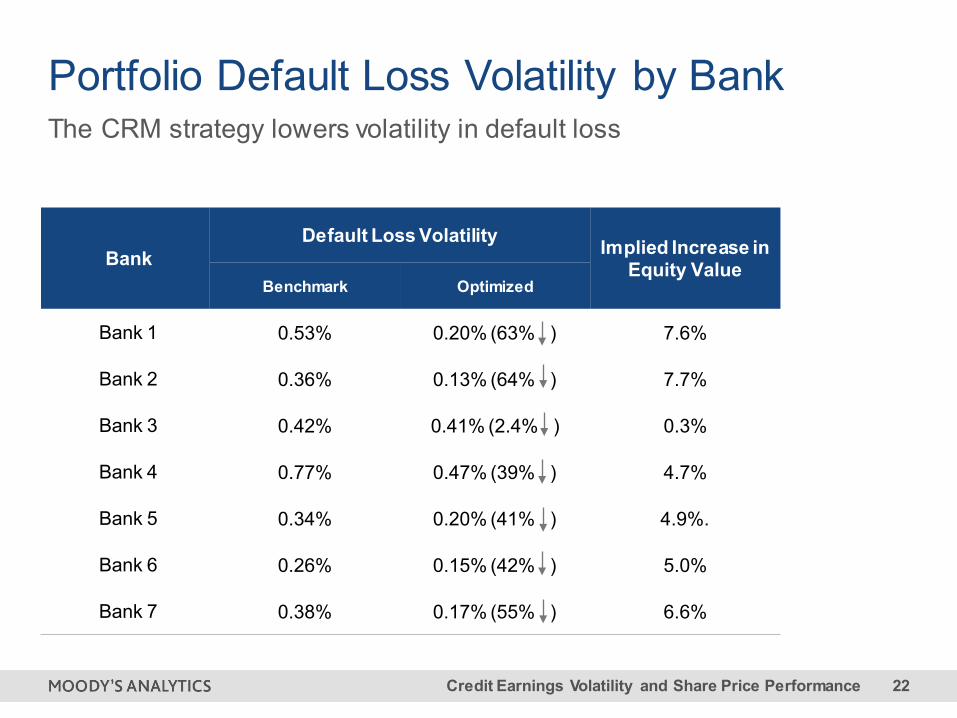
The CRM strategy lowers volatility in default loss
Portfolio Default Loss Volatility by Bank
Bank Default Loss Volatility Implied Increase in
Equity Value Benchmark Optimized
Bank 1 0.53% 0.20% (63% ) 7.6%
Bank 2 0.36% 0.13% (64% ) 7.7%
Bank 3 0.42% 0.41% (2.4% ) 0.3%
Bank 4 0.77% 0.47% (39% ) 4.7%
Bank 5 0.34% 0.20% (41% ) 4.9%.
Bank 6 0.26% 0.15% (42% ) 5.0%
Bank 7 0.38% 0.17% (55% ) 6.6%
Credit Earnings Volatility and Share Price Performance 23
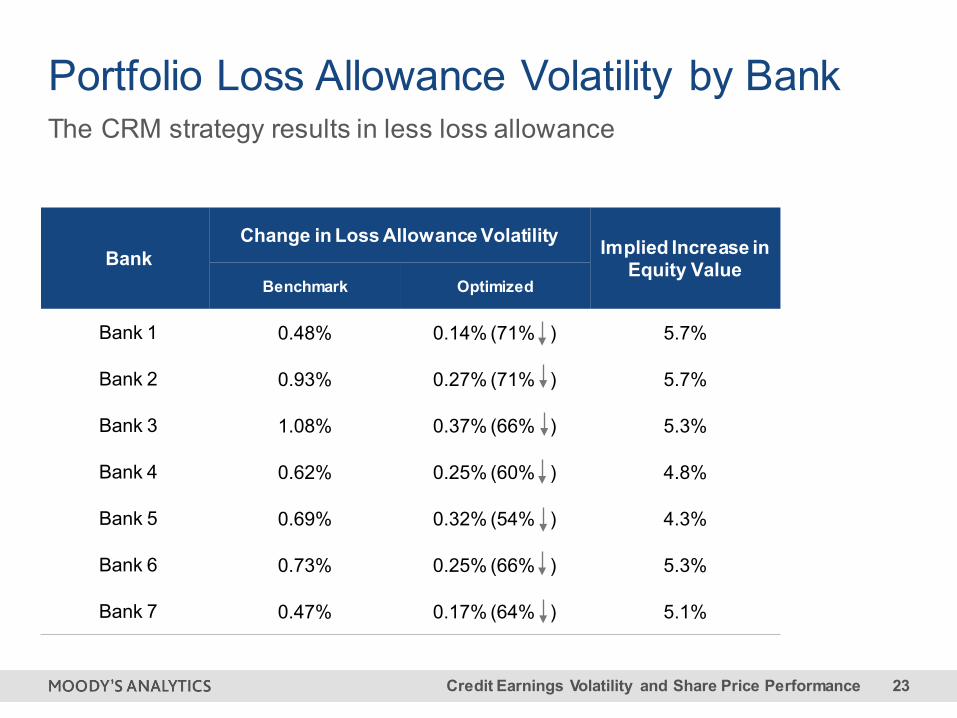
The CRM strategy results in less loss allowance
Portfolio Loss Allowance Volatility by Bank
Bank Change in Loss Allowance Volatility Implied Increase in
Equity Value Benchmark Optimized
Bank 1 0.48% 0.14% (71% ) 5.7%
Bank 2 0.93% 0.27% (71% ) 5.7%
Bank 3 1.08% 0.37% (66% ) 5.3%
Bank 4 0.62% 0.25% (60% ) 4.8%
Bank 5 0.69% 0.32% (54% ) 4.3%
Bank 6 0.73% 0.25% (66% ) 5.3%
Bank 7 0.47% 0.17% (64% ) 5.1%
Credit Earnings Volatility and Share Price Performance 24
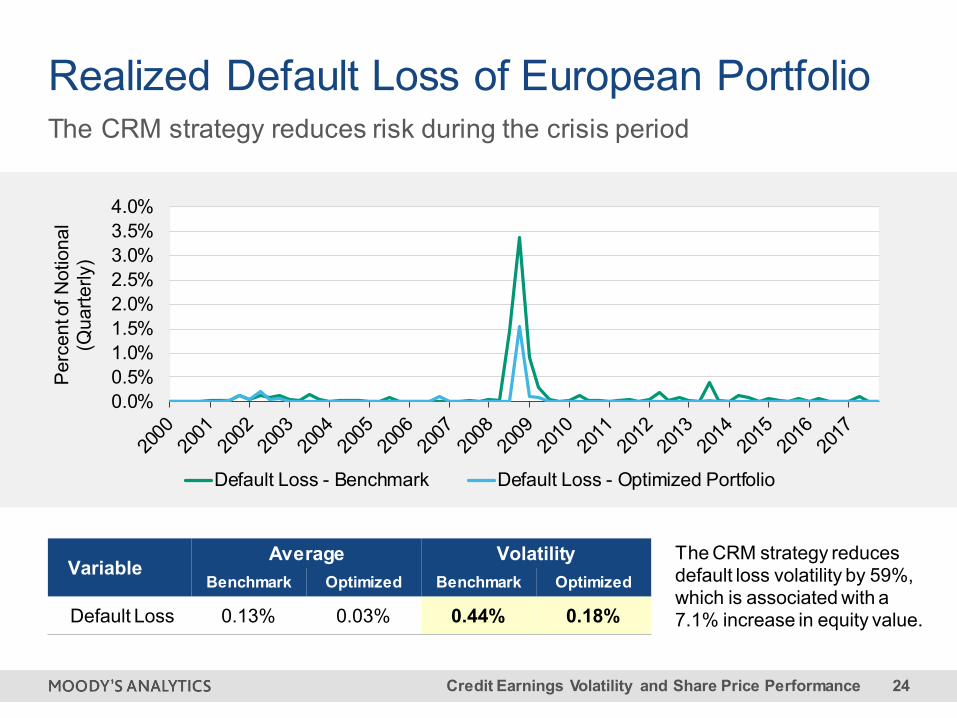
0.0%0.5%1.0%1.5%2.0%2.5%3.0%3.5%4.0%
Perc
ent o
f Not
iona
l (Q
uarte
rly)
Default Loss - Benchmark Default Loss - Optimized Portfolio
The CRM strategy reduces default loss volatility by 59%, which is associated with a 7.1% increase in equity value.
The CRM strategy reduces risk during the crisis period
Realized Default Loss of European Portfolio
VariableAverage Volatility
Benchmark Optimized Benchmark Optimized
Default Loss 0.13% 0.03% 0.44% 0.18%
Credit Earnings Volatility and Share Price Performance 25
0.0%
0.2%
0.4%
0.6%
0.8%
1.0%
1.2%
1.4%
1.6%
Perc
ent o
f Not
iona
l
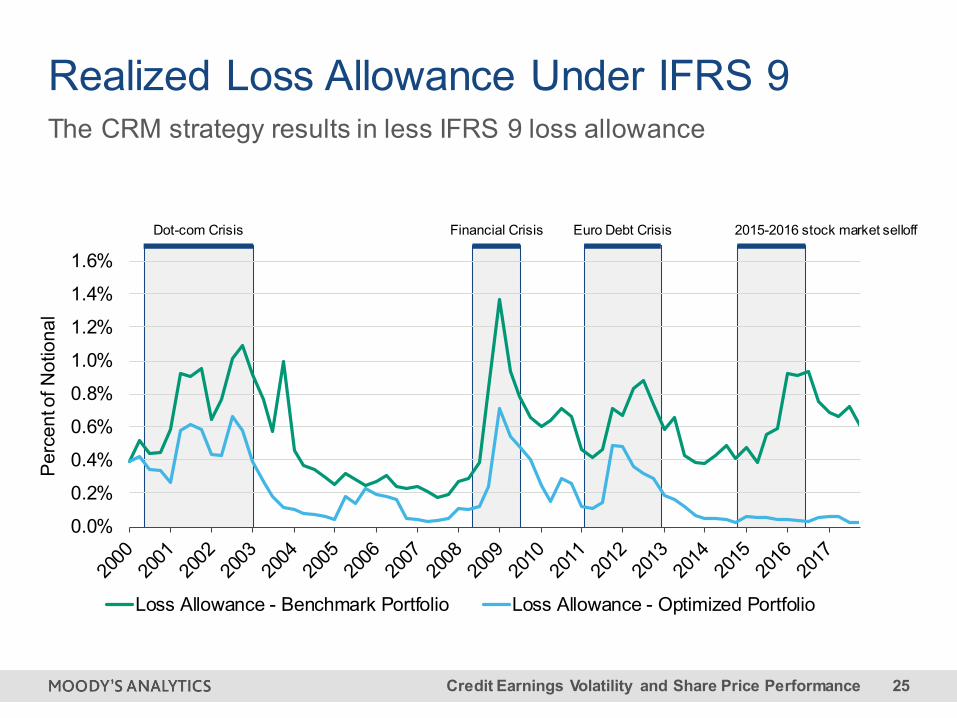
Loss Allowance - Benchmark Portfolio Loss Allowance - Optimized Portfolio
2015-2016 stock market selloffFinancial CrisisDot-com Crisis Euro Debt Crisis
The CRM strategy results in less IFRS 9 loss allowance
Realized Loss Allowance Under IFRS 9
Credit Earnings Volatility and Share Price Performance 26
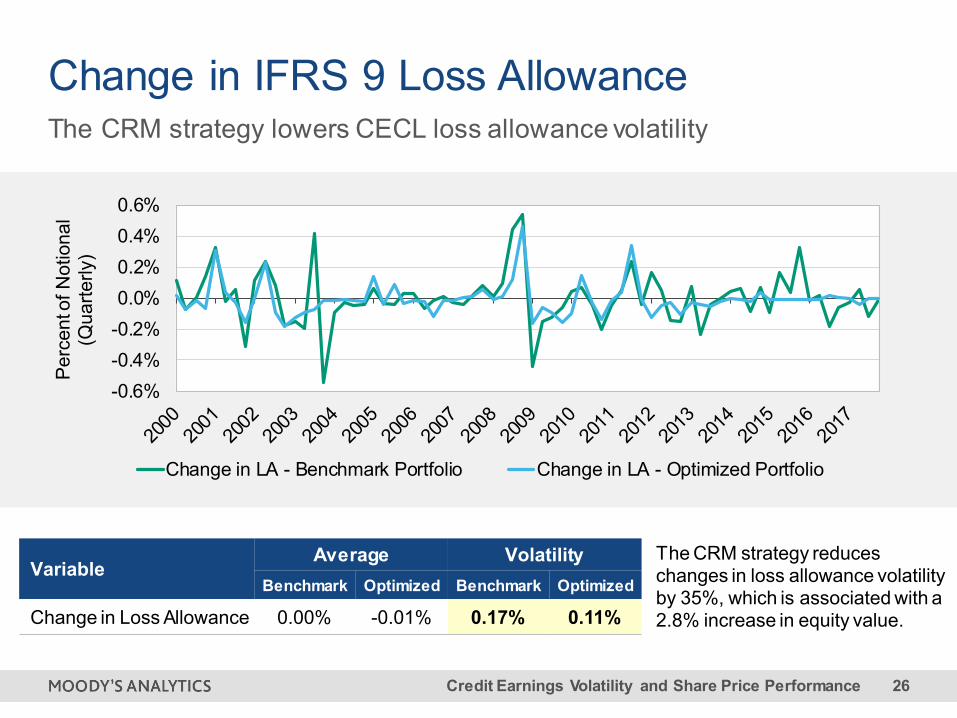
VariableAverage Volatility
Benchmark Optimized Benchmark Optimized
Change in Loss Allowance 0.00% -0.01% 0.17% 0.11%
-0.6%-0.4%-0.2%0.0%0.2%0.4%0.6%
Perc
ent o
f Not
iona
l (Q
uarte
rly)
Change in LA - Benchmark Portfolio Change in LA - Optimized Portfolio
The CRM strategy lowers CECL loss allowance volatility
Change in IFRS 9 Loss Allowance
The CRM strategy reduces changes in loss allowance volatility by 35%, which is associated with a 2.8% increase in equity value.
Credit Earnings Volatility and Share Price Performance 27
0.0%
0.5%
1.0%
1.5%
2.0%
Prob
abilit
y of D
efau
lt
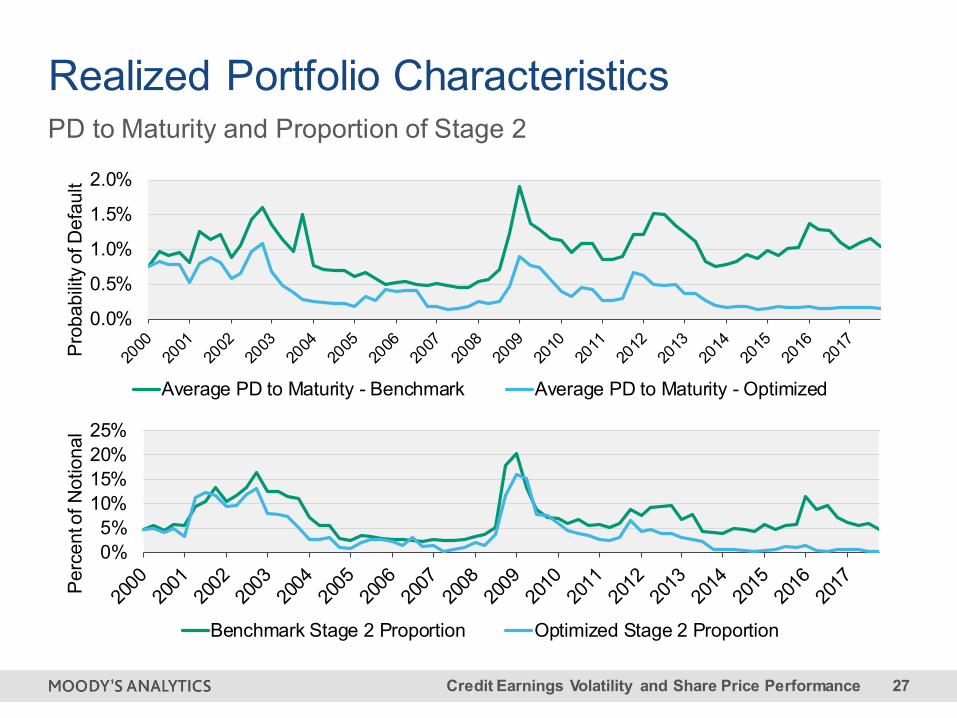
Average PD to Maturity - Benchmark Average PD to Maturity - Optimized
0%5%
10%15%20%25%
Perc
ent o
f Not
iona
l
Benchmark Stage 2 Proportion Optimized Stage 2 Proportion
PD to Maturity and Proportion of Stage 2
Realized Portfolio Characteristics
Credit Earnings Volatility and Share Price Performance 28
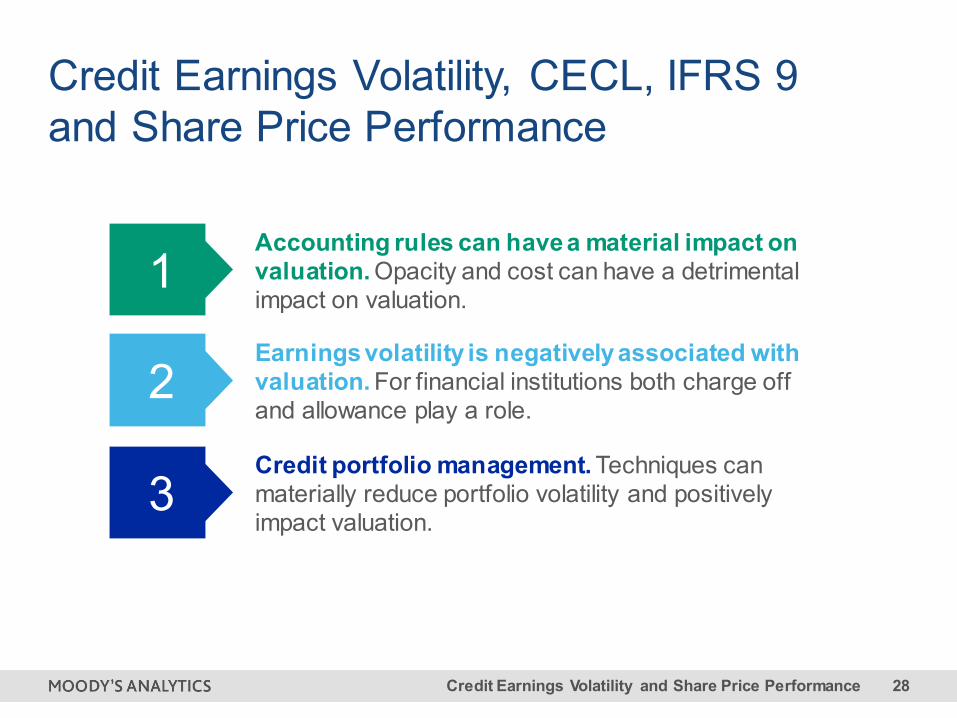
1Accounting rules can have a material impact on valuation. Opacity and cost can have a detrimental impact on valuation.
2Earnings volatility is negatively associated with valuation. For financial institutions both charge off and allowance play a role.
3Credit portfolio management. Techniques can materially reduce portfolio volatility and positively impact valuation.
Credit Earnings Volatility, CECL, IFRS 9 and Share Price Performance

Amnon LevyMoody’s AnalyticsHead of Portfolio and Balance Sheet [email protected]
Pierre XuMoody’s AnalyticsHead of Portfolio Risk [email protected]
moodysanalytics.com
Credit Earnings Volatility and Share Price Performance 31
© 2018 Moody’s Corporation, Moody’s Investors Service, Inc., Moody’s Analytics, Inc. and/or their licensors and affiliates (collectively, “MOODY’S”). All rights reserved.
CREDIT RATINGS ISSUED BY MOODY'S INVESTORS SERVICE, INC. AND ITS RATINGS AFFILIATES (“MIS”) ARE MOODY’S CURRENT OPINIONS OF THE RELATIVE FUTURE CREDIT RISK OF ENTITIES, CREDIT COMMITMENTS, OR DEBT OR DEBT-LIKE SECURITIES, AND MOODY’S PUBLICATIONS MAY INCLUDE MOODY’S CURRENT OPINIONS OF THE RELATIVE FUTURE CREDIT RISK OF ENTITIES, CREDIT COMMITMENTS, OR DEBT OR DEBT-LIKE SECURITIES. MOODY’S DEFINES CREDIT RISK AS THE RISK THAT AN ENTITY MAY NOT MEET ITS CONTRACTUAL, FINANCIAL OBLIGATIONS AS THEY COME DUE AND ANY ESTIMATED FINANCIAL LOSS IN THE EVENT OF DEFAULT. CREDIT RATINGS DO NOT ADDRESS ANY OTHER RISK, INCLUDING BUT NOT LIMITED TO: LIQUIDITY RISK, MARKET VALUE RISK, OR PRICE VOLATILITY. CREDIT RATINGS AND MOODY’S OPINIONS INCLUDED IN MOODY’S PUBLICATIONS ARE NOT STATEMENTS OF CURRENT OR HISTORICAL FACT. MOODY’S PUBLICATIONS MAY ALSO INCLUDE QUANTITATIVE MODEL-BASED ESTIMATES OF CREDIT RISK AND RELATED OPINIONS OR COMMENTARY PUBLISHED BY MOODY’S ANALYTICS, INC. CREDIT RATINGS AND MOODY’S PUBLICATIONS DO NOT CONSTITUTE OR PROVIDE INVESTMENT OR FINANCIAL ADVICE, AND CREDIT RATINGS AND MOODY’S PUBLICATIONS ARE NOT AND DO NOT PROVIDE RECOMMENDATIONS TO PURCHASE, SELL, OR HOLD PARTICULAR SECURITIES. NEITHER CREDIT RATINGS NOR MOODY’S PUBLICATIONS COMMENT ON THE SUITABILITY OF AN INVESTMENT FOR ANY PARTICULAR INVESTOR. MOODY’S ISSUES ITS CREDIT RATINGS AND PUBLISHES MOODY’S PUBLICATIONS WITH THE EXPECTATION AND UNDERSTANDING THAT EACH INVESTOR WILL, WITH DUE CARE, MAKE ITS OWN STUDY AND EVALUATION OF EACH SECURITY THAT IS UNDER CONSIDERATION FOR PURCHASE, HOLDING, OR SALE.
MOODY’S CREDIT RATINGS AND MOODY’S PUBLICATIONS ARE NOT INTENDED FOR USE BY RETAIL INVESTORS AND IT WOULD BE RECKLESS AND INAPPROPRIATE FOR RETAIL INVESTORS TO USE MOODY’S CREDIT RATINGS OR MOODY’S PUBLICATIONS WHEN MAKING AN INVESTMENT DECISION. IF IN DOUBT YOU SHOULD CONTACT YOUR FINANCIAL OR OTHER PROFESSIONAL ADVISER.
ALL INFORMATION CONTAINED HEREIN IS PROTECTED BY LAW, INCLUDING BUT NOT LIMITED TO, COPYRIGHT LAW, AND NONE OF SUCH INFORMATION MAY BE COPIED OR OTHERWISE REPRODUCED, REPACKAGED, FURTHER TRANSMITTED, TRANSFERRED, DISSEMINATED, REDISTRIBUTED OR RESOLD, OR STORED FOR SUBSEQUENT USE FOR ANY SUCH PURPOSE, IN WHOLE OR IN PART, IN ANY FORM OR MANNER OR BY ANY MEANS WHATSOEVER, BY ANY PERSON WITHOUT MOODY’S PRIOR WRITTEN CONSENT.
CREDIT RATINGS AND MOODY’S PUBLICATIONS ARE NOT INTENDED FOR USE BY ANY PERSON AS A BENCHMARK AS THAT TERM IS DEFINED FOR REGULATORY PURPOSES AND MUST NOT BE USED IN ANY WAY THAT COULD RESULT IN THEM BEING CONSIDERED A BENCHMARK.
All information contained herein is obtained by MOODY’S from sources believed by it to be accurate and reliable. Because of the possibility of human or mechanical error as well as other factors, however, all information contained herein is provided “AS IS” without warranty of any kind. MOODY'S adopts all necessary measures so that the information it uses in assigning a credit rating is of sufficient quality and from sources MOODY'S considers to be reliable including, when appropriate, independent third-party sources. However, MOODY’S is not an auditor and cannot in every instance independentl y verify or validate information received in the rating process or in preparing the Moody’s publications.
To the extent permitted by law, MOODY’S and its directors, officers, employees, agents, representatives, licensors and suppliers disclaim liability to any person or entity for any indirect, special, consequential, or incidental losses or damages whatsoever arising from or in connection with the information contained herein or the use of or inability to use any such information, even if MOODY’S or any of its directors, officers, employees, agents, representatives, licensors or suppliers is advised in advance of the possibility of such losses or damages, including but not limited to: (a) any loss of present or prospective profits or (b) any loss or damage arising where the relevant financial instrument is not the subject of a particular credit rating assigned
by MOODY’S.
To the extent permitted by law, MOODY’S and its directors, officers, employees, agents, representatives, licensors and suppliers disclaim liability for any direct or compensatory losses or damages caused to any person or entity, including but not limited to by any negligence (but excluding fraud, willful misconduct or any other type of liability that, for the avoidance of doubt, by law cannot be excluded) on the part of, or any contingency within or beyond the control of, MOODY’S or any of its directors, officers, employees, agents, representatives, licensors or suppliers, arising from or in connection with the information contained herein or the use of or inability to use any such information.
NO WARRANTY, EXPRESS OR IMPLIED, AS TO THE ACCURACY, TIMELINESS, COMPLETENESS, MERCHANTABILITY OR FITNESS FOR ANY PARTICULAR PURPOSE OF ANY SUCH RATING OR OTHER OPINION OR INFORMATION IS GIVEN OR MADE BY MOODY’S IN ANY FORM OR MANNER WHATSOEVER.
Moody’s Investors Service, Inc., a wholly-owned credit rating agency subsidiary of Moody’s Corporation (“MCO”), hereby discloses that most issuers of debt securities (including corporate and municipal bonds, debentures, notes and commercial paper) and preferred stock rated by Moody’s Investors Service, Inc. have, prior to assignment of any rating, agreed to pay to Moody’s Investors Service, Inc. for appraisal and rating services rendered by it fees ranging from $1,500 to approximately $2,500,000. MCO and MIS also maintain policies and procedures to address the independence of MIS’s ratings and rating processes. Information regarding certain affiliations that may exist between directors of MCO and rated entities, and between entities who hold ratings from MIS and have also publicly reported to the SEC an ownership interest in MCO of more than 5%, is posted annually at www.moodys.com under the heading “Investor Relations — Corporate Governance — Director and Shareholder Affiliation Policy.”
Additional terms for Australia only: Any publication into Australia of this document is pursuant to the Australian Financial Services License of MOODY’S affiliate, Moody’s Investors Service Pty Limited ABN 61 003 399 657AFSL 336969 and/or Moody’s Analytics Australia Pty Ltd ABN 94 105 136 972 AFSL 383569 (as applicable). This document is intended to be provided only to “wholesale clients” within the meaning of section 761G of the Corporations Act 2001. By continuing to access this document from within Australia, you represent to MOODY’S that you are, or are accessing the document as a representative of, a “wholesale client” and that neither you nor the entity you represent will directly or indirectly disseminate this document or its contents to “retail clients” within the meaning of section 761G of the Corporations Act 2001. MOODY’S credit rating is an opinion as to the creditworthiness of a debt obligation of the issuer, not on the equity securities of the issuer or any form of security that is available to retail investors. It would be reckless and inappropriate for retail investors to use MOODY’S credit ratings or publications when making an investment decision. If in doubt you should contact your financial or other professional adviser.
Additional terms for Japan only: Moody's Japan K.K. (“MJKK”) is a wholly-owned credit rating agency subsidiary of Moody's Group Japan G.K., which is wholly-owned by Moody’s Overseas Holdings Inc., a wholly-owned subsidiary of MCO. Moody’s SF Japan K.K. (“MSFJ”) is a wholly-owned credit rating agency subsidiary of MJKK. MSFJ is not a Nationally Recognized Statistical Rating Organization (“NRSRO”). Therefore, credit ratings assigned by MSFJ are Non-NRSRO Credit Ratings. Non-NRSRO Credit Ratings are assigned by an entity that is not a NRSRO and, consequently, the rated obligation will not qualify for certain types of treatment under U.S. laws. MJKK and MSFJ are credit rating agencies registered with the Japan Financial Services Agency and their registration numbers are FSA Commissioner (Ratings) No. 2 and 3 respectively.
MJKK or MSFJ (as applicable) hereby disclose that most issuers of debt securities (including corporate and municipal bonds, debentures, notes and commercial paper) and preferred stock rated by MJKK or MSFJ (as applicable) have, prior to assignment of any rating, agreed to pay to MJKK or MSFJ (as applicable) for appraisal and rati ng ser vices render ed by it fees ranging from JPY200,000 to approximatel y JPY350,000,000.
MJKK and MSFJ also maintain policies and procedures to address Japanese regulatory requirements.