Embed Size (px)
Citation preview
Credit Market Innovations and Sustainable Homeownership: The Case of Non-Traditional Mortgage Products
Arthur Acolin University of Southern California
Raphael W. Bostic University of Southern California
Xudong An San Diego State University
Susan M. Wachter University of Pennsylvania
March 2015
This paper was prepared for the 2015 Federal Reserve System Community Development
Conference, held in Washington D.C. in April 2015.

Acoca, et al., Non-traditional mortgages
It has long been recognized that homeownership is a primary vehicle for household
wealth building in the United States. For most households, purchasing a home using
available liquid resources is not possible, meaning that homeownership is achievable only
through the use of credit. Thus, developments in the credit market can have an important
impact on attainment of homeownership and the ability of a household to sustain
homeownership. This paper focuses on one such development – the increased prevalence
of non-traditional mortgage products during the 2000s.
Non-traditional mortgage products (NTMs) are mortgages with features that make
them distinct from the typical conventional conforming or government-insured mortgage
products. While there is no standard definition of non-traditional mortgage products,
many view option adjustable rate mortgages (ARMs), negative amortization loans, and
interest only loans, among others, as products falling into this category. These products
increase the number of options that prospective homebuyers have for financing their
purchase, and are widely believed to help expand access to credit.
The prevalence of NTMs expanded dramatically during the 2000s, in concert with a
general increase in mortgage lending activity. While annual new home purchase
mortgage originations increased by 1.6 million loans between 2002 and 2006, the volume
of NTMs increased from 200,000 to 1.8 million (FFIEC; author calculations). By 2006,
NTMs represented about 30 percent of all home purchase mortgage originations, with
lending activity concentrated geographically such that they comprised more than 50
percent of all originations in some markets.
The outstanding question is what role NTMs played regarding homeownership
attainment and retention. The question arises because homeownership rates did not
2

Acoca, et al., Non-traditional mortgages
increase during the period of greatest NTM penetration; rather, the rate peaked at 69
percent in 2004 and remained at that level through 2006. A second reason the question
arises is because NTMs have features that are associated with higher levels of risk, such
that unexpected developments can quickly result in default and foreclosure. Given the
experiences during the housing bust, a natural question is whether NTMs were associated
with sustainable homeownership or a more fleeting form of homeownership particularly
vulnerable to many types of shocks. We seek to help provide clarity regarding both of
these issues.
This question is important because, as we continue to reform the United States’
mortgage finance system, there will be on-going discussions about the place for product
and process innovations. Indeed, recent regulatory actions reflect a view, shared by many,
that innovations such as NTMs were problematic. For example, in order to qualify for the
qualified mortgage’s safe harbor established via the Dodd-Frank financial reform
legislation, a loan must not feature negative amortization, be interest only, or be no
documentation (Regulation Z). The current research seeks to provide information that
either support or add nuance to how one should think about financial market innovations,
and thereby help provide a perspective that can inform discussions regarding innovations
yet to be seen.
We find that NTMs are associated with different effects through the business cycle,
with higher levels of NTM activity being associated with elevated homeownership during
the housing boom and more depressed homeownership during the bust. However, these
effects are not uniform across the country. In particular, while all types of metropolitan
areas experienced the positive boom relationship, only those metropolitan areas with high
3

Acoca, et al., Non-traditional mortgages
population and home value growth showed the negative relationship during the bust.
This suggests that people choosing in markets with strong demand and price pressures
ended up in a more precarious position that was not sustainable as the economy
deteriorated.
We also test for whether there is evidence consistent with the notion that NTMs eased
credit constraints for those often thought to be most subject to them, namely young first-
time homebuyers and minority households. The patterns we observe do not suggest this.
Rather, they suggest that the mortgage credit dynamic is very different in minority
communities, such that financial market innovations are not as effective as in the broader
population.
The first section of this paper reviews the literature on the link between credit supply
and homeownership in particular as it applies to the recent housing cycle. Section II
presents the data and the empirical approach. Section III describes and interprets the
results on the relation between NTMs and homeownership. Section IV discusses the
policy implications and concludes.
I. Credit Market Innovations and Homeownership
Innovations in the housing finance sector have the potential to increase access to
homeownership by increasing the efficiency of the allocation of capital to the housing
sector, resulting in lower cost of credit and expanded access for borrowers. Credit is
available only to borrowers with credit risk profiles above some threshold level, where
credit risk is assessed along a number of underwriting dimensions. The literature has
highlighted three key dimensions – wealth, income, and credit quality – and documented
4
Acoca, et al., Non-traditional mortgages
that underwriting standards introduce constraints for each that limit borrower access to
credit (Linneman and Wachter, 1989; Bostic, Calem, and Wachter, 2005).
Economic theory suggests that credit rationing beyond that caused by standard
underwriting rules is possible when there are information asymmetries between lenders
and borrowers, such that lenders limit the number of loans they make out of a fear of
adverse selection. For example, borrowers can have information about the causes of prior
credit repayment troubles that lenders might not have, and this information could provide
insights regarding the likelihood of future repayment problems. From a lender
perspective, this dynamic means that there is likely to be some borrowers who will accept
a mortgage at a given interest rate that pose risks greater than the interest rate would
imply. Stiglitz and Weiss (1981) show that lenders can rationally respond to such
potential adverse selection by rationing credit.
Credit market innovations, including the introduction of new mortgage products and
underwriting processes, have the potential to remove certain constraints, potentially
resulting in increased access to mortgages and, by extension, homeownership. There is a
rich history of innovation in mortgage markets, and the evidence suggests they have
achieved exactly this. From 1940 to 1965, the US homeownership rate rose from 44
percent to 63 percent (Fetter 2011). The evidence suggests that, along with favorable
demographic trends, rapid economic growth, and suburbanization, the expansion of the
mortgage market was an important factor in this evolution. In particular, the availability
of long-term fixed-rate fully amortizable mortgage products with down payments of 20
percent or less contributed to increase access to homeownership for younger households
by enabling them to smooth their housing consumption over the life cycle (Fetter, 2011).
5

Acoca, et al., Non-traditional mortgages
Fetter (2011) estimates that up to 40 percent of the increase in homeownership over this
period can be explained by changes in the mortgage market.
NTMs are another class of financial innovations in the mode of the long-term fully
amortizing fixed rate mortgages. The products considered to be NTMs all serve to ease
constraints in the market that limit access to credit. For example, interest only and
negative amortization mortgages ease income constraints by allowing borrowers to pay
less than the rate required to cover the accrued interest plus principal.1
Similarly, zero
down payment loans remove the wealth constraint, as borrowers no longer need to have
sufficient wealth to be able to afford a down payment.
Unlike the 30-year fixed-rate mortgage, though, NTMs carry additional risk factors
that make borrower repayment over the long-term more tenuous. For example, many of
these products feature interest rates that can adjust rather than remain fixed. For such
loans, monthly payments can rise significantly if interest rates increase, meaning there
can be an elevated risk that a borrower’s income will not be sufficient in the future.
Option-ARMs and negative amortization mortgages feature risks in that successful
navigation of these products often involves refinancing. Thus, borrowers who take on
these mortgages are susceptible to liquidity risk, or the risk that credit will not be
available for refinancing.2
Some have coined these additional risks as a source of
instrument risk (Bostic and Lee, 2008).
Evidence clearly indicates a relationship between the prevalence of NTMs and home
prices during the 2000s. A number of papers that have conclusively linked NTMs and
changes in house prices over that period (Adelino et al 2012; Duca et al 2011; Goodhart
1 In the former case, a borrower only pays the interest while in the latter the borrower can pay less than the
accrued interest, with the residual amount being added to the principal. 2 This was a major source of risk during the Great Depression
6

Acoca, et al., Non-traditional mortgages
and Hofman 2008). In particular, a number of papers show a causal impact of the supply
of NTMs and subprime lending on changes in house prices, resulting in higher price
volatility in areas with more of such lending as they experienced larger price increases
during the boom and larger declines during the bust (Coleman et al 2008; Goetzman et al
2012; Pavlov and Wachter 2011; Sanders 2008).
However, these observations regarding house price dynamics do not provide an
unambiguous picture regarding homeownership. There are at least two reasons why this
is so. First, the rapid increase in prices that accompanied the increased presence of
NTMs could have offset some of the affordability benefits that NTMs provide, meaning
that ownership attainment was not enhanced through the products. Second, elevated
instrument risk for NTMs implies that, in addition to house price dynamics, an important
consideration is homeownership sustainability, and the elevated risk could be associated
with less sustained ownership and consequently no significant change in the amount of
homeownership in the population.
The next section presents the data and the estimation strategy used to try to identify
with more clarity the relationship between NTMs and homeownership.
II. Empirical Strategy and Data
To explore these questions, we employ a straightforward strategy. We tally the
prevalence of NTMs in a county and observe whether there is any association between
NTM prevalence in that county, measured in several ways, and homeownership.
Specifically, we estimate models where we regress homeownership on a set of control
variables plus NTM prevalence, with the coefficient on this latter variable our coefficient
7
Acoca, et al., Non-traditional mortgages
of interest. We look at this from 2005 to 2013, and thus cover the latter years of the
housing boom, the housing bust, and beyond.
Because no single database includes all the information required to conduct this sort
of analysis, we combined information from several data sources to create a single unified
dataset. Annual county-level data on homeownership and homeownership rates was
obtained using the Census Bureau’s American Communities Survey (ACS). Annual ACS
data are only available at the county level and for counties with more than 65,000
residents for confidentiality purposes. The dataset contains all 743 counties for which
there are annual data available for the period 2006-2013. This is our sample frame. This
sample covers about 80 percent of all households, despite the fact that it represents less
than a quarter of the US 3,144 counties.3
We define three dependent variables: the
number of homeowners in a given county in a given year; the county homeownership rate
in a given year; and the change in the number of homeowners year-over-year and over
various periods.
Regarding mortgages, we compiled data from two sources. First, we use the
BlackBox dataset on private label securities (PLS) to count the number of NTMs
originated in a county in a given year. BlackBox data has detailed information about
more than 14 million first-lien loans originated between 1998 and 2013 that were
securitized in PLS. We believe that the BlackBox data are representative of the universe
of NTMs because most NTMs were securitized via PLS, though some mortgage
originators kept NTM loans on portfolio. Moreover, estimates of NTM loan volumes
3 Our sample is therefore biased toward large metropolitan counties.
8

Acoca, et al., Non-traditional mortgages
using BlackBox conform to estimates using other data sources.4
In addition, there is no
evidence suggesting that NTMs kept on portfolio have a different spatial distribution than
those securitized in PLS. Given that there is no official definition of NTMs, we choose
one and apply it to the BlackBox data. For this paper, a loan is classified as an NTM if it
is a mortgage to purchase an individual unit (condo, co-op, single family) and has any of
the following characteristics: (i) interest only, (ii) Option-ARM with negative
amortization, (iii) balloon payment, (iv) prepayment penalty, (v) low or no
documentation, (vi) terms longer than 30 years, or (vii) combined loan to value ratio at
origination above 100 percent.
Our second mortgage-related data source is data collected pursuant to the Home
Mortgage Disclosure Act (HMDA data). Banking and other institutions that make
decisions on whether to originate a mortgage are required to report on all mortgage
applications they receive. These data are collected on annual basis and provide a good
snapshot of mortgage origination activity nationwide and at small geographies.5
We use
the HMDA data to tally total mortgage volume in a county in a given year. Together, the
BlackBox and HMDA data allow us to calculate the NTM share of all mortgages in a
county in a given year, which will be a key variable of interest.
Figure 1 shows how NTM origination volumes evolved from 1997 through 2010.
After being a very minor product through 2000, never totaling more than 50,000 loans,
the market saw an explosion in NTM incidence. NTM volume doubled each year from
2001 to 2004, and annual NTM origination volume doubled again between 2004 and
4 For example, we estimate that 30 percent of mortgages issued in 2006 were NTMs, a figure identical to
the proportion reported in Sanders (2008) using CoreLogic data and close to the 32 percent reported in Inside Mortgage Finance (2013). 5 Avery, et al. (2011) estimates that HMDA data cover more than 80 percent of the total mortgage origination market.
9

Acoca, et al., Non-traditional mortgages
2006. After 2006, though, the use of NTMs dropped precipitously, as the housing crisis
and the Great Recession that ensued resulted in a rapid change in supply and demand for
NTMs across the nation. By 2010, less than 100 NTMs were originated for the entire
year. By the end of our study period, this product type had not made a comeback.
The rise of NTM incidence during the early 2000s was coupled with a rise in the
prevalence of NTMs (figure 2). NTMs were a tiny fraction of all mortgages originated
from 1997 and 2001, and only first exceeded a 5 percent market share in 2003. However,
the mortgage market share for NTMs rose rapidly after 2003 and topped out at about 27
percent in 2006. This rise is all the more dramatic because total mortgage lending grew
by more than 2 million loans (about 40 percent) between 2001 and 2005, while NTMs
increased from less than 100,000 to more than 1,5 million over the same period meaning
that much of the increase is attributable to the rise of NTMs. These aggregate volume
data suggest that it is unlikely that NTMs played a large role in rising homeownership
leading up to the 2000s, but their more significant presence after 2003 raises the
possibility that they were an important vehicle in the years after that.
Looking at the NTMs in our dataset, it is first important to recognize that NTMs are a
complex group of loans. While we noted 7 distinct characteristics a mortgage could have
to be included as an NTM, many loans originated during this period had multiple
qualifying features. Table 1 shows how the mortgages in our sample are distributed
along this metric. We see that a majority of the loans had at least 2 features and a
significant fraction had more than 4 features.
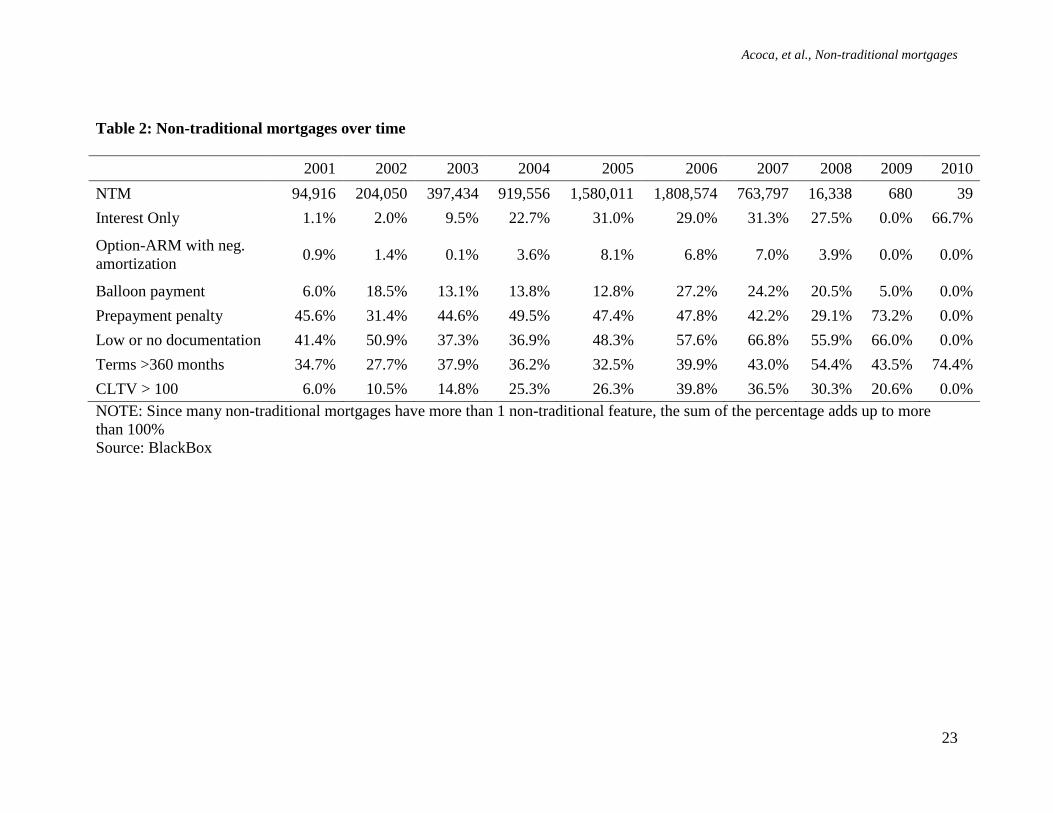
Table 2 provides a sense of which features were most common among NTMs in our
sample by reporting the fraction of NTMs in a given year that had a particular feature.
10

Acoca, et al., Non-traditional mortgages
We see that low or no documentation and prepayment penalties were common features in
every year. By contrast, between 2001 and 2006 we see large growth in the incidence of
interest only mortgages, and high CLTV at origination. Option-ARMs with negative
amortization were consistently the least common feature during this period.
When looking at the distribution of NTMs over time and across space, we observe
substantial variations across counties (figure 3). As of 2003, NTMs represented more
than 20 percent of mortgages in only a few places, specifically California counties
concentrated in the San Francisco and Los Angeles metropolitan areas. This changed
significantly during 2004 and 2005, when NTM origination grew significantly in the sand
states – Florida, Arizona, Nevada, and California – as well as in high cost markets on the
east and west coasts. As seen in the second panel of figure 3, by 2006 the NTM
origination share exceeded 20 percent in many counties, with proportions exceeding 40
percent in nearly 20 counties. Several California counties even exceeded 60 percent NTM
shares in 2006. Among the top 50 counties ranked by their NTM share of all purchase
originations in 2006, 37 were located in California, 5 were in in Florida, 4 were in the
Washington, DC metropolitan area, 2 were in the New York City metropolitan area, and
1 each was located in Hawaii and Nevada. While there was a significant NTM presence
in these areas, it is useful to note that NTMs were also a substantial share of the market in
counties in a number of other markets across the country, including Detroit, Chicago,
Houston, and Dallas. At the same time, NTM incidence was not uniform during this
period. County with the median NTM share had a share of less than 20 percent in 2006,
and many markets in the lowest NTM share decile had percentages of less than 10
percent.
11

Acoca, et al., Non-traditional mortgages
The final panel of figure 3 shows NTM origination activity during 2008, after the
NTM boom had effectively ended. Not surprisingly, very few counties show a significant
NTM share of originations. NTMs continued to be originated across much of the nation,
though.
As a final descriptive table, table 3 compares the geographic distribution of the
features of NTMs. To create this table, we ranked counties according to the frequency of
a given feature and then calculated the correlation coefficient of pairwise rankings. This
answers the question of whether, for example, mortgages with high CLTV have the same
geographic distribution as balloon payments. We find many product features are
distributed similarly across counties. Correlation coefficients exceeding 0.90 were found
for low and no documentation and extended loan term, low and no documentation and
interest only and between balloon payments and high CLTV. Among the NTM features,
option ARM and high CLTV had geographic distributions that were least alike, although
a correlation coefficient of 0.58 is still generally high.
We follow the literature on homeownership as a guide for including control variables
in our homeownership model (Gabriel and Rosenthal, 2005; Gabriel and Rosenthal,
2015). Controls are included to account for socio-demographic, job market, and housing
market factors that have been shown to be associated with changes in homeownership.
Our dataset includes a vector of county-level demographic variables collected from the
ACS, including population, mean household size, percent of family with children, percent
Black, percent Hispanic, percent foreign born, percent with some college education.
Regarding job market conditions, we include median household income from the ACS
and the annual unemployment rate from the Bureau of Labor Statistics.
12

Acoca, et al., Non-traditional mortgages
For housing market factors, we include from the ACS median house value, the ratio
of the median rent and median house value, and the ratio of the median house value and
median income. We also use the MSA-level house price index from the Federal Housing
Finance Agency to construct variables measuring house price volatility over the last 5
years and a projected 1-year forward house price change, to account for past house price
performance and future expectations.6
Finally, we include dummy variables for whether
a county is in an MSA and whether it is suburban.7
III. Results
Our first test is a simple estimation of the relationship between NTM activity and
homeownership over our entire sample period (table 4). 8
The result shows that, after
controlling for county characteristics, NTM activity is associated with an increase in the
number of homeowners in a county between 2000 and 2012. Here, we use an aggregate
measure of the number of NTMs originated during the 2001 to 2006 period and the
regression indicates that each 10 additional NTM loans originated is associated with 6
additional homeowners. This finding, that NTM activity is positively associated with
homeownership is surprising and runs counter to the narrative that exists regarding the
role of NTMs in housing markets.
6 House price volatility is calculated as “the variance of the five-year percentage change in the price index
across 13 years of quarterly values” (Gabriel and Rosenthal, 2015: 11). The 1-year forward expected percentage change in house prices is estimated using metropolitan-level (or non-MSA part of the state) coefficients of an AR(5) regression of the FHFA HPI for the period 1980-2014. Both approaches follow Gabriel and Rosenthal (2015). 7 These are defined by the Office of Management and Budget.
8 We present results using the aggregate number of NTMs originated during 2001-2006 as the key variable
of interest. We also considered using a lag structure and have run all the analyses using up to 8 period lags. We further re-estimated the relationships using the maximum NTM share in a county over the cycle as the key independent variable. The results are robust to these alternative specifications.
13

Acoca, et al., Non-traditional mortgages
We find a somewhat different result when we use an alternative measure of NTM
activity – the percentage of all mortgages in the county that were NTMs. This is a
measure of NTM penetration, and is an indicator of the importance of NTMs in a market.
Using this measure, we see in the second column of table 4 that NTMs activity is
positively associated with homeownership, but this relationship is not statistically
significant. The lack of a significant relationship between NTM penetration and
homeownership is also somewhat surprising, given the evidence regarding the strong
effect of NTMs on house price volatility.
The analyses include state and MSA fixed effects to control for variation in state and
regional circumstances that might bias estimates of the NTM relationship. We show in
Appendix A that a likelihood ratio test indicates that inclusion of the fixed effects
improves model fit but does not affect the sign and magnitude of the coefficients of
interest. For the remainder of this section, we therefore present results that include
specific state- and MSA-level characteristics (i.e., sand state indicators) in lieu of fixed
effects, though we do cluster standard errors at the MSA level.
Given the important change in the housing market that occurred in late 2006, we first
divide the sample into two periods: 2000 to 2006 (the boom) and 2006 to 2012 (the bust).
Table 5 shows the results for the boom and bust periods.
During the boom period, increased NTM activity is associated with more
homeowners, whether NTM activity is measured in number of loans or penetration. The
point estimate using number of loans is about the same as that for the entire period (table
5). The penetration result indicates that a 1 percentage point increase in the NTM share is
14
Acoca, et al., Non-traditional mortgages
associated with 482 more homeowners, and the estimate is statistically significant. This
result differs from the result obtained for the full period, where this is not significant.
The results of the analysis focusing on the bust period are shown in the last two
columns of table 5. Here we see that an opposite relationship between NTM activity and
homeownership prevailed during the bust. While the number of NTM loans was
associated with an increase in the number of homeowners in the boom, it was associated
with a decline in the number of homeowners between 2006 and 2012. This is consistent
with the volatility result seen in the literature. Interestingly, though, the magnitude of this
negative relationship is far smaller than the magnitude of the positive relationship during
the boom. An additional 10 NTM loans in a county was associated with 1 less
homeowner in that county. Similarly, when one looks at NTM penetration, we observe a
smaller number of homeowners for a given level of penetration than during the boom
period. This reduction helps explain why we do not observe a statistically significant
relationship looking at the entire sample period.
Given these observed relationships and possible explanations, we run a series of
alternative tests to distinguish among them. In particular, we run 3 tests. First, we
explore whether there are significant differences between the relationship of NTM
activity and homeownership in places with high population growth and high house price
growth as compared with other places. This is a test of whether the NTM-
homeownership relationship is sensitive to how local demand and pricing pressures vary
in local markets and, if so, how this variation flowed through borrower choices for NTMs
and outcomes for homeowners. The second test looks at whether the results are different
for sand states relative to other locations. There was a wide recognition that much of the
15

Acoca, et al., Non-traditional mortgages
volatility and distress in housing centered in the sand states (Arizona, California, Florida,
Nevada), and the evidence discussed above clearly shows that NTM activity was more
intensely focused in these places. So we explore whether the NTM dynamic was
different in these areas. Third, we look at whether the NTM relationship was particularly
strong among minority families and first-time homebuyers, two populations for which we
would expect income and wealth constraints to be most binding. To the extent that NTMs
serve to relieve these constraints, we might expect to see the strongest effects among
these groups.
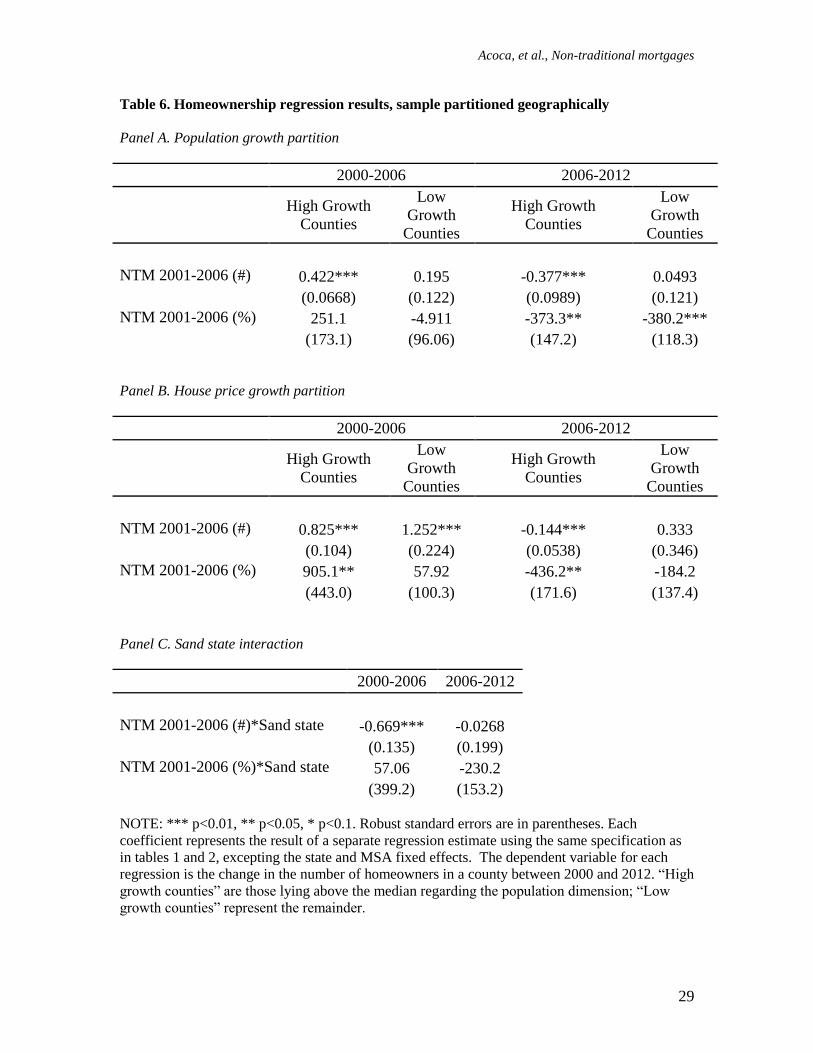
For the first test, when we stratify the sample based on population and house value
growth, we find the NTM-homeowner relationship to be the same as observed for the full
sample but stronger in areas experiencing both high population and house value growth
(table 6). These areas saw NTM activity positively associated with homeownership
during the boom and negatively associated with ownership during the bust, and the
relationship holds for both of our measures of NTM activity. Interestingly, for other
areas, the NTM-homeownership relationships are largely not statistically significant and
smaller in magnitude, especially during the downturn. This pattern of results is
consistent with the notion that under normal market conditions NTMs can be a positive
innovation. However, they also suggest that in markets with strong local demand and
significant pricing pressures NTMs can be an accelerator, providing a “last resort” means
of accessing mortgage credit for borrowers that results in homeownership that is not
sustainable. In these latter markets, this lack of sustainability means that there are few
net gains to ownership if any are observed at all.
16

Acoca, et al., Non-traditional mortgages
Our second test takes this analysis further, by trying to establish whether there is a
similar distinction between markets in sand states and other markets by interacting a
dummy for a county being in a sand state with the measures of NTM activity. The results,
shown in the final columns of table 6, suggest that during the boom the association
between NTM activity and homeownership was stronger in the sand states with both
measures but not during the bust, being more negative, but not significantly so.
The final set of tests evaluates the extent to which NTMs appear to have been an
effective vehicle for easing market constraints. For this test, we use percentage of
homeowners with a household head younger 35 years of age as a proxy for first time
homebuyers, based on the idea that young homeowners are unlikely to have been in
multiple homes. The results, shown in the first column of table 7, indicate that there is a
positive relationship between NTM activity and first time homebuyers during the boom
but there is a strong negative relationship between the share of first time homebuyers and
changes in homeownership during the bust. This suggests that, while NTMs were
potentially a vehicle for first-time homebuyers to access homeownership, these first-time
buyers were particularly vulnerable to the risks associated with NTMs.
We repeat this analysis, this time replacing a proxy for first-time homebuyer with
race-related variables to determine whether NTM activity has an association with
minority homeownership. We look for relationships for black and Hispanic homeowners
separately. These results, shown in the final columns of table 7, reveal different results
by race. Unlike for the total population, for blacks increasing levels of NTM activity
were not associated with increases in homeownership during the boom. This is a striking
result that stands in stark contrast to anything observed for other populations. Clearly, a
17

Acoca, et al., Non-traditional mortgages
different NTM dynamic was at play for black households during the boom. During the
bust, however, the relationship between NTM activity and black homeownership
mirrored the relationship seen overall. Greater NTM activity was associated with bigger
declines in black homeownership, and the relationship is larger in magnitude for black
homeowners. These data indicate that NTMs were not a positive for black homeowners.
The results for Hispanic homeowners are a bit muddled. We see a negative
relationship between NTM activity and Hispanic homeownership during the boom.
Further, we see no significant relationship between NTM activity and homeownership
during the bust. These are both unexpected and puzzling results and counterintuitive.
More research is needed to better understand what these relationships imply about how
NTMs affect Hispanic populations.
IV. Discussion
This paper explores the relationship between the rise of non-traditional mortgage
products (NTMs) during the 2000s and homeownership. Using a newly-constructed
dataset including information on county homeownership rates and county-level lending
volumes for NTMs and all products, we identify a complex relationship between NTM
lending activity and homeownership. We find that NTM activity is associated with an
increase in the number of homeowners during the boom period of 2000 to 2006, but is
negatively associated with homeownership during the bust period of 2007-2012.
Moreover, the bust period relationship is much smaller than the boom period relationship,
suggesting a positive net effect through the recent unprecedented housing cycle.
18

Acoca, et al., Non-traditional mortgages
Subsequent analyses explore the robustness of these relationships, to determine
whether they are sensitive to local market dynamics and whether there is evidence
consistent with the view that NTMs were effective in easing credit market constraints.
Regarding the former, we consistently find a positive NTM-homeownership relationship
during the boom period across all market types. However, during the bust, a significant
negative relationship is observed only in areas that had experienced a large growth in
both population and house value during the boom.
Regarding the easing of constraints, we find mixed results regarding first-time
homebuyers, who we proxy for with young homeowners. We see mixed results, with
positive relationships during the boom and negative relationships during the bust, though
statistical significance is not consistent. Our final set of results indicates that this
innovation did not have the same effect for racial minorities. We see no positive
relationship during the boom, and either a negative relationship (for blacks) or no
relationship (for Hispanics) during the bust.
We interpret the first of these findings as being consistent with the view that NTMs
can be a positive innovation under “normal” market conditions, but can be problematic in
markets with strong demand or significant pricing pressures. On balance, the case for
NTMs easing constraints is mixed at best. We see some evidence consistent with this
when looking at first-time homebuyers, but none when we look at minorities. It is quite
interesting that the relationships for minorities are quite different, and strongly suggests
that different mechanisms work in minority neighborhoods. Some have argued that
minority communities had less access to mainstream credit markets, meaning that they
were forced to take on additional instrument risk, and were more subject to predatory
19

Acoca, et al., Non-traditional mortgages
lending. These could have muted any positive relationships that may have been observed
during the boom and exacerbated negative relationships during the bust.
The debate about whether innovation in financial markets has been beneficial for
homeowners and communities reached a fever peak in the wake of the housing crisis. The
clear link between subprime lending and high levels of default and foreclosure led many
– these authors included – to highlight the detrimental effects that innovation can have on
markets if regulatory and other institutions are not carefully disciplined in their execution
of strategy. On the other hand, the evidence here, coupled with evidence on prior
innovations that have resulted in decades of benefits (e.g., Fetter (2011), suggests the
relationship between product innovation and homeownership is far from clear. Our
research highlights the nuances of financial markets and local housing market dynamics
as key factors, but the sophistication of homebuyers and the diligence of regulators are
undoubtedly important as well. Future research should focus on what market and
institutional features best maximize the likelihood that innovation produces broad
benefits and to minimize the likelihood that it results in significant risk and costs. This
research is essential and will serve as a key building block for ensuring that we establish
sustainable access to homeownership as a path toward economic and social mobility for
households.
20
Acoca, et al., Non-traditional mortgages
Reference:
Adelino, M., Schoar, A., & Severino, F. (2012). Credit supply and house prices: evidence
from mortgage market segmentation (No. w17832). National Bureau of Economic
Research.
Avery, R. B., Bhutta, N., Brevoort, K. P., & Canner, G. B. (2011). The mortgage market
in 2010: highlights from the data reported under the Home Mortgage Disclosure
Act. Federal Reserve Bulletin, 97, 1-82.
Bostic, R. W., & Lee, K. O. (2008). Mortgages, risk, and homeownership among low-and
moderate-income families. The American Economic Review, 310-314.
Bostic, R. W., Calem, P. S., & Wachter, S. M. (2005). Hitting the wall: Credit as an
impediment to homeownership. Building assets, building credit: creating wealth in
low-income communities, 155-172.
Coleman, M., LaCour-Little, M., & Vandell, K. D. (2008). Subprime lending and the
housing bubble: Tail wags dog?. Journal of Housing Economics, 17(4), 272-290.
Duca, J. V., Muellbauer, J., & Murphy, A. (2011). House prices and credit constraints:
Making sense of the US experience. The Economic Journal, 121(552), 533-551.
Fetter, D. K. (2011). How do mortgage subsidies affect home ownership? Evidence from
the mid-century GI bills (No. w17166). National Bureau of Economic Research.
Gabriel, S. A., & Rosenthal, S. S. (2005). Homeownership in the 1980s and 1990s:
aggregate trends and racial gaps. Journal of Urban Economics, 57(1), 101-127.
Gabriel, S. A., & Rosenthal, S. S. (2015). The Boom, the Bust and the Future of
Homeownership. Real Estate Economics.
Goetzmann, W. N., Peng, L., & Yen, J. (2012). The subprime crisis and house price
appreciation. The Journal of Real Estate Finance and Economics, 44(1-2), 36-66.
Goodhart, C., & Hofmann, B. (2008). House prices, money, credit, and the
macroeconomy. Oxford Review of Economic Policy, 24(1), 180-205.
Linneman, P., & Wachter, S. (1989). The impacts of borrowing constraints on
homeownership. Real Estate Economics, 17(4), 389-402.
Pavlov, A., & Wachter, S. (2011). Subprime lending and real estate prices. Real Estate
Economics, 39(1), 1-17.
Sanders, A. (2008). The subprime crisis and its role in the financial crisis. Journal of
Housing Economics, 17(4), 254-261.
Stiglitz, J. E., & Weiss, A. (1981). Credit rationing in markets with imperfect
information. The American economic review, 393-410.
21

Acoca, et al., Non-traditional mortgages
Table 1: Number of non-traditional features by mortgage
Number of Number Share of
NTM Features of Loans Loans
1 2,581,743 42.2%
2 1,932,521 31.6%
3 1,081,564 17.7%
4 434,055 7.1%
5 82,821 1.4%
6 4,771 0.1%
7 291 0.0%
Source: BlackBox
22
Acoca, et al., Non-traditional mortgages
Table 2: Non-traditional mortgages over time
2001 2002 2003 2004 2005 2006 2007 2008 2009 2010
NTM 94,916 204,050 397,434 919,556 1,580,011 1,808,574 763,797 16,338 680 39
Interest Only 1.1% 2.0% 9.5% 22.7% 31.0% 29.0% 31.3% 27.5% 0.0% 66.7%
Option-ARM with neg.
amortization 0.9% 1.4% 0.1% 3.6% 8.1% 6.8% 7.0% 3.9% 0.0% 0.0%
Balloon payment 6.0% 18.5% 13.1% 13.8% 12.8% 27.2% 24.2% 20.5% 5.0% 0.0%
Prepayment penalty 45.6% 31.4% 44.6% 49.5% 47.4% 47.8% 42.2% 29.1% 73.2% 0.0%
Low or no documentation 41.4% 50.9% 37.3% 36.9% 48.3% 57.6% 66.8% 55.9% 66.0% 0.0%
Terms >360 months 34.7% 27.7% 37.9% 36.2% 32.5% 39.9% 43.0% 54.4% 43.5% 74.4%
CLTV > 100 6.0% 10.5% 14.8% 25.3% 26.3% 39.8% 36.5% 30.3% 20.6% 0.0%
NOTE: Since many non-traditional mortgages have more than 1 non-traditional feature, the sum of the percentage adds up to more
than 100%
Source: BlackBox
23

Acoca, et al., Non-traditional mortgages
Table 3: Correlation in penetration of different non-traditional mortgages across counties in 2006
Option-ARM
with negative
amortization
Terms
> 360
months
CLTV at
origination
> 100
Balloon
payment
Prepayment
penalty
Low or no
documentation Interest Only
Interest Only
Option-ARM with
neg. amortization
Balloon
payment
Prepayment
penalty
Low or no
documentation
Terms >360
months
CLTV at
origination > 100
Source: BlackBox
1
0.85 1
0.78 0.62 1
0.56 0.61 0.68 1
0.92 0.85 0.83 0.67 1
0.90 0.85 0.88 0.74 0.95 1
0.73 0.58 0.90 0.73 0.82 0.86 1
24

(1) (2)
NTM 2001-2006 (#) 0.607***
(0.128)
NTM 2001-2006 (%)
225.1
(183.4)
Population -0.0163*** 0.000773
(0.00545) (0.00346)
Owner Occupied 2000 (%) -51.23 -67.04
(121.2) (121.8)
Mean Household Size -15,047*** -16,868***
(4,378) (4,693)
College Educated (%) 298.8*** 231.0**
(94.71) (93.43)
25-34 (%) 761.2* 523.5
(459.8) (468.1)
35-44 (%) 59.86 427.6
(774.1) (841.1)
45-54 (%) -765.8 -1,478
(851.4) (1,025)
55-64 (%) 624.5 269.4
(721.8) (692.4)
Family with Children (%) 1,018*** 980.9***
(234.8) (234.5)
Foreign Born (%) 107.7 68.61
(316.0) (278.6)
Hispanic (%) 55.97 69.87
(137.0) (125.5)
Black (%) -177.5** -226.3***
(71.74) (67.47)
Unemployment (%) 186.6 -691.2
(475.0) (614.4)
Median Household Income (000) 1.078*** 0.865***
(0.277) (0.292)
Median Rent -26.28* -10.16
(14.63) (14.70)
Median House Value (000) -261.7*** -227.7***
(51.77) (51.97)
Rent to Value 7,986 -4,149
(12,095) (13,910)
Acoca, et al., Non-traditional mortgages
Table 4. Results of initial change in homeownership regressions, 2000-2012
25

Acoca, et al., Non-traditional mortgages
Value to Income 14,824*** 8,604**
(3,757) (3,771)
HPI Variance (5 years) -1,017 -13,126
(14,209) (14,756)
Projected 1 Year HPI Change 238.0 276.8
(241.8) (242.0)
MSA (ref.=Not MSA) -1,084 -1,722
(978.5) (1,085)
Suburban County (ref.=Central
County) -575.5 -242.4
(802.5) (857.1)
Constant -46,601* -4,466
(24,205) (26,308)
State FE YES YES
Observations 753 753
R-squared 0.499 0.411
NOTE: *** p<0.01, ** p<0.05, * p<0.1. Robust standard errors are in parentheses. The
dependent variable is the change in the number of homeowners in a county between 2000
and 2012. These regressions include state and MSA fixed effects.
26

Acoca, et al., Non-traditional mortgages
Table 5. Homeownership regression results, sample partitioned by boom and bust periods
2000-2006 2006-2012
(1) (2) (3) (4)
NTM 2001-2006 (#) 0.653*** -0.0915
(0.0999) (0.0848)
NTM 2001-2006 (%) 481.8*** -215.8**
(149.3) (101.4)
Population -0.00733 0.0109*** -0.00678* -0.00920***
(0.00446) (0.00332) (0.00364) (0.00151)
Owner Occupied 2000 (%) -13.36 -17.19 19.23 22.71
(87.95) (101.2) (50.52) (52.84)
Mean Household Size -13,836*** -14,857*** 1,937 1,730
(3,559) (3,956) (1,890) (1,851)
College Educated (%) 160.1** 127.6* 99.42** 83.98*
(62.98) (72.03) (49.05) (48.49)
25-34 (%) 661.2** 433.7 769.4*** 779.9***
(287.3) (316.2) (245.1) (240.9)
35-44 (%) 195.9 613.8 -466.8 -433.1
(474.9) (584.0) (363.9) (357.4)
45-54 (%) -799.1* -1,626** 23.58 24.29
(436.7) (650.5) (356.5) (360.0)
55-64 (%) 460.5 58.00 102.2 181.3
(437.5) (508.5) (354.1) (375.9)
Family with Children (%) 713.9*** 609.1*** 111.3 120.8
(158.9) (154.7) (75.23) (77.34)
Foreign Born (%) 69.65 15.82 95.17 109.8
(198.9) (152.0) (134.0) (138.0)
Hispanic (%) 61.16 60.54 -32.92 -18.97
(85.27) (75.10) (61.00) (62.98)
Black (%) -94.01 -172.7*** -106.5*** -77.15***
(63.66) (63.38) (32.61) (26.83)
Unemployment (%) 316.3 -627.5 43.04 211.2
(360.6) (547.4) (225.8) (264.5)
Median Household Income 0.616*** 0.407* 234.0** 236.3**
(000) (0.212) (0.232) (98.52) (100.6)
Median Rent -10.10 0.435 -3.907 -1.973
(10.36) (10.70) (5.125) (4.946)
Median House Value (000) -168.8*** -129.1*** -25.32* -26.08*
(42.32) (40.76) (14.01) (14.43)
Rent to Value 3,769 -7,888 -2,158 -2,845
(9,408) (11,606) (4,000) (3,933)
27

Value to Income 9,407*** 2,739 1,188 1,512*
(3,332) (3,464) (863.1) (794.2)
HPI Variance (5 years) -5,844 -18,685* -110.3 -156.5
(9,304) (10,927) (104.0) (127.0)
Projected 1 Year HPI Change 184.4 163.9 -59.28 -68.76
(153.3) (155.4) (55.18) (55.96)
MSA (ref.=Not MSA) -487.8 -1,205 -564.7 -423.1
(655.3) (797.3) (690.5) (671.4)
Suburban County (ref.=Central -793.2 -431.8 39.94 -23.22 County) (583.8) (669.0) (587.7) (588.9)
Constant -22,209 20,266 -22,857** -24,570**
(19,521) (22,929) (10,421) (10,748)
State FE YES YES YES YES
Observations 753 753 746 746
R-squared 0.724 0.611 0.627 0.625
Acoca, et al., Non-traditional mortgages
NOTE: *** p<0.01, ** p<0.05, * p<0.1. Robust standard errors are in parentheses. The dependent
variable is the change in the number of homeowners in a county between 2000 and 2012. These
regressions include state and MSA fixed effects.
28
2000-2006 2006-2012
High Growth
Counties
Low
Growth
Counties
High Growth
Counties
Low
Growth
Counties
NTM 2001-2006 (#) 0.422*** 0.195 -0.377*** 0.0493
(0.0668) (0.122) (0.0989) (0.121)
NTM 2001-2006 (%) 251.1 -4.911 -373.3** -380.2***
(173.1) (96.06) (147.2) (118.3)
2000-2006 2006-2012
High Growth
Counties
Low
Growth
Counties
High Growth
Counties
Low
Growth
Counties
NTM 2001-2006 (#) 0.825*** 1.252*** -0.144*** 0.333
(0.104) (0.224) (0.0538) (0.346)
NTM 2001-2006 (%) 905.1** 57.92 -436.2** -184.2
(443.0) (100.3) (171.6) (137.4)
Acoca, et al., Non-traditional mortgages
Table 6. Homeownership regression results, sample partitioned geographically
Panel A. Population growth partition
Panel B. House price growth partition
Panel C. Sand state interaction
2000-2006 2006-2012
NTM 2001-2006 (#)*Sand state -0.669*** -0.0268
(0.135) (0.199)
NTM 2001-2006 (%)*Sand state 57.06 -230.2
(399.2) (153.2)
NOTE: *** p<0.01, ** p<0.05, * p<0.1. Robust standard errors are in parentheses. Each
coefficient represents the result of a separate regression estimate using the same specification as
in tables 1 and 2, excepting the state and MSA fixed effects. The dependent variable for each
regression is the change in the number of homeowners in a county between 2000 and 2012. “High
growth counties” are those lying above the median regarding the population dimension; “Low growth counties” represent the remainder.
29

Acoca, et al., Non-traditional mortgages
Table 7. Homeownership regression results, with interactions for first-time
homebuyers and minority share
Panel A. First-time homebuyers
2000-2006 2006-2012
(1) (2) (3) (4)
NTM 2001-2006 (#) -0.717** -0.239
(0.327) (0.260)
NTM 2001-2006 (%) -1,071** -269.9
(450.7) (220.2)
Young Homeonwers (%) -30.67 -297.3 -228.8** -219.9
(192.8) (304.3) (111.6) (138.4)
Young
Homeonwers*NTM 0.0888*** 96.75*** 0.00960 1.845
(0.0193) (34.05) (0.0127) (13.01)
Observations 753 753 746 746
R-squared 0.757 0.575 0.556 0.554
Panel B. Minority shares
2000-2006 2006-2012
(1) (2) (3) (4)
NTM 2001-2006 (#) 1.003*** -0.121
(0.130) (0.0886)
NTM 2001-2006 (%) 363.6** -7.957
(158.0) (95.12)
Hispanic (%) 147.7** 97.49 42.11 138.8**
(64.94) (106.0) (33.17) (60.35)
Hispanic*NTM -0.0119*** -0.711 0.00263 -5.678
(0.00370) (8.515) (0.00188) (3.628)
Black (%) -107.1** -119.5 24.01 142.6**
(50.17) (93.13) (24.86) (64.72)
Black*NTM -0.00511 -3.424 -0.0127*** -15.74***
(0.00568) (8.314) (0.00454) (5.707)
Observations 753 753 746 746
R-squared 0.722 0.555 0.602 0.566
30

Acoca, et al., Non-traditional mortgages
Figure 1. Non-traditional mortgage originations, 1997-2010
-
200,000
400,000
600,000
800,000
1,000,000
1,200,000
1,400,000
1,600,000
1,800,000
2,000,000
1997 1998 1999 2000 2001 2002 2003 2004 2005 2006 2007 2008 2009 2010
Nu
mb
er o
f N
TM
Source: BlackBox
Figure 2. Non-traditional mortgage as a percentage of total purchase originations,
1997-2010
0%
5%
10%
15%
20%
25%
30%
1997 1998 1999 2000 2001 2002 2003 2004 2005 2006 2007 2008 2009 2010
Per
cen
t P
urc
has
e O
rigi
nat
ion
s
Source: HMDA, BlackBox
31

Acoca, et al., Non-traditional mortgages
Figure 3. Geographic distribution of non-traditional mortgages, 2003, 2006 and
2008
Source: HMDA, BlackBox
32