Embed Size (px)
Citation preview

Credit Rating Announcements, Trading Activity and Yield Spreads:
The Spanish Evidence*
Pilar Abada, Antonio Díazb and M. Dolores Robles-Fernándezc
Abstract:
We test whether or not different rating announcements contain pricing-relevant
information and modify trading activity patterns in the Spanish commercial paper and corporate
bond markets. We observe a statistically significant widening of yield spreads in both segments
of the corporate debt market after reviews of downgrades and negative outlook reports. In
addition, we find that certain rating announcements encourage trading activity even when the
information is not pricing-relevant. The release of information arouses investor interest for the
involved securities. Thus, trading frequency increases, although larger-sized transactions, which
should denote possible portfolio rebalancing, are not observed. In the commercial paper note
market, we also find that that trading volumes fade away after reviews for downgrade. Investors
seem to prefer reducing the trading of these short-term securities to liquidating their positions.
Keywords: Credit rating agencies; rating changes; event study; yields; liquidity; trading
frequency; corporate bond market; commercial paper market.
JEL Classification: G12, G14, C34.
* Acknowledges: The information provided by AIAF, Fitch and Moody’s is appreciated. Any errors are solely the responsibility of the authors.
This work has been funded by the Spanish Ministerio de Ciencia y Tecnología (ECO2008-02752/ECON, ECO2009-10398/ECON and
ECO2008-05551/ECON), the Junta de Comunidades de Castilla-La Mancha (PCI08-0089) and Banco de Santander (UCM940063).
a PhD in Economics, Associate professor in Econometrics and Economics at Universidad Rey Juan Carlos de Madrid. Her research interests
cover financial econometrics, financial economics and corporate finance. She has published in journals as the Journal of Business Finance and
Accounting, Journal of Banking and Finance or International Journal of Theoretical and Applied Finance. Mailing address: Universidad Rey
Juan Carlos, Paseo Artilleros s/n, 28032 Madrid, Spain and RFA-IREA. Email: [email protected]
b PhD in Economics, Associate professor in Finance at Universidad de Castilla La Mancha. His research interests cover financial economics and
corporate finance. He has published in journals as Quantitative Finance, Journal of Banking and Finance and Finance or Journal of Futures
Markets. Mailing address: Universidad de Castilla-La Mancha, Plaza de la Universidad 1, 02071 Albacete, Spain. Email:
c PhD in Economics, Associate professor in Econometrics and Finance at Universidad Complutense de Madrid. Her research interests cover
financial econometrics, financial economics and corporate finance. She has published in journals as the Journal of Business Finance and
Accounting, Journal of Economics and Finance or Studies in Nonlinear Analysis and Econometrics. Mailing address: Universidad
Complutense de Madrid, Campus de Somosaguas, 28223 Pozuelo de Alarcón, Madrid, Spain. Email: [email protected]
1
1. Introduction
Information on rating actions has been a permanent subject of debate. Credit rating
agencies (CRAs) state that they consider insider information when assigning ratings without
disclosing specific details to the public at large. Thus, their actions should have some effect on
the markets. Earlier studies, such as Weinstein (1977), Wakeman (1978, 1990) and Zaima and
McCarthy (1988), report that CRAs only summarize public information, and changes in bond
ratings convey no new information to the market. More recent studies observe abnormal returns
on stocks and bonds prices and mostly conclude that rating changes deliver valuable information
to the market (see, for example, Ingram et al., 1983; Hand et al., 1992; or Dichev and Piotroski,
2001). Later studies, such as Norden and Weber (2004) and Hull et al. (2004), examine the credit
default swap CDS market, Steiner and Heinke (2001) consider all three types of rating actions
(actual rating changes, watchlist assignments, and outlook assignments), and Jorion and Zhang
(2007) analyze the influence of determinant factors like the credit rating prior to the change. In
general, there is considerable evidence that negative rating announcements, particularly reviews
for downgrade and downgrades, do in fact disclose information relevant to the formation of
prices. Other than in Kliger and Sarig (2000), positive rating events have not been found to have
a significant impact on prices.
In this paper we examine whether or not different credit rating announcements signal new
information to the Spanish corporate bond market. Our analysis contributes to the understanding
of the information value of credit ratings in several ways. First, to the best of our knowledge, this
is the first study that analyzes the effects of rating action announcements on liquidity.1 We also
analyze the impact of these announcements on yield spreads. Second, aside from analyzing
rating migrations, we examine the informational content of the watchlist and outlook
instruments, scarcely analyzed previously. Third, in addition to the study of corporate bonds, we
analyze a sample of short-term corporate instruments (i.e., commercial paper notes, CPN).2
Finally, we examine a non-U.S. market, the previously unexplored Spanish market, during a
wide period of time (1993-2004).
1 Odders-White and Ready (2006) analyze the relationship between credit ratings and equity measures of adverse
selection. They conclude that credit ratings are poorer when common measures of adverse selection are larger. 2 Commercial paper notes (CPN) are negotiable debt securities issued by firms on the money market for periods
ranging from one day to one year. In the Spanish case, the most frequent CPN maturities are 15 days and 1, 3, 6
and 12 months. The trading level of CPNs in the Spanish market represented 49.8% of the total traded volume in
2004.

2
The analysis of rating announcement effects on liquidity is essential to market
practitioners, as liquidity plays an important role in the process of price discovery. Traditional
market microstructure models predict that liquidity will deteriorate around the time new
information is released and return to normal afterwards (Kim and Verrecchia, 1994). To analyze
this matter, we consider different liquidity proxies founded on market condition variables. Other
traditional liquidity proxies, such as security-specific characteristics or even the popular bid-ask
spread, are unsuitable for our analysis. For each issuer and date, we compute the average trading
volume per traded day, the trading frequency and, the market share of trading activity.
We also analyze the yield spread responses to rating announcements, similar to previous
studies such as Katz (1974) and Ingram et al. (1983). Although the literature has commonly
analyzed the impact of credit rating announcements on stock prices (see Norden and Weber,
2004), studies that consider bond price reactions to rating changes are less abundant. Abnormal
bond returns as well as abnormal yield spreads are typically analyzed. Both approaches use
benchmark measures that are calculated from a market model, a market bond index or an
equivalent benchmark bond. Nevertheless, as we will discuss in Section 4, the bond returns
depend on the bond durations, and the original and benchmark bonds usually have different
durations, causing distortions on abnormal bond returns that make them a dirty measure.
Abnormal yield spread measures are generally not affected by this type of distortions. Another
advantage of yields is that they are forward-looking, whereas realized returns are backward-
looking. In addition, the bond liquidity literature prefers to analyze the bond’s yield to maturity.
An ideal way of estimating a bond yield spread would be to compare the actual yield to
maturity of the bond with that obtained from the corporate yield curve of the appropriate sector
and rating. This corporate yield curve incorporates the average credit spread and liquidity spread
of all bonds considered for each maturity. Díaz and Skinner (2003) observe low accuracy of the
fitted corporate yield curves on the U.S. corporate bond market, the largest and most liquid
corporate market in the world. The characteristics of the Spanish corporate market do not allow
for fitting corporate yield curves, but we use risk-free synthetic bonds to estimate yield spreads
(Fleming, 2001, and Díaz and Navarro, 2002).
Instead of monthly data, as is usual in the literature, we analyze daily effective trading
volume per each traded bond and its average transaction price and yield to maturity. These
averages are volume-weighted, considering all the actual spot transactions involving the bond
during the day. The use of daily data provides greater accuracy in the measures of abnormal
performance. Additionally, we use data on actual transactions instead of trader quotes. The use
of trader quotes has been questioned in the literature. For instance, Hull et al. (2004) comment

3
that the bond yield data available to researchers usually consists of indications from dealers, and
there is no commitment from the dealer to trade at the specified price. Mahanti et al. (2008)
observe that trading U.S. corporate bonds requires the dealer to contact one of a number of “buy-
side” clients and obtain the bond. The final price will depend on the search and transaction costs,
regardless of the quoted bid-ask spread.
Another related issue that has received only limited attention in the literature is the
question of whether or not the announcements of credit rating actions prompt a different reaction
in small versus large markets. Only a few papers have analyzed non-U.S. markets. Steiner and
Heinke (2001) examine the Eurobond market and observe that the issuer’s nationality is a key
factor that determines the intensity of price reactions after downgrades. They suggest that ratings
of non-U.S. bonds are less informative than ratings of U.S. bonds. U.S.-based CRAs face
difficulties in estimating political risks, lack of access to information sources, institutional and
cultural differences and problems with the reliance on US-GAAP for the valuation of non-U.S.
firms. Gropp and Richards (2001) find little evidence of announcement effects on bond prices
issued by European banks and suggest that this result may reflect the lack of liquidity in bond
markets in Europe. Dallocchio et al. (2006) examine the stationarity of relative spreads for each
issuer separately in the French corporate bond market. They conclude that this market is
insensible to rating changes. In this respect, one of the purposes of this paper is to contribute to
this literature by adding new evidence from a small but growing market, i.e., Spain.3
Our results suggest that reviews for downgrade and negative outlook reports contain
pricing-relevant information. We observe significant abnormal yield spreads after these
announcements in both the medium- and long-term bond markets and the previously unexplored
short-term CPN market. According to the common perception that rating agencies do not
respond quickly enough to changes in credit conditions, investors seem to value the timely signal
embodied by negative reviews and outlooks but not the stable signal embodied by effective
downgrade changes. Positive rating actions do not cause announcement effects on yield spreads.
This outcome is consistent with the asymmetric price reaction hypothesis.
We find that certain rating announcements convey information that encourages trading
activity. Thus, outlook reports in the bond market and rating changes in the CPN market arouse 3 The size of both the commercial paper and corporate bond segments of AIAF are far smaller than the value of the
equivalent corporate U.S. debt market. At the end of 2004, the amount outstanding of Spanish CPN (44.1 billion
euros) represents only 4.2% of the U.S. value ($1.4 trillion US, or, according to the official exchange rate, 1.04
trillion euros). In the case of corporate bonds, this percentage is 1.9% (68.6 billion euros in the Spanish case and
3.5 trillion euros in the U.S. case).

4
investor interest for the involved securities and cause significant, positive, abnormal trading
frequency. However, we do not find evidence of the appearance of larger-sized transactions,
which should denote possible portfolio rebalancing. Positive abnormal trading volumes are only
observed after reviews for upgrade and actual upgrades in the bond market. Finally, the market
response to reviews for downgrades in the CPN portfolios consists of a decrease in the market
share and trading volume.
The remainder of the paper is arranged as follows: Section 2 explains the hypotheses to
be tested. Section 3 presents the characteristics of the sample of rating announcements and the
data set of transactions on the Spanish corporate market. Section 4 examines different measures
of abnormal yield spreads and trading activity. The main results are presented in Section 5, and
Section 6 concludes.
2. The expected effect of rating actions
Almost all large, corporate bond issues are rated by at least one rating agency. CRAs
assign an initial rating to new issues on the basis of the solvency of the issuing firms and factors
related to the industry and macroeconomic environment. Subsequently, agencies reevaluate
corporate bonds, as some of these relevant conditions change. When the rating is solicited, the
issuers pay a fee to be rated because credit ratings are important for the cost of borrowing and for
the marketability of debt.4 The issuing of corporate bonds is virtually impossible without a credit
rating. Moreover, the Standardized Approach of the Basel II rules for global commercial banks
establishes capital adequacy requirements based on ratings provided by external CRAs.
Previous research has proposed and tested several sometimes conflicting theories about
the role of credit ratings and the effects of rating change announcements. They establish the
expected behavior of re-rated firm bond returns or yields around the announcement date, but they
indicate little about the expected liquidity behavior. The effect of rating actions on the short-term
corporate debt market has also been unexplored.5
The main hypothesis concerning rating change effects states that CRAs are supplied with
considerable non-public information about firms. Therefore, a rating revision may provide
additional information about the total firm value and its organizational effectiveness. According
4 In some cases, ratings are unsolicited. See Behr and Güttler (2008) for a recent analysis of this kind of rating. 5 Nayar and Rozeff (1994) analyze the effect of CPN rating changes on equity returns, and Crabbe and Post (1994)
analyze the effects of CPN rating downgrades on outstanding amounts of commercial paper.
5
to this hypothesis, we expect yield spreads of downgraded (upgraded) firms to widen (narrow)
and trading activity involving these securities to temporarily rise.
However, rating agencies are currently in the eye of the storm, although this is nothing
new. Their failure to predict the crises at firms such as Penn Central Transportation Company in
1970, Orange County in 1994, Enron in 2001, WorldCom in 2002 or Lehman Brothers in 2008,
had received broader public attention. The U.S. Senate (2002) commented that CRAs displayed a
lack of diligence in their coverage and assessment of Enron. Recently, their central role in the
sub-prime mortgage crisis has also been widely criticized. For example, the SEC, after an
examination of CRAs (U.S. SEC, 2008), stated that the surveillance processes used by the rating
agencies appear to have been less robust than their initial ratings processes. In this way,
European Parliament (2009) commented that CRAs failed to reflect early enough in their credit
ratings the worsening market conditions, on the one hand, and to adjust their credit ratings in
time following the deepening market crisis, on the other.6 Many recent academic papers, such as
Crouchy et al. (2008), analyze the role played by CRAs in the sub-prime mortgage crisis.
A number of papers are focused on providing theories that explain why rating changes
are relatively seldom, such as the rating stability hypothesis related to the through-the-cycle
approach (Howe, 1995; Cantor, 2001; Altman and Rijken, 2006) and the policy of rating bounce
avoidance (Cantor, 2001; Löffler, 2004, 2005). They argue that agencies prefer to be slow and
right rather than fast and wrong to preserve their reputation. They observe that CRAs are
intended to measure the default risk over long investment horizons. In addition, they find that a
rating change is triggered when the difference between the actual agency rating and the rating
predicted by the agency-rating model exceeds a certain threshold level. Thus, CRAs avoid
frequent rating reversals. This lower timeliness of agencies conflicts with the point-to-time
perspective of most investors, who can search current information, although Löffler (2004)
concludes that this policy is beneficial to bond investors.
The agencies employ two other instruments, i.e., reviews and outlook reports, to give
more timely credit risk information. According to Steiner and Heinke (2001), Hull et al. (2004),
Boot et al. (2006), and Altman and Rijken (2007), these instruments may even be more useful
than rating changes, causing larger effects on bond prices. Reviews or watchlist additions give a
stronger indication than outlooks of future changes in the company rating. This rating event
indicates that there is a very high probability that the issuer will be re-rated. Rating outlooks
6 On April 23, 2009, the European Parliament endorsed strict new rules. The approved regulation aims at enhancing
transparency, independence and good governance of CRAs that wish to operate in the EU.
6
merely indicate a possible direction for the rating in the medium term. They indicate a forecast of
the future rating of the firm (typically over two years).
On the other hand, Boot et al. (2006) state that the announcement of a credit watch and
the information-gathering involved in the review process probably impact on the information
content of rating changes. In this sense, the effect of an effective rating change can be different
depending on the presence or absence of a prior review process.
Debt prices rapidly incorporate any information relevant to assessing a firm’s operating
and financial conditions. If rating agencies are slow to react to new information, bond price and
liquidity reactions to rating changes would not be expected. There are other factors that also
support this line of reasoning. For instance, institutional investors often use a passive, buy-and-
hold strategy of investing. As a result, information disclosed in rating actions may be of little
importance in monitoring firms, and the effects on the debt market may be limited. Additionally,
the nationality hypothesis proposed by Steiner and Heinke (2001) assumes that rating changes
for U.S. issuers convey more information, and thus cause a stronger price reaction, than for non-
U.S. issuers. Evidence from previous research on other European bond markets indicates a lack
of reaction (Gropp and Richards, 2001; Dallocchio et al., 2006) or a weak reaction (Steiner and
Heinke, 2001).
A well-documented phenomenon is the asymmetric reaction to positive and negative
rating events. The reputation hypothesis (Holthausen and Leftwich, 1986) states that rating
agencies face asymmetric loss functions, and they allocate more resources to revealing negative
credit information than positive information because the loss of reputation is more severe when a
false rating is too high than when it is too low. As a result, downgrades represent information not
yet known by the market, whereas upgrades confirm information that is already available. Also,
the price pressure subsequent to rating actions is different for downgrades and upgrades.
Although downgrades force selling transactions, upgrades do not force buying transactions.
Under this hypothesis, we expect a stronger reaction on yields and liquidity in the case of
downgrades. The same effects are affirmed by the moral hazard risk problem (Covitz and
Harrison, 2003). Whereas the market is the end customer of rating agencies, almost all their
revenues come from rating fees paid by the rated firms. The agencies may act in the interest of
issuers delaying rating downgrades to give the firm time to correct its credit quality.
Another hypothesis supporting the asymmetric effect of downgrades and upgrades is the
investment restriction (Hite and Warga, 1997; Ellu et al., 2009). This hypothesis is based on
institutional and regulatory constraints, such as the limitation to hold only investment-grade rated
debt securities by mutual and pension funds or the imposition of large capital requirements on

7
the holdings of speculative-grade bonds. Therefore, a rating downgrade from investment- to
speculative-grade can imply a greater price impact than other downgrades and a greater liquidity
effect. In addition, the “too-big-to-fail” paradigm suggests that regulators might intervene to
avoid the default of large banks because of serious, adverse effects on the financial system.7
Under the latter hypothesis, the market can be insensitive to rating downgrades.
In the liquidity literature, the market microstructure models indicate that trading activity
responses to a news release are related to the existence of asymmetric information among
informed traders, uninformed traders, and market-makers. Kim and Verrecchia (1994) state that
the fact that some traders are able to make better decisions than others, based on the same
information, leads to information asymmetry and positive abnormal trading volume despite a
reduction in liquidity after the release of new information about the firm. In this context, higher
trading activity after the rating action will be expected. However, low liquidity of corporate debt
markets may prevent this kind of effect.
3. Rating actions on the Spanish corporate debt market
The AIAF market is by far the leading and almost only Spanish corporate fixed income
market and is run by the Spanish security dealers association. Corporate debt and also assets
issued by regional public administrations are traded. It is one of the few official and regulated
European markets dedicated exclusively to these types of financial assets.8
Most of the AIAF trading comes from individual investors who, although their
percentage of the total AIAF trading volume is low (2% of the volume traded to maturity),
represent 55% of the total number of transactions traded to maturity.9 On the other hand, non-
residents, especially mutual funds from countries like Germany and France, represent nearly
70% of all unsecured bonds traded and nearly 65% of trade in the case of asset-backed securities.
7 Major financial firms are assumed to be “too big to fail,” but Lehman Brothers was allowed to fail on September
15, 2008. As a result, this event caused a widespread panic in the market. 8 Spanish corporate fixed income assets are also issued and traded in OTC European markets and in the Spanish
electronic stock exchange market. The activity in the latter organized market was faded out during the last decade
of the last century. Public assets different from Treasury securities are also traded in one of the sections of the
Spanish Treasury debt market. 9 The remaining trade to maturity is distributed among companies (11%, mainly CPN), financial institutions (18%,
mainly dealing with medium and long-term assets), collective investment institutions and insurance companies
(20%, representing 48% of all CPN trading), non-residents (43%), public sector (1%) and market members (5%).
Source: “AIAF market activity 2005” yearly report. Recently, these percentages have dramatically changed
because of the subprime mortgage crisis.

8
The primary market of commercial paper is especially dynamic. The most active
corporations are continuously issuing new references. Most of the CPNs are issued via backup
lines or loan commitments. These contracts allow firms to borrow up to a pre-determined amount
of funds at a fixed spread over a safe market benchmark interest rate, such as Euribor.
Commercial paper issuers secure a backup line of credit from a bank as protection against
declines in liquidity in the primary market.10 This activity in the primary market generates
transactions by institutional investors in the secondary market, mainly involving just-issued
assets. CPNs are the most heavily traded corporate assets in recent years. Their overall trading
volume represents 49.8% of the total in 2004, and 74.6% in 2002.
The AIAF data set consists of daily observations of each traded asset in the secondary
market. The data on corporate bonds covers the period from January 1993 to December 2004,
whereas the database of CPNs only contains data from January 1998. We use a similar daily data
set from the Spanish government debt market (obtained from annual files made available by the
Banco de España) covering the same sample period. The observations are derived from actual
transactions in all Spanish Treasury bills and bonds traded in the Spanish Treasury debt market.
This information is used to estimate the daily term structures of interest rates.
For each issue traded on a day, both the AIAF and the Banco de España data sets report
information on the number of transactions, the aggregate nominal trading volume, the aggregate
effective trading volume, and the value-weighted average price and yield to maturity. All
transactions over each day in the sample are computed. No information is reported about issues
without trading on that day. We match this information with each issue’s coupon rate, maturity
date, issuance date and remaining coupon payment dates. We consider outright transactions and
rule out repo and reverse agreements. We exclude issues with special features, such as floating
rate notes, sinking fund bonds, convertible issues, callable and putable bonds, mortgage-backed
securities and issues with tax incentives.
Our initial sample of announcements contains a set of 349 rating actions corresponding to
the “Big Three” rating agencies (Fitch, Moody’s and Standard and Poor’s) during the analyzed
period. These actions include effective rating changes, rating reviews and outlook reports
affecting short- and long-term issuer ratings. Fitch and Moody’s provide us with their
announcement dates. We also examine Hemeroteca El País (the library of the major Spanish
newspaper) to find the S&P’s rating announcement dates and complementary information.
10 Gatev and Strahan (2006) provide a detailed description of the backup lines and study the banking sector’s role in
offering liquidity insurance for the commercial paper market.

9
From the AIAF data set, we select the issues involved in rating actions. Most of them
concern firms without outstanding issues in the sample period. We also exclude issues that do
not have a minimum level of liquidity around the event window. Likewise, we rule out those
cases in which the re-rated firm has suffered any other event that might generate abnormal
behavior in the event window. The final sample contains 158 rating actions entailing 1,058
issues (271 bonds and 787 CPNs).11
Almost all the issuers affected by rating actions simultaneously keep several outstanding
securities in the market, especially in the case of the CPN. The abnormal yield spreads of
corporate debt issued by the same company are probably almost perfectly correlated in the cross-
section. For this reason we construct volume-weighted portfolios with all bonds and CPNs of the
same firm after computing yield spreads and liquidity measures. We aggregate the outstanding
references of each issuer by weighting the effective trading volume of the issues actually traded
during the day. Each portfolio is considered as a single observation.12
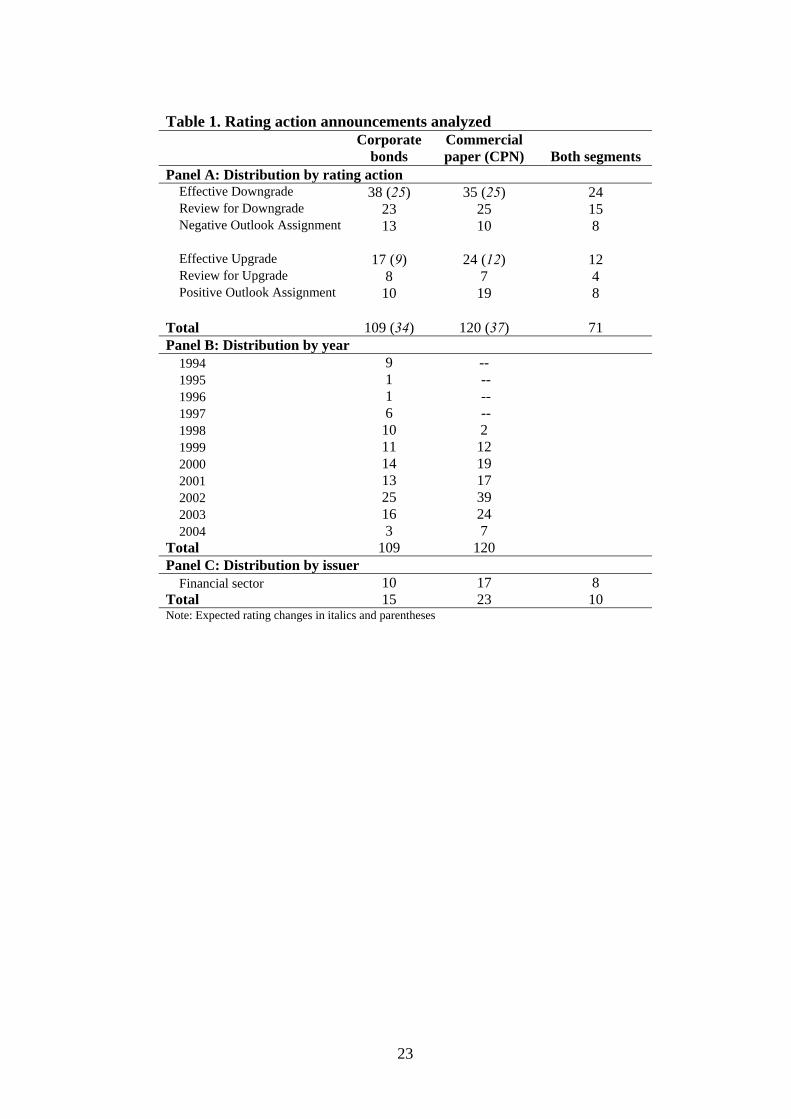
Panel A of Table 1 presents the rating actions grouped into six different sets: effective
upgrades, effective downgrades, reviews for upgrade, reviews for downgrades, positive outlook
reports and negative outlook reports. There are 109 rating actions that affect the bond market,
120 actions affecting the short-term segment and 71 simultaneously affecting both markets. We
use the watchlist information to distinguish between expected and unanticipated rating changes.
When an actual rating change is preceded by a rating review in the same direction, it should be
largely anticipated by the market and hence should not necessarily be associated with a reaction
in yield spreads. The majority of rating changes in our sample are preceded by watch actions.
More than 50% of the effective rating changes are expected, 65.8% of downgrades and 52.9% of
upgrades for bonds and 71.4% of downgrades and 50% of upgrades in the case of CPNs.
[Insert Table 1]
Panel B of Table 1 presents the distribution of rating actions per year. In general, the
yearly number of rating announcements increases during the sample period. Finally, Panel C of
Table 1 depicts the number of issuers involved in rating actions, distinguishing the number of
issuers from the financial sector due to the large weight of these firms in our sample (67.9%).
Focusing on the agency, 49% of the rating actions are by Moody’s, 27% by Fitch and the
remaining 23% by S&P. These percentages are similar for both market segments. Finally, only
11 Many rating actions involve companies whose issues are not traded around the event window. Other issues are
never traded in the secondary market, as they are initially absorbed in investors’ portfolios. Additionally, few
large corporations put their issues into circulation in other foreign markets. 12 We also analyze equally weighted portfolios, but results are almost the same. They are available upon request.

10
two downgrades imply a jump down to the speculative grade, both of them corresponding to the
bond segment. In the case of upgrades, we do not find jumps in the opposite direction, from
speculative to investment grade.
4. Measures of abnormal behavior
4.1. Abnormal yield spreads
We focus the analysis on yield spreads instead of returns. For long time intervals in the
event study, most of the abnormal returns measures proposed in the literature can be slightly
biased. The simple passing of time or movements of interest rates can generate abnormal returns.
On the one hand, the yield to maturity (price) of a corporate bond should be higher
(lower) than that of a similar government bond. Because both prices must converge to the par
value of 100% at maturity, the distance to cover for each price during the considered time
interval is different. Even in the case that interest rates remain constant, raw returns of the two
types of bonds will not be alike. Thus, the simple passing of time causes abnormal returns. On
the other hand, differences in yields imply differences in durations. The corporate bond is less
sensitive to interest rate movements than the government bond because it has a shorter duration.
It is reasonable to assume that a shift in the yield curve maintains a constant yield spread.
However, this simple shift causes an abnormal return due to the different durations. In general,
these distortions should not affect abnormal yield spread measures.
To determine whether or not there is abnormal behavior, we compare actual yields to
maturity with a benchmark that gives the expected yield to maturity in the absence of released
information, given the risk class of the security. The literature has proposed different
benchmarks. Infrequent trading and the use of transaction prices prevent consideration of most of
these benchmarks, such as bond indexes, bonds with similar features or corporate yield curves.
Hite and Warga (1997) and Covitz and Harrison (2003) use a bond index having the same
broad rating and maturity classification as the bond in question, but there are no trustworthy
corporate bond indexes in the Spanish case.13 Gropp and Richards (2001) estimate a market
model from quotes, in which a government bond index acts as the market indicator. Because we
use transaction prices, this approach is not viable for the majority of issues in our sample.
13 Indices of Spanish corporate fixed income face many difficulties, such as a low number of outstanding securities,
very infrequent trading, the fact that most of the actively traded securities are not straight bonds and that others are
systematically traded at artificial constant prices.

11
Other previous studies have used the yield of a bond with similar characteristics (a
similarly rated bond or even a Treasury bond).14 In our case, to find this kind of benchmark is
difficult given the small number of outstanding bonds within any single rating and maturity
category in the Spanish corporate debt market. A more convenient benchmark is used by
Perraudin and Taylor (2004). They estimate yield curves for different ratings from U.S.
corporate bonds and calculate the theoretical price of a bond with the same cash flows and
default risk in absence of the rating action. Each corporate yield curve incorporates the average
credit spread and liquidity spread of all bonds considered. However, this method requires quite a
high number of different bonds with a similar rating being traded simultaneously to estimate the
zero coupon yield curve for each rating grade. Moreover, Díaz and Skinner (2003) observe low
accuracy of the fitted corporate yield curves on the U.S. corporate bond market. Thus, even in
more developed markets, the implementation of this approach is complex.
In this paper we propose an accurate approach that is not affected by, for example,
interest rate movements, varied cash flow structures, the composition of an index, or estimation
of corporate yield curves. Similar to Fleming (2001) and Díaz and Navarro (2002), we build risk-
free synthetic bonds from the previous estimation of the Treasury term structure of interest rates.
We fit the Nelson and Siegel’s (1987) exponential model for estimation of the risk-free yield
curve from our Banco de España data set. The synthetic Treasury securities are calculated by
discounting coupon and principal payments of the considered corporate asset according to fitted
term structures.15 The yield differential between the original corporate bond and the synthetic
bond shows a premium for bearing default risk and liquidity risk. This measure should be
insensitive to shifts in interest rates due to changes in real rates or expected inflation. As the
liquidity spread should remain constant after the rating announcement, changes to the yield
spread should only respond to changes to the credit spread.
14 Other authors, such as Liu et al. (1999), estimate yield to maturity of a Treasury bond with the same coupon,
maturity and discount from the face value. Previously, they regressed the actual yield to maturity of the Treasury
bonds in the sample against three explanatory variables: coupon rate, maturity, and discount. 15 We include all the spot transactions that took place with Treasury bills and bonds for all issues with a daily
trading volume of at least €3 million and terms to maturity between 15 days and 15 years. We also include the
one-week general collateral repo market interest rate to provide a liquid point at the very front of the yield curve.
We minimize price errors weighted by duration from the Nelson and Siegel’s (1987) model.

12
We study the behavior of the yield spread around the announcement date (day t = 0).
Because of infrequent trading, we analyze variable time intervals.16 The last transaction date
before the rating action announcement is t = t1 and the first transaction date after it is t = t2. Note
that the event window is not necessarily symmetrical around t = 0.
The yield spread of the security i on day t, YSit, is obtained as the difference between the
actual yield to maturity of the security and the yield to maturity of the synthetic government
security with similar cash flows (benchmark). Hence, the abnormal yield spread is defined as the
yield spread change in the time interval from t1 to t2:
2 1 2 1,( ) , ,i t t i t i tAYS YS YS (1)
It is well-known that the liquidity of the short-term Treasury assets is limited, and fitted
yield curves show instability in the very short-term. Thus, we use an alternative, risk-free interest
rate in the case of the CPN segment. The repo market on Treasury debt is a very active segment
of the secondary market. These instruments allow us to obtain average daily interest rates for a
wide range of short-terms to maturity. In this sense, we estimate yield spreads from synthetic
risk-free CPNs from the repo data.
4.2. Abnormal liquidity measures
A number of market condition variables and security-specific characteristics have been
used as proxies for liquidity in debt markets. Most of the proposed liquidity measures in the
literature are clearly inappropriate for our analysis. In the case of security-specific features, the
amount outstanding (Fisher, 1959), the age of the bond (Sarig and Warga, 1989), the status
(Warga, 1992), and the time to maturity (Amihud and Mendelson, 1991) are independent of an
eventual rating action. Additionally, the most usual liquidity proxy, i.e., the bid-ask spread, is
also unsuitable for our analysis. In general, a typical stock is traded several times per minute, a
typical government bond is traded several times per day, and a typical off-the-run corporate
bond is traded several times per year.17 Edwards et al. (2007) and Mahanti et al. (2008) describe
16 The use of different length event windows could imply certain heterogeneity across observations in terms of credit
risk and liquidity risk. Fortunately Abad et al. (2010) observe that the length of the considered time interval is not
relevant to explain abnormal liquidity around rating changes for the same sample of bonds. 17 Mahanti et al. (2008) analyze the US corporate dollar-denominated bonds in the State Street Corporation custody
trades database from 2000 to 2005. They remark: “The number of bonds that trade approximately every day
(defined as over 200 days in the year) varies between 0 and 6; this is out of a sample of roughly 19,000 bonds.
Even considering a level of trading of at least once a year as relatively liquid, the percentage of the total number
of bonds in our sample that would be defined as liquid is between 22% and 34% each year. A large proportion of
the bonds - over 40% - do not even trade once a year.”

13
the U.S. corporate bond market, the world’s largest, as highly illiquid. In this kind of market, the
bid-ask spread measure can be considered anecdotal or artificial. The final price will depend on
the search and transaction costs, regardless of the quoted bid-ask spread.
In the results of previous research, there appears to be disagreement on what the best
proxy for liquidity is. Suggested proxies are as follows: the trading volume (Elton and Green,
1998), the number of trades (Fleming, 2001), the expected liquidity over the full life of the issue
(Goldreich et al., 2005), the trading activity life cycle (Díaz et al., 2006), the trade size and issue
size (Edwards et al., 2007), or the accessibility of a security by dealers (Mahanti et al., 2008).
Regardless, Houweling et al. (2005) find only limited differences between nine liquidity proxies.
In this study, we propose different proxies for corporate bond liquidity to obtain measures
of abnormal liquidity. We focus the analysis on market condition variables. We consider both
trading volume and trading frequency. We compute the trading volume of issuer i on day t, vi,t, as
the average effective trading volume of all outstanding issues of this issuer, i. The average
trading volume per traded day of issuer i on day t, vpdi,t, is calculated by dividing the total
trading volume in the last three-month interval by the number of days on which the issue is
traded in the period.18 For both measures, we calculate rates of change and express trading
volumes in logs. Thus, we compute the observed trading volume rate of change, cVi,(t2-t1), and the
expected average daily trading volume rate of change, cVPDi,(t2-t1) , as:
2 1 2 1,( ) , ,i t t i t i tcV v v (2)
1212 ,,, tititti vpdvpdcVPD
where vi,t1 and vpdi,t1 , and vi,t2 and vpdi,t2 are the logs of both the observed and the expected
trading volume measures on days t1 and t2, respectively.
To obtain the abnormal trading volume measure, AVi,(t2-t1) , we compare the observed rate
of change to the expected rate of change:
121212 ,,, ttittitti cVPDcVAV (3)
Our second abnormal liquidity measure is based on the trading frequency. We define
trading frequency of issue i, fi, as the ratio between the number of days with trading involving
the issue and the number of working days the issue is outstanding during the considered time
interval. That is, we compare the number of days the issue was traded to the number of days the
18 We also consider another two benchmarks over the previous three-month period: the accumulated average daily
trading volume and the average daily trading volume. The former measure is calculated by dividing the total
trading volume by the number of working days in the last three-month interval. Results are similar to those
obtained in the case of the average daily trading volume per traded day. They are available upon request.

14
issue could have been traded. We consider both two months before the announcement, fibefore, and
two months after the announcement, fiafter. The abnormal frequency measure is computed as:
2 1,( )
after beforei t t i iAF f f (4)
where andafter beforei if f are the logs of the two frequency ratios mentioned above, respectively.
In the case of the CPNs, their particular characteristics allow us to consider a third
liquidity proxy: the market share of trading activity. Market share for a CPN i on date t, msit, is
measured as the ratio of the par value traded for the issue during the last week to the total face
value traded in the full CPN market during the last week.
To compute the benchmark for the market share, we take advantage of the regularity of
CPN trading behavior.19 Following Díaz et al. (2006) (DMN), we track liquidity in a typical
CPN by using a trading activity lifecycle approach. They observe an initial hump in the market
share for the first few years of bond life and a decreasing trading activity of the bond as it
approaches maturity. In our CPN market share sample, we observe an extremely high market
share during the first week of life with a residual impact in the second week and the same
decreasing trading activity during the remaining lifetime. We interpret these initial two weeks of
age as the final stage of the hump’s right tail in the DMN model.
We use weekly data on individual CPN shares of trading volume for all issues in our
database. We consider all of the outstanding references on each day, even if they are not traded.
These data are aggregated by age, i.e. we use the average market share of trading activity of a j-
week age CPN, msj (j = 1,…, 55 weeks). We model this variable as the smooth, nonlinear
function of its age, j, proposed by DMN. The original expression is slightly modified since the
time series dimension disappears and the cross-sectional dimension is demeaned to age groups
(j) instead individuals: 20
19 The life cycle of the CPN is extremely regular. Institutional investors take positions in these assets in the early
days after issuance. The trading of these assets during the remainder of their lifetimes is residual. 20 Equation ¡Error! No se encuentra el origen de la referencia. is inspired by the actuarial research on human
mortality (see Heligman and Pollard, 1980). The first term captures the steep drop of average liquidity during the

15
2
1 2 3 4 5exp , 1,2,...,55jj jms j u j (5)
where βk, k = 1,…,5 are the unknown parameters21 and uj is an i.i.d. error term with zero mean
and constant variance.
The regression model is estimated by nonlinear least squares. 22 The estimated parameters
are used to compute the expected market share or the benchmark market share of all issues in our
CPN sample. Thus, we define the abnormal market share as the actual rate of change in market
share against the expected one for a typical CPN of the same age:
2 1 2 1 2 1,( ) ,( ) ,( )
ei t t i t t i t tAMS cMS cMS (6)
where 2 1 2 1,( ) , ,i t t i t i tcMS ms ms , ,ims is the market share in logs on day 1 2,t t ,
2 1,( ) 2 1( | ) ( | )ei t t j jcMS E ms j j E ms j j , js is the age of CPN i on day ts, s =1, 2 and E(.) is
the log of expected value calculated by evaluating model (5) at js and the estimated parameters.
5. Empirical results
The null hypothesis of zero abnormal performance due to rating announcements implies
that averaged abnormal yield spreads and averaged abnormal liquidity measures are zero. In this
case, the rating announcements do not contain relevant information. To test the statistical
significance of the mean for these series, we use a standard t-ratio test:
~ (0,1)a
x
xt N
s (7)
initial weeks of note life. The second is a smooth decreasing exponential function describing the declining trading
activity of the note as it matures. 21 Each parameter in the expression has an economic interpretation. See DMN (2006) for more details. 22 To save space, full details of this analysis are suppressed. They are available from the authors upon request. We
also estimate the model by using the raw effective trading volume as a dependent variable instead of the market
share. Results are similar to those presented in the paper.
16
where x is the cross-sectional averaged abnormal yield spread or abnormal liquidity computed in
each case, sx is the standard deviation of x. This t-ratio has an asymptotic standard normal
distribution under the null.23
To avoid the effects of non-normality (e.g., skewness and fat tails), we also compute the
median value of the series and two non-parametric tests. First, we use the Fisher sign test. This
test counts the number of times that one variable is positive. Under the null the test statistic
follows a binomial distribution with p = 0.5. Second, we apply the Wilcoxon signed-rank test,
which assumes that there is information in the magnitudes as well as the signs of the variable. To
calculate the test, we rank the variable from smallest to largest by absolute value. Then, we add
up all the ranks associated with positive values. We report p-values for the asymptotic normal
approximation to the distribution of the test.
5.1. Result for yield spreads
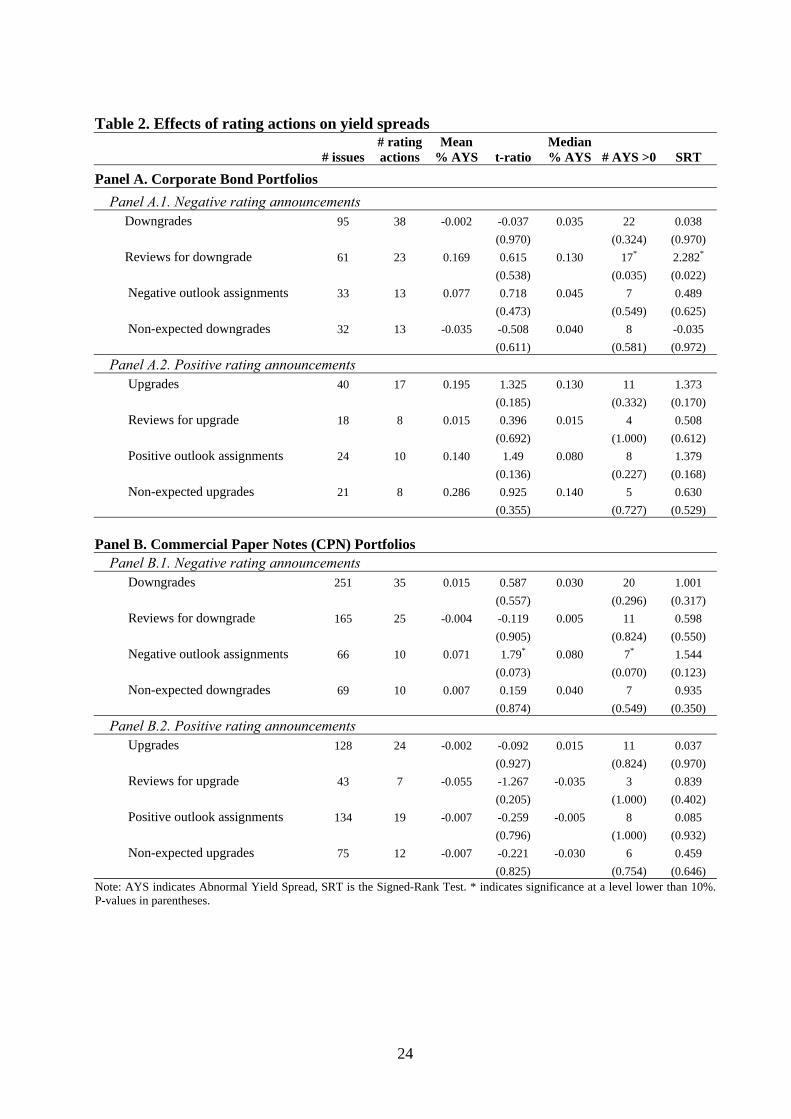
We first consider the impact of the different rating actions, i.e., actual rating changes,
rating reviews and outlook assignments, on the abnormal yield spreads, AYS. We also analyze
the sample of non-expected effective rating changes (a rating change not preceded by a rating
review in the same direction). In Table 2 we present the results for the corporate bond portfolios
(Panel A) and for the CPN portfolios (Panel B). We present results for negative rating
announcements (Panels A.1 and B.1) and for positive rating announcements (Panels A.2 and
B.2). Our results indicate that two negative rating announcements have a statistically significant
impact on yield spreads, whereas positive announcements seem to be irrelevant to both medium-
to long-term and short-term markets.
Results in Panel A.1, Table 2 are consistent with the view that ratings of non-U.S. bonds
are less informative than their U.S. counterparts, as Steiner and Heinke (2001) suggest. We do
not find significant effects in the sample of effective and non-expected effective downgrades. On
the other hand, we find a significant effect of the reviews for downgrade in the case of bond
portfolios, as the null hypothesis of median abnormal yield spread is rejected by the two non-
parametric tests applied. The review process seems to have enhanced the credit rating’s
traditional role as an information provider.
[Insert Table 2]
23 Note that for this test to be correct, the bond sample needs to be independent and identically distributed. As we
mentioned in Section 3, we analyze volume-weighted portfolios of corporate debt issued by the same company in
order to avoid correlation in the cross-section.

17
For the CPN portfolios (Panel B.1, Table 2), results also suggest that this market is
insensitive to effective rating downgrades, expected or not, as in the bond case. We find
statistically significant positive mean and median abnormal yield spreads around negative
outlook assignments, according to the t-ratio and the sign test. As we mentioned above, this
market has previously been unexplored, thus we do not have a reference to compare our results
to. The finding of evidence on information value of rating announcements in the CPN market is
remarkable, even though the particular characteristics of these securities could have prevented
any effect.
Overall, those results suggest that, prior to actual rating downgrades, the release of
negative rating indicators contains pricing-relevant information. In fact, these negative
announcements result in a widening of yield spreads as a consequence of an increase on their
credit spreads. Our results add new evidence to the predominant view of more recent papers that
state that rating reviews may even be more useful to the debt markets than rating changes,
causing larger effects on bond prices. In this sense, authors such as Altman and Rijken (2006),
Boot et al. (2006) and Löffler (2004) claim that CRAs prefer delaying effective rating changes to
avoid rating bounces or to keep the through-the-cycle rating stability. CRAs use the review
process and the outlooks as instruments to deliver precise and accurate information (Hirst and
Bannier, 2009) to the corporate debt markets. We observe that investors value the timely signal
embodied by negative reviews and outlooks but not the stable signal embodied by effective
downgrades.
Turning to Table 2, as can be observed in Panels A.2 and B.2, positive rating
announcements do not cause any significant yield spread changes on both market segments. The
interpretation is straightforward. These positive rating events do not contain pricing-relevant
information. Explanations can be found in previously posited hypotheses about an asymmetric
price reaction, such as the reputation hypothesis (Holthausen and Leftwich, 1986) and the moral
hazard risk problem (Covitz and Harrison, 2003).
5.2. Results for liquidity proxies
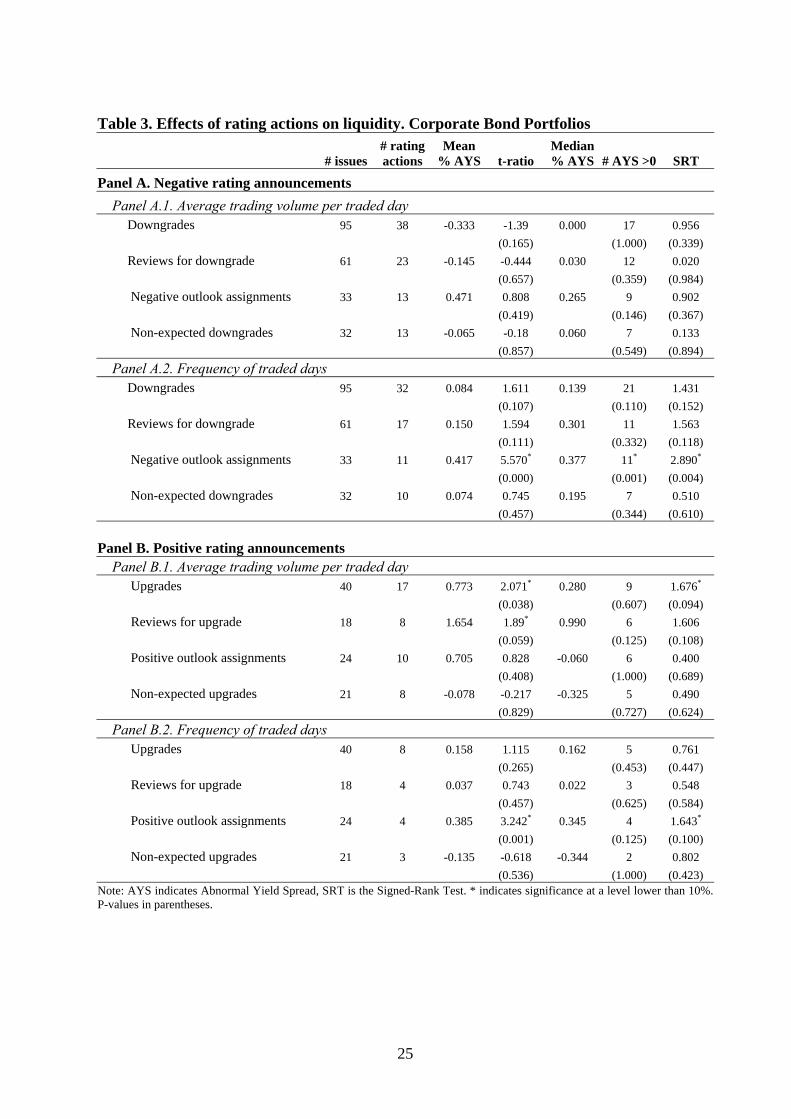
The results for the corporate bond portfolios are presented in Table 3. Panel A shows
negative rating actions and Panel B shows positive announcements. For the CPN portfolios,
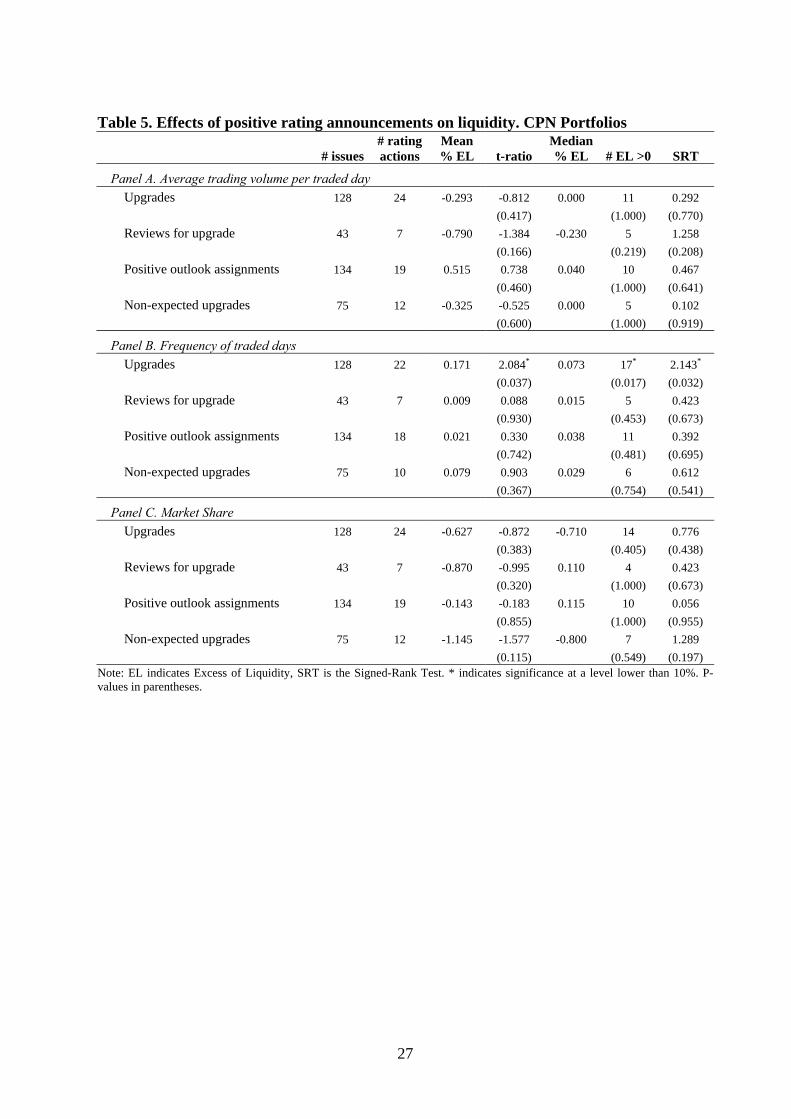
results are displayed in Tables 4 (downgrades) and 5 (upgrades). These tables provide evidence
of the different abnormal liquidity measures associated with several rating announcements in the
samples of both types of securities. Unlike in the yield spread analysis, we observe significant
effects, even in the case of positive announcements. Thus, different rating actions in any
direction cause an abnormal increase on the trading activity of the involved issues.

18
[Insert Table 3]
We find significant positive abnormal trading frequency according to all tests applied in
the bond portfolios after the outlook assignments, independent of the sign of the report (Panel
A.2 and B.2, Table 3). In the case of the average trading volume per traded day, we find an
increasing activity in the market after positive announcements, in particular, after upgrades and
reviews for upgrade, according to t-ratio and signed-rank tests (Panel B.1, Table 3). No
significant abnormal trading volumes are found for negative rating announcements. Although
institutional constraints and regulatory implications could have forced investors to liquidate their
positions in downgraded bonds, this is impossible to test because our sample only includes two
cases of downgrades from investment- to speculative-grade.
In general, those results are consistent with the predictions of traditional market
microstructure models. According to Kim and Verrecchia (1994), liquidity will deteriorate
around the release of an information event and return to normal afterwards. Kandel and Pearson
(1995) state that different interpretations of public signals resulting in high information
asymmetry might be the origin of abnormal increased trading volume occurring after the news
release. Our results also indicate that, similar to studies carried out on other informative events,
such as earnings disclosures, rating announcements improve stock market liquidity and reduce
information asymmetry through significant abnormal trading volumes around the day of the
news release.
In the case of the CPN portfolios (Tables 4 and 5), the results are not quite clear. All the
tests’ statistics calculated reject the null of no effect in the case of non-expected downgrades
(Panel C, Table 4) and in the case of effective upgrades (Panel C, Table 5). In both cases, trading
frequency increases. As in the case of bonds, these results are compatible with microstructure
models. However, the average trading volume per traded day seems to remain constant after
positive announcements. In these apathetic markets, rating announcements seem to arouse
investor interest for the affected securities, and that encourages the trading. On the other hand,
we do not find evidence of the appearance of larger transactions, which should denote possible
portfolio rebalancing.
[Insert Tables 4 and 5]
Finally, market response to reviews for downgrades in the CPN portfolios consists of a
decrease in the market share and the trading volume. We find negative significant means and
medians with all tests in the case of market share (Panel C, Table 4) and with t-ratio and signed-
rank tests in the case of trading volume (Panel A, Table 4). The particular issue system and
19
trading activity life cycle of these short-term securities can imply that investors prefer reducing
their trading and wait to liquidate their positions at maturity.
Remarkably, we find announcements that do not cause any significant yield spread
changes do cause abnormal trading activity. This result is compatible with the predictions of the
microstructure model proposed by Kim and Verrecchia (2001), who observe that traded volume
has less association with price in the case of events with poor disclosure quality.24 This result
also supports the nationality hypothesis pointing to the existence of difficulties of U.S.-based
CRAs in the rating of non-U.S. firms.
6. Conclusions
In this study, we analyze new aspects of the classical topic of whether or not rating
information is pricing-relevant and useful. We examine the impact of all types of rating
announcements, i.e., effective rating changes, rating reviews and outlook notices, on several
liquidity proxies and yield spreads in both the corporate bond and the CPN markets. We analyze
the Spanish case. This allows us to analyze if rating change announcements prompt a different
reaction in small versus large markets.
We find evidence that negative credit rating announcements, in particular, reviews for
downgrade and negative outlooks, convey pricing-relevant information to the market, even in the
previously unexplored CPN market. We observe that investors value the timely signal embodied
by negative reviews and outlooks but not the stable signal embodied by effective downgrades.
These results support the common perception that rating agencies do not respond quickly enough
to changes in credit conditions, in terms of through-the-cycle stability, the policy of rating
bounce avoidance, or even moral hazard problems. Consistent with the asymmetric price
reaction hypothesis, positive rating announcements do not cause any significant yield spread
changes in our samples.
24 Kim and Verrecchia (2001) model the relationships among firm disclosure, stock returns and trading volume
information. Their results can be extrapolated to other markets and different information events, such as rating
actions. According to their model, prices are affected by both publicly and privately held information. The
magnitude of private information can be inferred by observing the relationship between price changes and trading
volume. Due to adverse selection, the cost for the informed traders will be larger when information quality is poor
because this information disclosed to the public is incorporated into the trading volume and price. If the event
discloses less information, the traders who rely on the trading activities will be hurt because these activities reflect
less information of the firm. As a consequence, trading volume will have less association with prices in the case of
poor disclosure quality.
20
A key result is that announcements that do not cause any significant yield spread changes
do cause abnormal trading activity, which is measured in terms of trading frequency, trading
volume and market share. Outlook reports in the bond market and effective rating changes in the
CPN market do not contain pricing-relevant information, but they contain certain information
that leads investors to modify trading patterns after the announcements. Thus, the release of
information, even when this information could have already been incorporated into the market
prices, arouses investor interest for the securities affected by the rating announcement. These
results point to a lack of quality of the information disclosed by rating announcements in the
Spanish case, and this seems to support the hypothesis that rating actions are less informative in
non-U.S. markets.
Another result we observe is that trading volumes fade away after reviews for downgrade
in the CPN market. Investors seem to lose interest in the trading of these short-term securities
after the negative announcement and hold positions to maturity.
Finally, we have developed an analysis of two matters that have not been studied
previously: the effects of rating announcements on liquidity and on the short-term corporate debt
market. In this sense, there is a need for future research to address this gap in the literature by
studying these matters in U.S. and in other international corporate debt markets.
References
Abad, P., Díaz, A., and Robles, M. D. (2010): “Determinants of abnormal liquidity after rating actions in the Corporate Debt Market”, International Review of Applied Financial Issues and Economics, forthcoming.
Altman, E. I. and Rijken, H. A. 2006: “A point-in-time perspective on through-the-cycle ratings”, Financial Analysts Journal, 62(1), 54-70
Altman, E. I. and Rijken, H. A. 2007: “The added value of Rating Outlooks and Rating Reviews to corporate bond ratings”, Financial Management Association meeting, Barcelona
Amihud, Y., and Mendelson, H., 1991: “Liquidity, maturity, and the yields on U.S. Treasury securities”, Journal of Finance, 46(4), 1411-1425
Behr, P. and Güttler, A. 2008: “The informational content of unsolicited ratings”, Journal of Banking and Finance, 32, 587–599
Boot, A.W.A., Milbourn, T.T., and A. Schmeits, 2006: “Credit Ratings as Coordination Mechanisms”, The Review of Financial Studies, 19 (1), 81–118
Cantor, R., 2001: “Moody’s investors service response to the consultative paper issued by the Basel Committee on Banking Supervision and its implications for the rating agency industry”, Journal of Banking and Finance, 25, 171–186
Covitz, D.M. and Harrison, P., 2003: “Testing Conflicts of Interest at Bond Ratings Agencies with Market Anticipation: Evidence that Reputation Incentives Dominate”, Finance and Economics Discussion Series 2003–68, Washington: Board of Governors of the Federal Reserve System.
Crabbe, L. and Post, M. A., 1994: “The effect of a rating downgrade on outstanding commercial paper”, Journal of Finance, 49, 39–56
Crouchy, M.G., Jarrow, R.A., and Turnbull, S.M. 2008: “The Subprime Credit Crisis of 2007”, The Journal of Derivatives, 4, 81–110

21
Dallocchio, M., Hubler, J., Raimbourg, P., and Salvi, A., 2006: “Do Upgradings and Downgradings Convey Information? An Event Study of the French Bond Market”, Economic Notes: Review of Banking, Finance and Monetary Economics, 35 (3), 293–317
Díaz, A. and Navarro, E., 2002: “Yield spread and term to maturity: default vs. liquidity” European Financial Management, 8(4), 449–477
Díaz, A., Merrick, J. and Navarro, E., 2006: “Spanish Treasury Bond Market Liquidity and Volatility Pre– and Post–European Monetary Union”, Journal of Banking and Finance, 30, 1309–32
Díaz, A., and Skinner, F., 2003: “Estimating corporate yield curves”, The Journal of Fixed Income, September, 95–103
Dichev, I.D., and Piotroski, J.D., 2001: “The long–run stock returns following bond rating changes”, Journal of Finance, 56, 173–203
Edwards, A.K.; Harris, L.E.; and Piwowar, M.S., 2007: “Corporate Bond Market Transaction Costs and Transparency”, Journal of Finance, 62 (3), 1421–1451
Ellul, A., Jotikasthira, C., and Lundblad, C.T., 2009: “Regulatory Pressure and Fire Sales in the Corporate Bond Markets”, available at SSRN: http://ssrn.com/abstract=1362182
Elton, E.J., and Green, T.C., 1998: “Tax and liquidity effects in pricing government bonds”, Journal of Finance, 53(5), 1533–1562
European Parliament, 2009: “European Parliament legislative resolution of 23 April 2009 on the proposal for a regulation of the European Parliament and of the Council on Credit Rating Agencies”, P6_TA(2009)0279.
Fisher, L., 1959: “Determinants of risk premiums of corporate bonds”, Journal of Political Economy, 67(3), 217–237
Fleming, M.J., 2001: “Measuring Treasury market liquidity”, Federal Reserve Bank of New York Staff Reports 133, June
Gatev, E. and Strahan, P.E., 2006: “Banks' advantage in hedging liquidity risk: theory and evidence from the commercial paper market”, Journal of Finance, 61(2), 867–92
Goldreich, D.; Hanke, B. and Nath, P., 2005, “The Price of Future Liquidity: Time–Varying Liquidity in the U.S. Treasury Market”, Review of Finance, 9, 1–32
Gropp, R. and Richards A., 2001: “Rating agency actions and the pricing of debt and equity of European banks: What can we infer about private sector monitoring of bank soundness?” Economic Notes by Banca Monte dei Paschi di Siena, 30(3), 373–398
Hand, J., Holthausen, R. and Leftwich, R., 1992: “The effect of bond rating agency announcements on bond and stock prices”, Journal of Finance, 57, 733–752
Hirsch, C., and Bannier, C.E. 2009: “The economic function of credit rating agencies – What does the watchlist tell us?” mimeo, SSRN: http://ssrn.com/abstract=1343421
Hite, G. and Warga, A., 1997: “The effect of bond rating changes on bond price performance”, Financial Analysts Journal, 53, 35–51
Holthausen, R.W. and Leftwich, R.W. 1986: “The Effect of Bond Rating Changes on Common Stock Prices”, Journal of Financial Economics, 17(1), 57–89
Howe, J. 1995: “Credit analysis for corporate bonds”, in F.J. Fabozzi and T.D. Fabozzi, Ed., The Handbook of Fixed Income Securities, New York, Irwin Professional Publishing, 373–410
Houweling, P., Mentink, A. and Vorst, T. 2005: “Comparing possible proxies of corporate bond liquidity”, Journal of Banking & Finance, 29(6), 1331–1358
Hull, J., Predescu M. and White, A. 2004: “The relationship between credit default swap spreads, bonds yields, and credit rating announcements”, Journal of Banking & Finance, 28(11), 2789–2811
Ingram, R., Brooks, L. and Coperland, R., 1983: “The information content of bond rating changes: A note”, Journal of Finance, 38, 997–1003
Jorion, P., and Zhang, G., 2007: “Good and bad credit contagion: Evidence from credit default swaps”, Journal of Financial Economics, 84, 860–883
Kandel, E. and Pearson, N. 1995: “Differential interpretation of public signals and trade in speculative markets”, Journal of Political Economy, 103, 831–872
Kim, O. and Verrecchia, R.E. 1994: “Market Liquidity and Volume Around Earnings Announcements”. Journal of Accounting and Economics, 17, 41–67.
Kim, O. and Verrecchia, R.E. 2001: “The relation among disclosure, returns, and trading volume information”, Accounting Review, 76, 633–654.

22
Kliger, D. and Sarig, O., 2000: “The information value of bond ratings”, Journal of Finance, 55, 2879–902
Liu P.; Seyyed, F. and Smith, S. 1999: “The independent impact of credit rating changes—the case of Moody’s rating refinement on yield premiums”. Journal of Business Finance and Accounting, 26(3):337–363.
Löffler, G., 2004: “An anatomy of rating through the cycle”, Journal of Banking and Finance, 28, 695–720
Löffler, G., 2005: “Avoiding the rating bounce: why rating agencies are slow to react to new information”, Journal of Economic Behavior & Organization, 56, 365–381
Mahanti, S.; Nashikkar, A.; Subrahmanyam, M.G.; Chacko, G; and Mallik, G., 2008: “Latent Liquidity: A New Measure of Liquidity, with an Application to Corporate Bonds”, Journal of Financial Economics, 88 (2), 272–298
Nayar, N. and Rozeff, M. S. 1994: “Ratings, Commercial Paper, and Equity Returns” Journal of Finance, 49 (4), 1431–1449.
Nelson, C.R. and Siegel, A.F. 1987: “Parsimonious modelling of yield curves”, Journal of Business, 60, 473–489.
Norden, L., and Weber, M., 2004: “Informational efficiency of credit default swap and stock markets: The impact of credit rating announcements”, Journal of Banking and Finance, 28, 2813–2843
Odders–White, E.R. and Ready, M.J., 2006: “Credit Ratings and Stock Liquidity”, Review of Financial Studies, 19 (1), 119–157
Perraudin, W.R.M. and Taylor, A.P., 2004: “On the Consistency of Ratings and Bond Market Yields”, Journal of Banking & Finance, 28 (11), 2769–2788
Sarig, O., and Warga, A., 1989: “Bond price data and bond market liquidity”, Journal of Financial and Quantitative Analysis, 24(3), 367–378
Steiner, M. and Heinke, V. G., 2001: “Event study concerning international bond price effects of credit rating actions” International Journal of Finance and Economics, 6, 139–157
U.S. SEC, 2008: “Summary Report of Issues Identified in the Commission Staff’s Examinations of Select Credit Rating Agencies”, July.
U.S. Senate, 2002: ‘‘Financial Oversight of Enron: The SEC and Private Sector Watchdogs,’’ Committee on Governmental Affairs Staff Report, October.
Wakeman, L. M., 1978: “Bond rating agencies and the capital markets”, working paper, University of Rochester, New York
Wakeman, L. M., 1990: “The real function of bond rating agencies”, The Modern Theory of Corporate Finance, 2nd ed. Edited by Smith, C. McGaw Hill, New York
Warga, A., 1992: “Bond returns, liquidity, and missing data”, Journal of Financial and Quantitative Analysis, 27(4), 605–617
Weinstein, M. J., 1977: “The effect of a rating change announcement on bond price” Journal of Financial Economics, 5, 329–350
Zaima, J.K. and McCarthy, J., 1988: “The impact of bond rating changes on common stocks and bonds: Tests of the wealth redistribution hypothesis” Financial Review, 23 (4), 483–498
23
Table 1. Rating action announcements analyzed Corporate
bonds Commercial paper (CPN)
Both segments
Panel A: Distribution by rating action Effective Downgrade 38 (25) 35 (25) 24 Review for Downgrade 23 25 15 Negative Outlook Assignment 13 10 8 Effective Upgrade 17 (9) 24 (12) 12 Review for Upgrade 8 7 4 Positive Outlook Assignment 10 19 8 Total 109 (34) 120 (37) 71 Panel B: Distribution by year 1994 9 -- 1995 1 -- 1996 1 -- 1997 6 -- 1998 10 2 1999 11 12 2000 14 19 2001 13 17 2002 25 39 2003 16 24 2004 3 7 Total 109 120 Panel C: Distribution by issuer Financial sector 10 17 8 Total 15 23 10 Note: Expected rating changes in italics and parentheses
24
Table 2. Effects of rating actions on yield spreads
# issues # rating actions
Mean % AYS t-ratio
Median % AYS # AYS >0 SRT
Panel A. Corporate Bond Portfolios
Panel A.1. Negative rating announcements Downgrades 95 38 -0.002 -0.037 0.035 22 0.038
(0.970) (0.324) (0.970)
Reviews for downgrade 61 23 0.169 0.615 0.130 17* 2.282*
(0.538) (0.035) (0.022)
Negative outlook assignments 33 13 0.077 0.718 0.045 7 0.489
(0.473) (0.549) (0.625)
Non-expected downgrades 32 13 -0.035 -0.508 0.040 8 -0.035
(0.611) (0.581) (0.972)
Panel A.2. Positive rating announcements Upgrades 40 17 0.195 1.325 0.130 11 1.373
(0.185) (0.332) (0.170)
Reviews for upgrade 18 8 0.015 0.396 0.015 4 0.508
(0.692) (1.000) (0.612)
Positive outlook assignments 24 10 0.140 1.49 0.080 8 1.379
(0.136) (0.227) (0.168)
Non-expected upgrades 21 8 0.286 0.925 0.140 5 0.630
(0.355) (0.727) (0.529)
Panel B. Commercial Paper Notes (CPN) Portfolios Panel B.1. Negative rating announcements
Downgrades 251 35 0.015 0.587 0.030 20 1.001
(0.557) (0.296) (0.317)
Reviews for downgrade 165 25 -0.004 -0.119 0.005 11 0.598
(0.905) (0.824) (0.550)
Negative outlook assignments 66 10 0.071 1.79* 0.080 7* 1.544
(0.073) (0.070) (0.123)
Non-expected downgrades 69 10 0.007 0.159 0.040 7 0.935
(0.874) (0.549) (0.350)
Panel B.2. Positive rating announcements
Upgrades 128 24 -0.002 -0.092 0.015 11 0.037
(0.927) (0.824) (0.970)
Reviews for upgrade 43 7 -0.055 -1.267 -0.035 3 0.839
(0.205) (1.000) (0.402)
Positive outlook assignments 134 19 -0.007 -0.259 -0.005 8 0.085
(0.796) (1.000) (0.932)
Non-expected upgrades 75 12 -0.007 -0.221 -0.030 6 0.459
(0.825) (0.754) (0.646) Note: AYS indicates Abnormal Yield Spread, SRT is the Signed-Rank Test. * indicates significance at a level lower than 10%. P-values in parentheses.
25
Table 3. Effects of rating actions on liquidity. Corporate Bond Portfolios
# issues # rating actions
Mean % AYS t-ratio
Median % AYS # AYS >0 SRT
Panel A. Negative rating announcements
Panel A.1. Average trading volume per traded day Downgrades 95 38 -0.333 -1.39 0.000 17 0.956
(0.165) (1.000) (0.339)
Reviews for downgrade 61 23 -0.145 -0.444 0.030 12 0.020
(0.657) (0.359) (0.984)
Negative outlook assignments 33 13 0.471 0.808 0.265 9 0.902
(0.419) (0.146) (0.367)
Non-expected downgrades 32 13 -0.065 -0.18 0.060 7 0.133
(0.857) (0.549) (0.894)
Panel A.2. Frequency of traded days Downgrades 95 32 0.084 1.611 0.139 21 1.431
(0.107) (0.110) (0.152)
Reviews for downgrade 61 17 0.150 1.594 0.301 11 1.563
(0.111) (0.332) (0.118)
Negative outlook assignments 33 11 0.417 5.570* 0.377 11* 2.890*
(0.000) (0.001) (0.004)
Non-expected downgrades 32 10 0.074 0.745 0.195 7 0.510
(0.457) (0.344) (0.610)
Panel B. Positive rating announcements Panel B.1. Average trading volume per traded day Upgrades 40 17 0.773 2.071* 0.280 9 1.676*
(0.038) (0.607) (0.094)
Reviews for upgrade 18 8 1.654 1.89* 0.990 6 1.606
(0.059) (0.125) (0.108)
Positive outlook assignments 24 10 0.705 0.828 -0.060 6 0.400
(0.408) (1.000) (0.689)
Non-expected upgrades 21 8 -0.078 -0.217 -0.325 5 0.490
(0.829) (0.727) (0.624)
Panel B.2. Frequency of traded days Upgrades 40 8 0.158 1.115 0.162 5 0.761
(0.265) (0.453) (0.447)
Reviews for upgrade 18 4 0.037 0.743 0.022 3 0.548
(0.457) (0.625) (0.584)
Positive outlook assignments 24 4 0.385 3.242* 0.345 4 1.643*
(0.001) (0.125) (0.100)
Non-expected upgrades 21 3 -0.135 -0.618 -0.344 2 0.802
(0.536) (1.000) (0.423) Note: AYS indicates Abnormal Yield Spread, SRT is the Signed-Rank Test. * indicates significance at a level lower than 10%. P-values in parentheses.

26
Table 4. Effects of negative rating announcements on liquidity. CPN Portfolios
# issues # rating actions
Mean % EL t-ratio
Median % EL # EL >0 SRT
Panel A. Average trading volume per traded day
Downgrades 251 35 0.189 0.476 0.245 20 0.92
(0.634) (0.296) (0.357)
Reviews for downgrade 165 25 -1.605 -2.587* -1.980 15 2.296*
(0.010) (0.210) (0.022)
Negative outlook assignments 66 10 0.154 0.233 -0.010 5 0
(0.816) (1.000) (1.000)
Non-expected downgrades 69 10 0.479 0.965 0.900 8 1.022
(0.334) (0.227) (0.307)
Panel B. Frequency of traded days
Downgrades 251 34 0.055 1.031 0.005 18 0.735
(0.303) (0.864) (0.462)
Reviews for downgrade 165 25 0.025 0.432 -0.029 14 0.215
(0.666) (0.690) (0.830)
Negative outlook assignments 66 9 -0.001 -0.009 -0.031 5 0.000
(0.992) (1.000) (1.000)
Non-expected downgrades 69 9 0.139 1.885* 0.018 8* 2.014*
(0.059) (0.039) (0.044)
Panel C. Market Share
Downgrades 251 35 0.315 0.504 -0.150 19 0.134
(0.614) (0.868) (0.894)
Reviews for downgrade 165 25 -2.576 -3.261* -3.570 20* 2.704*
(0.001) (0.004) (0.007)
Negative outlook assignments 66 10 -0.968 -0.986 -0.830 6 0.711
(0.324) (0.508) (0.477)
Non-expected downgrades 69 10 -0.135 -0.127 -0.420 7 0.489
(0.899) (0.549) (0.625) Note: EL indicates Excess of Liquidity, SRT is the Signed-Rank Test. * indicates significance at a level lower than 10%. P-values in parentheses.
27
Table 5. Effects of positive rating announcements on liquidity. CPN Portfolios
# issues # rating actions
Mean % EL t-ratio
Median % EL # EL >0 SRT
Panel A. Average trading volume per traded day
Upgrades 128 24 -0.293 -0.812 0.000 11 0.292
(0.417) (1.000) (0.770)
Reviews for upgrade 43 7 -0.790 -1.384 -0.230 5 1.258
(0.166) (0.219) (0.208)
Positive outlook assignments 134 19 0.515 0.738 0.040 10 0.467
(0.460) (1.000) (0.641)
Non-expected upgrades 75 12 -0.325 -0.525 0.000 5 0.102
(0.600) (1.000) (0.919)
Panel B. Frequency of traded days
Upgrades 128 22 0.171 2.084* 0.073 17* 2.143*
(0.037) (0.017) (0.032)
Reviews for upgrade 43 7 0.009 0.088 0.015 5 0.423
(0.930) (0.453) (0.673)
Positive outlook assignments 134 18 0.021 0.330 0.038 11 0.392
(0.742) (0.481) (0.695)
Non-expected upgrades 75 10 0.079 0.903 0.029 6 0.612
(0.367) (0.754) (0.541)
Panel C. Market Share
Upgrades 128 24 -0.627 -0.872 -0.710 14 0.776
(0.383) (0.405) (0.438)
Reviews for upgrade 43 7 -0.870 -0.995 0.110 4 0.423
(0.320) (1.000) (0.673)
Positive outlook assignments 134 19 -0.143 -0.183 0.115 10 0.056
(0.855) (1.000) (0.955)
Non-expected upgrades 75 12 -1.145 -1.577 -0.800 7 1.289
(0.115) (0.549) (0.197) Note: EL indicates Excess of Liquidity, SRT is the Signed-Rank Test. * indicates significance at a level lower than 10%. P-values in parentheses.