Embed Size (px)
Citation preview

Electronic copy available at: http://ssrn.com/abstract=2625736
Credit Ratings and Acquisitions
Nihat Aktas, Nikolaos Karampatsas, Dimitris Petmezas, and Henri Servaes
This draft: November, 2015
Abstract
We document a curvilinear relation between credit ratings and acquisitions. Acquisitions first increase and then decrease as ratings improve, with a high around the A− threshold. The increase at low rating levels is accompanied by lower announcement returns. Acquisitions have a negative impact on future ratings for highly-rated firms, and a positive impact for firms with low ratings, even after controlling for all the characteristics potentially influenced by the transaction. These results indicate that credit ratings exert substantial influence on the acquisition process, and that rating agencies pay particular attention to acquisitions when deciding on the creditworthiness of firms. ______________________ Nihat Aktas is from WHU Otto Beisheim School of Management, Vallendar, Germany, E-mail: [email protected]. Nikolaos Karampatsas is from Surrey Business School, University of Surrey, UK, E-mail: [email protected]. Dimitris Petmezas is from Surrey Business School, University of Surrey, UK, E-mail: [email protected]. Henri Servaes (corresponding author) is from London Business School, UK, and is also affiliated with CEPR and ECGI, E-mail: [email protected]. We are grateful to Aysun Alp, Evrim Akdogu, Taylor Begley, Gilles Chemla, João Cocco, Edith Ginglinger, Jarrad Harford, John McConnell, Jean-Marie Meier, Oguzhan Ozbas, Serif Aziz Simsir, and seminar participants at Koç University, Paris Dauphine, Sabanci University, the University of Groningen and WHU Otto Beisheim School of Management, for helpful comments and suggestions, and to Bo Bian for excellent research assistance.

Electronic copy available at: http://ssrn.com/abstract=2625736
Credit Ratings and Acquisitions
Abstract
We document a curvilinear relation between credit ratings and acquisitions. Acquisitions first increase and then decrease as ratings improve, with a high around the A− threshold. The increase at low rating levels is accompanied by lower announcement returns. Acquisitions have a negative impact on future ratings for highly-rated firms, and a positive impact for firms with low ratings, even after controlling for all the characteristics potentially influenced by the transaction. These results indicate that credit ratings exert substantial influence on the acquisition process, and that rating agencies pay particular attention to acquisitions when deciding on the creditworthiness of firms.

1
1. Introduction
Credit rating agencies play an important role in global markets by evaluating the credit quality of
debt issuers and reducing the information asymmetry between firms and investors, thereby allowing
rated firms to access the public debt market more easily. In fact, the lack of a rating is employed in a
number of articles as a proxy for financial constraints (see, for example, Whited, 1992; Almeida,
Campello, and Weisbach, 2004; Faulkender and Petersen, 2006; Denis and Sibilkov, 2010). In support of
this view, Harford and Uysal (2014) show that being rated indeed relaxes financing constraints and has a
real effect on acquisition decisions.1
Even among rated firms, however, there are several channels through which the rating level could
influence acquisition behavior and associated returns, but these channels have not been studied in the
literature. In this paper, we remedy this deficiency by conducting an in-depth investigation of the role of
rating agencies in the acquisitions process. In particular, we examine whether the level of the rating and
previous rating changes affect acquisition activity and associated stock returns; we also study the impact
of merger activity on subsequent rating changes. Understanding acquisition decisions and related wealth
creation is of first order importance, given the tremendous reallocation of resources in these
transactions. For example, U.S. firms alone spent $2 trillion on acquisitions during 2014. Moreover,
given that ratings have a material impact on the cost of debt, understanding how ratings are affected by
acquisition decisions is also of primary importance.
There are many reasons why ratings could influence the acquisition process. First, as discussed
above, rated firms are less likely to be capital constrained, providing them with more opportunities to
exhaust their investment opportunity set. Acquisitions are but one of these potential investments.
Nevertheless, even if a firm has obtained a rating, cross-sectional and time-series differences in the level
of the rating are likely to also influence acquisition decisions. Firms with low, non-investment-grade
1 See also Sufi (2009), who examines the introduction of syndicated bank loan ratings by Moody’s and S&P and finds
that rated firms increase debt, asset growth, and cash acquisitions.

2
ratings are still likely to be capital constrained (see, for example, Campello, Graham, and Harvey, 2010),
preventing them from making all potential acquisitions, especially when they are cash financed. As
ratings improve, constraints are likely to weaken and we would expect these firms to engage in more
acquisition activities as a result. Once ratings reach a certain threshold, however, additional
improvements in ratings are less likely to alleviate financial constraints any further, which would abate or
eliminate the effect of additional rating increases on acquisition decisions.
Second, rating agencies also serve as monitors, a role emphasized by Boot, Milbourn, and Schmeits
(2006), among others. Firms that make decisions that increase the likelihood of default or decrease
recovery given default will face a greater risk of being downgraded, leading to higher debt costs, and a
negative stock price reaction upon the downgrade (see Hand, Holthausen, and Leftwich, 1992). This is
exactly what previous research finds for acquisitions: leverage and the associated default risk increase, on
average, following acquisitions (see, for example, Billett, King, and Mauer, 2004; Furfine and Rosen,
2011).2 These are likely accompanied with credit rating downgrades. Such downgrades need not be
avoided, however, if the acquisition is value-creating for shareholders and if the rating is simply a
reflection of increased credit risk. Yet, prior work suggests that firms do avoid taking on additional
leverage if this would lead to a downgrade or would prevent them from being upgraded (see Kisgen,
2006). Such considerations could also apply to acquisitions. Of course, these arguments alone do not
imply a relation between rating levels and acquisition activity as they apply to all firms at all ratings
thresholds. However, the increased cost in debt associated with a downgrade is most salient around the
investment grade threshold and is not always related to actual changes in credit quality. Chernenko and
Sunderam (2012), for example, argue that there are discrete changes in the label from investment to
non-investment grade, unrelated to continuous measures of default risk, and they report that these
2 According to a recent Standard & Poor’s (S&P) study by Arden and McGovern (2013), circa half of the U.S.
companies rated by S&P that had completed major acquisitions (transaction values of more than $5 billion) since 2000 had a lower rating by 2013. Among the factors explaining the decrease in rating, the authors emphasize the overestimation of synergies, failure in post-merger integration, and increase in leverage.

3
changes affect a firm’s investment decisions. In related work, Chen, Lookman, Schurhoff, and Seppi
(2014) find that when a series of non-investment grade bonds were mechanically relabeled investment
grade as a result of a Lehman Brothers index redefinition, yields on these bonds declined by 21 basis
points. Thus, if mergers put downward pressure on ratings, we would expect firms around the non-
investment grade cutoff in particular to reduce their acquisition frequency.
Third, firms and their managers may also derive other benefits from having higher ratings. Higher
ratings may improve contracting with customers and other parties, and open up or improve access to the
commercial paper market. Klapper, Laeven, and Rajan (2012), for example, show that the most
creditworthy buyers receive trade contracts with the longest maturities.3 In addition, managers may also
derive utility from having a higher rating per se. Graham and Harvey (2001) report that managers are
particularly worried about their credit rating when deciding on the level of debt. While it is not clear that
the credit rating, by itself, should carry substantial weight in capital structure decisions after controlling
for all variables related to credit ratings, such as bankruptcy costs and the volatility of earnings, Graham
and Harvey (2001) find that it does. If a firm’s decision making is aimed at maintaining the current rating
− whatever the forces are that have led the firm to adopt that particular rating as the ideal one − then
firms may well refrain from taking any action that could jeopardize their rating. This could be particularly
relevant at higher rating levels as there is evidence that rating changes are much more sensitive to
changes in perceived default risk for firms at the top end of the ratings spectrum; in particular, the work
by Altman (1998), Lando and Skødeberg (2002), and Standard & Poor’s (2013) shows that the rating
migration probabilities and the likelihood of a downgrade are higher for firms with higher credit ratings
than for those with low ratings. These arguments combined imply that firms reduce their acquisition
likelihood as ratings improve and that this effect is particularly germane at the highest rating levels.
3 See Kisgen (2006) for a discussion of the relation between commercial paper access and credit ratings and
Standard and Poor’s (2008) for a discussion of other contracting benefits associated with higher ratings.

4
Finally, high ratings could just be a reflection of overly conservative management willing to forego
acquisition opportunities, even if they are deemed value increasing because there is too much downside
risk. In fact, Standard and Poor’s recognizes this possibility when discussing their ratings criteria. They
argue that: “[…] managing for a very high rating can sometimes be inconsistent with the company’s
ultimate best interests, if it means being overly conservative and forgoing opportunities.” (Standard and
Poor’s, 2008, p. 36).
We investigate these arguments using a sample of 2,230 U.S. firms with a credit rating over the
period from 1989 to 2011 (20,488 firm-year observations) that conducted 4,772 acquisitions from 1990
to 2012. We report several novel results on the role of ratings in the acquisition process. The relation
between credit ratings and acquisitiveness that we discover is broadly curvilinear, where acquisition
likelihood first increases and then decreases as ratings improve. Firms with a rating around the A minus
level are the most acquisitive. The only rating levels where the upward sloping part of the relation
between ratings and acquisitions is disrupted, is around the investment-grade threshold where firms
refrain from making more acquisitions as ratings increase. These patterns are broadly consistent with the
arguments made above. Consistent with the financial constraints argument, at low levels of debt ratings,
below the BB+ level, the likelihood of making an acquisition and the amount spent on acquisitions both
increase as debt ratings improve. At ratings of BB+, the highest non-investment grade rating, and BBB−,
the lowest investment grade rating, there are no further increases in the likelihood of doing a deal, and,
in fact, there is some evidence of a decline in transactions. This result supports the view that around the
investment/non-investment grade threshold, firms become particularly reluctant to take actions that
might lead to a downgrade or jeopardize a possible upgrade.
Additional modest increases in acquisition activity beyond a BBB− rating up to a rating of about A−
are consistent with a further relaxation of financial constraints at higher rating levels. The negative
relation between acquisitiveness and ratings beyond the A− threshold, on the other hand, supports the
view that managers with high ratings are reluctant to take any action that can jeopardize the rating and

5
that this aversion becomes stronger as ratings increase. This evidence suggests that managers attach
value to specific debt ratings per se, with higher valuations attached to higher ratings.
To explore our interpretation of the results in more detail, we conduct several additional tests.
First, we show that these findings hold after controlling for a number of factors related to default risk,
such as leverage and cash holdings. In fact, even after controlling for distance to default, our findings
persist. Thus, ratings have an independent impact on acquisition likelihood. In addition, we repeat our
analysis for subsamples of cash and stock acquisitions. The results for cash acquisitions parallel our main
findings, and are consistent with the financial constraints argument at low rating levels. For stock-
financed acquisitions by firms with low ratings, there is no evidence of an increase in acquisitions as
ratings improve, suggesting that constraints only bind when firms fund the acquisition with cash. For
highly-rated firms, the relation between acquisitions and ratings is negative for both cash and stock
acquisitions. Thus, highly-rated firms reduce their acquisitiveness in general as their rating increases,
irrespective of the payment method, consistent with a strong aversion to possible downgrades.
Second, we demonstrate that lagged rating actions also affect acquisition decisions. Prior research
documents momentum in ratings, such that a downgrade tends to be followed by another one (see, for
example, Altman and Kao, 1992; Lando and Skødeberg, 2002). Firms take this phenomenon into account
and adjust their acquisitions downwards if they have recently been downgraded, even after controlling
for current ratings. The impact of past downgrades appears similar across rating categories, but given
that highly-rated firms are less acquisitive, the effect of past rating actions is relatively larger for firms
with higher ratings. With regards to past upgrades, there is no significant impact on acquisition decisions.
Third, we study whether the announcement effect associated with acquisitions is consistent with
the financial constraints story for firms below the investment grade threshold and find this to be the case.
Acquirer returns decline by 38 basis points for every notch increase in ratings as ratings increase from
their lowest levels until close to the investment grade threshold, suggesting that improvements in ratings
allow firms to further exhaust their acquisition opportunity set. Beyond this cutoff, though, there are no

6
additional reductions in returns, which implies that the financial constraints argument cannot explain
acquisition levels for investment grade firms. There is also no evidence of a positive relation between
returns and ratings for higher-rated firms. Thus, while firms with high ratings reduce their
acquisitiveness, they appear unable to select those acquisitions that yield the highest shareholder
returns.
Fourth, we explore whether mergers indeed put pressure on debt ratings. We start by
documenting that highly-rated firms are more likely to be downgraded after making acquisitions than
otherwise, consistent with their reluctance to make acquisitions. For firms with low ratings, on the other
hand, the results are reversed: acquisitions are more likely to be associated with future upgrades. These
findings continue to hold after controlling for all other financial characteristics, including those that may
have changed due to the acquisition, such as leverage and risk. They also hold after controlling for prior
stock price performance, and the stock returns associated with the acquisition announcements. Thus,
acquisitions receive particular scrutiny from rating agencies, beyond their immediate impact on the firm’s
stock price or solvency ratios.
This paper makes contributions to the literature on the determinants of mergers and acquisitions
(M&A), the monitoring role of rating agencies, and the importance of credit frictions, in general. The
M&A literature posits many reasons for doing deals, which can be broadly classified into four groups: (a)
improved efficiency (see, for example, Jovanovic and Rousseau, 2002; Maksimovic and Philips, 2001); (b)
agency costs on the part of the target and/or empire-building and hubris on the part of the acquirer,
(Manne, 1965; Jensen, 1986; Roll, 1986); (c) misvaluation of targets and/or acquirers (Bradley, Desai, and
Kim, 1983; Shleifer and Vishny, 2003); (d) expropriation of other parties such as debtholders and
employees (see, for instance, Shleifer and Summers, 1988). Several authors have argued that these
elements only trigger acquisitions when overall capital liquidity and liquidity in the market for specific
corporate assets is sufficiently high (Schlingemann, Stulz, and Walkling, 2002; Harford, 2005). After
controlling for these effects, our paper illustrates that a firm’s credit rating has an independent impact on

7
the acquisitiveness of corporations and that this impact depends on where firms are located on the
ratings scale.
We also provide additional evidence on the monitoring role of credit rating agencies and the
determinants of ratings by showing that merger activity has a negative influence on ratings for firms with
the lowest default risk and a positive influence on firms with the highest default risk, regardless of how
the acquisition was received by the stock market.
In addition, we add to the growing literature showing the real effects of ratings on corporate
decisions. Kisgen (2006, 2009), Jung, Soderstrom, and Yang (2013), Alissa, Bonsall, Koharki, and Penn
(2013) and Begley (2015) all demonstrate that firms are concerned about their credit rating levels and
adjust their corporate policies to attain or maintain specific rating targets. We show that concerns about
rating downgrades may lead firms with high investment grade ratings to refrain from making acquisitions.
Finally, at the lower end of the rating scale, our evidence is related to the literature that
investigates how credit supply frictions affect corporate investment (see, for example, Lemmon and
Roberts, 2010; Chernenko and Sunderam, 2012; Becker and Ivashina, 2014; Harford and Uysal, 2014).
Closest to our work is Harford and Uysal (2014), who compare the acquisition behavior of rated versus
unrated firms. They find that rated firms are more likely to make acquisitions, and their announcement
returns, while positive, are lower than those of unrated firms, which indicates that rated firms can further
deplete their investment opportunities compared to unrated firms. Our evidence suggests that even
within the subset of rated firms, there is still substantial cross-sectional variation in acquisition behavior.
In particular, we find that firms with lower non-investment grade ratings make fewer and more valuable
acquisitions than similar non-investment grade firms with a higher rating. In addition, we show that the
relation between ratings and acquisitiveness is reversed for highly-rated firms.
The remainder of the paper proceeds as follows. Section 2 describes our sample selection
procedure and presents summary statistics. Section 3 is devoted to the empirical analyses of the impact

8
of rating levels on firm acquisitiveness and associated stock returns. Section 4 reports results on the
effect of past acquisitions on the acquirer’s credit rating. Finally, Section 5 concludes the paper.
2. Sample description
We start with all U.S. listed firms covered by Compustat that have a Standard and Poor’s credit
rating available in any given year over the period 1989 to 2011. Following previous studies (see, for
example, Hovakimian, Opler and Titman, 2001; Harford and Uysal, 2014), we exclude financial firms (SIC
codes 6000-6999) and regulated utilities (SIC codes 4900-4999) from our sample. Firms with a rating of D
(default) or SD (selective default) are also excluded from our analysis as in Alissa, Bonsall, Koharki, and
Penn (2013) and Alp (2013). Our sample includes 2,230 unique firms for a total of 20,488 firm/year
observations.
For each firm in the sample, we obtain all the completed transactions listed in the Thomson
Financial SDC Mergers and Acquisitions Database as a merger, acquisition of majority interest, asset
acquisition or acquisition of certain assets over the period 1990 to 2012. Thus, while the acquirers in our
sample are public firms, the targets can be public, private, or subsidiaries of other firms. There is a one-
year lag between the sample period of the credit rating sample and the M&A sample because we relate
acquisition activity in a specific year to the firm’s credit rating at the end of the previous year. We also
require deals to have a non-missing transaction value. To focus on control transactions and to exclude
acquisitions of a partial or remaining interest in the target, we require that the acquirer owns less than
50% of target shares before the announcement and seeks to own more than 90% after the acquisition is
completed. Furthermore, to make sure that the sample includes only meaningful transactions from the
acquirer’s perspective, we limit the sample to deals with transaction values over $1 million and in excess
of 1% of the market value of the acquirer’s equity at the end of the month before the acquisition is
announced. Applying these restrictions yields a sample of 4,772 acquisitions. These transactions are

9
conducted by 1,226 of the 2,230 rated firms in our sample. The remaining 1,004 firms do not make any
meaningful acquisitions over the sample period.
Table 1 provides an overview of the sample; each firm-year is one observation. The majority of the
firms in our sample have a rating between BB– and BBB+ (54%), 23% of the firms have a rating between
A– and AA+, 22% below BB–, and only 1.6% of our sample firms have a AAA rating. Almost half of the
firms in the sample do not attain an investment grade rating (BBB− or above). This rating distribution is
consistent with the prior literature (see, for example, Baghai, Servaes, and Tamayo, 2014). Average firm
size, measured as the book value of total assets in constant 2000 dollars declines as ratings worsen up to
the B+ category after which there is a small increase. Column (4) reports on the number of acquisitions
made by the firms and column (5) presents the average size of the deals in constant 2000 dollars. Firms
with the highest and lowest ratings appear to be the least acquisitive, but the AAA companies stand out
in terms of the average size of their acquisitions. This is not surprising, given that they are much bigger
than the other firms. Column (6) reports on the fraction of acquisitions that are 100% paid for in cash
and column (7) on the fraction of targets that are publicly traded. Both fractions broadly decline as
ratings deteriorate.
Of particular interest for our analyses are the measures of acquisition likelihood and acquisition
intensity displayed in columns (8) and (9). Acquisition likelihood is a dummy variable set equal to one if a
particular firm makes at least one acquisition in a given year, and zero otherwise, while acquisition
intensity is set equal to the sum of all acquisitions made during a particular year, scaled by the book value
of assets at the end of the previous year. We winsorize acquisition intensity at its 99th percentile to
remove the influence of extreme observations. Eighteen percent of the firms in our sample make at least
one acquisition during a year, amounting to 2.92% of book assets. Note that both acquisition likelihood
and intensity show an interesting curvilinear pattern, where firms make more acquisitions as ratings
worsen up to a certain point, after which a further decline in ratings is associated with fewer acquisitions.
For example, the chance that a AAA firm makes an acquisition is only 10.9%, while firms rated A are

10
almost twice as likely to make acquisitions. Firms with a B− rating are almost as likely to make
acquisitions as AAA firms. The same pattern emerges for acquisition intensity, except for the large
percentage for AAA firms, which is due to a few large transactions made by these companies. In the next
section, we examine these patterns more formally.
3. Results
3.1. Credit rating levels and firm acquisitiveness
While the univariate statistics presented in Table 1 suggest a curvilinear relation between ratings
and acquisitiveness, it is important to control for other determinants of M&A activity. This is what we do
in Table 3 of the paper. Summary statistics on the control variables employed in some of these analyses
are reported in Table 2. Detailed variable definitions are provided in the Appendix.
We first estimate probit models to explain the likelihood of making at least one acquisition during a
year as a function of the firm’s debt rating at the end of the previous year and various controls that are
also measured at the end of the previous year. As is common in the literature, we first translate the
ratings variable into a numerical scale, which ranges from 1, for firms with a C rating to 21 for the highest
rated firms (AAA).
In the first three probit models displayed in Panel A of Table 3, we include industry (48 Fama-
French industries) and year fixed effects, as previous research suggests that there are patterns across
industry and time in the level of acquisitions (see, for example, Mitchell and Mulherin, 1996; Harford,
2005). Each of the three models employs a different measure of credit ratings. To ease the
interpretation, we report marginal effects instead of regression coefficients. These can be interpreted as
the average change in the dependent variable across all observations when the rating variable increases
by one unit. Standard errors in all specifications are clustered at the firm level.
The simple linear model presented in column (1) does not yield a significant relation between
ratings and acquisition likelihood. In model (2), we also include the square of the rating; this estimation

11
yields the curvilinear pattern that was apparent in the univariate statistics as well. The probability of
making an acquisition first increases and then decreases as ratings improve; the likelihood is maximized
at a rating of about BB+. These findings are consistent with the view that firms with poor ratings are
unable to take all their acquisition opportunities because they are financially constrained, while highly-
rated firms refrain from acquisitions because they value their rating and fear being downgraded when
making acquisitions.
In model (3), we explore whether, in addition to the pattern documented in model (2), firms
behave differently around the threshold between investment and non-investment grade ratings. To
achieve this, we estimate a piece-wise linear relation with three turning points. In particular, we estimate
separate slopes for the following four rating categories: (i) below BB+; (ii) BB+ and BBB−; (iii) BBB to A−;
(iv) A and above. Estimating individual slopes for the first, third, and fourth of these pieces allows us to
approximate the quadratic relation estimated in model (2), while the second piece allows us to capture
possible changes in acquisition behavior at the investment grade cusp. As argued previously, these firms
might be especially reluctant to make acquisitions because their interest expenses are particularly
sensitive to rating changes. Model (3) reports that three of the four linear sections have a significant
influence on acquisition activity. There is a positive effect for non-investment grade firms below BB+
ratings, a sharp decline for firms at the investment-grade cusp, followed by a modest increase for firms
with ratings up to and including A−; beyond A−, the likelihood of making acquisitions exhibits a
pronounced decline of 1.6 percentage points per ratings notch.
We also report the change in slope from the previous section at the bottom of the table. For
example, the value of −0.035 in the BB+<=CR<=BBB− interval represents the difference between the
slope of 0.023 in the CR<BB+ range and the slope of −0.012 in the BB+<=CR<=BBB− range. These changes
are all significantly different from zero, which indicates that the breakpoints employed in the piece-wise
linear regression reflect changes in the relation between ratings and acquisition likelihood that are
economically meaningful.

12
At this point, these findings are only suggestive, however, because controlling for industry and time
alone is likely insufficient to capture all the variation in acquisitiveness that is not related to credit ratings.
We therefore amend our regression specification to include additional industry-level and firm-level
controls as suggested by prior work. All the control variables are measured at the end of the fiscal year
prior to the acquisition announcement.
At the industry level, we control for the liquidity of the M&A market (Schlingemann, Stulz, and
Walkling, 2002), and industry concentration (Uysal, 2011). M&A liquidity is computed as the sum of all
acquisitions in the firms’s three-digit SIC code industry in a given year, divided by the sum of the book
value of assets of all Compustat firms with the same three-digit SIC code in the same year. For industry
concentration, we employ the Herfindahl index based on the level of sales in the firm’s three-digit SIC
code industry.
At the firm level, we control for investment opportunities, potential misvaluation, as well as a
number of other factors that capture financial constraints. We use past stock performance and the
market-to-book ratio to control for investment opportunities and misvaluation as in Harford and Uysal
(2014). Stock price performance is measured as the market-adjusted return in the prior fiscal year, and
the market-to-book ratio as (book assets – book equity + market equity) / book assets. To capture
financial constraints, we include leverage (total interest-bearing debt to assets), cash holdings (cash to
assets), size (log of total assets in constant 2000 dollars), and age (number of prior years with Compustat
data available). We also control for profitability, measured as EBITDA to total assets. Except for age,
Harford and Uysal (2014) employ similar controls. Many of these firm-specific variables also affect credit
ratings (see, for example, Baghai, Servaes, and Tamayo, 2014). Thus, any rating effect that persists
captures the independent effect of credit ratings beyond these determinants. All of the control variables
are winsorized at the 99th percentile, except for age and size. Profitability, market-to-book, excess stock
return, M&A market liquidity, and the Herfindahl index are also winsorized at the 1st percentile. The 1st
percentile of the other controls is zero.

13
The probit models with these additional controls are presented in columns (4) through (6) of Panel
A of Table 3. The impact of credit ratings on acquisitiveness remains highly significant, both statistically
and economically. While the magnitude of the various coefficients is somewhat lower than in the more
parsimonious models, the effect we uncover remains economically important. Based on model (6), non-
investment grade firms increase acquisition likelihood by two percentage points for each ratings increase
by one notch, while firms with ratings above A− reduce acquisition likelihood by almost one percentage
point per ratings notch. In between these two groups, the decline for firms around the investment-grade
cusp (ratings of BB+ and BBB−) is no longer statistically significant, but firms with these two rating
categories still halt the positive trend apparent for lower-rated firms. Once firms reach a BBB rating, the
positive trend continues up to and including the A− level.
The results of the control variables are also interesting. Consistent with prior work, firms are more
acquisitive when their industries experience higher M&A volume, when they performed well in the
previous year, and have less debt. Market-to-book has a negative impact on acquisition likelihood in our
sample of rated firms, and it is significant in some specifications. Though surprising, this result is
consistent with Harford and Uysal (2014), who compare acquisitions of rated and unrated firms. The
effect of size on acquisition likelihood is negative, which is opposite to the result reported by Harford and
Uysal (2014). Thus, the effect of size is different once we focus on rated firms only.
What is striking is that even after including proxies for financial constraints, such as age, cash
holdings, leverage, and size, the positive effect of ratings on acquisition likelihood persists, which
suggests that the effect of credit ratings is independent of these other effects. This indicates that for
lower-rated firms, credit ratings may capture financial constraints better than these other variables. For
highly-rated firms, the negative impact of ratings on acquisition likelihood suggests a strong reluctance on
the part of managers to take any action that might jeopardize their ratings.
To further examine the role of ratings in the acquisition process, we also include the distance-to-
default measure based on Merton’s model (1974) as an additional control variable (see also Bharath and

14
Shumway, 2008). This measure captures how many standard deviations the value of the firm’s assets is
removed from the face value of its debt.4 Since one of the primary roles of credit ratings is to measure
default risk, we would expect a substantial correlation between a firm’s rating and distance-to-default,
and this is indeed the case; the correlation is 0.61. If the impact of credit ratings on acquisitions is due to
this default risk channel, we would expect the influence of ratings on acquisition likelihood to decrease
once distance-to-default is controlled for. Columns (6) through (9) of Panel A of Table 3 contain the
results of this augmented specification. There is no evidence that the importance of credit ratings
weakens, suggesting that the effect we uncover is different from a pure default risk story. The coefficient
on distance-to-default itself is positive, suggesting that more solvent firms make more acquisitions.5
In Panel B of Table 3, we repeat the previous analyses using acquisition intensity as the dependent
variable in a Tobit specification censored at zero (see also Harford and Uysal, 2014, for a similar
approach) and report the unconditional marginal effects.6 These specifications allow us to examine
whether our findings regarding the likelihood of making an acquisition also translate into the amount
spent on acquisitions. This is indeed the case; the coefficients in the tobit models show the same pattern
as in the probit models, generally with similar levels of significance. Where the two sets of models differ
is in the impact of credit ratings on acquisition intensity in the piecewise model in the range between BB+
and BBB−. Whereas the probit models suggest a small decline in acquisition likelihood when firms reach
BB+ ratings, this effect is no longer statistically significant in the tobit models that include the control
variables (models (6) and (9)). However, the positive effect of ratings on acquisitiveness is still halted
once firms reach a rating of BB+ and the slope coefficient is still significantly lower in the BB+ to BBB−
range than in the <BB+ range.
4 The Appendix contains a detailed description of the methods employed to compute this variable.
5 We have also performed a VIF (variance inflation factor) test for multicollinearity and found that the correlation
between the explanatory variables does not materially affect our estimates. 6 Note that it is not possible to interpret the regression coefficients of a tobit model in the same way as OLS
coefficients. The coefficient of the tobit model captures the marginal effect on the latent variable. To interpret the economic significance, we need to multiply the coefficient with the probability that an observation becomes uncensored (which means that it becomes positive in our models) (see McDonald and Moffitt, 1980). This is the effect we report in the table.

15
In terms of economic significance, based on model (9), we find that acquisition intensity increases
by 39 basis points for each increase in rating by one notch up to BB, then decreases by 25 basis points up
to BBB−, increases by 7 basis points up to A−, before dropping off by 31 basis points per notch after that.
This effect is considerable, given the mean acquisition intensity in the sample of 2.92%.7
Next, we repeat the analyses in columns (3) and (9) of both Panels of Table 3 for the subsamples of
cash and stock acquisitions separately. This split is relevant because listed firms have the possibility of
offering their own shares as a means of payment when cash is not available.8 Therefore, the financial
constraints argument used to explain the acquisition behavior of low-rated firms is expected to be more
relevant for cash acquisitions than for stock acquisitions. For highly-rated firms, our takeover aversion
argument implies that they reduce both cash and stock acquisitions as their rating increases. Some firms
employ a mix of cash and stock as payment, and for these firms we use the following procedure. First,
we multiple the transaction value by the proportion of the payment that is cash or stock. Second, we
verify that this amount still exceeds one percent of the acquirer’s market value of equity, the threshold
applied in our previous analyses. If so, we set the acquisition dummy in the probit models equal to one
and include the transaction when computing acquisition intensity for the tobit models. If not, we set the
acquisition dummy equal to zero and exclude it from the computation of acquisition intensity.9
We present these results in Table 4. Panel A contains the probit and tobit models for cash
acquisitions. These results parallel to a large extent the findings reported in Table 3. For instance, for
firms with a rating below BB+, an increase in rating is associated with a substantial increase in the
likelihood of making at least one cash-financed acquisition and with the amount spent on cash
acquisitions. For firms with a rating above A−, the effect is exactly the opposite. The results for stock-
7 In unreported models, we have also repeated the above analysis using a matched sample approach in which we
match each acquiring firm with three non-acquiring firms closest in size in the same year and industry (48 Fama-French industries). Our findings persist in these models. 8 See Karampatsas, Petmezas, and Travlos (2014) for evidence that lower rated firms are more likely to employ their
shares as a form of payment in acquisitions, and for work on the other determinants of the form of payment. 9 Our findings are unchanged if we do not apply the second criterion before including a transaction in the cash or
stock subsample. They are also very similar if all transactions that are more than 50% cash financed are included in the cash subsample and all transactions that are more than 50% stock financed are included in the stock subsample.
16
financed acquisitions, reported in Panel B of Table 4, show a very different pattern, however; particularly
for low-rated firms, there is no evidence of increased acquisition activity as their ratings improve. For
highly-rated firms, on the other hand, the negative relation between acquisitions and ratings persists. In
addition, for both stock and cash acquisitions, there is evidence that firms become more reluctant to
conduct acquisitions around the investment-grade threshold. These findings support our interpretation
that the positive relation between acquisitions and ratings for low-rated firms is due to the relaxation of
financial constraints while the negative relation for highly-rated firms represents general aversion to
acquisitions.10
3.2. Alternative interpretations
Our interpretation of the results presented in Tables 3 and 4 is that ratings have a substantial
independent impact on acquisition decisions. In this subsection, we discuss a number of alternative
interpretations.
One alternative interpretation is that agencies assign ratings to companies in anticipation of future
acquisitiveness. Such an interpretation is wrought with problems, however, due to the non-linear nature
of the effect we uncover. Essentially, rating agencies would have to assign a higher rating in anticipation
of acquisitions by low-rated companies and relatively low ratings in anticipation of acquisitions by highly-
rated companies. Such actions do not seem very plausible. Nevertheless, we conduct two further tests
to rule out this interpretation. First, we lag our measure of credit ratings by an additional year and find
similar patterns as in Table 3 (unreported). This makes a reverse causality story less likely because
agencies would have to assign higher (lower) ratings to non-investment grade (investment grade) firms in
year t in anticipation of acquisition activity in year t+2. Second, in Section 4, we report that rating
10
For cash-financed acquisitions, it is also possible to compute acquisitiveness using aggregate firm data from Compustat (data item AQC), although this measure does not allow us to apply the same data filters as we applied for the SDC-based sample. Our findings persist when we employ this alternative measure of the amount spent on acquisitions (unreported).

17
agencies change their ratings in response to acquisitions; changing ratings both in anticipation of and in
response to acquisitions does not seem very plausible, especially given that the actual likelihood of
making acquisitions in the sample is only 18%. In fact, changing a firm’s rating today based on such a
small unconditional probability of doing a deal in the future seems very unlikely.
Another interpretation for our findings is that the lack of acquisitiveness at the higher end of the
ratings spectrum is due to the lack of acquisition opportunities. As documented in Table 1, highly-rated
firms are much larger than the average firm in the sample. As such, the number of potential targets that
meet the 1% market value equity cutoff for the acquisition to be included in our analysis may well be
reduced. However, we control for firm size in most specifications, and while we do find that larger firms
are less acquisitive, inclusion of firm size in our models does not materially affect the importance of the
ratings effect. This result casts serious doubt on this alternative interpretation. To further disprove it, we
have also re-estimated our regression models separately by size terciles (not reported in a table). The
ratings effect is not significantly different across the three terciles, suggesting that the potential lack of
acquisition opportunities for larger firms cannot explain our findings.
Finally, we examine whether the negative relation between acquisitiveness and ratings for highly-
rated firms is related to the quality of the firm’s corporate governance. Standard and Poor’s indicates
explicitly that corporate governance attributes are taken into account when evaluating the credit risk of a
firm. Thus, firms with better ratings could have better governance and since a substantial fraction of
acquisitions destroy shareholder wealth, it is possible that better-governed firms simply undertake fewer
acquisitions. We conduct two tests to address this possibility. First, we divide the sample into
acquisitions with positive and negative announcement returns and repeat our tests on each subset. If
better-rated firms make fewer poor acquisitions, we should observe a negative relation between credit
ratings and acquisitions for the subset of acquisitions with negative announcement returns, but not for
acquisitions that are well received by the market. Of course, this relation should only hold for firms with
ratings above A−, for which the relation is downward sloping for the sample as a whole. We find no

18
significant differences between good and bad acquisitions in the regression coefficients on any of the
piece-wise credit rating sections (not reported in a table). These results do not support the governance
argument. Second, we include two proxies for corporate governance directly in the acquisition
regressions: (a) board independence, measured as the fraction of directors that are outsiders, and
obtained from the ISS database (available for less than half of our sample firms), and (b) the number of
institutional investors that are blockholders in the firm, where a blockholder is defined as an investor
owning more than 5% of the shares; these data are obtained from Thomson Reuters 13-f filings.
Inclusion of these measures does not affect our main findings (not reported in a table). Interestingly, we
find that firms with more independent boards and more institutional blockholders make fewer
acquisitions.
3.3. Past rating changes and firm acquisitiveness
In this section, we study the impact of past rating changes on acquisition activity. This is relevant
because prior work has shown that credit rating changes exhibit positive serial autocorrelation (see, for
example, Altman and Kao, 1992; Lando and Skødeberg, 2002). That is, a past downgrade (upgrade) tends
to be followed by another downgrade (upgrade). If past credit rating changes serve as a good signal for
upcoming rating shifts, they may also influence firms’ M&A decisions. In particular, we would expect
firms that have been downgraded recently to curtail their acquisition activities. This effect applies at
both ends of the ratings scale. At the top end, firms that attach value to ratings per se will do their
utmost to avoid additional downgrades and reducing acquisitiveness could be one of the actions these
firms can take. At the bottom end, expectations of additional downgrades could already serve to
constrain recently downgraded firms from taking on all their acquisition opportunities. Low-rated firms
that received a recent upgrade, on the other hand, may be more willing to take on acquisitions (relative
to firms with the same rating that have not been upgraded recently), given that expected additional
upgrades would further relieve financial constraints and the acquisition is less likely to put downward

19
pressure on their ratings. For highly-rated firms, recent upgrades should have little effect on acquisition
activity. If anything, the expectation of additional upgrades may lead these firms to curb acquisition
activity even more.
We measure lagged upgrades and downgrades in the two-year period before the acquisition, and
present summary statistics on these variables in Table 5. The distributions of upgrades and downgrades
are quite similar, except that more of the lower-rated firms have recently been downgraded.
In Table 6, we study the impact of recent upgrades and downgrades on acquisition activity. We
present both probit (Panel A) and tobit (Panel B) models for the entire sample as well as separate models
for various rating categories. All the regressions include industry and firm controls as well as industry and
year dummies, but their coefficients are not reported for sake of brevity. The table reports the marginal
effects for the probit specifications and the unconditional marginal effects for the tobit models. The
results indicate that firms cut acquisition activity dramatically if they have been downgraded recently.
For the sample as a whole, firms that have recently been downgraded are 6.6 percentage points less
likely to make acquisitions, which is substantial given the average acquisition likelihood of 18%. The
impact appears similar across rating categories, but it is important to keep in mind that the unconditional
acquisition intensity differs across rating categories, and is smaller for highly-rated firms. Thus, the
proportional impact of a recent downgrade on acquisition activity is larger for firms in the highest rating
categories.11
Lagged upgrades have no significant impact on acquisitions, except for BB+ and BBB− firms, which
are more likely to make acquisitions. In unreported models, we find that this result is entirely due to
BBB− firms. These are companies that have recently been upgraded to investment grade. If there is
11
Note that the number of observations in the probit models estimated by various rating categories does not add up to the total. This is due to the fact that a number of observations perfectly predict the success or failure in the dependent variable and these observations are dropped from the estimation. This is more likely to happen when the models are estimated for separate rating categories than for the overall sample.
20
momentum in rating changes, these firms are less likely to be downgraded again, thereby opening up the
opportunity to make more acquisitions.
3.4. Abnormal returns
In this section we study the relation between the abnormal returns associated with acquisition
announcements and prior credit ratings. If the positive relation between credit ratings and M&A activity
at lower levels of ratings is indeed due to the easing of credit constraints, then this interpretation also has
implications for the relation between announcement returns and ratings. Specifically, we expect returns
to decline as ratings improve for firms with non-investment grade ratings as these companies are able to
take on more marginal acquisition opportunities. This analysis is similar in spirit to the work of Harford
and Uysal (2014) who compare announcement returns of rated and unrated firms. At upper echelons of
the ratings scale, the prediction is reversed; if such firms are particularly averse to acquisitions, they
should only take the very best opportunities, and we would expect announcement returns to increase as
ratings improve.
We compute abnormal returns as in Fuller, Netter, and Stegemoller (2002) using the market-
adjusted approach, where we subtract the daily market return from the daily return of the acquirer (see
also Moeller, Schlingemann, and Stulz, 2004; 2005). We use the value-weighted CRSP index as a proxy for
the market and cumulate abnormal returns over an event window of five days centered around the
announcement date. To remove the influence of outliers, we winsorize abnormal returns at the 1st and
99th percentiles. Average returns for the entire sample are displayed in the last line of Table 2.
Consistent with the literature (see, for example, Moeller, Schlingemann, and Stulz, 2007), they are slightly
positive at 90 basis points, on average, with a median of 60 basis points. Both are significantly different
from zero with p-values of 0.00.
Table 7 contains various specifications of the abnormal return regression models. Following the
extant literature, we include a set of firm and deal characteristics as control variables together with year

21
and industry dummies.12 In the first three models, we only report results for the first acquisition made by
a given firm during a year. As we will show in subsequent analyses, acquisitions affect future ratings; it is
therefore not clear that the firm’s rating is still the same when it makes the second or subsequent
acquisition in a year, and focusing on the first acquisition addresses this measurement error. But we
show in model (4) that our findings persist if we employ all acquisitions as well. Model (1) presents the
results of a simple linear model, while models (2) and (3) allow for non-linearity. Consistent with the
financial constraints argument, model (1) shows that returns decline by 16 basis points per ratings notch
increase. Increasing ratings by one standard deviation (3.66) lowers abnormal returns by 59 basis points,
which is quite substantial compared to the sample average of 90 basis points. These findings suggest that
as firms become more acquisitive, the overall quality of their acquisitions declines.
Model (2) shows the results of a quadratic specification, which illustrates that the impact of rating
increases on announcement returns is much more dramatic at low rating levels, but tapers off at higher
rating levels, and turns positive at a rating beyond A (the inflection point of the quadratic regression).
These results are the mirror image of the findings on acquisitiveness; as firms become more acquisitive
when ratings improve from the lowest levels, returns decline, and when the acquisition rate declines
beyond a higher rating threshold, returns improve again. The negative relation between returns and
ratings and the tapering off effect are what one would expect under a financial constraints interpretation:
as ratings improve, the marginal relaxation of financial constraints is smaller.
To explore the positive relation between ratings and returns beyond the inflection point in more
detail, we report a specification equivalent to the piece-wise linear regression model displayed in column
(3) of Table 3, in which we estimate separate slopes for the following rating ranges: C up to and including
BB; BB+ and BBB−; BBB up to and including A−; A up to and including AAA. These models indicate that
12
In unreported models, we also control for the following acquirer characteristics: leverage, market-to-book, and cash holdings. The coefficients on these variables are never significantly different from zero and we therefore omit them from the reported specifications. Their lack of significance is perhaps not a surprise because these characteristics are related to industry association and all our models include industry dummies.

22
the entire effect of ratings on returns comes from the ratings up to and including BB. Beyond that level,
there are no changes in acquisition quality as ratings improve further, and while the sign on the fourth
piece is positive, it does not approach statistical significance. Thus, while there is a suggestion of
improving returns once ratings reach a certain level based on the quadratic model, this result does not
appear to be very robust.
For completeness, we repeat model (3) but also include deals that are not the first acquisition by a
firm in a given year. This specification is reported in model (4). Our findings generally persist albeit at
lower levels of significance.
Overall, the findings from our event study support our interpretation that the ratings capture
financial constraints at low rating levels. While our models of acquisition activity include other measures
of constraints as well, the consistency between the event study models and acquisition models supports
the view that ratings capture constraints better than the other variables included in our models. At high
rating levels, the models on returns and levels of acquisitions are not fully consistent with each other in
that the reduction in acquisitiveness is not associated with significant improvements in returns. One
possibility, of course, is that acquirer returns are generally small and given that fewer transactions occur
at higher rating levels, we have little power to pick up a significant change in returns.
Our maintained assumption so far is that acquisitions put pressure on ratings, which may serve as a
particular deterrent for highly-rated firms to be involved in M&A. In the next section, we explore this
conjecture in detail.
4. The impact of acquisitions on future credit ratings
Mergers and acquisitions are known to increase acquirers’ default risk and leverage levels (see, for
example, Billett, King, and Mauer, 2004; Furfine and Rosen, 2011). Therefore, such transactions are likely
to put downward pressure on acquirers’ credit ratings in the post-merger period. To assess whether this
is indeed the case in our sample, we adopt two sets of analyses.

23
We start by documenting the likelihood of downgrades after acquisitions for all the rating
categories. These findings are presented in Panel A of Table 8. The results show an interesting pattern.
Highly-rated firms are more likely to be downgraded after acquisitions, while the opposite is true for
firms with a low rating. For example, AA firms that make acquisitions have about one chance in three of
being downgraded compared to one chance in five if they do not make an acquisition. BB firms, on the
other hand, have an 18% chance of being downgraded when they make an acquisition, but a 23% chance
if they do not. In Panel B, we summarize the probabilities for the various rating ranges considered in our
piece-wise linear estimation. These confirm the pattern established in Panel A: firms with a rating of BB
or below are less likely to be downgraded after making an acquisition, while firms with a rating above A−
are more likely to be downgraded after acquiring. For firms in between these thresholds the likelihood of
being downgraded does not depend much on the company’s acquisitiveness. This evidence can explain
why highly-rated firms are reluctant to make acquisitions if they value their rating: the chance of a
downgrade increases substantially. Note that we do not claim that these downgrades are undeserved;
the acquisition will likely increase the default risk of the acquirer. All we argue is that if highly-rated firms
attach particular value to their ratings, they will be reluctant to make acquisitions that increase the risk of
a downgrade.
One possibility is that the above results are not caused by the acquisition as such, but by the
associated stock price response. It could be that the downgrades are only caused by acquisitions that
have been poorly received by the stock market. To verify whether this is the case, we split the
acquisitions in Panel B into those that were poorly received and those that were not. For firms that made
multiple acquisitions in a given year, we use the average across all their deals to determine the market’s
reception. These findings are reported in Panel C of Table 8. For firms with a rating above A−, the
likelihood of a downgrade is 30.8% after making acquisitions with negative announcement returns, which
is indeed larger than the 26.9% after making acquisitions that have been well received, albeit that the
two likelihoods are not significantly different from each other. What is striking is that these figures are

24
significantly larger than the 21.2% likelihood of a downgrade when not making acquisitions at all. For
firms in the other rating categories, we also find a greater likelihood of a downgrade following a bad
compared to a good acquisition, and this difference is significant for ratings below BB+ and between BBB
and A−.
Compared to not making an acquisition at all, firms with ratings below BB+ reduce the likelihood of
being downgraded by more than nine percentage points when making a good acquisition, but even when
making a poor acquisition, the probability of being downgraded is lower relative to not making an
acquisition at all.13, 14
In the next set of tests, we investigate whether ratings are affected by acquisition decisions after
taking into account all the changes in the firm’s financial characteristics due to the financing of the
transactions and the combination of the acquirer and the target, both of which are likely to affect the
default risk of the merged company. We implement a difference-in-differences approach in which the
treatment is the announcement of at least one M&A deal in year t by a particular firm, the treated firm in
our setting. The aim is to assess, by relying on a double differencing, whether the change in rating
between the control period (t−1) and post-treatment period (t+1) is different between treated firms (i.e.,
acquisitive firms in year t) and control firms (i.e., non-acquisitive firms). Our specifications also control
for year dummies and industry fixed effects, as well as for the changes in firm characteristics. These
variables are likely influenced by the financing of the transaction and the combination of the target and
the acquirer. The set of firm characteristics employed in the analyses is similar to the ones used by
Baghai, Servaes, and Tamayo (2014).
13
Again, we are not claiming that the reduced likelihood of a downgrade after an acquisition is undeserved for firms with a low rating. The change in the financial characteristics of the firm due to the acquisition may well improve credit risk, even if the acquisition reduces shareholder wealth. The goal of this analysis is simply to document what happens to these firms’ ratings so that we can understand how this expectation affects acquisitiveness. 14
We have also compared the likelihood of being upgraded across firms that make no acquisitions, those that make good acquisitions, and those that make poor acquisitions. In general, the pattern is the reverse of the one documented for downgrades: highly-rated acquirers are less likely to be upgraded after making acquisitions, while low-rated acquirers are more likely to be upgraded. However, the differences in probabilities are small and they are generally not statistically significant.

25
The results are reported in Panel A of Table 9. The dependent variable in column (1) is the change
in rating between the control and post-treatment period, while in column (2) it is a dummy variable
identifying a rating downgrade between the control and the post-treatment periods. We estimate an OLS
model in column (1) and a probit model in column (2).15
The coefficient estimates of the acquisition dummy in Panel A of Table 9 are highly significant and
suggest that even after controlling for changes in their characteristics, firms that have made a recent
acquisition are more likely to experience a decline in their rating. In particular, the negative coefficient in
the first model indicates that a firm’s rating declines by 0.06 notches if it makes at least one acquisition in
the previous year, while model (2) indicates that firms that make acquisitions in a particular year are
more likely to be downgraded in the following year. In terms of economic significance, the probit results
in column (2) show that acquirers are 1.9 percentage points more likely to be downgraded compared to
other firms, an increase of more than 9% over the sample average of 21%. Again, it is important to stress
that this result holds after controlling for all the changes in the firm’s financial characteristics, many of
which may have changed because it conducted an acquisition. In other words, the effect we document is
the net effect, purely related to making an acquisition. Concerning the control variables, as expected,
increases in leverage and firm risk are associated with a decrease in credit ratings in the post-treatment
period, while increases in firm size, profitability, interest coverage, and market-to-book lead to an
improvement in credit ratings.16
15
We have also re-estimated the change in ratings model of column (1) using an ordered probit model. The advantage of ordered probit models is that they only assume that higher numbers reflect more substantial rating changes without ascribing a particular value to the exact magnitude of the rating change. The advantage of OLS models, on the other hand, is that they are more straightforward to interpret. Our findings persist when we use an ordered probit model instead. 16
The coefficient on the ΔNegative Debt / EBITDA dummy appears to be counterintuitive. It suggests that firms whose ratio of Debt / EBITDA turns negative from year t-1 to year t+1 receive a higher rating and are less likely to be downgraded. Further analyses indicate that this effect is due to the correlation between the negative debt to EBITDA dummy and profitability. If we remove the change in profitability from the model, the coefficient on the change in negative debt to EBITDA dummy becomes significantly negative. Inclusion or exclusion of this dummy or of profitability does not affect the statistical or economic significance of the acquisition effect.

26
This evidence suggests that acquisitions put pressure on acquirer credit ratings, as credit rating
agencies sanction acquirers ex post. As a result, it is not surprising that highly-rated acquirers, who
attach particular value to their rating, are more hesitant to make acquisitions compared to firms with
lower ratings.
As we already documented in Table 8, however, the likelihood of highly-rated firms being
downgraded depends partly on the quality of their acquisitions, as measured by the stock price response
upon the announcement of the transactions. In models (3) and (4) of Panel A of Table 9, we verify
whether this is still the case after controlling for firm characteristics. Interestingly, we continue to find a
negative effect on ratings for poor acquisitions, but not for acquisitions that are well-received by the
market.17 The economic significance of the negative effect is also more substantial than the effect
documented in the first two columns where all acquisitions are combined. For example, based on model
(4), firms that make acquisitions with negative announcement returns experience an increased likelihood
of being downgraded of 4.3 percentage points relative to firms with the same characteristics that have
not made poor acquisitions. This evidence suggests that firms that make poor acquisitions get punished
twice: once when they announce the acquisitions and a second time when they are being downgraded. It
also indicates that rating agencies actively monitor the acquisition behavior of companies.
Of course, it is possible that the effect of acquisition returns on rating changes is just due to the
firm’s overall stock market performance. To determine whether acquirer announcement returns have an
independent effect on rating changes, we augment the regression specifications reported in Panel A of
Table 9 with the market-adjusted stock return earned by the firm during years t (the acquisition year) and
t+1. These findings are presented in Panel B of Table 9; for sake of brevity, we do not report the
coefficients on the control variables in this panel. Our results are robust to this inclusion: firms that make
acquisitions receive lower ratings and are more likely to be downgraded, and the entire effect is due to
17
We have also verified that the coefficients on the dummies for acquisitions with positive and acquisitions with negative announcement returns are significantly different from each at the 5% level or better.

27
firms with poor acquisition performance. Not surprisingly, we also find that overall stock market
performance is positively related to rating changes (models (1) and (3)) and negatively related to the
likelihood of a downgrade (models (2) and (4)). The fact that the acquisition returns affect ratings after
controlling for excess returns in the prior years, which also covers the period around the acquisition,
indicates that rating agencies attach more weight to acquisition announcement returns than to general
stock price performance.
Since we document in Table 8 that the post-acquisition rating changes are different across the
ratings spectrum, we also investigate whether these differences persist after controlling for firm
characteristics. To that end, we re-estimate models (3) and (4) of Panel B of Table 9, but allow the effect
of good and bad acquisitions to vary depending on the range of the firm’s ratings level in year t-1. We
define four dummies, one for each of the four ranges of ratings we consider in the models of acquisition
likelihood, and interact these dummies with dummies for acquisition quality. The results of these models
are reported in Panel C of Table 9. We also report p-values of tests of equality of the coefficients for
good and bad acquisitions. Several new findings emerge. Highly-rated firms are more likely to see their
ratings decline and to be downgraded after making acquisitions, and this effect does not appear to
depend much on acquisition quality. Firms in the second highest ratings group (BBB to A-) only
experience a downgrade for poor acquisitions, not for good acquisitions. For firms around the non-
investment grade threshold, acquisitions have no significant impact on ratings changes. Finally, for firms
with a rating below BB+, acquisitions are good news for ratings, irrespective of whether the stock market
reacted positively or not.
These results shed further light on our previous findings of a non-linear relation between ratings
and acquisitiveness. Since highly-rated firms are most likely to get punished by rating agencies after
making acquisitions, they are very reluctant to engage in these types of transactions. If ratings at the top
end of the ratings scale are a particular testament to the value these firms attach to their ratings, then a
decline in merger activity by half, such as the one we observe when firms move from A− to AAA ratings, is

28
no surprise. Even if the deal is positively received by the stock market, the subsequent negative response
from rating agencies may negate this benefit. Firms at the lower end of the ratings spectrum, on the
other hand, experience a rating increase as a relaxation of financial constraints, giving them breathing
room to make more deals. Moreover, they generally experience rating upgrades after making
acquisitions.
5. Conclusion
This paper documents a curvilinear relation between credit rating levels and acquisitions. At low
rating levels, increases in firm rating lead to more acquisitions, accompanied by lower announcement
returns, while at high ratings, additional rating increases reduce acquisitiveness, without materially
affecting associated returns. This pattern is broken by firms that are at the cusp between investment and
non-investment grade ratings, which curtail acquisitions as well. We also find that acquisitions have a
negative impact on credit ratings for highly-rated firms, even after controlling for all the firm
characteristics potentially affected by the transaction itself; firms with low ratings, on the other hand, are
more likely to see their ratings increase after making an acquisition.
From this work, we draw several conclusions. First, credit ratings have an independent effect on
acquisition decisions since we control for a large number of characteristics associated with ratings in our
models. Second, ratings may serve as an alternative and potentially better measure of financial
constraints than other variables. Third, rating agencies not only pay attention to a firm’s financial
characteristics, but also how it got there; at the higher end of the ratings spectrum, firms have lower
ratings if they were more acquisitive in the past, even if they have the same characteristics as other
companies. Fourth, the negative response of rating agencies to acquisitions that are poorly received by
the market indicates that acquirers get punished twice for having been deemed to overpay for a
company, once by the stock market and once by the rating agencies. Managers and investment banks
alike should take this information into account when engaging in M&A transactions. This evidence also

29
indicates that rating agencies pay attention to shareholder returns when making a judgement about
changes in bondholder risk. Fifth, the reluctance of highly-rated firms to make acquisitions suggests that
these firms attach particular value to their rating and may well be foregoing good investment
opportunities. Studying the benefits associated with higher ratings and measuring the precise cost
associated with the reluctance to make acquisitions requires further study.

30
References
Alissa, W., Bonsall, S. B. IV, Koharki, K., Penn, M. W. Jr, 2013. Firms’ use of accounting discretion to influence their credit ratings. Journal of Accounting and Economics 55, 129–147. Almeida, H., Campello, M., Weisbach, M. S., 2004. The cash flow sensitivity of cash. Journal of Finance 59, 1777-1804. Alp, A., 2013. Structural shifts in credit rating standards. Journal of Finance 68, 2435–2470. Altman, E. I., 1998. The importance and subtlety of credit rating migration. Journal of Banking and Finance 22, 1231–1247. Altman, E. I., Kao, D. L., 1992. The implications of corporate bond ratings drift. Financial Analysts Journal 48, 64–67. Arden, A., McGovern, C., 2013. The credit cloud: large U.S. takeovers are a bad omen for credit quality. RatingsDirect, Standard & Poor’s Financial Services, September 19, 2013. Baghai, R., Servaes, H., Tamayo, A., 2014. Have rating agencies become more conservative? Implications for capital structure and debt pricing. Journal of Finance 69, 1961–2005. Becker, B., Ivashina, V., 2014. Cyclicality of credit supply: firm level evidence. Journal of Monetary Economics 62, 76–93. Begley, T., 2014, The real costs of corporate credit ratings. Unpublished Working Paper, London Business School. Bharath, S. T., Shumway, T., 2008. Forecasting default with the Merton distance to default. Review of Financial Studies 21, 1339-1369. Billett, M. T., King, T. H. D., Mauer, D. C., 2004. Bondholder wealth effects in mergers and acquisitions: new evidence from the 1980s and 1990s. Journal of Finance 59, 107–135. Boot, A., Milbourn, T. T., Schmeits, A., 2006. Credit rating as coordination mechanisms. Review of Financial Studies 19, 81–118. Bradley, M., Desai, A., Kim, E. H., 1983. The rationale behind inter-firm tender offers: information or synergy? Journal of Financial Economics 11, 141-153. Campbell, J.Y., Hilscher, J., Szilagyi, J., 2008. In search of distress risk. Journal of Finance 63, 2899-2939. Campello, M., Graham, J. R., Harvey, C. R., 2010. The real effects of financial constraints: evidence from a financial crisis. Journal of Financial Economics 97, 470–487. Chen, Z., Lookman, A. A., Schurhoff, N., Seppi, D. J., 2014. Rating-based investment practices and bond market segmentation. Unpublished working paper, Swiss Finance Institute Research Paper No. 10-30.

31
Chernenko, S., Sunderam, A., 2012. The real consequences of market segmentation. Review of Financial Studies 25, 2041–2069. Denis, D.J., Sibilkov, V., 2010, Financial constraints, investment, and the value of cash holdings. Review of Financial Studies 23, 247-269. Faulkender, M., Petersen, M. A., 2006. Does the source of capital affect capital structure? Review of Financial Studies 19, 45–79. Fuller, K., Netter, J., Stegemoller, M., 2002. What do returns to acquiring firms tell us? Evidence from firms that make many acquisitions. Journal of Finance 57, 1763–1793. Furfine, C. H., Rosen, R. J., 2011. Mergers increase default risk. Journal of Corporate Finance 17, 832–849. Graham, J. R., Harvey, C. R., 2001. The theory and practice of corporate finance: evidence from the field. Journal of Financial Economics 60, 187–243. Hand, J. R. M., Holthausen, R. W., Leftwich, R. W., 1992. The effect of bond rating agency announcements on bond and stock prices. Journal of Finance 47, 733–752. Harford, J., 2005. What drives merger waves? Journal of Financial Economics 77, 529–560. Harford, J., Uysal, V. B., 2014. Bond market access and investment. Journal of Financial Economics 112, 147–163. Hovakimian, A., Opler, T., Titman, S., 2001. The debt-equity choice. Journal of Financial and Quantitative Analysis 36, 1–24. Jensen, M. C., 1986. Agency costs of free cash flow, corporate finance, and takeovers. American Economic Review 76, 323-329. Jovanovic, B., Rousseau, P. L., 2002. The Q-theory of mergers. American Economic Review 92, 198-204. Jung, B., Soderstrom, N., Yang, Y. S., 2013. Earnings smoothing activities of firms to manage credit ratings. Contemporary Accounting Research 30, 645–676. Karampatsas, N., Petmezas, D., Travlos, N. G., 2014. Credit ratings and the choice of payment method in mergers and acquisitions. Journal of Corporate Finance 25, 474-493. Klapper, L., Laeven, L., Rajan, R., 2012. Trade credit contracts. Review of Financial Studies 25, 838-867. Kisgen, D. J., 2006. Credit ratings and capital structure. Journal of Finance 61, 1035–1072. Kisgen, D. J., 2009. Do firms target credit ratings or leverage levels? Journal of Financial and Quantitative Analysis 44, 1323–1344. Lando, D., Skødeberg, T. M., 2002. Analyzing rating transitions and rating drift with continuous observations. Journal of Banking and Finance 26, 423–444.

32
Lemmon, M., Roberts, M. R., 2010. The response of corporate financing and investment to changes in the supply of credit. Journal of Financial and Quantitative Analysis 45, 555–587. Maksimovic, V., Phillips, G., 2001. The market for corporate assets: Who engages in mergers and asset sales and are there efficiency gains? Journal of Finance 56, 2019-2065. Manne, H. G., 1965. Mergers and the market for corporate control. Journal of Political Economy 73, 110-120. McDonald, J. F., Moffitt, R. A., 1980. The uses of Tobit analysis. Review of Economics and Statistics 62, 318-321. Merton, R. C., 1974. On the pricing of corporate debt: the risk structure of interest rates. Journal of Finance 29, 449–470. Mitchell, M. L., Mulherin, J. H., 1996. The impact of industry shocks on takeover and restructuring activity. Journal of Financial Economics 41, 193–229. Moeller, S. B., Schlingemann, F. P., Stulz, R. M., 2004. Firm size and the gains from acquisitions. Journal of Financial Economics 73, 201–228. Moeller, S. B., Schlingemann, F. P., Stulz, R. M., 2005. Wealth destruction on a massive scale? A study of acquiring-firm returns in the recent merger wave. Journal of Finance 60, 757–782. Moeller, S.B. , Schlingemann, F. P., Stulz, R. M., 2007. How do diversity of opinion and information asymmetry affect acquirer returns, Review of Financial Studies 20, 2047-2078. Roll, R., 1986. The hubris hypothesis of corporate takeovers, Journal of Business 59, 197-216. Schlingemann, F. P., Stulz, R. M., Walkling, R. A., 2002. Divestitures and the liquidity of the market for corporate assets. Journal of Financial Economics 64, 117–144. Shleifer, A., Summers, L. H., 1988. Breach of trust in hostile takeovers. In Auerbach, A. J. (Ed.) Corporate takeovers: Causes and consequences. Chicago, University of Chicago Press, 33-56. Shleifer, A., Vishny, R. W., 2003. Stock market driven acquisitions. Journal of Financial Economics 70, 1-29. Standard and Poor’s, 2008. Corporate Rating Criteria. Standard & Poor’s, 2013. Annual U.S. corporate default study and rating transitions, https://www.Globalcreditportal.Com/ratingsdirect/renderarticle.Do?Articleid=1098627&sctartid=145785&from=cm&nsl_code=lime. Sufi, A., 2009. The real effects of debt certification: evidence from the introduction of bank loan ratings. Review of Financial Studies 22, 1659-1691. Uysal, V. B., 2011. Deviation from the target capital structure and acquisition choices. Journal of Financial Economics 102, 602–620.

33
Vassalou, M., Xing, Y., 2004. Default risk in equity returns. Journal of Finance 59, 831–868. Whited, T. M., 1992. Debt, liquidity constraints, and corporate investment: evidence from panel data. Journal of Finance 47, 1425-1460.

34
Appendix. Variable definitions
Dependent Variables Acquisition likelihood: Binary variable that takes the value of 1 if the firm announced at least one acquisition in year t, 0 otherwise. The variable is created using data from Thomson Financial SDC. Acquisition intensity: The sum of the deal values of all completed acquisitions announced in year t scaled by the firm’s total assets in year t-1. Deal values are from Thomson Financial SDC, assets are from COMPUSTAT. Only transactions larger than 1% of market equity are included in the sample. Acquirer CARs: Cumulative abnormal return for the acquiring firm over the 5-day event window (-2, +2) around the announcement day. The abnormal return is computed as the market-adjusted return using the value-weighted CRSP index as a proxy for the market. Firm variables Credit rating level: Continuous variable for rated firms from COMPUSTAT which takes the value from 1 (C rating) to 21 (AAA rating). The ratings are Standard and Poor’s ratings. Distance-to-Default: A measure of default risk, based on the structural model of Merton (1974). Distance to default (DD) is the difference between the asset value of the firm (V) and the face value of its debt (F), divided by the standard deviation of the firm’s asset value (σV). We use an iterative procedure by solving a system of two nonlinear equations to estimate asset value and volatility. In this system, equity (E) is priced as a European call option on the value of the firm’s assets with time to maturity (T) equal to one year. Following Vassalou and Xing (2004), F corresponds to debt in current liabilities plus one-half of long-term debt since this approach takes into account the fact that long-term debt might not be due until after the horizon of the DD estimation. As initial values for asset value and asset volatility, we use V = E + F and σV = σE *(E/E+F) where E is the market value of equity at the end of each calendar year and σE is the annualized standard deviation of daily stock returns from the prior year. Distance to default is computed as:
𝐷𝐷 = 𝑙𝑛(𝑉/𝐹)+ 0.06+𝑅𝑏𝑖𝑙𝑙−
1
2𝜎𝑉
2
𝜎𝑉,
where Rbill is the Treasury bill rate, and 0.06 is an empirical proxy for the equity premium following Campbell, Hilscher, and Szilagyi (2008).
Size: Firm total assets at the fiscal year-end from COMPUSTAT in US$ millions deflated using the CPI index with the base year 2000. The regressions use the natural log of this variable. Profitability: Earnings before interest, taxes, depreciation and amortization (EBITDA) divided by total assets. Cash holdings: Cash holdings divided by total assets. Age: Number of years the firm has been covered by COMPUSTAT at the time of the acquisition announcement. Excess stock return: Market adjusted return (using the value-weighted CRSP index as benchmark).

35
Market-to-book: Market value of the firm (Total assets − book value of equity + market value of equity) divided by total assets. Leverage: Total financial debt (long-term debt plus debt in current liabilities) divided by total assets. Capex: Capital expenditures divided by total assets. Interest coverage: EBITDA over interest expenses. Rental: Rental payments divided by total assets. Debt/EBITDA: Long-term and short-term debt divided by EBITDA. Negative Debt/EBITDA: Indicator variable set equal to 1 if Debt/EBITDA is negative and 0 otherwise. Convertible: Convertible debt divided by total assets. Subordinated: Subordinated debt divided by total assets. PPE: Net property, plant and equipment divided by total assets. Volatility: The volatility of profitability, computed using the current year’s data as well as the four previous years’. At least two years of data are required in its computation. StDevRet: The annualized standard deviation of daily returns for a given year. Lagged upgrade: A binary variable that takes the value of 1 if a firm has been upgraded at least once in the previous two years, 0 otherwise. Lagged downgrade: A binary variable that takes the value of 1 if a firm has been downgraded at least once in the previous two years, 0 otherwise. Earnings: Earnings before extraordinary items divided by total assets. CFO: Operating cash flow divided by total assets. Industry variables M&A liquidity: Sum of acquisitions made in a given year and three-digit SIC code industry, divided by the sum of total assets of all COMPUSTAT firms with the same three-digit SIC code. Herfindahl index: Sum of squares of the market shares of all firms in a given year and three-digit SIC industry, where market share is defined as sales of the firm divided by the sum of the sales in the industry.

36
Deal characteristics Deal value: Value of the transaction from SDC in constant (year 2000) US$ million. Relative size: Ratio of the deal value and the market capitalization of the acquiring firm 4 weeks prior to the acquisition announcement. Horizontal: Binary variable that takes the value of 1 if the target firm operates in the same 3-digit SIC code industry as the acquirer, 0 otherwise. Public: Binary variable that takes the value of 1 if the target firm is a public firm, 0 otherwise. Cash: Binary variable that takes the value of 1 for deals where the method of payment is 100% cash, 0 otherwise. Cross-border: Binary variable that takes the value of 1 for acquisitions of non-US target firms, 0 otherwise. Tender: Binary variable that takes the value of 1 for tender offers, 0 otherwise. Hostile: Binary variable that takes the value of 1 for deals defined as “hostile” or “unsolicited” by SDC, 0 otherwise.

37
Table 1 Firm and deal characteristics by rating level This table provides the rating distribution and reports statistics of firm and deal characteristics for each rating category for our sample of U.S. rated publicly listed firms making acquisitions over the period 1990-2012. N denotes the number of firm-year observations in the sample. The mean value of firm size is presented in the third column. Column (4) presents the number of M&A deals and column (5) presents the mean deal value. Column (6) displays the proportion of pure cash deals (payment is 100% cash) and column (7) the proportion of listed targets. Acquisition likelihood (column (8)) is the proportion of firms in our sample that conduct at least one acquisition exceeding 1% of the firm’s market value of equity in a given year t. Acquisition intensity (column (9)) is the sum of all acquisition exceeding 1% of the firm’s market value of equity completed by a firm in a given year divided by its total assets in year t-1. All dollar values are in millions and adjusted to 2000 dollars by the consumer price index (CPI).
Rating level (1)
N
(2)
Firm size
(3)
Number of acquisitions
(4)
Deal value
(5)
All Cash
(6)
Public Target
(7)
Acquisition likelihood
(8)
Acquisition intensity
(9)
AAA 323 81,457 37 13,338 51.35% 54.05% 10.87% 2.56%
AA+ 112 64,961 18 1,103 33.33% 33.33% 15.18% 0.89%
AA 403 47,147 63 3,057 50.79% 49.21% 13.90% 1.86%
AA- 468 29,483 97 3,947 27.84% 41.24% 16.67% 2.51%
A+ 857 23,477 200 1,808 37.31% 35.82% 18.55% 2.46%
A 1,543 18,342 409 1,500 42.82% 33.33% 21.45% 2.84%
A– 1,266 17,306 317 1,733 36.59% 37.22% 20.06% 2.89%
BBB+ 1,633 14,025 343 912 42.44% 28.78% 17.15% 2.72%
BBB 2,082 8,967 502 635 42.26% 26.19% 18.59% 2.47%
BBB– 1,787 8,277 405 896 35.78% 24.51% 19.02% 3.04%
BB+ 1,298 5,886 309 1,066 32.69% 19.74% 19.18% 3.44%
BB 1,879 3,703 472 447 35.94% 15.86% 19.37% 3.25%
BB– 2,400 2,747 661 379 33.08% 16.92% 19.46% 3.67%
B+ 2,263 2,117 610 225 31.31% 12.62% 18.82% 3.40%
B 1,228 3,896 222 300 30.18% 17.12% 13.11% 2.34%
B– 596 3,235 74 348 28.38% 17.57% 10.07% 2.08%
Below B– 350 3,075 33 441 21.21% 30.30% 7.14% 1.86%
All levels 20,488 11,072 4,772 973 36.21% 23.86% 18.00% 2.92%

38
Table 2 Summary statistics This table presents descriptive statistics for the universe of U.S. rated publicly listed firms over the period 1989-2011. Variable definitions are in the Appendix. The table reports the number of observations, mean, median and standard deviation of the corresponding variables. All dollar values are in millions and adjusted to 2000 dollars by the consumer price index (CPI). The last row contains the abnormal announcement return for those firms that make acquisitions over the period 1990-2012.
N Mean Median Std. dev.
Credit rating level 20,488 11.770 12.000 3.664 Acquisition likelihood 20,488 0.180 0.000 0.384 Acquisition intensity 20,488 0.029 0.000 0.110 Distance-to-default 19,285 6.613 5.779 4.028 Size ($million) 20,488 11,072 2,548 35,662 Profitability 20,402 0.138 0.134 0.076 Cash holdings 20,476 0.086 0.049 0.102 Age 20, 488 21.46 19.000 12.976 Excess stock return 19,627 0.052 -0.006 0.474 Market-to-book 19,831 1.690 1.428 0.875 Leverage 20,432 0.353 0.315 0.213 M&A liquidity 20,481 0.033 0.010 0.064 Herfindahl index 20,483 0.170 0.127 0.147 Acquirer CARs (-2, +2) 4,772 0.90% 0.60% 6.6%

39
Table 3 Credit rating levels and acquisitions This table presents the effect of credit rating levels on acquisitions announced over the period 1990-2012 for all U.S. publicly listed firms with available credit ratings over the period 1989-2011. Panel A presents marginal effects of probit specifications and Panel B unconditional marginal effects of tobit specifications. The dependent variable in the probit models (Panel A) takes the value of 1 if the firm announced at least one acquisition exceeding 1% of the market value of its equity in year t, and 0 otherwise. The dependent variable in the tobit models (Panel B) is the ratio of the sum of all acquisitions exceeding 1% of market equity announced by a firm in year t, divided by total assets at the end of year t–1. Columns (3), (6) and (9) are piecewise regressions with three different breakpoints. At the bottom of each panel, we report the change in slope from the preceding rating category. The explanatory variables are lagged by one year with respect to the dependent variable. Variable definitions are in the Appendix. All models include year and industry fixed effects, whose coefficients are suppressed and are based on calendar year and Fama-French 48 industry classification dummies, respectively. CR stands for credit rating level. The z-statistics reported in parentheses are adjusted for heteroskedasticity and acquirer clustering. ***, ** and * denote statistical significance at the 1%, 5%, and 10% levels, respectively.

40
Table 3 (continued) - Panel A. Probit models (1) (2) (3) (4) (5) (6) (7) (8) (9) CR 0.002 0.043*** 0.005** 0.038*** -0.001 0.033*** (1.61) (6.93) (2.38) (5.44) (-0.34) (4.79) CR
squared
-0.002*** -0.001*** -0.001***
(-6.61) (-4.88) (-4.95) CR < BB+ 0.023*** 0.020*** 0.016*** (6.54) (4.87) (3.70) BB+ <= CR <=BBB– -0.012* -0.004 -0.012* (-1.93) (-0.66) (-1.75) BBB– < CR <= A– 0.007 0.010* 0.006 (1.48) (1.90) (1.11) CR > A– -0.016*** -0.009** -0.016*** (-3.66) (-1.97) (-3.23) Distance-to-default 0.011*** 0.011*** 0.011*** (7.86) (8.10) (8.16) Ln (Size) -0.021*** -0.022*** -0.021*** -0.019*** -0.019*** -0.019*** (-5.14) (-5.23) (-5.16) (-4.49) (-4.57) (-4.48) Profitability 0.101* 0.081 0.076 0.073 0.050 0.045 (1.85) (1.47) (1.38) (1.30) (0.90) (0.80) Cash holdings -0.002 0.014 0.014 0.019 0.035 0.036 (-0.06) (0.33) (0.35) (0.45) (0.85) (0.86) Age 0.001 0.001 0.001 0.000 0.000 0.000 (1.31) (1.48) (1.50) (0.56) (0.73) (0.75) Excess stock return 0.033*** 0.033*** 0.033*** 0.034*** 0.033*** 0.033*** (5.42) (5.30) (5.30) (5.41) (5.28) (5.28) Market-to-book -0.010** -0.007 -0.007 -0.021*** -0.018*** -0.019*** (-1.97) (-1.45) (-1.49) (-3.94) (-3.48) (-3.54) Leverage -0.060*** -0.043** -0.045** -0.010 0.008 0.006 (-2.78) (-1.98) (-2.05) (-0.46) (0.35) (0.27) M&A liquidity 0.572*** 0.564*** 0.562*** 0.579*** 0.571*** 0.568*** (11.98) (11.89) (11.84) (12.06) (11.97) (11.91) Herfindahl index 0.005 0.008 0.010 -0.004 -0.001 0.001 (0.18) (0.26) (0.32) (-0.13) (-0.05) (0.02) Year and ind. dummies Yes Yes Yes Yes Yes Yes Yes Yes Yes Pseudo R² 0.031 0.035 0.036 0.047 0.049 0.049 0.052 0.054 0.055 Observations 20,432 20,432 20,432 19,372 19,372 19,372 19,042 19,042 19,042 Change in slope BB+ <= CR <=BBB– -0.035*** -0.025*** -0.028***
(-4.17) (-2.82) (-3.11) BBB– < CR <= A– 0.019* 0.014 0.018* (1.96) (1.38) (1.73) CR > A– -0.023*** -0.019** -0.022*** (-2.97) (-2.38) (-2.72)

41
Table 3 (continued) - Panel B. Tobit models (1) (2) (3) (4) (5) (6) (7) (8) (9) CR 0.0000 0.0100*** 0.0009** 0.0084*** -0.0001 0.0075*** (0.13) (6.48) (2.20) (5.32) (-0.22) (4.72) CR
squared
-0.0004*** -0.0003*** -0.0003***
(-6.43) (-4.84) (-4.87) CR < BB+ 0.0051*** 0.0049*** 0.0039*** (6.17) (4.97) (3.96) BB+ <= CR <=BBB– -0.0035** -0.0010 -0.0025 (-2.41) (-0.68) (-1.57) BBB– < CR <= A– 0.0010 0.0016 0.0007 (0.94) (1.38) (0.65) CR > A– -0.0037*** -0.0018* -0.0031*** (-3.69) (-1.74) (-2.84) Distance-to-default 0.0022*** 0.0022*** 0.0022*** (6.86) (7.05) (7.12) Ln (Size) -0.0063*** -0.0064*** -0.0063*** -0.0057*** -0.0058*** -0.0057*** (-6.79) (-6.90) (-6.83) (-6.16) (-6.25) (-6.16) Profitability 0.0255* 0.0210 0.0191 0.0208 0.0160 0.0140 (1.90) (1.56) (1.42) (1.53) (1.17) (1.02) Cash holdings 0.0068 0.0103 0.0108 0.0110 0.0146 0.0151 (0.73) (1.12) (1.17) (1.18) (1.58) (1.63) Age 0.0000 0.0001 0.0000 0.0000 0.0000 0.0000 (0.89) (1.09) (1.15) (0.18) (0.38) (0.44) Excess stock return 0.0078*** 0.0077*** 0.0077*** 0.0079*** 0.0078*** 0.0078*** (5.27) (5.14) (5.13) (5.21) (5.08) (5.07) Market-to-book -0.0000 0.0005 0.0005 -0.0021 -0.0015 -0.0015 (-0.03) (0.44) (0.44) (-1.58) (-1.15) (-1.17) Leverage -0.0146*** -0.0109** -0.0111** -0.0044 -0.0004 -0.0006 (-2.92) (-2.15) (-2.19) (-0.86) (-0.08) (-0.12) M&A liquidity 0.1547*** 0.1532*** 0.1526*** 0.1568*** 0.1552*** 0.1545*** (12.68) (12.60) (12.56) (12.74) (12.64) (12.61) Herfindahl index -0.0023 -0.0019 -0.0016 -0.0042 -0.0040 -0.0034 (-0.36) (-0.31) (-0.26) (-0.65) (-0.60) (-0.54) Year and ind. dummies Yes Yes Yes Yes Yes Yes Yes Yes Yes Pseudo R² 0.041 0.046 0.046 0.073 0.075 0.076 0.079 0.082 0.082 Observations 20,432 20,432 20,432 19,372 19,372 19,372 19,042 19,042 19,042 Change in slope BB+ <= CR <=BBB– -0.0085*** -0.0059*** -0.0064*** (-4.37) (-2.90) (-3.08) BBB– < CR <= A– 0.0045** 0.0026 0.0032 (1.99) (1.13) (1.38) CR > A– -0.0047*** -0.0034* -0.0039** (-2.64) (-1.90) (-2.16)

42
Table 4 Credit rating levels and cash- versus stock-financed acquisitions Panel A presents models for cash-financed acquisitions and Panel B presents models for stock-financed acquisitions. Columns (1) and (2) contain the marginal effects for probit specifications and columns (3) and (4) contain unconditional marginal effects for tobit specifications. All models are estimated as piecewise regressions with three different knots. The sample consists of all U.S. listed firms with credit ratings over the period 1989-2011. The dependent variable in the probit models in Panel A (Panel B) takes the value of 1 if the firm makes at least one cash-financed (stock-financed) acquisition in year t larger than 1% of the firm’s market value of equity. The dependent variable in the tobit models in Panel A (Panel B) is the sum of all cash-financed (stock-financed) acquisitions exceeding 1% of market equity divided by total assets. For each transaction, to determine the fraction that is cash (stock) financed, we multiply the deal value by the fraction of the total payment that is in cash (stock). The control variables are the same as in Table 3. The explanatory variables are lagged by one year with respect to the dependent variable. At the bottom of each panel, we report the change in slope from the preceding rating category. All models include year and industry fixed effects, whose coefficients are suppressed and are based on calendar year and Fama-French 48 industry classification dummies, respectively. The z-statistics reported in parentheses are adjusted for heteroskedasticity and acquirer clustering. CR stands for credit rating level. ***, ** and * denote statistical significance at the 1%, 5%, and 10% levels, respectively.
Panel A. Cash-financed acquisitions Probit Tobit
(1) (2) (3) (4)
CR < BB+ 0.015*** 0.009*** 0.0025*** 0.0016*** (5.46) (2.66) (5.57) (2.89) BB+ <= CR <=BBB– -0.007 -0.008 -0.0014* -0.0012 (-1.43) (-1.55) (-1.86) (-1.53) BBB– < CR <= A– 0.006* 0.005 0.0007 0.0006 (1.69) (1.27) (1.30) (1.08) CR > A– -0.009*** -0.010*** -0.0016*** -0.0016*** (-3.02) (-2.89) (-3.26) (-2.85) Control Variables No Yes No Yes Year and ind. dummies Yes Yes Yes Yes Pseudo R² 0.038 0.055 0.055 0.089 Observations 20,432 19,042 20,431 19,042
Change in slope
BB+ <= CR <=BBB– -0.022*** -0.017** -0.0039*** -0.0029** (-3.44) (-2.47) (-3.79) (-2.56) BBB– < CR <= A– 0.013* 0.013* 0.0021* 0.0019 (1.74) (1.67) (1.83) (1.57) CR > A– -0.015*** -0.015*** -0.0023*** -0.0022** (-2.74) (-2.60) (-2.62) (-2.43)

43
Table 4 (continued) Panel B. Stock-financed acquisitions Probit Tobit
(1) (2) (3) (4)
CR < BB+ 0.002 -0.001 0.0004 -0.0000 (1.02) (-0.32) (1.19) (-0.06) BB+ <= CR <=BBB– -0.007** -0.006** -0.0015** -0.0013* (-2.24) (-1.99) (-2.13) (-1.76) BBB– < CR <= A– 0.004 0.002 0.0007 0.0004 (1.50) (0.86) (1.36) (0.66) CR > A– -0.005** -0.004** -0.0010** -0.0010** (-2.39) (-2.08) (-2.30) (-2.01) Control Variables No Yes No Yes Year and ind. dummies Yes Yes Yes Yes Pseudo R² 0.053 0.082 0.065 0.106 Observations 20,338 18,954 20,431 19,042
Change in slope
BB+ <= CR <=BBB– -0.008** -0.006 -0.0019** -0.0013 (-2.11) (-1.39) (-2.10) (-1.33) BBB– < CR <= A– 0.010** 0.009* 0.0022** 0.0017 (2.12) (1.73) (1.98) (1.48) CR > A– -0.008** -0.007* -0.0018** -0.0013 (-2.23) (-1.72) (-2.08) (-1.55)

44
Table 5 Summary statistics on lagged upgrades and downgrades This table provides the proportion of lagged upgrades/downgrades over the previous two years by credit rating level. N corresponds to the number of firm-year observations. N/A stands for not applicable.
Rating level N Lagged upgrades Lagged downgrades
AAA 315 2.22% N/A AA+ 112 5.36% 8.93% AA 395 4.05% 4.05% AA– 451 5.99% 10.20% A+ 828 7.37% 7.13% A 1,490 7.58% 7.32% A– 1,206 11.53% 11.28% BBB+ 1,534 11.28% 11.47% BBB 1,944 10.03% 11.88% BBB– 1,664 12.68% 12.98% BB+ 1,205 19.83% 12.53% BB 1,686 17.91% 11.03% BB– 2,067 14.80% 11.18% B+ 1,902 11.15% 12.62% B 1,029 10.01% 22.64% B– 508 9.65% 31.30% Rating < B– 324 7.41% 53.09%
All ratings 18,660 11.70% 12.71%

45
Table 6 Prior credit rating changes and acquisitiveness This table reports the effect of past rating actions on acquisition likelihood and intensity. In the probit models (Panel A), the dependent variable takes the value of 1 if the firm announced at least one acquisition in year t exceeding 1% of the market value of its equity, and 0 otherwise. The dependent variable in the tobit models (Panel B) is the sum of all acquisitions exceeding 1% of market equity announced by a firm in year t, divided by total assets at the end of year t–1. The reported estimates are marginal effects for probit and unconditional marginal effects for tobit models. Column (1) is based on the full sample, and columns (2) to (5) focus on subsamples based on credit rating levels as reported in the heading of the corresponding column. The explanatory variables are lagged by one year with respect to the dependent variable. Variable definitions are in the Appendix. All specifications include all control variables (as in column (9) of Table 3) and year and industry fixed effects, whose coefficients are suppressed and are based on calendar year and Fama-French 48 industry classification dummies, respectively. CR stands for credit rating level. The z-statistics reported in parentheses are adjusted for heteroskedasticity and acquirer clustering. ***, ** and * denote statistical significance at the 1%, 5%, and 10% levels, respectively. Panel A: Probit models
(1) (2) (3) (4) (5)
All CR < BB+
BB+ <=CR<= BBB–
BBB– <CR<=A–
CR>A–
Lagged upgrade 0.017* -0.007 0.050** 0.028 -0.014 (1.79) (-0.51) (2.42) (1.38) (-0.53) Lagged downgrade -0.066*** -0.063*** -0.049** -0.071*** -0.056*** (-8.06) (-5.01) (-2.46) (-4.17) (-2.81) Control variables Yes Yes Yes Yes Yes Year dummies Yes Yes Yes Yes Yes Industry dummies Yes Yes Yes Yes Yes Pseudo R² 0.056 0.071 0.097 0.073 0.104 Observations 17,533 6,807 2,738 4,537 3,390
Panel B. Tobit models
(1) (2) (3) (4) (5)
All CR < BB+
BB+ <=CR<= BBB–
BBB– <CR<=A–
CR>A–
Lagged upgrade 0.0033 -0.0026 0.0112*** 0.0052 -0.0013 (1.56) (-0.78) (9.60) (1.34) (-0.23) Lagged downgrade -0.0165*** -0.0168*** -0.0120*** -0.0161*** -0.0135*** (-6.93) (-4.41) (-10.45) (-3.70) (-2.61) Control variables Yes Yes Yes Yes Yes Year dummies Yes Yes Yes Yes Yes Industry dummies Yes Yes Yes Yes Yes Pseudo R² 0.083 0.099 0.137 0.112 0.173 Observations 17,533 6,823 2,768 4,537 3,405

46
Table 7 The effect of credit ratings on acquirer CARs This table presents the estimates of OLS regressions of acquirer 5-day cumulative abnormal returns (CARs) around the acquisition announcement on credit rating levels and control variables. The dependent variable is expressed as a percentage. Columns (3) and (4) are piecewise regressions with three different knots. In columns (1) through (3) the sample includes only the first transaction in a given year, while in column (4) the sample includes all transactions. Variable definitions are in the Appendix. All models include year and industry fixed effects, whose coefficients are suppressed and are based on calendar year and Fama-French 48 industry classification dummies, respectively. The t-statistics reported in parentheses are adjusted for heteroskedasticity. CR stands for credit rating level. ***, ** and * denote statistical significance at the 1%, 5%, and 10% levels, respectively.
(1) (2) (3) (4)
CR -0.161*** -0.752*** (-3.16) (-3.01) CR2 0.024** (2.55) CR < BB+ -0.382** -0.259* (-2.11) (-1.68) BB+ <= CR <=BBB– -0.214 -0.074 (-0.97) (-0.40) BBB– < CR <= A– -0.091 -0.151 (-0.64) (-1.29) CR > A– 0.048 0.018 (0.40) (0.17) Ln (Size) -0.071 -0.070 -0.063 -0.058 (-0.57) (-0.56) (-0.50) (-0.55) Relative size 2.317*** 2.298*** 2.304*** 2.158*** (4.92) (4.91) (4.92) (5.11) Horizontal 0.054 0.043 0.046 0.146 (0.22) (0.17) (0.19) (0.72) Public -3.162*** -3.177*** -3.176*** -3.267*** (-8.38) (-8.44) (-8.43) (-10.44) Cash 0.371 0.378 0.379 0.378* (1.55) (1.58) (1.59) (1.92) Cross border 0.219 0.217 0.219 0.258 (0.75) (0.74) (0.75) (1.07) Tender 1.775*** 1.791*** 1.781*** 1.682*** (3.28) (3.32) (3.30) (3.87) Hostile 0.158 0.123 0.130 0.00201 (0.17) (0.13) (0.14) (0.24) Year dummies Yes Yes Yes Yes Industry dummies Yes Yes Yes Yes Adjusted R² 0.059 0.060 0.060 0.058 Observations 3,358 3,358 3,358 4,760

47
Table 8 Downgrades by rating category A downgrade is defined as a decline in rating over a two-year period. The acquisition sample consists of firms that made at least one acquisition in year t, where the downgrade is measured over the period t-1 to t+1. N refers to the number of firms that have made acquisitions or have not made acquisitions. In Panel A all rating categories are displayed individually; in Panels B and C rating categories are grouped in the same sets as employed for the piece-wise linear regression in Table 3. Difference p-value in Panels A and B is the p-value of a t-test of the difference in proportions between the Acquisition and No Acquisition samples. In Panel C, the p-value refers to a t-test of differences in proportions between various groups in the likelihood of being downgraded. Positive (Negative) CAR Acquiring refers to acquirers that earned positive (negative) returns, on average, for the acquisitions completed in year t. Panel A. Downgrades by rating
Credit Rating All firms Acquiring firms
N Acquiring Other firms N Other Difference p-value
AAA 16.35% 25.71% 35 15.19% 283 0.11 AA+ 18.87% 31.25% 16 16.67% 90 0.17 AA 22.39% 32.73% 55 20.71% 338 0.05 AA– 27.21% 33.77% 77 25.87% 375 0.16 A+ 24.58% 31.45% 159 22.95% 671 0.02 A 21.67% 25.63% 320 20.56% 1,143 0.05 A– 25.92% 28.98% 245 25.13% 951 0.22 BBB+ 24.11% 25.45% 275 23.82% 1,247 0.57 BBB 20.69% 17.62% 369 21.43% 1,535 0.10 BBB– 18.99% 16.56% 320 19.60% 1,291 0.22 BB+ 22.30% 19.57% 230 22.99% 909 0.26 BB 22.19% 18.26% 334 23.24% 1,261 0.52 BB– 21.14% 13.70% 416 23.08% 1,590 0.00 B+ 18.36% 13.11% 366 19.67% 1,464 0.00 B 18.30% 13.43% 134 19.09% 817 0.12 B– 11.09% 11.11% 45 11.08% 397 0.99 Below B– 12.29% 0.00% 17 13.24% 219 0.11
Panel B. Downgrades by rating category
Credit Rating Category
All firms Acquiring firms
N Acquiring Other firms
N Other Difference p-value
CR>A– 22.57% 28.70% 662 21.17% 2,900 0.00 BBB–<CR<=A– 23.17% 23.17% 889 23.17% 3,733 0.99 BB+<=CR<=BBB– 20.36% 17.82% 550 21.00% 2,200 0.10 CR<BB+ 19.35% 14.41% 1,312 20.48% 5,748 0.00

48
Table 8 (continued)
Panel C. Downgrades by rating category and stock price response associated with the acquisitions
Credit Rating Category
Positive CAR
Acquiring
N Positive CAR
Acquiring
Negative CAR
Acquiring
N Negative CAR
Acquiring
Other Firms N Other p-value difference
positive CAR - negative CAR
p-value difference
positive CAR - other
p-value difference negative
CAR - other
CR>A– 26.89% 357 30.82% 305 21.17% 2,900 0.27 0.01 0.00 BBB–<CR<=A– 20.28% 503 26.94% 386 23.17% 3,733 0.02 0.15 0.10 BB+<=CR<=BBB– 16.92% 331 19.18% 219 21.00% 2,200 0.50 0.09 0.53 CR<BB+ 11.15% 771 19.04% 541 20.48% 5,748 0.00 0.00 0.43

49
Table 9 The impact of acquisitions on rating changes This table reports the effect of M&A decisions on credit rating changes in the period surrounding the merger announcements. The dependent variable in columns (1) and (3) of Panels A and B and column (1) of Panel C is ∆CRt–1,t+1, the rating change between year t+1 (post-treatment period) and year t–1 (control period). The dependent variable in columns (2) and (4) of Panels A and B, and column (2) of Panel C is a dummy variable set equal to one if the firm has been downgraded over the period t-1 to t+1. Models (1) and (3) of Panels A and B and model (1) of Panel C are estimated using OLS. Models (2) and (4) of Panels A and B and model (2) of Panel C are probit models. The main explanatory variable in models (1) and (2) of Panels A and B is a dummy variable set equal to one of the firm announced an acquisition in year t. In model (3) of Panels A and B, we include a dummy if the firm announced acquisitions associated with positive CARs, on average, and a dummy if the firm announced acquisitions with negative CARs, on average. In Panel C, these dummies are interacted with dummies representing
various rating ranges as measured in year t-1. In Panel B, p-value Pos – Neg) refers to the p-value of a t-test of equality of the coefficients on the positive and negative acquisitions dummies. In Panel C, we report p-values of t-tests of equality of the coefficients on the positive and negative acquisition dummies for various rating categories. Definitions of other variables are in the Appendix. The t-statistics (for OLS) and z-statistics (for probit) reported in parentheses below the coefficient estimates are adjusted for heteroskedasticity and firm clustering. ***, ** and * denote statistical significance at the 1%, 5%, and 10% levels, respectively.
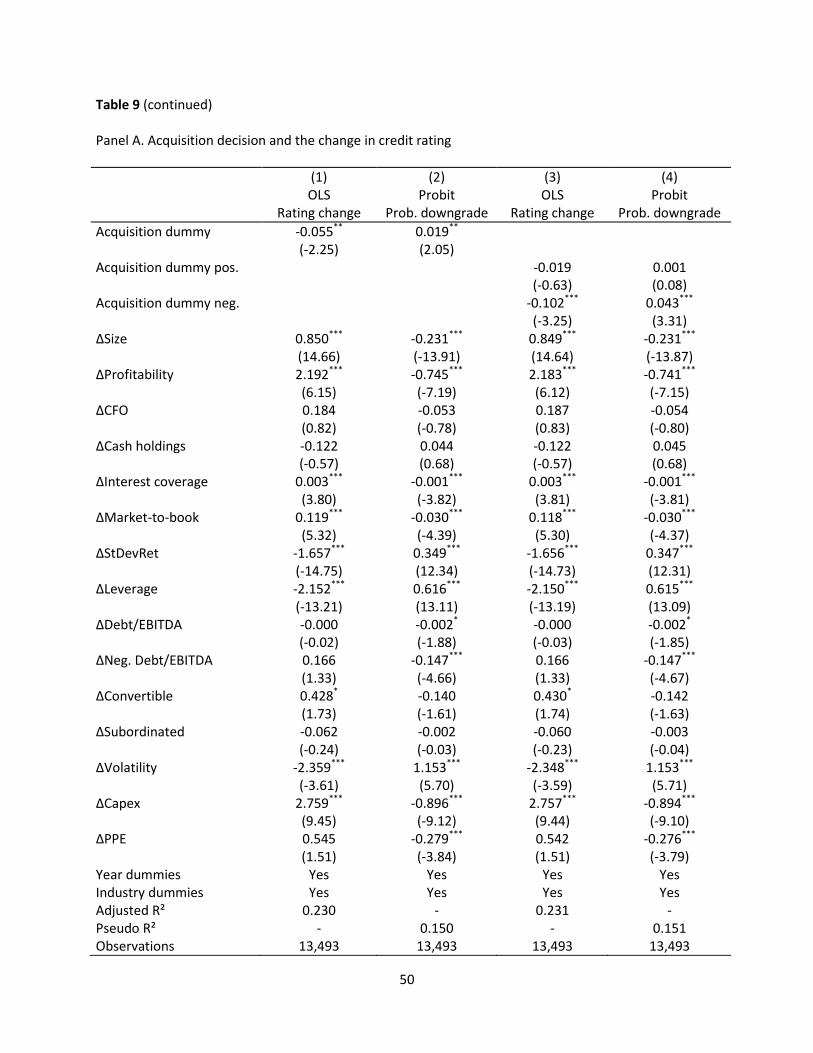
50
Table 9 (continued) Panel A. Acquisition decision and the change in credit rating
(1) (2) (3) (4)
OLS Rating change
Probit Prob. downgrade
OLS Rating change
Probit Prob. downgrade
Acquisition dummy -0.055** 0.019** (-2.25) (2.05) Acquisition dummy pos. -0.019 0.001 (-0.63) (0.08) Acquisition dummy neg. -0.102*** 0.043*** (-3.25) (3.31) ΔSize 0.850*** -0.231*** 0.849*** -0.231*** (14.66) (-13.91) (14.64) (-13.87) ΔProfitability 2.192*** -0.745*** 2.183*** -0.741*** (6.15) (-7.19) (6.12) (-7.15) ΔCFO 0.184 -0.053 0.187 -0.054 (0.82) (-0.78) (0.83) (-0.80) ΔCash holdings -0.122 0.044 -0.122 0.045 (-0.57) (0.68) (-0.57) (0.68) ΔInterest coverage 0.003*** -0.001*** 0.003*** -0.001*** (3.80) (-3.82) (3.81) (-3.81) ΔMarket-to-book 0.119*** -0.030*** 0.118*** -0.030*** (5.32) (-4.39) (5.30) (-4.37) ΔStDevRet -1.657*** 0.349*** -1.656*** 0.347*** (-14.75) (12.34) (-14.73) (12.31) ΔLeverage -2.152*** 0.616*** -2.150*** 0.615*** (-13.21) (13.11) (-13.19) (13.09) ΔDebt/EBITDA -0.000 -0.002* -0.000 -0.002* (-0.02) (-1.88) (-0.03) (-1.85) ΔNeg. Debt/EBITDA 0.166 -0.147*** 0.166 -0.147*** (1.33) (-4.66) (1.33) (-4.67) ΔConvertible 0.428* -0.140 0.430* -0.142 (1.73) (-1.61) (1.74) (-1.63) ΔSubordinated -0.062 -0.002 -0.060 -0.003 (-0.24) (-0.03) (-0.23) (-0.04) ΔVolatility -2.359*** 1.153*** -2.348*** 1.153*** (-3.61) (5.70) (-3.59) (5.71) ΔCapex 2.759*** -0.896*** 2.757*** -0.894*** (9.45) (-9.12) (9.44) (-9.10) ΔPPE 0.545 -0.279*** 0.542 -0.276*** (1.51) (-3.84) (1.51) (-3.79) Year dummies Yes Yes Yes Yes Industry dummies Yes Yes Yes Yes Adjusted R² 0.230 - 0.231 - Pseudo R² - 0.150 - 0.151 Observations 13,493 13,493 13,493 13,493

51
Table 9 (continued) Panel B. Controlling for excess stock returns
(1) (2) (3) (4) OLS
Rating change Probit
Prob. downgrade OLS
Rating change Probit
Prob. downgrade
Acquisition dummy -0.049** 0.019** (-2.00) (1.96) Acquisition dummy pos. -0.013 -0.000 (-0.42) (-0.02) Acquisition dummy neg. -0.097*** 0.043*** (-3.10) (3.28) Excess stock return 0.130*** -0.025*** 0.129*** -0.024*** (5.92) (-3.06) (5.86) (-3.00)
p-value Pos – Neg) 0.00 0.00
Control variables Yes Yes Yes Yes Year dummies Yes Yes Yes Yes Industry dummies Yes Yes Yes Yes Adjusted R² 0.233 - 0.233 - Pseudo R² - 0.153 - 0.153 Observations 13,403 13,403 13,403 13,403

52
Table 9 (continued) Panel C. Analysis for different rating categories
(1) (2) OLS
Rating change Probit
Prob. downgrade
Acquisition dummy pos. * CR>A– -0.317*** 0.063** (-4.84) (2.30) Acquisition dummy neg. * CR>A– -0.351*** 0.082*** (-5.46) (3.06) Acquisition dummy pos. * BBB–<CR<=A– -0.038 0.015 (-0.69) (0.72) Acquisition dummy neg. * BBB–<CR<=A– -0.207*** 0.078*** (-3.98) (3.33) Acquisition dummy pos. * BB+<=CR<=BBB– 0.097 0.007 (1.55) (0.25) Acquisition dummy neg. * BB+<=CR<=BBB– 0.041 0.039 (0.46) (1.18) Acquisition dummy pos. * CR<BB+ 0.142*** -0.067*** (3.11) (-4.04) Acquisition dummy neg. * CR<BB+ 0.132** -0.021 (2.51) (-0.94) Excess stock return 0.131*** -0.025*** (6.00) (-3.09)
p-value Pos – Neg) * CR>A– 0.69 0.60
p-value Pos – Neg) * BBB-<CR<=A– 0.01 0.03
p-value Pos – Neg) * BB+<=CR<=BBB- 0.58 0.45
p-value Pos – Neg) * CR<BB+ 0.88 0.07
Control variables Yes Yes Year dummies Yes Yes Industry dummies Yes Yes Adjusted R² 0.238 - Pseudo R² - 0.156 Observations 13,403 13,403


![Antônio Campello [Português]](https://img.pdfslide.net/doc/110x75/58cfcb341a28ab7c6e8b588d/antonio-campello-portugues.jpg)