Embed Size (px)
Citation preview


HUGO BOSS ©
Credit Suisse Asian Investment Conference 2016
Hong Kong, April 6/7, 2016
Mark Langer, CFO Dennis Weber, Head of Investor Relations
April 6/7, 2016 2Credit Suisse Asian Investment Conference // Hong Kong

HUGO BOSS ©
Agenda
April 6/7, 2016 3Credit Suisse Asian Investment Conference // Hong Kong
Strategic outlook 2016
Financial outlook 2016
Operational and financial review 2015

HUGO BOSS ©
Agenda
April 6/7, 2016 4Credit Suisse Asian Investment Conference // Hong Kong
Strategic outlook 2016
Financial outlook 2016
Operational and financial review 2015
HUGO BOSS © 5
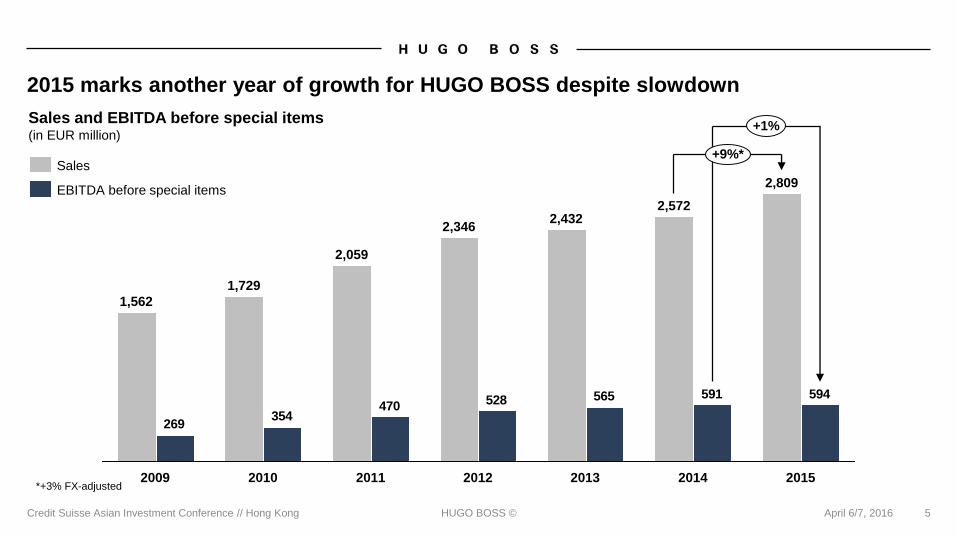
2015 marks another year of growth for HUGO BOSS despite slowdown
Sales
EBITDA before special items
Sales and EBITDA before special items(in EUR million)
594591565528470354
269
+1%
+9%*
2015
2,809
2014
2,572
2013
2,432
2012
2,346
2011
2,059
2010
1,729
2009
1,562
Credit Suisse Asian Investment Conference // Hong Kong April 6/7, 2016
*+3% FX-adjusted

HUGO BOSS © April 6/7, 2016 6Credit Suisse Asian Investment Conference // Hong Kong
Stable or even recessionary global market environment
Chinese men’s luxury
apparel market, y-o-y Retail sales development
(in %)***
0
2014
(3)
2013
(2)
2012
(2)
2015
12
2015
(12)
2014
(10)
2013
(1)
2012
*Source: TextilWirtschaft, based on TW-Testclub Panel; **Source: Bain & Comp. Altagamma 2015 Worldwide Markets Monitor; ***Source: Bain & Comp., 2015 China Luxury Market Study
German apparel
market, y-o-yRetail sales development
(in %)*
Americas luxury goods
market, y-o-yPersonal luxury goods market
(in %)**0
4
7
5
2015201420132012

HUGO BOSS © April 6/7, 2016 7Credit Suisse Asian Investment Conference // Hong Kong
Europe best performing region again in 2015
HUGO BOSS Europe sales 2015(in EUR million // FX-adj. change)
■ Business model transformation ongoing
■ Successful completion of category migration
process supports uplift of BOSS brand perception at
wholesale
■ Solid growth expected also in 2016
1,567
2013
1,457
2012
1,378
2011
1,245
2010
1,073
2015
1,683
2014
HUGO BOSS Europe sales 2010-2015(in EUR million)
+6%
FY
2015
1,683
FY
2014
1,567
+10%
Q4
2015
430
Q4
2014
382

HUGO BOSS © April 6/7, 2016 8Credit Suisse Asian Investment Conference // Hong Kong
Impressive fashion shows build BOSS Womenswear brand recognition

HUGO BOSS © April 6/7, 2016 9Credit Suisse Asian Investment Conference // Hong Kong
Acceleration in the fourth quarter supports solid full year sales growth
FY Group sales(in EUR million)
+9%
FY 2015
2,809
FY 2014
2,572
Q4 Group sales(in EUR million)
750684
+10%
Q4 2015Q4 2014
(+5% FX-adjusted) (+3% FX-adjusted)

HUGO BOSS © April 6/7, 2016 10Credit Suisse Asian Investment Conference // Hong Kong
Region Europe more than offsets sales declines in the Americas and Asia/Pacific
Sales growth by region, y-o-yQ4 2015
(in %)
10
1
9
13
5
10
1612840(4)(8)
Americas(1)
Europe*
Group
Asia/Pacific(7)
FX-adjusted
in EUR Sales growth by region, y-o-yFY 2015
(in %)
7
9
9
14
3
6
1612840(4)
Asia/Pacific(3)
Americas(1)
Europe*
Group
FX-adjusted
in EUR
■ Double-digit sales growth in the UK supports solid increases in Europe
■ 5% currency-adjusted sales decline in the U.S. in the full year partly offset by smaller countries in the Americas
■ Deteriorating sales trends in China mask strong performance in Australia and Japan in the Asia/Pacific region
*Incl. Middle East and Africa

HUGO BOSS © April 6/7, 2016 11Credit Suisse Asian Investment Conference // Hong Kong
Own retail is the Group’s growth driver also in 2015
Sales growth by channel, y-o-yQ4 2015
(in %)
5
10
10
6
11
10
2
6
0 5 10 15
Licenses
Wholesale
Retail
Group
FX-adjusted
in EUR Sales growth by channel, y-o-yFY 2015
(in %)
3
9
8
1
15
8
7
151050(5)
Licenses
Wholesale(3)
Retail
Group
FX-adjusted
in EUR
■ Retail comp store sales up 2% in the full year, down 1% in the fourth quarter
■ Difficult U.S. market and takeovers affect wholesale sales development
■ Double-digit growth in watches and eyewear drives license business
HUGO BOSS ©
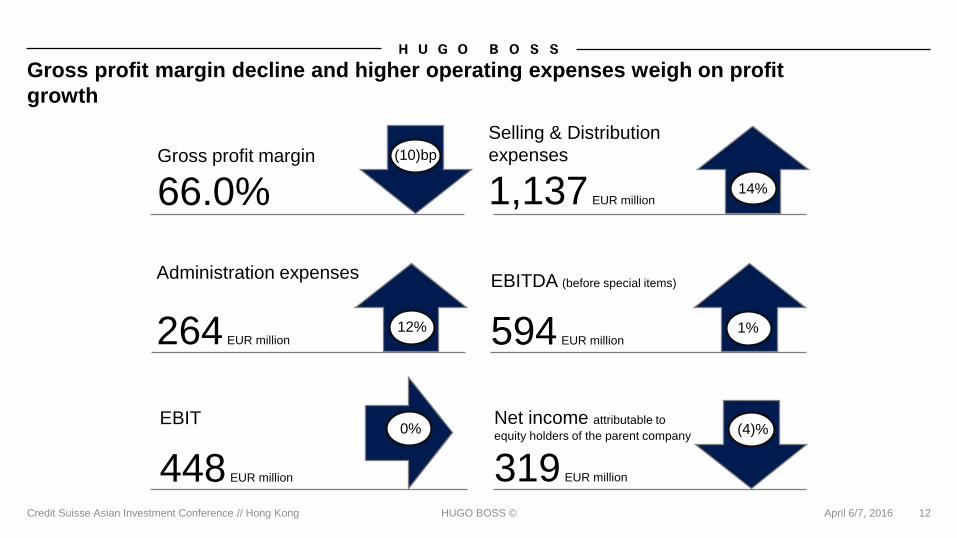
Selling & Distribution
expenses
1,137 EUR million
12
Gross profit margin decline and higher operating expenses weigh on profit
growth
EBITDA (before special items)
594 EUR million1%
Net income attributable to
equity holders of the parent company
319 EUR million
(4)%
12%
Administration expenses
264 EUR million
EBIT
448 EUR million
0%
Credit Suisse Asian Investment Conference // Hong Kong April 6/7, 2016
14%
Gross profit margin
66.0%(10)bp

HUGO BOSS © April 6/7, 2016 13
Better inventory management supports working capital improvement
5%
0
15%
10%
20%
Q2 2015 Q3 2015
3%
Q1 2015
16%
Q4 2014Q3 2014Q2 2014
13%
Q1 2014
19.1%
15%
8%
Q4 2015
3%
12%
4%
19.7%
17.9%
19.8% 19.8% 19.5%
18.1%18.7%
Trade net working capital
as a percentage of sales
Inventory growth y-o-y
Average trade net working capital as a percentage of sales (in %)
Currency-adjusted inventory growth, y-o-y
Credit Suisse Asian Investment Conference // Hong Kong

HUGO BOSS © April 6/7, 2016 14Credit Suisse Asian Investment Conference // Hong Kong
Higher investments affect free cash flow and net debt position
■ Investments in retail and
operational infrastructure drive
growth
■ Increase due to lower free
cash flow
220
135
+63%
FY 2015FY 2014
82
36
Dec. 31, 2015Dec. 31, 2014
+130%
208
268
FY 2014 FY 2015
(23)%
■ Decrease due to higher
investments
Investments(in EUR million)
Free cash flow(in EUR million)
Net debt(in EUR million)
HUGO BOSS © April 6/7, 2016 15
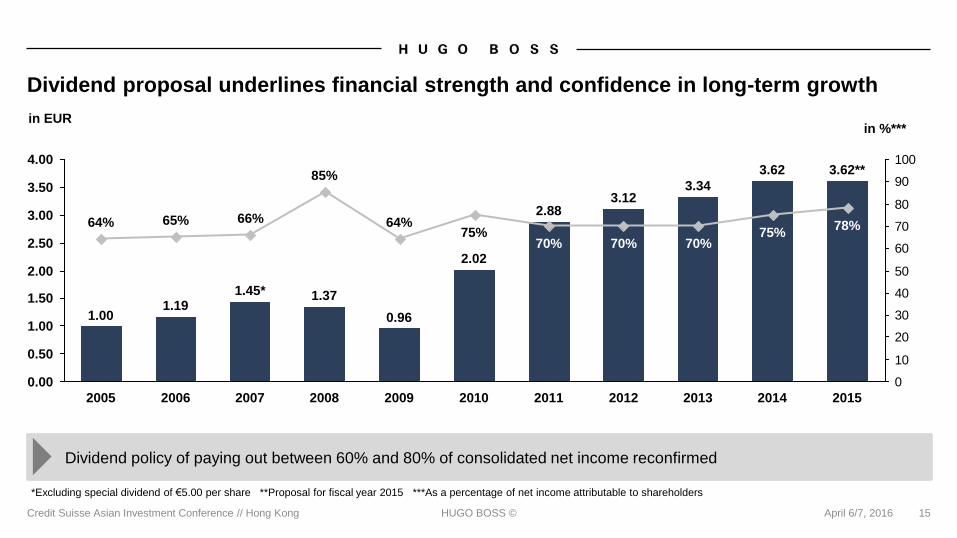
Dividend proposal underlines financial strength and confidence in long-term growth
0
10
20
30
40
50
60
70
80
90
100
1.00
0.50
1.50
0.00
3.00
4.00
3.50
2.50
2.00
75%
3.34
70%
2012
3.12
in %***
20132007
1.45*
66%
2006
1.19
65%
2005
1.00
64%
2015
3.62**
78%
2014
3.62
70%
2011
2.88
70%
2010
2.02
75%
2009
0.96
64%
2008
1.37
85%
in EUR
Dividend policy of paying out between 60% and 80% of consolidated net income reconfirmed
Credit Suisse Asian Investment Conference // Hong Kong
*Excluding special dividend of €5.00 per share **Proposal for fiscal year 2015 ***As a percentage of net income attributable to shareholders

HUGO BOSS ©
Agenda
April 6/7, 2016 16Credit Suisse Asian Investment Conference // Hong Kong
Strategic outlook 2016
Financial outlook 2016
Operational and financial review 2015

HUGO BOSS © April 6/7, 2016 17Credit Suisse Asian Investment Conference // Hong Kong
Strong assets are solid foundation for Group’s long-term success
Globally recognized brand Strong operational infrastructure Passionate workforce
Customer centricity, focus on brand control and global growth ambition to remain cornerstones of Group strategy

HUGO BOSS © April 6/7, 2016 18Credit Suisse Asian Investment Conference // Hong Kong
Upgrade of store network in China addresses legacy of prior franchise model
232215211211183
117
201520142013201220112010
HUGO BOSS China sales 2010-2015(in EUR million)
Number of own retail stores in China (Dec 31, 2015)
59
131
■ Upgrade and optimization of retail presence ongoing
■ Around 20 store closures planned in 2016
■ Renegotiation of rental contracts yields positive initial
results
Macau
Hong Kong
ML China

HUGO BOSS © April 6/7, 2016 19Credit Suisse Asian Investment Conference // Hong Kong
Price adjustments further strengthen the brand’s value proposition in Asia/Pacific
Asia/Pacific sales split (FY 2015)
16%
11%
59%
14%
Other
Oceania
Japan
China
100
ML China/
Taiwan
~150
Hong Kong/
Japan/
South Korea/
Singapore/
~135
Australia
~110
France
Price levels by market (indexed, after adjustment)■ Price reduction of around 20% in China yields positive
effect on demand and unit sales
■ Stepped-up of social media and CRM activities
contributes to traffic improvement
■ Smaller adjustments in remaining Asian markets ex
Australia and Japan

HUGO BOSS © April 6/7, 2016 20Credit Suisse Asian Investment Conference // Hong Kong
Upgrade of distribution in U.S. wholesale initiated
41% 59%
U.S. sales mix by distribution channel (2015)
Wholesale
Retail
Top 5 U.S. / CAD wholesale partners
1. Nordstrom
2. Bloomingdale’s
3. Hudson’s Bay
4. Macy’s
5. Dillards
HUGO BOSS U.S. sales 2010-2015(in EUR million) 530
463447434
349283
201520142013201220112010
■ Category migration limits exposure of BOSS core brand
to promotional retail environment
■ Concession agreement with Macy’s in place since the
end of January
■ BOSS core brand presence in off-price concepts to
become significantly smaller

HUGO BOSS © April 6/7, 2016 21Credit Suisse Asian Investment Conference // Hong Kong
“Man of today” influencer program to re-ignite brand interest in the U.S.

HUGO BOSS © April 6/7, 2016 22Credit Suisse Asian Investment Conference // Hong Kong
HUGO BOSS adjusts to changing customer journeys
■ hugoboss.com website important mean to engage
customers and drive them to store
■ Insourcing of online fulfillment in Europe in May
prerequisite for planned launch of omnichannel services
later in the year
■ Marketing spend to prioritize digital over print

HUGO BOSS ©
CRM and personalized service foster close ties with the customer
■ Ongoing rollout of my HUGO BOSS and corresponding
in-store application upgrades customer service
■ High focus on personnel management and retail trainings
April 6/7, 2016Credit Suisse Asian Investment Conference // Hong Kong 23

HUGO BOSS © April 6/7, 2016 24Credit Suisse Asian Investment Conference // Hong Kong
In-store performance sole driver of retail merchandising decisions in 2016
~10% of net sales
BOSS
Made To Measure
BOSS
Full Canvas Suits
BOSS
Tailored
BOSS
Premium
Formalwear
BOSS
Premium
Sportswear
~90% of net sales

HUGO BOSS © April 6/7, 2016 25Credit Suisse Asian Investment Conference // Hong Kong
Improvement of retail performance takes priority over further network expansion
BOSS Store
Moscow // Gum
Opening date: November 2016
■ Around 100 store refurbishments planned in 2016
■ Detailed analysis of underperforming stores being
prepared
■ New store opening projects planned for 2016 currently
under review, number of new openings to amount to
less than 20
Number of HUGO BOSS freestanding stores
430388371
327277
196
20112010 2013 2014 20152012

HUGO BOSS ©
Agenda
April 6/7, 2016 26Credit Suisse Asian Investment Conference // Hong Kong
Strategic outlook 2016
Financial outlook 2016
Operational and financial review 2015

HUGO BOSS ©
Group sales are forecast to increase at low single-digit percentage rate*
Sales by region* Sales by channel*
Europe Retail
Americas Wholesale
Asia/Pacific Licenses
27Credit Suisse Asian Investment Conference // Hong Kong
Sales trends in the second half of 2015 forecast to extend into 2016
April 6/7, 2016
*On a currency-adjusted basis

HUGO BOSS ©
Margin protection Free cash flow protection
Review of operating overhead cost structure Re-evaluation of planned 2016 store openings
Renegotiations of rental contracts Review of other non-committed capital investments
Performance analysis of key margin-dilutive stores Tightening of inventory management
Strict focus on cost management and cash generation in light of challenging outlook
28Credit Suisse Asian Investment Conference // Hong Kong April 6/7, 2016

HUGO BOSS ©
Outlook 2016
Sales growth (currency adjusted) Low single-digit percentage increase
Gross margin Stable performance
EBITDA before special items Low double-digit percentage decrease
Capex < EUR 200 million
Free cash flow Increase
April 6/7, 2016 29Credit Suisse Asian Investment Conference // Hong Kong
Free cash flow to exceed prior year level despite earnings decline

HUGO BOSS © April 6/7, 2016 30Credit Suisse Asian Investment Conference // Hong Kong
Management committed to making 2016 a year of change and opportunity

HUGO BOSS © April 6/7, 2016 31Credit Suisse Asian Investment Conference // Hong Kong
BACKUP

HUGO BOSS © April 6/7, 2016 32Credit Suisse Asian Investment Conference // Hong Kong
Brand portfolioP
RE
MIU
ML
UX
UR
Y
authentic
lighthearted
confident
sophisticated
progressive
contemporary
innovative
dynamic
Future brand positioning
WH
OLE
SA
LE
RE
TA
IL

HUGO BOSS ©
April 6/7, 201633
Credit Suisse Asian Investment Conference // Hong Kong
Brand portfolio*
72% of Group sales 9% of Group sales
10% of Group sales9% of Group sales
modern / sophisticated
progressive / contemporary
modern / active
casual / urban chic
*as of FY 2015
11-Mar-16 33

HUGO BOSS ©
April 6/7, 2016
Credit Suisse Asian Investment Conference // Hong Kong
Sales by region 2015
*+2% Licenses
Europe(incl. Middle East/Africa)
Americas Asia/Pacific
Share of Group sales*
60%
Germany: 17%
Great Britain: 12%
France: 6%
Benelux: 5%
Other: 20%
24%
U.S.: 19%
Canada: 3%
Central &
South America: 2%
14%
China: 8%
Oceania: 2%
Japan: 2%
Other: 2%
3434Investor Meeting Presentation March 2016

HUGO BOSS © April 6/7, 2016 35Credit Suisse Asian Investment Conference // Hong Kong
Sales by distribution channel
Wholesale
Retail
Licenses
2011
2%
45%
53%
2012
2%
49%
49%
2013
2%
54%
44%
2010
3%
40%
57%
2014
2%
57%
41%
2015
2%
60%
38%
HUGO BOSS © April 6/7, 2016 36Credit Suisse Asian Investment Conference // Hong Kong
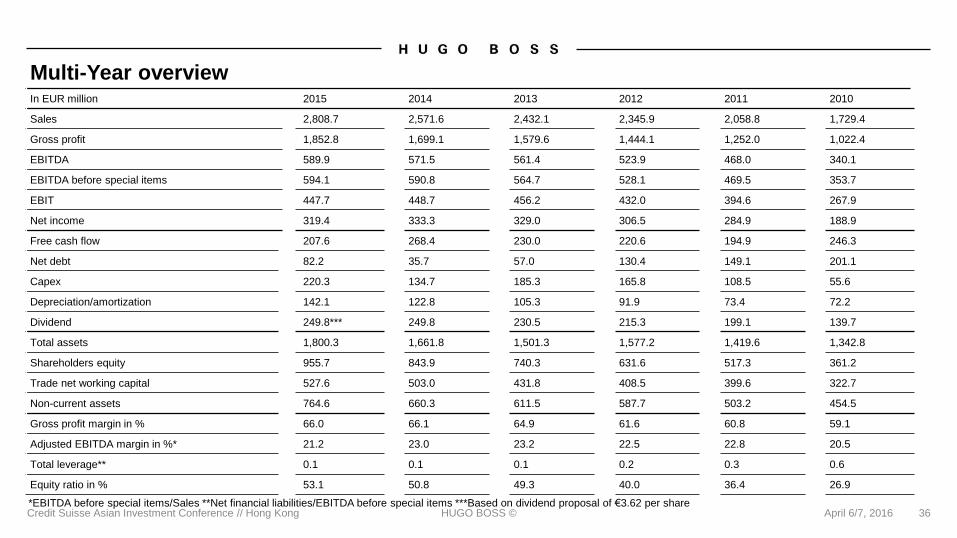
Multi-Year overviewIn EUR million 2015 2014 2013 2012 2011 2010
Sales 2,808.7 2,571.6 2,432.1 2,345.9 2,058.8 1,729.4
Gross profit 1,852.8 1,699.1 1,579.6 1,444.1 1,252.0 1,022.4
EBITDA 589.9 571.5 561.4 523.9 468.0 340.1
EBITDA before special items 594.1 590.8 564.7 528.1 469.5 353.7
EBIT 447.7 448.7 456.2 432.0 394.6 267.9
Net income 319.4 333.3 329.0 306.5 284.9 188.9
Free cash flow 207.6 268.4 230.0 220.6 194.9 246.3
Net debt 82.2 35.7 57.0 130.4 149.1 201.1
Capex 220.3 134.7 185.3 165.8 108.5 55.6
Depreciation/amortization 142.1 122.8 105.3 91.9 73.4 72.2
Dividend 249.8*** 249.8 230.5 215.3 199.1 139.7
Total assets 1,800.3 1,661.8 1,501.3 1,577.2 1,419.6 1,342.8
Shareholders equity 955.7 843.9 740.3 631.6 517.3 361.2
Trade net working capital 527.6 503.0 431.8 408.5 399.6 322.7
Non-current assets 764.6 660.3 611.5 587.7 503.2 454.5
Gross profit margin in % 66.0 66.1 64.9 61.6 60.8 59.1
Adjusted EBITDA margin in %* 21.2 23.0 23.2 22.5 22.8 20.5
Total leverage** 0.1 0.1 0.1 0.2 0.3 0.6
Equity ratio in % 53.1 50.8 49.3 40.0 36.4 26.9
*EBITDA before special items/Sales **Net financial liabilities/EBITDA before special items ***Based on dividend proposal of €3.62 per share

HUGO BOSS © April 6/7, 2016 37Credit Suisse Asian Investment Conference // Hong Kong
Retail comp stores sales growth
Sales growth retail l-f-l*
-2
0
2
4
6
8
10
12
11%
FY
2014
3%
Q4
2014
0%
Q3
2014
4%
Q2
2014
4%
Q1
2014
6%
FY
2013
2%
Q4
2013
3%
Q3
2013
4%
Q2
2013
2%
Q1
2013
2%
FY
2012
5%
Q4
2012
4%
Q3
2012
2%
Q1
2012
Q2
2012
4%
Q4
2015
-1%
Q3
2015
0%
Q2
2015
6%
Q1
2015
3%
Retail l-f-l
*FX-adjusted

HUGO BOSS © April 6/7, 2016 38
EBITDA margin and ROCE vs. channel mix
53%
60%63%62%64%
49%
31%31%31%
2010 201120082007 20152014201320122009
ROCE
Retail
Wholesale
Royalties
16.1%
23.2%
16.7%
20.5%
22.5%
17.2%
22.8%
21.2%
23.0%
24%
73%
38%
3% 2%
Adj. EBITDA margin
Credit Suisse Asian Investment Conference // Hong Kong
60%

HUGO BOSS © April 6/7, 2016 39Credit Suisse Asian Investment Conference // Hong Kong
Trade net working capital in relation to sales
Average trade net working capital as a percentage of sales by quarter*(in %)
0
2
4
6
8
10
12
14
16
18
20
22
Q2
2015
19.8
Q1
2015
19.7
Q4
2014
19.1
Q3
2014
18.7
Q2
2014
18.1
Q1
2014
17.9
Q4
2013
17.9
Q3
2013
18.0
Q2
2013
18.6
Q1
2013
19.7
Q2
2012
20.6
Q1
2012
20.1 19.8
Q3
2012
Q4
2012
+40bp
Q4
2015
19.5
Q3
2015
19.820.7
*Certain amounts shown here do not correspond to the figures published in prior years and reflect adjustments made

HUGO BOSS © April 6/7, 2016 40Credit Suisse Asian Investment Conference // Hong Kong
(Adjusted) financial leverage
Operating leases = Future committed operating lease obligations capitalized according to S&P methodology
EBITDAR = EBITDA + minimum rents + contingent rents
2009 2010 2011 2012 2013 2014 2015
0.4
0.0
2.4
2.0
1.6
1.2
0.8
1.3x
0.3x
1.6x
0.6x
2.2x
1.4x 1.4x1.3x
0.1x
1.2x
0.1x
1.2x
0.2x0.1x
Net debt incl. operating leases / EBITDAR
Net debt / EBITDA

HUGO BOSS © April 6/7, 2016 41Credit Suisse Asian Investment Conference // Hong Kong
Sourcing and production structure 2015*
*Percentage based on value of procurement volumes
Western Europe;
11%
Asia; 35%
North Africa; 5%
Eastern Europe;
46%
Americas; 3%
Third party production;
80%
Own production;
20%

HUGO BOSS © 42
Retail network
Number of own retail stores as of December 31
197270
323 371 388 430
261
264
413
526 531549
79
88
104
113 122
134
20152013
1,010
20122010
537
840
1,113
1,041
20142011
622
Outlets
Freestanding stores
Shop-in-shops
Credit Suisse Asian Investment Conference // Hong Kong April 6/7, 2016

HUGO BOSS © April 6/7, 2016 43Credit Suisse Asian Investment Conference // Hong Kong
Retail network (continued)
*Europe incl. Middle East and Africa
1,041
Dec. 31 2015Europe* Asia/Pacific Closings
1,113
Dec. 31, 2014 Americas
+ 55+ 28
+ 63 (74)
+ 17 UK
+ 9 France
+ 7 Italy
+ 6 Spain
+ 4 Germany
+ 4 Russia
+ 2 Denmark
+ 2 Greece
+ 1 Belgium
+ 1 Ireland
+ 1 Poland
+ 1 Turkey
+ 15 Mexico
+ 5 Canada
+ 4 Brazil
+ 4 USA
+ 30 China
+ 25 Korea
+ 2 Macau
+ 2 Japan
+ 1 Australia
+ 1 New Zealand
+ 1 Singapore
+ 1 Taiwan

HUGO BOSS © April 6/7, 2016 44Credit Suisse Asian Investment Conference // Hong Kong
HUGO BOSS share
Key Share Data
ISIN DE000A1PHFF7
WKN A1PHFF
Ticker Symbol BOSS
Stock exchanges: Xetra, Frankfurt/Main, Stuttgart, Dusseldorf, Hamburg, Munich, Hanover, Berlin/Bremen

HUGO BOSS © April 6/7, 2016 45Credit Suisse Asian Investment Conference // Hong Kong
Analyst coverage
The HUGO BOSS AG share is covered by the following financial analysts:
Institution Analyst
Baader Bank Volker Bosse
Bankhaus Lampe Peter Steiner
Bank of America Merrill Lynch Ashley Wallace
Barclays Julian Easthope
Bryan Garnier Cédric Rossi
Citigroup Thomas Chauvet
Commerzbank Andreas Riemann
Credit Suisse Guillaume Gauville
Deutsche Bank Warwick Okines
DZ Bank Herbert Sturm
equinet Mark Josefson
Exane BNP Paribas Luca Solca
Goldman Sachs William Hutchings
Hauck & Aufhäuser Christian Schwenkenbecher
HSBC Antoine Belge
Institution Analyst
Invest Securities Peter Farren
Jefferies Charmaine Yap
J.P. Morgan Melanie Flouquet
Kepler Cheuvreux Jürgen Kolb
LBBW Thomas Hofmann
M.M. Warburg Jörg Philipp Frey
MainFirst John Guy
Mirabaud Securities Alessandro Migliorini
Morgan Stanley Elena Mariani
Nomura Christopher Walker
Nord LB Wolfgang Vasterling
Oddo Seydler Martin Decot
RBC Claire Huff
Société Générale Thierry Cota
UBS Fred Speirs

HUGO BOSS © April 6/7, 2016 46
Credit Suisse Asian Investment Conference // Hong Kong
Level I ADR program
ADR Details Benefits of ADRs for U.S. investors
■ Clear and settle according to normal U.S. standards
■ Offer the convenience of stock quotes and dividend
payments in U.S. dollars
■ Can be purchased/sold in the same way as other
U.S. stocks via a U.S. broker
■ Provide a cost-effective means of international
portfolio diversification
For questions about creating HUGO BOSS ADRs, please contact BNY Mellon:
Market OTC
Symbol BOSSY
CUSIP 444560106
Ratio 5 : 1
Country Germany
Effective Date Jan 18, 2013
Underlying SEDOL B88MHC4
Underlying ISIN DE000A1PHFF7
Depositary BNY Mellon
New York
Rick Maehr / Ravi Davis
email: [email protected]
Tel: +1 212 815 2264
Hong Kong
Herston Powers
email: [email protected]
Tel: +852 2840 9868
London
Jacek Jankowski
email: [email protected]
Tel: +44 (0)20 7163 7427
Investor Meeting Presentation

HUGO BOSS © April 6/7, 2016 47Credit Suisse Asian Investment Conference // Hong Kong
Shareholder structure*
90%
Free float
2%
Own shares
8%
PFC S.r.l. / Zignago Holding S.p.A. / Tamburi
Investment Partners S.p.A.
*Source: Share register, voting rights notifications (as of February, 2016)

HUGO BOSS © April 6/7, 2016 48Credit Suisse Asian Investment Conference // Hong Kong
Financial calendar 2016
Date Event
May 3, 2016 First Quarter Results
May 19, 2016 Annual Shareholders’ Meeting
August 5, 2016 First Half Year Results
November 4, 2016 Nine Months Results

HUGO BOSS © April 6/7, 2016 49Credit Suisse Asian Investment Conference // Hong Kong
Investor Relations contact
Dennis Weber, CFA
Head of Investor Relations
Phone: +49 (0) 7123 94 - 86267
E-Mail: [email protected]
Internet: group.hugoboss.com
Frank Böhme,
Investor Relations Manager
Phone: +49 (0) 7123 94 - 87581
E-Mail: [email protected]
Internet: group.hugoboss.com
HUGO BOSS © April 6/7, 2016 50Credit Suisse Asian Investment Conference // Hong Kong
Forward looking statements contain risks
This document contains forward-looking statements that reflect management's current views with respect to future events. The
words "anticipate ", "assume ", "believe", "estimate", "expect", "intend", "may", "plan", "project", "should", and similar expressions
identify forward-looking statements. Such statements are subject to risks and uncertainties. If any of these or other risks and
uncertainties occur, or if the assumptions underlying any of these statements prove incorrect, then actual results may be
materially different from those expressed or implied by such statements. We do not intend or assume any obligation to update
any forward-looking statement, which speaks only as of the date on which it is made.