Embed Size (px)
Citation preview
CR E D IT S U I S S E FU N D SProspectus
May 1, 2004
CREDIT SUISSE TRUST
� SMALL CAP GROWTH PORTFOLIO
Credit Suisse Trust shares are not available directly to individual investors, but may beoffered only through certain insurance products and pension and retirement plans.
As with all mutual funds, the Securities and Exchange Commission has notapproved these securities, nor has it passed upon the adequacy or accuracy ofthis Prospectus. It is a criminal offense to state otherwise.
The Trust is advised by Credit Suisse Asset Management, LLC.

CONTENTS
KEY POINTS . . . . . . . . . . . . . . . . . . . . . . . . . . . . . . . . . . . . . . . . . . . 4Goal and Principal Strategies . . . . . . . . . . . . . . . . . . . . . . . . . . . 4A Word About Risk . . . . . . . . . . . . . . . . . . . . . . . . . . . . . . . . . . . 4Investor Profile . . . . . . . . . . . . . . . . . . . . . . . . . . . . . . . . . . . . . . 5
PERFORMANCE SUMMARY . . . . . . . . . . . . . . . . . . . . . . . . . . . . . . . . . 6Year-by-Year Total Returns . . . . . . . . . . . . . . . . . . . . . . . . . . . . . 6Average Annual Total Returns . . . . . . . . . . . . . . . . . . . . . . . . . . . 7
INVESTOR EXPENSES. . . . . . . . . . . . . . . . . . . . . . . . . . . . . . . . . . . . . 8Fees and Portfolio Expenses. . . . . . . . . . . . . . . . . . . . . . . . . . . . 8Example . . . . . . . . . . . . . . . . . . . . . . . . . . . . . . . . . . . . . . . . . . . 8
THE PORTFOLIO IN DETAIL . . . . . . . . . . . . . . . . . . . . . . . . . . . . . . . . . 9The Management Firm . . . . . . . . . . . . . . . . . . . . . . . . . . . . . . . . 9Portfolio Information Key . . . . . . . . . . . . . . . . . . . . . . . . . . . . . . . 9Goal and Strategies . . . . . . . . . . . . . . . . . . . . . . . . . . . . . . . . . 10Portfolio Investments. . . . . . . . . . . . . . . . . . . . . . . . . . . . . . . . . 11Risk Factors . . . . . . . . . . . . . . . . . . . . . . . . . . . . . . . . . . . . . . . 11Portfolio Management . . . . . . . . . . . . . . . . . . . . . . . . . . . . . . . . 11Financial Highlights. . . . . . . . . . . . . . . . . . . . . . . . . . . . . . . . . . 12
MORE ABOUT RISK . . . . . . . . . . . . . . . . . . . . . . . . . . . . . . . . . . . . . 13Introduction. . . . . . . . . . . . . . . . . . . . . . . . . . . . . . . . . . . . . . . . 13Types of Investment Risk . . . . . . . . . . . . . . . . . . . . . . . . . . . . . 13Certain Investment Practices. . . . . . . . . . . . . . . . . . . . . . . . . . . 16
MEET THE MANAGERS. . . . . . . . . . . . . . . . . . . . . . . . . . . . . . . . . . . 19
MORE ABOUT YOUR PORTFOLIO . . . . . . . . . . . . . . . . . . . . . . . . . . . . 20Share Valuation . . . . . . . . . . . . . . . . . . . . . . . . . . . . . . . . . . . . 20Distributions . . . . . . . . . . . . . . . . . . . . . . . . . . . . . . . . . . . . . . . 20Taxes . . . . . . . . . . . . . . . . . . . . . . . . . . . . . . . . . . . . . . . . . . . . 20Statements and Reports . . . . . . . . . . . . . . . . . . . . . . . . . . . . . . 21
BUYING AND SELLING SHARES . . . . . . . . . . . . . . . . . . . . . . . . . . . . . 22
OTHER INFORMATION . . . . . . . . . . . . . . . . . . . . . . . . . . . . . . . . . . . . 23About the Distributor . . . . . . . . . . . . . . . . . . . . . . . . . . . . . . . . . 23
FOR MORE INFORMATION . . . . . . . . . . . . . . . . . . . . . . . . . . back cover
3
4
� A WORD ABOUT RISK
All investments involve some level ofrisk. Simply defined, risk is thepossibility that you will lose money ornot make money.
Principal risk factors for the portfolioare discussed below. Before you invest,please make sure you understand therisks that apply to the portfolio. As withany mutual fund, you could lose moneyover any period of time.
Investments in the portfolio are notbank deposits and are not insured orguaranteed by the Federal DepositInsurance Corporation or any othergovernment agency.
MARKET RISK
The market value of a security mayfluctuate, sometimes rapidly andunpredictably. These fluctuations, whichare often referred to as “volatility,” maycause a security to be worth less than itwas worth at an earlier time. Market riskmay affect a single issuer, industry,
sector of the economy, or the market asa whole. Market risk is common to mostinvestments—including stocks andbonds, and the mutual funds that investin them.
SPECIAL-SITUATION COMPANIES
“Special situations” are unusualdevelopments that affect a company’smarket value. Examples includemergers, acquisitions andreorganizations. Securities of special-situation companies may decline invalue if the anticipated benefits of thespecial situation do not materialize.
START-UP AND OTHER SMALL COMPANIES
Start-up and other small companiesmay have less-experiencedmanagement, limited product lines,unproven track records or inadequatecapital reserves. Their securities may carry increased market, liquidityand other risks. Key information aboutthe company may be inaccurate or unavailable.
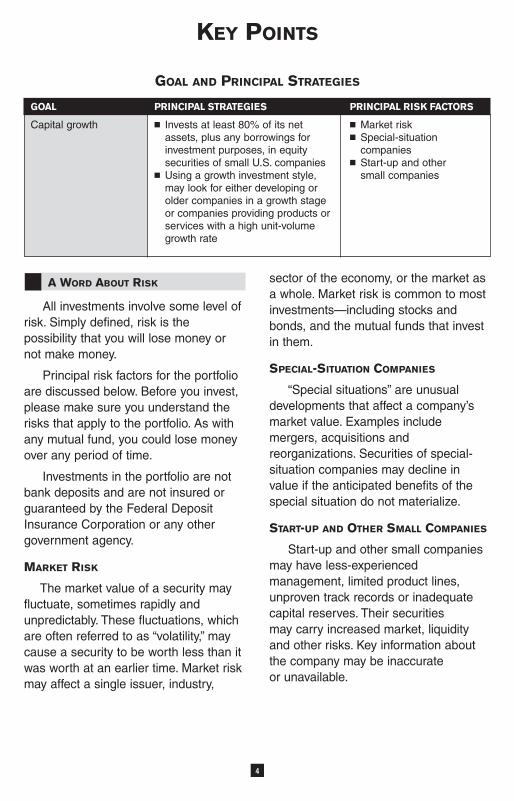
KEY POINTS
GOAL AND PRINCIPAL STRATEGIES
GOAL PRINCIPAL STRATEGIES PRINCIPAL RISK FACTORS
Capital growth � Invests at least 80% of its netassets, plus any borrowings forinvestment purposes, in equitysecurities of small U.S. companies
� Using a growth investment style,may look for either developing orolder companies in a growth stageor companies providing products orservices with a high unit-volumegrowth rate
� Market risk� Special-situation
companies� Start-up and other
small companies

5
� INVESTOR PROFILE
This portfolio is designed forinvestors who:
� are investing for long-term goals
� are willing to assume the risk oflosing money in exchange forattractive potential long-term returns
� are investing for capital appreciation
� want to diversify their investmentswith more aggressive stock funds
It may NOT be appropriate if you:
� are investing for a shorter time horizon
� are uncomfortable with an investmentthat will fluctuate in value
� are looking for income
You should base your investmentdecision on your own goals, riskpreferences and time horizon.
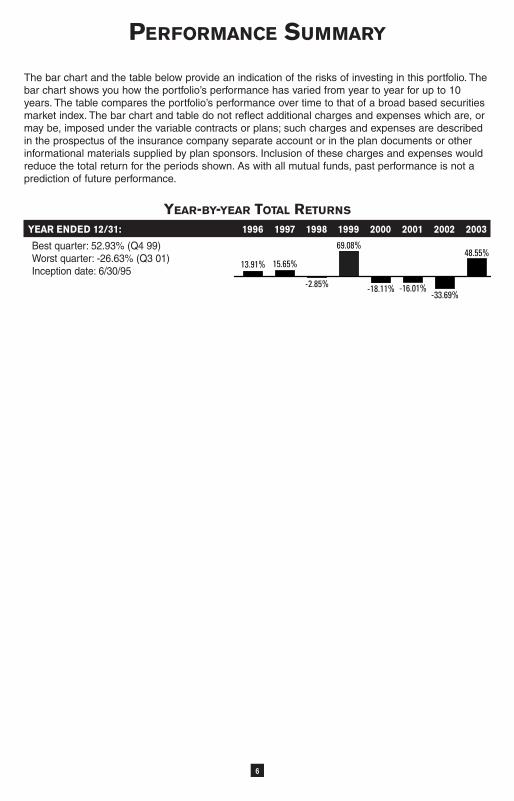
PERFORMANCE SUMMARY
The bar chart and the table below provide an indication of the risks of investing in this portfolio. Thebar chart shows you how the portfolio’s performance has varied from year to year for up to 10years. The table compares the portfolio’s performance over time to that of a broad based securitiesmarket index. The bar chart and table do not reflect additional charges and expenses which are, ormay be, imposed under the variable contracts or plans; such charges and expenses are describedin the prospectus of the insurance company separate account or in the plan documents or otherinformational materials supplied by plan sponsors. Inclusion of these charges and expenses wouldreduce the total return for the periods shown. As with all mutual funds, past performance is not aprediction of future performance.
YEAR-BY-YEAR TOTAL RETURNS
YEAR ENDED 12/31: 1996 1997 1998 1999 2000 2001 2002 2003
Best quarter: 52.93% (Q4 99) Worst quarter: -26.63% (Q3 01) Inception date: 6/30/95
6
-2.85% -18.11%
69.08%48.55%
13.91% 15.65%
-16.01%-33.69%
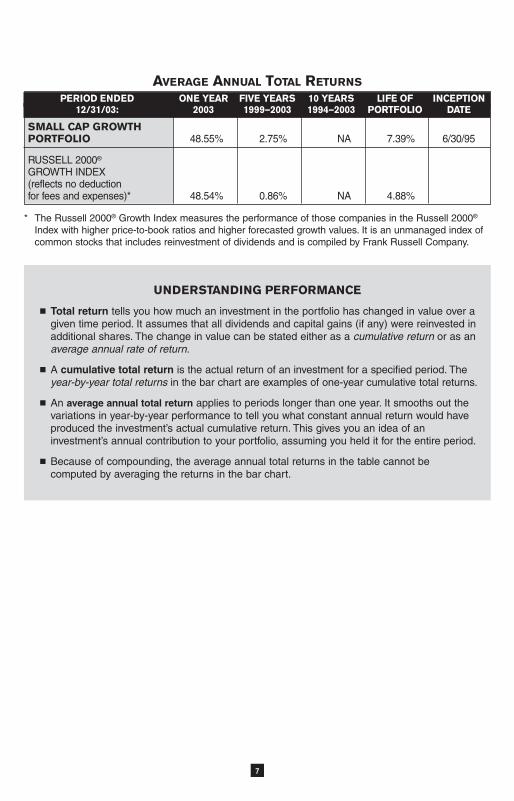
AVERAGE ANNUAL TOTAL RETURNSPERIOD ENDED ONE YEAR FIVE YEARS 10 YEARS LIFE OF INCEPTION
12/31/03: 2003 1999—2003 1994—2003 PORTFOLIO DATE
SMALL CAP GROWTHPORTFOLIO 48.55% 2.75% NA 7.39% 6/30/95
RUSSELL 2000®
GROWTH INDEX (reflects no deduction for fees and expenses)* 48.54% 0.86% NA 4.88%
* The Russell 2000® Growth Index measures the performance of those companies in the Russell 2000®
Index with higher price-to-book ratios and higher forecasted growth values. It is an unmanaged index ofcommon stocks that includes reinvestment of dividends and is compiled by Frank Russell Company.
7
UNDERSTANDING PERFORMANCE
� Total return tells you how much an investment in the portfolio has changed in value over agiven time period. It assumes that all dividends and capital gains (if any) were reinvested inadditional shares. The change in value can be stated either as a cumulative return or as anaverage annual rate of return.
� A cumulative total return is the actual return of an investment for a specified period. Theyear-by-year total returns in the bar chart are examples of one-year cumulative total returns.
� An average annual total return applies to periods longer than one year. It smooths out thevariations in year-by-year performance to tell you what constant annual return would haveproduced the investment’s actual cumulative return. This gives you an idea of aninvestment’s annual contribution to your portfolio, assuming you held it for the entire period.
� Because of compounding, the average annual total returns in the table cannot becomputed by averaging the returns in the bar chart.
INVESTOR EXPENSES
FEES AND PORTFOLIO EXPENSES
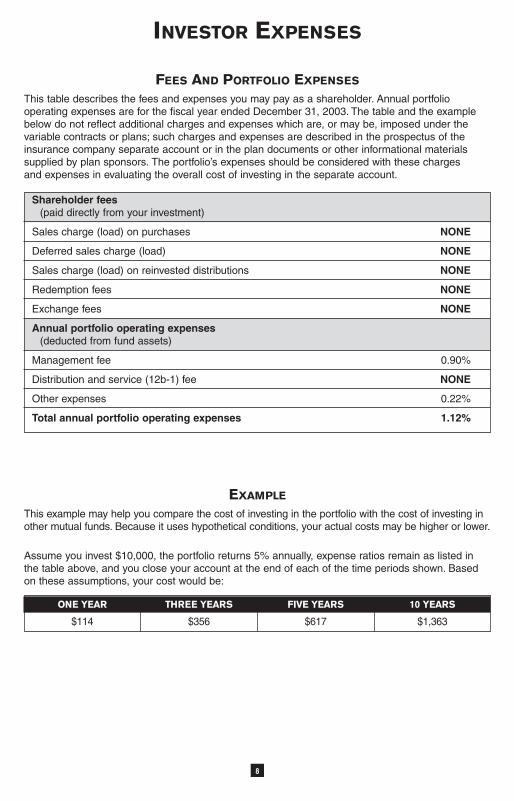
This table describes the fees and expenses you may pay as a shareholder. Annual portfoliooperating expenses are for the fiscal year ended December 31, 2003. The table and the examplebelow do not reflect additional charges and expenses which are, or may be, imposed under thevariable contracts or plans; such charges and expenses are described in the prospectus of theinsurance company separate account or in the plan documents or other informational materialssupplied by plan sponsors. The portfolio’s expenses should be considered with these chargesand expenses in evaluating the overall cost of investing in the separate account.
Shareholder fees(paid directly from your investment)
Sales charge (load) on purchases NONE
Deferred sales charge (load) NONE
Sales charge (load) on reinvested distributions NONE
Redemption fees NONE
Exchange fees NONE
Annual portfolio operating expenses(deducted from fund assets)
Management fee 0.90%
Distribution and service (12b-1) fee NONE
Other expenses 0.22%
Total annual portfolio operating expenses 1.12%
EXAMPLE
This example may help you compare the cost of investing in the portfolio with the cost of investing inother mutual funds. Because it uses hypothetical conditions, your actual costs may be higher or lower.
Assume you invest $10,000, the portfolio returns 5% annually, expense ratios remain as listed inthe table above, and you close your account at the end of each of the time periods shown. Basedon these assumptions, your cost would be:
ONE YEAR THREE YEARS FIVE YEARS 10 YEARS
$114 $356 $617 $1,363
8
9
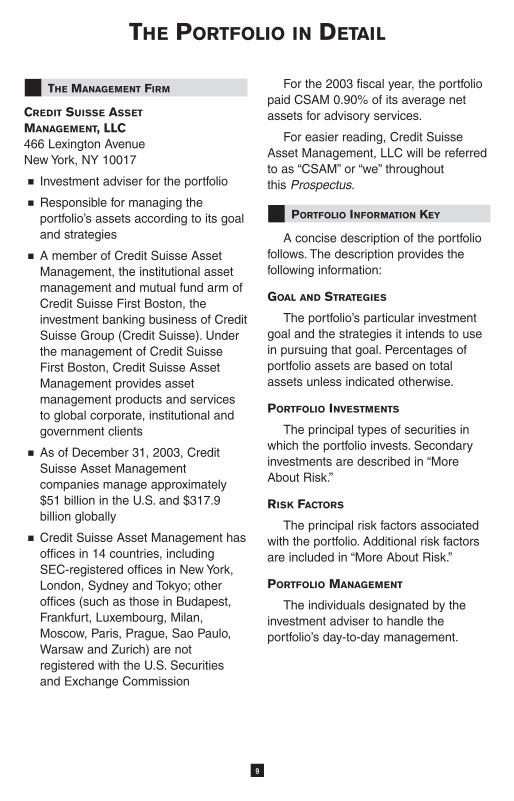
� THE MANAGEMENT FIRM
CREDIT SUISSE ASSET
MANAGEMENT, LLC466 Lexington AvenueNew York, NY 10017
� Investment adviser for the portfolio
� Responsible for managing theportfolio’s assets according to its goaland strategies
� A member of Credit Suisse AssetManagement, the institutional assetmanagement and mutual fund arm ofCredit Suisse First Boston, theinvestment banking business of CreditSuisse Group (Credit Suisse). Underthe management of Credit SuisseFirst Boston, Credit Suisse AssetManagement provides assetmanagement products and servicesto global corporate, institutional andgovernment clients
� As of December 31, 2003, CreditSuisse Asset Managementcompanies manage approximately$51 billion in the U.S. and $317.9billion globally
� Credit Suisse Asset Management hasoffices in 14 countries, includingSEC-registered offices in New York,London, Sydney and Tokyo; otheroffices (such as those in Budapest,Frankfurt, Luxembourg, Milan,Moscow, Paris, Prague, Sao Paulo,Warsaw and Zurich) are notregistered with the U.S. Securitiesand Exchange Commission
For the 2003 fiscal year, the portfoliopaid CSAM 0.90% of its average netassets for advisory services.
For easier reading, Credit SuisseAsset Management, LLC will be referredto as “CSAM” or “we” throughout this Prospectus.
� PORTFOLIO INFORMATION KEY
A concise description of the portfoliofollows. The description provides thefollowing information:
GOAL AND STRATEGIES
The portfolio’s particular investmentgoal and the strategies it intends to usein pursuing that goal. Percentages ofportfolio assets are based on totalassets unless indicated otherwise.
PORTFOLIO INVESTMENTS
The principal types of securities inwhich the portfolio invests. Secondaryinvestments are described in “MoreAbout Risk.”
RISK FACTORS
The principal risk factors associatedwith the portfolio. Additional risk factorsare included in “More About Risk.”
PORTFOLIO MANAGEMENT
The individuals designated by theinvestment adviser to handle theportfolio’s day-to-day management.
THE PORTFOLIO IN DETAIL
10
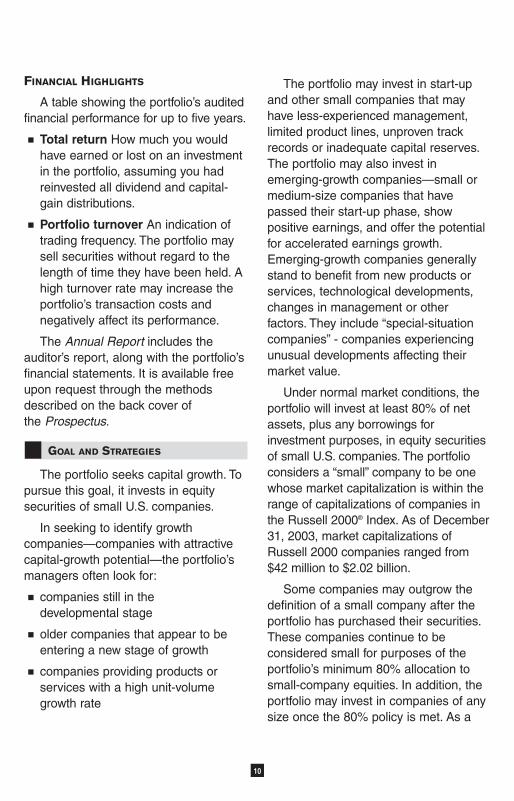
FINANCIAL HIGHLIGHTS
A table showing the portfolio’s auditedfinancial performance for up to five years.
� Total return How much you wouldhave earned or lost on an investmentin the portfolio, assuming you hadreinvested all dividend and capital-gain distributions.
� Portfolio turnover An indication oftrading frequency. The portfolio maysell securities without regard to thelength of time they have been held. Ahigh turnover rate may increase theportfolio’s transaction costs andnegatively affect its performance.
The Annual Report includes theauditor’s report, along with the portfolio’sfinancial statements. It is available freeupon request through the methodsdescribed on the back cover of the Prospectus.
� GOAL AND STRATEGIES
The portfolio seeks capital growth. Topursue this goal, it invests in equitysecurities of small U.S. companies.
In seeking to identify growthcompanies—companies with attractivecapital-growth potential—the portfolio’smanagers often look for:
� companies still in the developmental stage
� older companies that appear to beentering a new stage of growth
� companies providing products orservices with a high unit-volumegrowth rate
The portfolio may invest in start-upand other small companies that mayhave less-experienced management,limited product lines, unproven trackrecords or inadequate capital reserves.The portfolio may also invest inemerging-growth companies—small ormedium-size companies that havepassed their start-up phase, showpositive earnings, and offer the potentialfor accelerated earnings growth.Emerging-growth companies generallystand to benefit from new products orservices, technological developments,changes in management or otherfactors. They include “special-situationcompanies” - companies experiencingunusual developments affecting theirmarket value.
Under normal market conditions, theportfolio will invest at least 80% of netassets, plus any borrowings forinvestment purposes, in equity securitiesof small U.S. companies. The portfolioconsiders a “small” company to be onewhose market capitalization is within therange of capitalizations of companies inthe Russell 2000® Index. As of December31, 2003, market capitalizations ofRussell 2000 companies ranged from$42 million to $2.02 billion.
Some companies may outgrow thedefinition of a small company after theportfolio has purchased their securities.These companies continue to beconsidered small for purposes of theportfolio’s minimum 80% allocation tosmall-company equities. In addition, theportfolio may invest in companies of anysize once the 80% policy is met. As a
11
result, the portfolio’s average marketcapitalization may sometimes exceedthat of the largest company in theRussell 2000® Index.
The portfolio’s 80% investment policymay be changed by the Board ofTrustees on 60 days’ notice toshareholders. The portfolio’s investmentobjective may be changed withoutshareholder approval.
� PORTFOLIO INVESTMENTS
The portfolio’s equity holdings mayinclude:
� common and preferred stocks
� securities convertible into common stocks
� rights and warrants
The portfolio may invest up to 10% ofassets in foreign securities. The portfoliomay invest up to 20% of its net assets indebt securities, including up to 5% of itstotal assets in debt securities ratedbelow investment grade. To a limitedextent, it may also engage in otherinvestment practices.
� RISK FACTORS
The portfolio’s principal risk factors are:
� market risk
� start-up and other small companies
� special-situation companies
The value of your investmentgenerally will fluctuate in response tostock market movements. The portfolio’sperformance will largely depend uponthe performance of growth stocks, which
may be more volatile than the overallstock market.
Different types of stocks (such as“growth” vs. “value” stocks) tend to shiftin and out of favor depending on marketand economic conditions. Accordingly,the portfolio’s performance maysometimes be lower or higher than thatof other types of funds (such as thoseemphasizing value stocks).
Investing in start-up and other smallcompanies may expose the portfolio toincreased market, liquidity andinformation risks. These risks are definedin “More About Risk.”
Small companies and emerging-growth companies are often involved in“special situations.” Securities of special-situation companies may decline in valueand hurt the portfolio’s performance ifthe anticipated benefits of the specialsituation do not materialize.
“More About Risk” details certainother investment practices the portfoliomay use. Please read that sectioncarefully before you invest.
� PORTFOLIO MANAGEMENT
The Credit Suisse Small/Mid-CapGrowth Team is responsible for the day-to-day portfolio management of the portfolio.The team currently consists of MarianPardo, Leo M. Bernstein and CalvinChung. You can find out more about themin “Meet the Managers.”
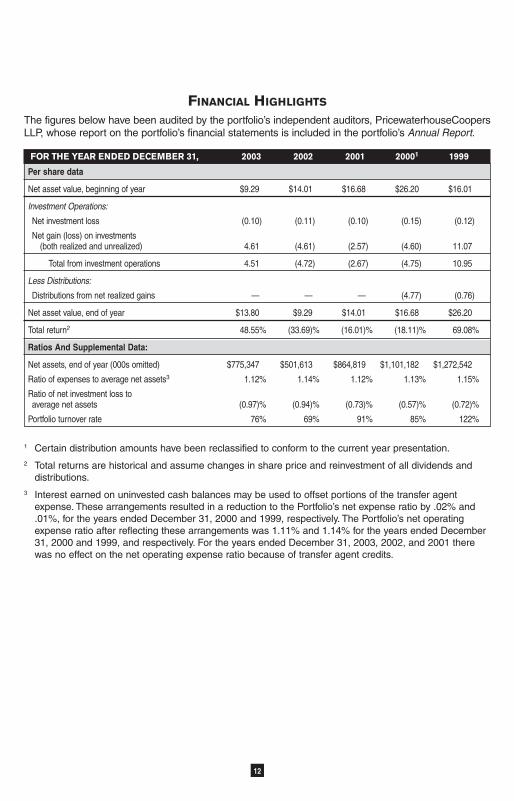
FINANCIAL HIGHLIGHTS
The figures below have been audited by the portfolio’s independent auditors, PricewaterhouseCoopersLLP, whose report on the portfolio’s financial statements is included in the portfolio’s Annual Report.
FOR THE YEAR ENDED DECEMBER 31, 2003 2002 2001 20001 1999
Per share data
Net asset value, beginning of year $9.29 $14.01 $16.68 $26.20 $16.01
Investment Operations:
Net investment loss (0.10) (0.11) (0.10) (0.15) (0.12)
Net gain (loss) on investments (both realized and unrealized) 4.61 (4.61) (2.57) (4.60) 11.07
Total from investment operations 4.51 (4.72) (2.67) (4.75) 10.95
Less Distributions:
Distributions from net realized gains — — — (4.77) (0.76)
Net asset value, end of year $13.80 $9.29 $14.01 $16.68 $26.20
Total return2 48.55% (33.69)% (16.01)% (18.11)% 69.08%
Ratios And Supplemental Data:
Net assets, end of year (000s omitted) $775,347 $501,613 $864,819 $1,101,182 $1,272,542
Ratio of expenses to average net assets3 1.12% 1.14% 1.12% 1.13% 1.15%
Ratio of net investment loss to average net assets (0.97)% (0.94)% (0.73)% (0.57)% (0.72)%
Portfolio turnover rate 76% 69% 91% 85% 122%
1 Certain distribution amounts have been reclassified to conform to the current year presentation.2 Total returns are historical and assume changes in share price and reinvestment of all dividends and
distributions.3 Interest earned on uninvested cash balances may be used to offset portions of the transfer agent
expense. These arrangements resulted in a reduction to the Portfolio’s net expense ratio by .02% and.01%, for the years ended December 31, 2000 and 1999, respectively. The Portfolio’s net operatingexpense ratio after reflecting these arrangements was 1.11% and 1.14% for the years ended December31, 2000 and 1999, and respectively. For the years ended December 31, 2003, 2002, and 2001 therewas no effect on the net operating expense ratio because of transfer agent credits.
12
13
� INTRODUCTION
The portfolio’s goal and principalstrategies largely determine its riskprofile. You will find a concise descriptionof the portfolio’s risk profile in “KeyPoints.” The discussion of the portfoliocontains more detailed information. Thissection discusses other risks that mayaffect the portfolio.
The portfolio may use certaininvestment practices that have higherrisks associated with them. However, theportfolio has limitations and policiesdesigned to reduce many of the risks.The “Certain Investment Practices” tabledescribes these practices and thelimitations on their use.
The Portfolio offers its shares to (1)insurance company separate accountsthat fund both variable-annuity contractsand variable life insurance contracts and(2) tax-qualified pension and retirementplans including participant-directed planswhich elect to make the portfolio aninvestment option for plan participants.Due to differences of tax treatment andother considerations, the interests ofvarious variable-annuity contract ownersand plan participants participating in theportfolio may conflict. The Board ofTrustees will monitor the portfolio for anymaterial conflicts that may arise and willdetermine what action, if any, should betaken. If a conflict occurs, the Board mayrequire one or more insurance companyseparate accounts and/or plans towithdraw its investments in the portfoliowhich may cause the portfolio to sellsecurities at disadvantageous prices anddisrupt orderly portfolio management.
The Board also may refuse to sellshares of the portfolio to any variable-annuity contract or plan or may suspendor terminate the offering of shares of theportfolio if such action is required by lawor regulatory authority or is in the bestinterests of the shareholders of the portfolio.
� TYPES OF INVESTMENT RISK
The following risks are referred tothroughout this Prospectus.
Correlation risk The risk thatchanges in the value of a hedginginstrument will not match those of theinvestment being hedged.
Credit risk The issuer of a security orthe counterparty to a contract maydefault or otherwise become unable tohonor a financial obligation.
Currency risk Fluctuations inexchange rates between the U.S. dollarand foreign currencies may negativelyaffect an investment. Adverse changesin exchange rates may erode or reverseany gains produced by foreign- currency-denominated investments and maywiden any losses.
Exposure risk The risk associatedwith investments (such as derivatives) orpractices (such as short selling) thatincrease the amount of money theportfolio could gain or lose on aninvestment.
� Hedged Exposure risk couldmultiply losses generated by aderivative or practice used forhedging purposes. Such lossesshould be substantially offset by
More About Risk
14
� gains on the hedged investment.However, while hedging can reduceor eliminate losses, it can alsoreduce or eliminate gains.
� Speculative To the extent that aderivative or practice is not used asa hedge, the portfolio is directlyexposed to its risks. Gains or lossesfrom speculative positions in aderivative may be much greaterthan the derivative’s original cost.For example, potential losses fromwriting uncovered call options andfrom speculative short sales areunlimited.
Extension risk An unexpected rise ininterest rates may extend the life of amortgage-backed security beyond theexpected prepayment time, typicallyreducing the security’s value.
Information risk Key informationabout an issuer, security or market maybe inaccurate or unavailable.
Interest-rate risk Changes in interestrates may cause a decline in the marketvalue of an investment. With bonds andother fixed-income securities, a rise in interest rates typically causes a fall in values.
Liquidity risk Certain portfoliosecurities may be difficult or impossibleto sell at the time and the price that theportfolio would like. The portfolio mayhave to lower the price, sell othersecurities instead or forgo an investmentopportunity. Any of these could have anegative effect on portfolio managementor performance.
Market risk The market value of asecurity may fluctuate, sometimesrapidly and unpredictably. Thesefluctuations, which are often referred toas “volatility,” may cause a security to beworth less than it was worth at an earliertime. Market risk may affect a singleissuer, industry, sector of the economy,or the market as a whole. Market risk iscommon to most investments—includingstocks and bonds, and the mutual fundsthat invest in them.
Operational risk Some countrieshave less-developed securities markets(and related transaction, registration andcustody practices) that could subject theportfolio to losses from fraud,negligence, delay or other actions.
Political risk Foreign governmentsmay expropriate assets, impose capitalor currency controls, impose punitivetaxes, or nationalize a company orindustry. Any of these actions could havea severe effect on security prices andimpair the portfolio’s ability to bring itscapital or income back to the U.S. Otherpolitical risks include economic policychanges, social and political instability,military action and war.
Prepayment risk Securities with highstated interest rates may be prepaidprior to maturity. During periods of falling interest rates, a portfolio wouldgenerally have to reinvest the proceedsat lower rates.
Valuation risk The lack of an activetrading market may make it difficult toobtain an accurate price for a portfolio security.

15
This page intentionally left blank
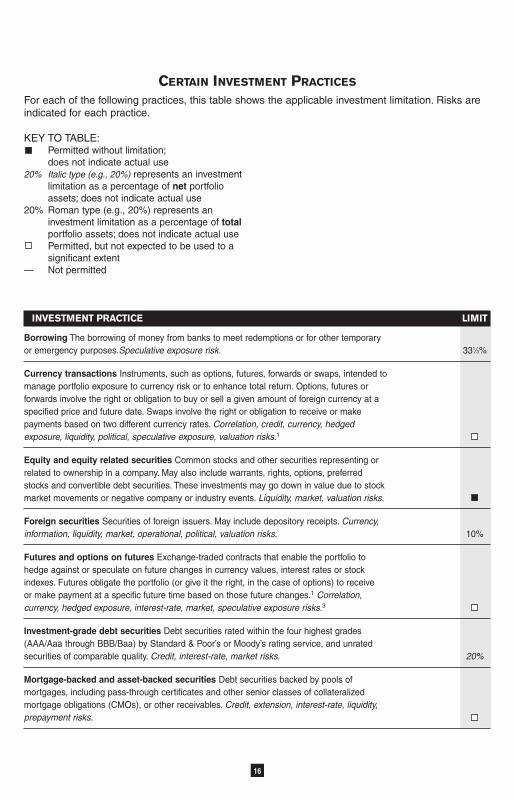
CERTAIN INVESTMENT PRACTICES
For each of the following practices, this table shows the applicable investment limitation. Risks areindicated for each practice.
KEY TO TABLE:Permitted without limitation;does not indicate actual use
20% Italic type (e.g., 20%) represents an investmentlimitation as a percentage of net portfolioassets; does not indicate actual use
20% Roman type (e.g., 20%) represents aninvestment limitation as a percentage of totalportfolio assets; does not indicate actual usePermitted, but not expected to be used to asignificant extent
— Not permitted
16
INVESTMENT PRACTICE LIMIT
Borrowing The borrowing of money from banks to meet redemptions or for other temporary or emergency purposes.Speculative exposure risk. 331⁄3%
Currency transactions Instruments, such as options, futures, forwards or swaps, intended to manage portfolio exposure to currency risk or to enhance total return. Options, futures or forwards involve the right or obligation to buy or sell a given amount of foreign currency at a specified price and future date. Swaps involve the right or obligation to receive or make payments based on two different currency rates. Correlation, credit, currency, hedged exposure, liquidity, political, speculative exposure, valuation risks.1
Equity and equity related securities Common stocks and other securities representing or related to ownership in a company. May also include warrants, rights, options, preferred stocks and convertible debt securities. These investments may go down in value due to stock market movements or negative company or industry events. Liquidity, market, valuation risks.
Foreign securities Securities of foreign issuers. May include depository receipts. Currency, information, liquidity, market, operational, political, valuation risks. 10%
Futures and options on futures Exchange-traded contracts that enable the portfolio to hedge against or speculate on future changes in currency values, interest rates or stock indexes. Futures obligate the portfolio (or give it the right, in the case of options) to receive or make payment at a specific future time based on those future changes.1 Correlation, currency, hedged exposure, interest-rate, market, speculative exposure risks.3
Investment-grade debt securities Debt securities rated within the four highest grades (AAA/Aaa through BBB/Baa) by Standard & Poor’s or Moody’s rating service, and unrated securities of comparable quality. Credit, interest-rate, market risks. 20%
Mortgage-backed and asset-backed securities Debt securities backed by pools of mortgages, including pass-through certificates and other senior classes of collateralized mortgage obligations (CMOs), or other receivables. Credit, extension, interest-rate, liquidity, prepayment risks.
17
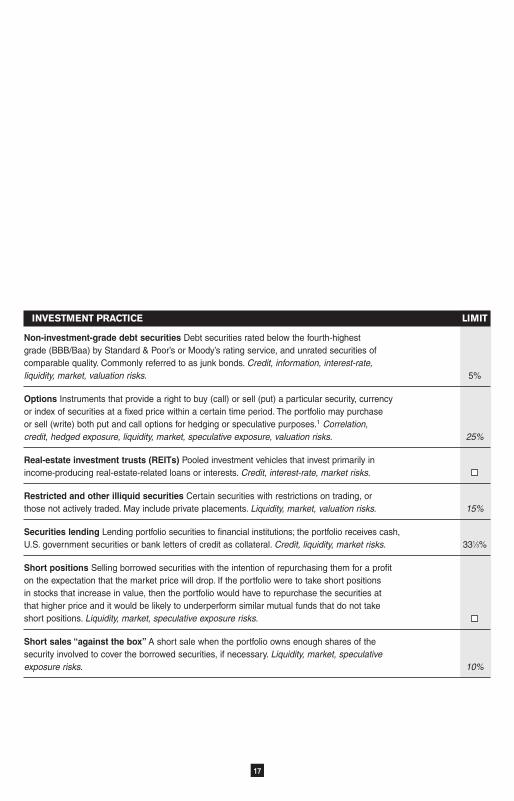
INVESTMENT PRACTICE LIMIT
Non-investment-grade debt securities Debt securities rated below the fourth-highest grade (BBB/Baa) by Standard & Poor’s or Moody’s rating service, and unrated securities of comparable quality. Commonly referred to as junk bonds. Credit, information, interest-rate, liquidity, market, valuation risks. 5%
Options Instruments that provide a right to buy (call) or sell (put) a particular security, currency or index of securities at a fixed price within a certain time period. The portfolio may purchase or sell (write) both put and call options for hedging or speculative purposes.1 Correlation, credit, hedged exposure, liquidity, market, speculative exposure, valuation risks. 25%
Real-estate investment trusts (REITs) Pooled investment vehicles that invest primarily in income-producing real-estate-related loans or interests. Credit, interest-rate, market risks.
Restricted and other illiquid securities Certain securities with restrictions on trading, or those not actively traded. May include private placements. Liquidity, market, valuation risks. 15%
Securities lending Lending portfolio securities to financial institutions; the portfolio receives cash,U.S. government securities or bank letters of credit as collateral. Credit, liquidity, market risks. 331⁄3%
Short positions Selling borrowed securities with the intention of repurchasing them for a profit on the expectation that the market price will drop. If the portfolio were to take short positions in stocks that increase in value, then the portfolio would have to repurchase the securities at that higher price and it would be likely to underperform similar mutual funds that do not take short positions. Liquidity, market, speculative exposure risks.
Short sales “against the box” A short sale when the portfolio owns enough shares of the security involved to cover the borrowed securities, if necessary. Liquidity, market, speculative exposure risks. 10%
18
INVESTMENT PRACTICE LIMIT
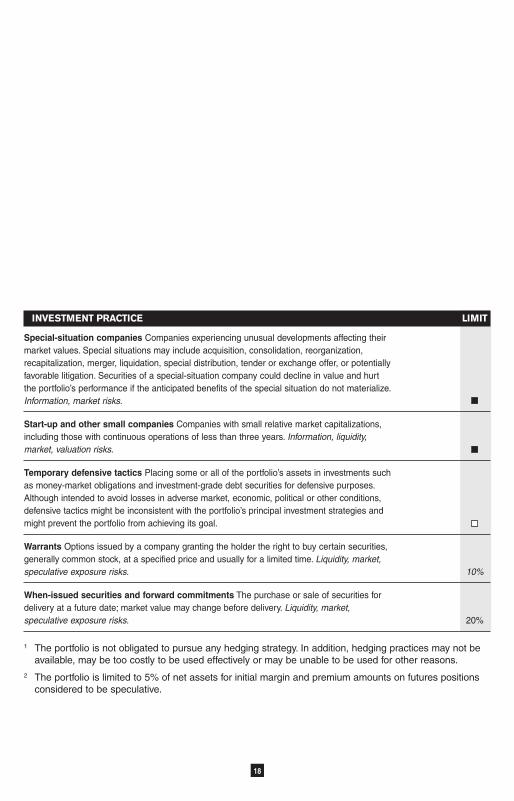
Special-situation companies Companies experiencing unusual developments affecting their market values. Special situations may include acquisition, consolidation, reorganization, recapitalization, merger, liquidation, special distribution, tender or exchange offer, or potentially favorable litigation. Securities of a special-situation company could decline in value and hurt the portfolio’s performance if the anticipated benefits of the special situation do not materialize.Information, market risks.
Start-up and other small companies Companies with small relative market capitalizations, including those with continuous operations of less than three years. Information, liquidity, market, valuation risks.
Temporary defensive tactics Placing some or all of the portfolio’s assets in investments such as money-market obligations and investment-grade debt securities for defensive purposes.Although intended to avoid losses in adverse market, economic, political or other conditions, defensive tactics might be inconsistent with the portfolio’s principal investment strategies and might prevent the portfolio from achieving its goal.
Warrants Options issued by a company granting the holder the right to buy certain securities, generally common stock, at a specified price and usually for a limited time. Liquidity, market, speculative exposure risks. 10%
When-issued securities and forward commitments The purchase or sale of securities for delivery at a future date; market value may change before delivery. Liquidity, market, speculative exposure risks. 20%
1 The portfolio is not obligated to pursue any hedging strategy. In addition, hedging practices may not beavailable, may be too costly to be used effectively or may be unable to be used for other reasons.
2 The portfolio is limited to 5% of net assets for initial margin and premium amounts on futures positionsconsidered to be speculative.
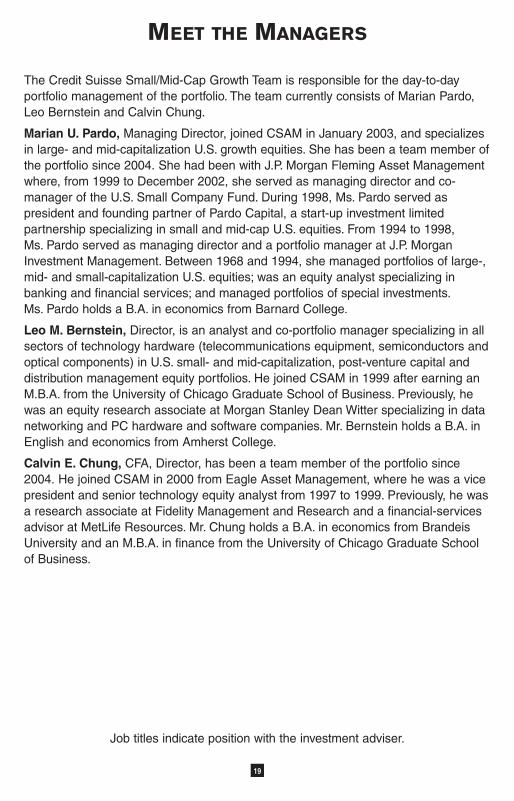
MEET THE MANAGERS
The Credit Suisse Small/Mid-Cap Growth Team is responsible for the day-to-dayportfolio management of the portfolio. The team currently consists of Marian Pardo,Leo Bernstein and Calvin Chung.
Marian U. Pardo, Managing Director, joined CSAM in January 2003, and specializesin large- and mid-capitalization U.S. growth equities. She has been a team member ofthe portfolio since 2004. She had been with J.P. Morgan Fleming Asset Managementwhere, from 1999 to December 2002, she served as managing director and co-manager of the U.S. Small Company Fund. During 1998, Ms. Pardo served aspresident and founding partner of Pardo Capital, a start-up investment limitedpartnership specializing in small and mid-cap U.S. equities. From 1994 to 1998, Ms. Pardo served as managing director and a portfolio manager at J.P. MorganInvestment Management. Between 1968 and 1994, she managed portfolios of large-,mid- and small-capitalization U.S. equities; was an equity analyst specializing inbanking and financial services; and managed portfolios of special investments.Ms. Pardo holds a B.A. in economics from Barnard College.
Leo M. Bernstein, Director, is an analyst and co-portfolio manager specializing in allsectors of technology hardware (telecommunications equipment, semiconductors andoptical components) in U.S. small- and mid-capitalization, post-venture capital anddistribution management equity portfolios. He joined CSAM in 1999 after earning anM.B.A. from the University of Chicago Graduate School of Business. Previously, hewas an equity research associate at Morgan Stanley Dean Witter specializing in datanetworking and PC hardware and software companies. Mr. Bernstein holds a B.A. inEnglish and economics from Amherst College.
Calvin E. Chung, CFA, Director, has been a team member of the portfolio since2004. He joined CSAM in 2000 from Eagle Asset Management, where he was a vicepresident and senior technology equity analyst from 1997 to 1999. Previously, he wasa research associate at Fidelity Management and Research and a financial-servicesadvisor at MetLife Resources. Mr. Chung holds a B.A. in economics from BrandeisUniversity and an M.B.A. in finance from the University of Chicago Graduate Schoolof Business.
19
Job titles indicate position with the investment adviser.
20
� SHARE VALUATION
The net asset value (NAV) of theportfolio is determined at the close ofregular trading on the New York StockExchange (NYSE) (usually 4 p.m.Eastern Time) each day the NYSE isopen for business. It is calculated bydividing the portfolio’s total assets, lessits liabilities, by the number of sharesoutstanding.
The portfolio values its securitiesbased on market quotations when itcalculates its NAV. If market quotationsare not readily available, or when thevalue of a security has been materiallyaffected by events occurring after therelevant market closes, the portfolio mayprice those securities at fair value asdetermined in good faith by or under thedirection of the Board of Trustees. Debtobligations that will mature in 60 days orless are valued on the basis ofamortized cost, unless it is determinedthat using this method would not reflectan investment’s fair value. A portfolio thatuses fair value to price securities mayvalue those securities higher or lowerthan another portfolio that uses marketquotations or its own fair valueprocedures to price the same securities.
Some portfolio securities may belisted on foreign exchanges that areopen on days (such as U.S. holidays)when the portfolio does not compute itsprices. This could cause the value of theportfolio’s investments to be affected bytrading on days when you cannot buy orsell shares.
� DISTRIBUTIONS
As a portfolio investor, you willreceive distributions.
The portfolio earns dividends fromstocks and interest from bond, money-market and other investments. These arepassed along as dividend distributions.The portfolio realizes capital gainswhenever it sells securities for a higherprice than it paid for them. These arepassed along as capital gaindistributions.
The portfolio typically distributesdividends and capital gains annually,usually in December. The portfolio maymake additional distributions at othertimes if necessary to avoid a federal tax.Unless otherwise specified, distributionswill be reinvested automatically inadditional shares of the portfolio.
Estimated year-end distributioninformation, including record andpayment dates, generally will beavailable late in the year atwww.csam.com or by calling 800-222-8977.
� TAXES
Because shares of the portfolio maybe purchased only through variablecontracts and plans, income dividends and capital gain distributions from theportfolio are taxable, if at all, to theparticipating insurance companies andplans and the variable contract owner orplan participant generally will not besubject to tax on such dividends anddistributions until they are distributed to
MORE ABOUT YOUR PORTFOLIO
21
such owner or participant from theirrespective variable contract or plan. Fora discussion of the tax status of avariable contract or pension orretirement plan, refer to the prospectusof the sponsoring participating insurancecompany separate account or plandocuments or other informationalmaterials supplied by plan sponsors.
The portfolio intends to comply withthe diversification requirements currentlyimposed by the Internal Revenue Codeon separate accounts of insurancecompanies as a condition of maintainingthe tax-deferred status of variablecontracts.
� STATEMENTS AND REPORTS
The portfolio produces financialreports, which include a list of theportfolio’s holdings, semiannually andupdates its prospectus annually. The
portfolio generally does not holdshareholder meetings. To reduceexpenses by eliminating duplicatemailings to the same address, theportfolio may choose to mail only onereport, prospectus or proxy statement toyour household, even if more than oneperson in the household has an accountwith the portfolio. If you would like toreceive additional reports, prospectusesor proxy statements, please call 800-222-8977.
CSAM makes available, upon requestand without charge, periodic listings ofthe portfolio’s securities and otherstatistical characteristics of the portfolio(such as the portfolio’s industrydiversification). This information is madeavailable after each month end on theportfolio’s website www.csam.com.
22
BUYING AND SELLING SHARES
You may not buy or sell shares of theportfolio directly; you may only buy orsell shares through variable-annuitycontracts and variable life insurancecontracts offered by separate accountsof certain insurance companies orthrough tax-qualified pension andretirement plans. The portfolio may notbe available in connection with aparticular contract or plan.
An insurance company’s separateaccounts buy and sell shares of theportfolio at NAV, without any sales orother charges. Each insurance companyreceives orders from its contract holdersto buy or sell shares of the portfolio onany business day that the portfoliocalculates its NAV. If the order isreceived by the insurance company priorto the close of regular trading on theNYSE, the order will be executed at thatday’s NAV.
Plan participants may buy shares ofthe portfolio through their plan bydirecting the plan trustee to buy sharesfor their account in a manner similar tothat described above for variable annuityand variable life insurance contracts. Youshould contact your plan sponsorconcerning the appropriate procedure forinvesting in the portfolio.
The portfolio reserves the right to:
� refuse any purchase or exchangerequest, including those from anyperson or group who, in the portfolio’sview, has engaged or is likely toengage in market timing. Markettiming—the frequent trading ofportfolio shares designed to takeadvantage of short-term market
movements—can harm the portfolioand its shareholders. However, theportfolio’s shares are offeredexclusively to insurance companyseparate accounts that fund certaininsurance contracts, or to tax-qualifiedpension and retirement plans, and theportfolio generally has little or noaccess to the records of individualcontract holders or plan participants.The portfolio is dependent on theability of these separate accounts andplans to limit market timing andexcessive trading of portfolio shares.There can be no assurance thatmarket timing in the portfolio’s shareswill not occur.
� change or discontinue its exchangeprivilege after 60 days’ notice tocurrent investors, or temporarilysuspend this privilege during unusualmarket conditions
� charge a wire redemption fee
� make a “redemption in kind”—payment in portfolio securities ratherthan cash—for certain largeredemption amounts that could hurtportfolio operations
� suspend redemptions or postponepayment dates as permitted by law(such as during periods other thanweekends or holidays when theNYSE is closed or trading on theNYSE is restricted, or any other timethat the SEC permits)
� stop offering the portfolio’s shares fora period of time (such as whenmanagement believes that asubstantial increase in assets couldadversely affect it)
23
� ABOUT THE DISTRIBUTOR
Credit Suisse Asset ManagementSecurities, Inc. (CSAMSI), an affiliate of CSAM, serves as distributor of theportfolio’s shares. CSAMSI or itsaffiliates (including CSAM) may makepayments out of their own resources tofirms offering shares of the portfolio forproviding administration, subaccounting,transfer agency and/or other services.CSAMSI or its affiliates may also makepayments out of past profits and otheravailable sources for marketing,promotional or related expenses. Suchpayments may be made to insurancecompanies and other entities offeringshares of the portfolio and/or providingservices with respect to such shares.The amount of these payments isdetermined by CSAMSI or its affiliatesand may be substantial. For furtherinformation on the distributor’s paymentsfor distribution and shareholderservicing, see “Management of theFund--Distribution and ShareholderServicing” in the SAI.
OTHER INFORMATION
FOR MORE INFORMATION
CREDIT SUISSE ASSET MANAGEMENT SECURITIES, INC., DISTRIBUTOR. TRSCG-1-0504
This Prospectus is intended for use inconnection with certain insuranceproducts and pension and retirementplans. Please refer to the prospectus ofthe sponsoring participating insurancecompany separate account or to theplan documents or other informationalmaterials supplied by plan sponsors forinformation regarding distributions andinstructions on purchasing or selling avariable contract and on how to select aportfolio as an investment option for avariable contract or plan. Moreinformation about the portfolio isavailable free upon request, includingthe following:
� ANNUAL/SEMIANNUAL
� REPORTS TO SHAREHOLDERS
Includes financial statements,portfolio investments and detailedperformance information.
The Annual Report also contains aletter from the portfolio managersdiscussing market conditions andinvestment strategies that significantlyaffected portfolio performance during itspast fiscal year.
� OTHER INFORMATION
A current Statement of AdditionalInformation (SAI), which provides moredetails about the portfolio, is on file withthe Securities and ExchangeCommission (SEC) and is incorporatedby reference.
You may visit the SEC’s Internet Website (www.sec.gov) to view the SAI,material incorporated by reference andother information. You can also obtaincopies by visiting the SEC’s PublicReference Room in Washington, DC(phone 202-942-8090) or by sendingyour request and a duplicating fee to theSEC’s Public Reference Section,Washington, DC 20549-0102 orelectronically at [email protected].
Please contact the Credit SuisseFunds to obtain, without charge, the SAI,Annual and Semiannual Reports andother information, and to makeshareholder inquiries:
BY TELEPHONE:
800-222-8977
BY FACSIMILE:
646-354-5026
BY MAIL:
Credit Suisse TrustP.O. Box 55030Boston, MA 02205-5030
BY OVERNIGHT OR COURIER SERVICE:
Boston Financial Data Services, Inc.Attn: Credit Suisse Trust66 Brooks DriveBraintree, MA 02184
ON THE INTERNET:
www.csam.com
SEC file number:Credit Suisse Trust 811-07261
P.O. BOX 55030, BOSTON, MA 02205-5030800-222-8977 � WWW.CSAM.COM