Embed Size (px)
Citation preview

Creditor Control Rights and Resource Allocationwithin Firms∗
Nuri Ersahin Rustom M. Irani Hanh Le
April 2, 2016
Abstract
We examine the within-firm resource allocation and restructuring effects of creditorintervention and their relationship to performance gains at firms violating covenants inprivate credit agreements. By linking firms to establishment-level data from the U.S.Census Bureau, we demonstrate that covenant violations are followed by large reduc-tions in employment and more frequent establishment sales and closures. These cutsare concentrated in violating firms’ noncore business lines and unproductive establish-ments. We conclude that refocusing operations and improving productive efficiencyare important channels through which creditors enhance violating firms’ performance.
JEL Classification: G21; G31; G32; G34
Keywords: Covenant Violations; Corporate Governance; Control Rights; Creditors
∗Ersahin ([email protected]) and Irani ([email protected]) are with the College of Business at the Uni-versity of Illinois at Urbana-Champaign. Le ([email protected]) is with the University of Illinois at Chicago.For helpful comments and suggestions, we thank Viral Acharya, Heitor Almeida, Sudheer Chava, BjornImbierowicz, Stephen Karolyi, Han Kim, Philipp Schnabl, David Smith, Amir Sufi (discussant), and par-ticipants at the University of Illinois at Urbana-Champaign (College of Business) and the 2016 ChicagoFinancial Institutions Conference. We are grateful to Frank Limehouse for all his help at the Chicago Cen-sus Research Data. The research in this article was conducted while the authors were Special Sworn Statusresearchers of the U.S. Census Bureau at the Chicago Census Research Data Center. Any opinions andconclusions expressed herein are those of the authors and do not necessarily represent the views of the U.S.Census Bureau. All results have been reviewed to ensure that no confidential information is disclosed.

1 Introduction
Creditor control rights can alleviate agency problems resulting from the separation of
ownership and control (Gale and Hellwig, 1985; Townsend, 1979), as well as conflicts of
interest between the suppliers of finance to corporations (Jensen and Meckling, 1976; Smith
and Warner, 1979). While the role of creditors in corporate governance has mostly focused
on contracting or bankruptcy states, recent research highlights their influence over firms’
daily operations, particularly at firms violating financial covenants.1 Strikingly, the actions
creditors take to protect their own claims benefit the shareholders of violator firms through
improvements in operating performance (Nini et al., 2009, 2012).2,3
The shift of control rights associated with covenant violations put creditors in a strong
position to intervene in management. While violations give creditors the right to accelerate
repayment and cancel credit lines—potentially forcing the borrower into bankruptcy—they
prefer to renegotiate contract terms.4 This often results in the introduction of additional
restrictions on capital budgeting decisions, such as limits on free cash flow and capital ex-
penditures (Beneish and Press, 1993; Chen and Wei, 1993; Nini et al., 2009). Creditors may
also pressure violating firms to make operational changes through discussions with manage-
ment (Nini et al., 2012), influence over the board of directors (Kaplan and Minton, 1994;
1Debt contracts frequently separate cash flow rights from control rights through the inclusion ofcovenants. Covenant violations allow for a shift of control rights to creditors after poor performance inorder to correctly incentivize managers or prevent managers from expropriating wealth from creditors onbehalf of shareholders. Violations of covenants are ideally suited to study the corporate governance role ofcreditors outside of bankruptcy, since they occur frequently yet seldom lead to default (e.g., Roberts andSufi, 2009a).
2These authors show a turnaround in cash flow of about 5 percent of lagged assets in the months followingthe violation. Firms also experience an increase in stock market valuations of roughly 5 percent. See Figures7, 8, and 9 of Nini et al. (2012), as well as Nini et al. (2009) and Chakraborty et al. (2015).
3Transferring control rights to creditors when the firm is performing poorly is optimal because creditors’concave payoff structure gives them sharp incentives to monitor the firm (e.g., Aghion and Bolton, 1992;Dewatripont and Tirole, 1994). This theoretical work provides an explanation of why it may be ex anteoptimal to transfer the governance role from shareholders to creditors following covenant violations, andhow this can lead to improvements in market valuations.
4Maintaining a relationship with the borrower as a going concern may be valuable to the bank due toreputation costs of default (Gopalan et al., 2011) or cross-selling opportunities (Bharath et al., 2007).
1

Kroszner and Strahan, 2001), and their role in the takeover market (Ivashina et al., 2008). To
the extent that managers engage in value-reducing activities such as over-investment, debt
covenants and creditor influence can alleviate such behavior and improve performance.5
In this paper, we shed light on the precise channels driving the improvements following
covenant violations. Our key innovation is to incorporate comprehensive establishment-
level data from the U.S. Census Bureau (henceforth, Census). These data provide us with
disaggregated information on the internal organization of firms, permitting new analysis
of the within-firm reallocation and restructuring activities surrounding covenant violations.
Our empirical tests allow us to answer the following questions: What operational changes
does creditor interventions bring about in violating firms and establishments? How do these
changes impact the operating performance of the firm?
We analyze a sample of covenant violations disclosed to the Securities and Exchange
Commission (SEC) covering the universe of publicly-traded U.S. nonfinancial corporations.6
We adapt the “quasi-discontinuity” research design of Roberts and Sufi (2009a) to the Census
data by linking each firm to its constituent establishments over time. To measure resource
allocation we focus primarily on employment and establishment sales and closures, given
the high quality and coverage of the Census data.7 We estimate the dynamic impact of
covenant violations at both the firm and establishment levels by comparing changes in be-
havior before and after violations between violators and non-violators. We control flexibly
for performance metrics used in financial contracts, thus identifying the impact of a violation
5The existing literature emphasizes three classes of managerial preferences as potential causes of share-holder value-reducing behavior. First, managers might prefer the “quiet-life” and exert too little costly effort(Bertrand et al., 2004; Grossman and Hart, 1983). Second, managers might undertake inefficient “empirebuilding” activities yielding private benefits (Baumol, 1959; Marris, 1964; Williamson, 1964). Third, dueto career concerns or risk aversion managers may have incentives to “play it safe” (Amihud and Lev, 1981;Gormley and Matsa, 2015; Holmstrom, 1999; Jensen and Meckling, 1976). See Shleifer and Vishny (1997)for an extensive survey.
6We thank Nini et al. (2012) for making these data publicly available.7A growing literature argues that the employment effects of financing frictions are interesting in their
own right (Agrawal and Matsa, 2013; Falato and Liang, 2015; Hanka, 1998; Pagano, 2010).
2
off the discontinuity occurring at the threshold. We complement this approach with a regres-
sion discontinuity design (RDD) based on covenant threshold levels from loan contracts at
the time of origination, and thus imputed rather than actual violations (Chava and Roberts,
2008).
We first provide evidence of a significant impact of covenant violations on firm-level
outcomes, including large reductions in total employment and labor costs, and a greater
frequency of establishment sales and closures. The magnitude of these effects are large: for
example, we find a typical firm reduces the number of employees by roughly 5 percentage
points following a violation (about 12.5 percent of its unconditional standard deviation).
We show these results survive numerous robustness tests, including alternative measures of
resource allocation and covenant violations, the RDD approach, and placebo tests concern-
ing the timing of violations. We also demonstrate these employment effects are pronounced
for firms receiving contractual restrictions in renegotiated contracts (Nini et al., 2009), sug-
gesting these changes are creditor-driven as opposed to voluntary actions on the part of
borrowers.
To uncover the channels through which creditor interventions improve operating perfor-
mance, we turn to the establishment-level data and investigate within-firm resource allo-
cation and restructuring activities. Our analysis focuses on two important establishment
attributes motivated by the literature on inefficient resource allocation within conglomerate
firms: first, establishment productivity (Rajan et al., 2000; Scharfstein and Stein, 2000);
and, second, whether an establishment operates in a core or peripheral industry of a firm
(e.g., Lang and Stulz, 1994).
Two important results emerge. First, using several classifications of establishments into
core and peripheral industries, we find resources are withdrawn to a greater extent from
establishments operating in peripheral industries. In particular, violating firms lay off more
employees at continuing peripheral establishments and, along the extensive margin, divest
3

them more often, as compared to establishments in the core industry focus. This finding
indicates that increasing the focus of firms’ operations following covenant violations could
be an important channel through which creditors improve operating performance (John and
Ofek, 1995; Schoar, 2002).
Second, following covenant violations, firms’ operations retrench from relatively unpro-
ductive establishments. To establish this result, we focus on the set of manufacturing firms
for which the Census provides highly-detailed information on factor inputs and output. This
richness enables us to construct an array of establishment-level productivity measures both
parametrically and non-parametrically. We find evidence that violating firms cut employ-
ment and investment and close down more frequently at those establishments characterized
by low total factor productivity. This result extends to individual labor and capital factor
productivities and violating firms’ decisions to withdraw employment and investment, re-
spectively. Thus, the withdrawal of resources from and disposal of relatively unproductive
establishments appears to be a plausible second underlying channel through which creditors
enhance firms’ performance.
Our findings are related to at least two strands of the corporate finance literature. First,
we contribute to recent literature on creditor control rights and corporate governance. Build-
ing on theoretical work analyzing optimal debt contracting in the presence of agency problems
(e.g., Aghion and Bolton, 1992; Dewatripont and Tirole, 1994; Jensen and Meckling, 1976),
Nini et al. (2012), among others, argue for a more active role for creditors in corporate gover-
nance outside the contracting and bankruptcy states.8 They argue that, following covenant
violations, creditors have the power to influence the daily operations of firms and show that
creditor interventions improve operating performance and firm value. Our micro-evidence
complements their work by showing improvements in operating performance are driven, at
8There are a number of studies that emphasize creditor control in debt restructuring when borrowers arefinancially distressed (Gilson, 1990; Gilson et al., 1990; James, 1995, 1996; Wruck, 1990), including modernevidence on the role of non-bank lenders (Ivashina et al., 2015; Jiang et al., 2012).
4

least in part, by a reallocation of resources towards relatively productive establishments, as
well as those in core business lines. These sources of efficiency gains are similar in nature to
those associated with major equity-centered governance turnarounds including takeovers (Li,
2013; Maksimovic et al., 2011), private equity transactions (Davis et al., 2014), and hedge
fund activist interventions (Brav et al., 2015).
Second, we contribute to the applied financial contracting literature on the effects of
covenant violations on firm behavior.9 Violations are followed by significant changes in
investment (Chava and Roberts, 2008; Nini et al., 2009), capital structure (Roberts and
Sufi, 2009a), payout policy, and CEO turnover (Nini et al., 2012; Ozelge and Saunders,
2012). In contemporaneous work, Falato and Liang (2015) document a similar relation
between covenant violations and firm-level employment outcomes based on hand-collected
announcements from major news sources and self-reported employment data from Standard
& Poor’s Compustat (henceforth, Compustat). We complement their findings in at least
two ways. First, we consider a comprehensive set of employment variables derived from the
Census data. These data are based on administrative data (from the U.S. Internal Revenue
Service) and thus highly accurate and cover a larger sample of firms. Second, these data are
also reported at the establishment-level, allowing us to conduct the most granular evidence
to-date on the within-firm resource allocation and restructuring effects of covenant violations,
including the effects on employment, investment, and asset disposals, as well as how these
decisions depend on establishment attributes. Most importantly, we are able to relate these
within-firm resource allocation outcomes to the efficiency gains at firms violating covenants.
The rest of this paper is organized as follows. Section 2 presents the data and method-
ology. Section 3 provides our firm and establishment-level results. Section 4 concludes.
9For a survey, see Roberts and Sufi (2009b).
5

2 Data and Empirical Methodology
2.1 Data Sources
In this section, we describe the main sources of data in our analysis and how they
are merged. These data provide information on firms’ accounting variables, disaggregated
establishment-level activities, and financial covenant violations in credit agreements.
Our firm-level data comes from Compustat. This database contains balance sheet and
income statement data for publicly-traded U.S. corporations, which are the focus of this
study. We gather a large number of standard accounting variables primarily to be used as
control variables in our analysis. Our sample covers the period from 1996 to 2009. Following
Nini et al. (2012), for a firm-year to be included in the sample, we require non-missing data
on total assets, total sales, common shares outstanding, and closing share price. We exclude
(financial) firms with Standard Industrial Classification (SIC) codes between 6000 and 6999,
as well as firms with book value of assets less than $10 million.
We use three establishment-level datasets provided by the Census. First, the Longitudinal
Business Database (LBD), which tracks all business establishments in the United States with
at least one paid employee on an annual basis. It provides longitudinal identifiers as well as
information on number of employees, payroll, geographical location, and industry for each
establishment. The LBD also provides information on corporate affiliation, which allows us
to identify establishment ownership changes and closures.
The Census of Manufacturers (CMF) and Annual Survey of Manufacturers (ASM) pro-
vide greater detail on activities for the subset of manufacturing establishments (SIC codes
between 3000 and 3999). The CMF is a survey conducted every five years (years ending 2
and 7) and consists of all manufacturing establishments in the United States with at least
one paid employee. The ASM is another survey conducted in non-census years (i.e., when the
CMF is not conducted) for a subset of these manufacturing establishments. This includes
6

all establishments with greater than 250 employees and some with fewer employees, which
are selected with a probability positively correlated with size. Reporting for both of these
surveys are mandatory and misreporting is penalized, so the data is of the highest quality.
Both the CMF and ASM include information on industry, corporate affiliation, output (to-
tal value of shipments), employment, capital expenditures, and on material inputs of each
establishment. The level of detail of these manufacturing datasets helps us construct various
measures of productivity for each manufacturing establishment.
We use the longitudinal identifiers in LBD to merge the CMF and ASM. We then use
the Compustat-SSEL bridge maintained by the Census to match each firm in Compustat to
the establishments that comprise its operations. The Compustat-SSEL bridge ends in 2005,
so we extend the match to 2009 using employer characteristics including name, address and
employer identification number.
Our primary data on financial covenant violations is provided online by Nini et al.
(2012).10 This is a quarterly dataset that contains an indicator variable defining whether
each firm-quarter in Compustat has violated a financial covenant. All companies with regis-
tered securities are required to disclose loan covenant violations in quarterly filings with the
SEC under Regulation S-X (Beneish and Press, 1993; Roberts and Sufi, 2009a). The authors
use a combination of textual analysis and hand collection to carefully identify firms reporting
a covenant violation.11 This dataset begins in 1996—the first year in which electronic filing
became mandatory with the SEC—and ends in 2009, which explains our choice of sample
window for this study.
10These authors provide an excellent description of covenants in corporate credit agreements. They arguethat covenants, while common in most debt contracts, tend to be most frequently used and most oftenbinding in private bank loan agreements (see also, Taylor and Sansone, 2007). For brevity, we do not repeatmany of these details nor provide specific examples of violations from SEC filings in this paper.
11After hand-correcting for false positive outcomes of their text search algorithm, Nini et al. (2012) reporttheir approach captures about 90 percent of actual reported violations. Note also that 2 percent of Compustatfirm-quarters could not be matched to an SEC filing and are dropped, since it cannot be determined if thefirm violated a covenant.
7

In robustness tests, we use alternative measures of covenant violations based on loan
contract terms at-origination from Reuters’ Loan Pricing Corporation’s Dealscan database
(henceforth, Dealscan) following Chava and Roberts (2008). Dealscan provides a large sam-
ple of loan contracts, including detailed information on maintenance covenants based on
accounting ratios, that we match to Compustat.12 We assume firms are bound by a given
covenant threshold as stated at origination until the loan matures and take the tightest
covenant at a given point in time.13 In these tests, we restrict the sample merged to Com-
pustat to firms having either net worth or current ratio covenants during the time period
from 1996 until 2009. We focus on these covenants for two main reasons. First, Roberts and
Sufi (2009a) show that more than 95 percent of loan contracts include at least one finan-
cial covenant, with the net worth (leverage) and current ratio covenants being among the
most common. Second, determining whether a violation has occurred or not for these two
covenants is straightforward, since the corresponding accounting variables are standard.
2.2 Variable Construction and Summary Statistics
We use two sets of dependent variables to analyze resource allocation within firms.
Broadly speaking, the first set of variables captures the intensive margin of resource al-
location (employment and investment at surviving establishments) and the second captures
the extensive margin (establishment sales and closures).
Our main dependent variable is a measure of employment, which we use to capture how
firms allocate resources. We focus primarily on employment because of the completeness of
the data provided in the LBD. In most tests, employment is measured as the annual change
12Thanks to Sudheer Chava and Michael Roberts for providing the Dealscan-Compustat link.13Two caveats apply. First, firms may have overlapping deals, i.e., the first deal matures after the start
of the second deal. Second, covenant thresholds can change over the tenure of the loan in a predeterminedmanner or, say, due to a renegotiation or refinancing of the deal. We address these challenges following Chavaand Roberts (2008) (see their Appendix B). Essentially, we assume firms are subject to a given covenantthreshold for the longest maturity of all loans in each package and take the most restrictive covenant acrosspackages (see also Falato and Liang, 2015).
8

in the natural logarithm of the number of employees. At the establishment-level, the number
of employees comes directly from the LBD. At the firm-level, the number of employees is
summed across all of the firm’s establishments.
We consider additional employment measures for robustness and also to better under-
stand the channels through which firms adjust resource allocation and potentially achieve
cost improvements (i.e., reducing labor costs through the number of employees or wages
per employee). We use four such measures based on data from the LBD. First, the annual
change in the natural logarithm of payroll. Second, the symmetric growth rate of employ-
ment, calculated by dividing the annual change in number of employees by the average of
current and lagged number of employees. This measure accommodates both entry and exit
as well as limiting the effects of extreme values (Davis et al., 1998). For the third and fourth
measures, we use the change in the number of employees and in payroll scaled by the average
of current and lagged book value of assets, respectively.
In our subsample analysis of manufacturing firms, we consider investment decisions. We
calculate investment as the annual change in establishment-level capital expenditures scaled
by the establishment-level capital stock. Establishment-level capital stock is estimated using
perpetual inventory method following Brav et al. (2015).
Establishment sale and closure decisions represent an extreme form of withdrawing re-
sources that we investigate throughout the paper. We use longitudinal establishment identi-
fiers from LBD to define, for a given firm-establishment-year, an establishment sale (closure)
indicator variable that is set equal to one if the establishment is sold (closed down) in the
following year. This is a dependent variable in the establishment-level analysis. For the
firm-level analysis, we define dependent variables “Any Establishment Sale” and “Any Es-
tablishment Closure,” which are indicator variables equal to one if the firm sells or closes
any of its establishments, respectively.
Our main independent variable is an indicator set equal to one if a firm violates a covenant
9
in the current year. These violations are considered material information and must be
disclosed in SEC filings, as described in Section 2.1. We aggregate the quarterly violation
data to the annual frequency, since this is the frequency of the Census data. In light of
this data constraint, we take a conservative approach when we measure the occurrence
of a violation. To code a firm-year as a violation, we require a violation in at least one
quarter of the current year and non-missing covenant information without any violation in
all four quarters of the previous year. Effectively, we focus on new covenant violations—those
occurring in the current but not the previous year—which represent a cleaner environment
to observe the effects of creditor influence on firm policies (e.g., Nini et al., 2012).
To complement our main approach, we also measure covenant violations based on at-
origination loan contract terms (i.e., maintenance covenant thresholds) from the Dealscan
dataset. For reasons described above, we focus on the current ratio and net worth covenants.
A covenant violation occurs in a given firm-year when the realized current or net worth ratio
falls below the threshold specified by the either covenant. As an additional robustness
test, we restrict the sample to firm-year observations within ±20 percent of either covenant
threshold and conduct a regression discontinuity analysis in the spirit of Chava and Roberts
(2008). We discuss the identification assumptions underlying this test in the next section.
We include in our regressions firm-level accounting ratios on which covenants are written
as well as variables to account for observable differences among firms that could affect em-
ployment decisions. We consider the following variables: operating cash flow, leverage ratio,
interest expense scaled by average assets, net worth over total assets, current ratio, and
market-to-book ratio. These variables are winsorized at the 1 percent and 99 percent levels
to limit the effects of outliers. In the establishment-level analysis, we further control for
establishment age, the number of establishments per firm, and the number of establishments
per three-digit industry segment of the parent firm. Precise definitions of all variables can
be found in Appendix A.
10

With our data restrictions in place, particularly the Compustat-SSEL link, we construct
a final sample containing 21,000 firm-year observations covering approximately 2,000,000
establishment-years for the period from 1996 until 2009. Table I presents summary statistics
for the full sample, as well as the subsamples of covenant violators and non-violators.14
The firm-level summary statistics are similar to Nini et al. (2012), reassuring us that sample
selection resulting from the Compustat-Census match is not a problem. This is not surprising
given the administrative nature of the Census data, i.e., it should cover the universe of
Compustat firms. New covenant violations occur in 6.3 percent of firm-year observations,
which is in line with prior research.
Comparing violators with non-violators motivates our main results and empirical ap-
proach. Notably, both at the firm and establishment levels, the change in employment is
larger for violators than for the rest of the sample. In addition, establishments belonging
to violating firms experience closures with greater frequency. However, there appear to be
significant performance differences between violators non-violators: violators have lower net
worth, current ratio, market-to-book ratio, hold less cash, and are more levered. To ensure
that our results do not simply reflect differences in these characteristics, we control flexibly
for them in our regressions and conduct a several falsification and sensitivity tests.
Finally, it is worthwhile noting the differences between the LBD establishments (Panel
B) and subsample of manufacturing establishments from the CMF and ASM (Panel C). The
rate of covenant violations is about the same for manufacturing (0.048) compared to all other
establishments (0.041). Where manufacturing firms differ is that they tend to own fewer and
older establishments. We control for these differences throughout our establishment-level
analysis, including Section 3.2.2 where we focus on manufacturing firms.
14To ensure anonymity, as per Census disclosure requirements, we round off the number of observationsin each table and quantile values are not reported for the summary statistics.
11

2.3 Identification and Empirical Model
Our empirical strategy adapts the “quasi-discontinuity” approach of Roberts and Sufi
(2009a) and Nini et al. (2012) to our setting. The establishment-year level of observation of
the Census data necessitates certain changes to their approach, which we now describe.
To examine the firm-level implications of covenant violations, we estimate the following
equation using OLS where the annual change in employment is given by:
∆yi,t+1 = αt + αk + β Covenant Violationit
+ γ1 Covenant Controlsit + γ2 Covenant Controlsi,t−1
+ γ3 Higher-Order Covenant Controlsit + εit, (1)
where i indexes firms, t indexes years, and k indexes industries. The unit of observation
is a firm-year. The dependent variable, ∆yi,t+1, is primarily the within-firm annual change
in the natural logarithm of the number of employees.15,16 The main independent variable,
Covenant Violationit, is an indicator variable equal to one for a new covenant violation. The
αt and αk denote year and industry (based on three-digit SIC codes) fixed effects, respectively.
The industry fixed effects control for time-invariant differences between industries and the
year fixed effects control for aggregate economic shocks.17 εit is the error term, which is
assumed to be correlated within firm and potentially heteroskedastic (Petersen, 2009).
The set of variables labeled Covenant Controlsit are included to account for variables on
which covenants are written as well as those that may have an independent effect on employ-
ment and, more broadly, resource allocation decisions. These include operating cash flow,
15Census employment variables are measured as of March 12 each year. For this reason, if a violationoccurs at first or second (third or fourth) quarters of year t, we measure the annual change in employmentfrom year t to t + 1 (t + 1 to t + 2).
16In some tests, we use an indicator variable for whether the firm closes or sells any establishments as adependent variable and formulate (1) as a probit regression model.
17In Table IA.II of the Internet Appendix, we consider a specification that includes industry by year fixedeffects.
12

leverage ratio, interest expense scaled by average assets, net worth over total assets, cur-
rent ratio, and market-to-book ratio. These variables are the most common ratios included
in financial covenants (Roberts and Sufi, 2009a), as well as predictors of firm employment
outcomes (Nickell and Wadhwani, 1991). These variables are included linearly, squared, and
cubed, as indicated by the higher-order covenant controls term, as well as their one-year lag.
The coefficient of interest, β, measures how a firm’s employment responds in percentage
point terms to a new covenant violation. If firms reduce employment to improve net cash
flows and satisfy creditors worried about the value of their claims, the coefficient β will be
strictly negative. The null hypothesis that covenant violations are irrelevant for employ-
ment (because firms can find substitute financing or creditors cannot influence operations)
corresponds to expecting that β will be zero.
The main identification challenge in the estimation of β is to separate out the effect of
violations from expected changes in resource allocation based on differences in fundamen-
tals between violators and non-violators. The quasi-discontinuity approach addresses this
challenge through a comparison of firms close to the covenant threshold by controlling flexi-
bly for continuous functions of the underlying variables—on which covenants thresholds are
contracted upon—and utilizing the discontinuous change in firm behavior occurring at the
time of a violation (Nini et al., 2012; Roberts and Sufi, 2009a). In effect, the outcomes of
violations are measured by comparing firms with similar pre-violation performance and thus
similar expected time-series path of outcomes. Specifically, we take the within-firm annual
difference in dependent variables, which sweeps out fixed differences in outcomes between vi-
olators and non-violators. We also flexibly control for contemporaneous and lagged firm-level
covenant control variables known to affect outcomes, as described above, and thus control
for pre-violation trend differences between violators and non-violators.
We complement our baseline approach with a standard RDD that incorporates the actual
13
contractual level of covenants (Chava and Roberts, 2008).18 The RDD essentially compares
firms that just violate covenants to those that closely avoid doing so. We focus on the net
worth and current ratio thresholds and define a firm-year to be in violation if the observed
accounting ratio falls below the threshold specified by the contract. Thus, the covenant
violation is a discontinuous function of the distance between the accounting ratio and the
threshold, which constitutes the basis of the RDD approach.19 We use this alternative defi-
nition of a violation in two sets of robustness tests. The first simply uses it as a substitute
independent variable in equation (1). The second restricts the sample to firm-year obser-
vations within ±20 percent of the covenant threshold. Using a narrow bandwidth around
the threshold ensures the covenant violation is close to a random event and thus unlikely to
correlate with firm characteristics. Moreover, using observations within close proximity of
the threshold addresses identification concerns that our estimates are driven by observations
far from the threshold that might differ systematically (Bakke and Whited, 2012).
Analyzing the firm-level response to covenant violations can mask important operational
changes within the firm. To better understand the channels through which creditor interven-
tions improve operating performance, we also examine establishment-level data. While firms’
establishments differ across several important dimensions, we focus on two characteristics
that have been emphasized by the literature on resource allocation within conglomerates:20
establishment productivity and whether it operates in a core or peripheral industry of a firm.
18Note that while our baseline approach does not incorporate explicit covenant thresholds, we proxy for theunobserved thresholds by including lags of the covenant control variables. In support of this approximation,Chava and Roberts (2008) show covenant violations tend to occur about two years after origination (see alsoRoberts and Sufi, 2009c)
19The RDD uses “locally” exogenous variation in violations arising from the distance to the threshold.Validity of this approach hinges on the local continuity assumption, which amounts to continuity of all factorsbesides the violation through the covenant threshold. This essentially requires that firms cannot perfectlysort themselves on one side of the threshold (Lee and Lemieux, 2010). In our context, this would require thatfirms manipulate accounting ratios to avoid violations, an outcome mitigated by the institutional features ofthe U.S. loan market (Chava and Roberts, 2008). Falato and Liang (2015) also show, in our setting, firmsare balanced in terms of observables and the net worth and current ratios are smooth through the threshold,inconsistent with manipulation.
20See Stein (2003) and Maksimovic and Phillips (2008) for surveys.
14

This analysis is based on the full sample of establishments covering all industries based on
the LBD and the subsample of manufacturing establishments based on the CMF and ASM.
In the latter sample, we will additionally be able to see which establishments experience
cutbacks on investment and use more detailed productivity measures.
To examine the effect of covenant violations on resource allocation across establishments
within the same firm, we estimate a modified version of equation (1) using OLS following
Giroud and Mueller (2015):
∆yij,t+1 = αt + αk + β1 Covenant Violationit × Yesjt + β2 Covenant Violationit × Nojt
+ γ1 Establishment Controlsjt + γ2 Covenant Controlsit
+ γ2 Covenant Controlsi,t−1 + γ3 Higher Order Covenant Controlsit + εijt, (2)
where i, j, k, and t index for firms, establishments, industries, and years, respectively. The
unit of observation is an establishment-year. The dependent variable, ∆yij,t+1, is the within-
establishment annual change in resource allocation. Depending on the data source, this could
be employment, investment, or establishment sales or closures.21 The main independent vari-
able, Covenant Violationit, is an indicator variable equal to one if an establishment’s owner
firm violates a covenant. The indicator variable Yesjt (Nojt) are set equal to one (zero) if
the attribute under consideration is satisfied (not satisfied) by a given establishment at the
beginning of year t. The set of variables labeled Establishment Controlsjt include estab-
lishment age, the number of establishments per firm, and the number of establishments per
segment. We continue to cluster standard errors at the firm level to account for dependence
across establishments of the same firm.
The coefficients of interest are β1, which captures the effect on the establishments with
the attribute of interest, and β2 which captures the effect on other establishments within the
21In the case of establishment sales and closures, as before, we formulate (2) as a probit regression model.
15

same firm. If firms reduce employment uniformly across establishments then the coefficients
β1 and β2 will both be negative and statistically indistinguishable. On the other hand, if
β2 is smaller than β1 then the firm cuts employment more at establishments not satisfying
the criterion (e.g., non-core or unproductive). The null hypothesis that covenant violations
are irrelevant for establishment-level employment decisions, which corresponds to β1 and β2
both equal to zero.
3 Empirical Results
In this section, we first document the impact of covenant violations on employment
outcomes and establishment sales and closures at the firm-level (Section 3.1). In Section 3.2,
we analyze the performance-enhancing steps managers take to reallocate resources across
establishments in response to creditor discipline.
3.1 Covenant Violations and Firm-Level Employment
Table II shows the firm-level effect of new covenant violations on the employment out-
comes of violators and other firms.
Column [1] presents results from estimation of equation (1) with only industry and year
fixed effects. We see that the coefficient of interest on Covenant Violationit, β, is -0.063 and
it is statistically significant at 1 percent confidence level. The direction of this estimate is
consistent with our expectation that following covenant violations firms lay off employees to
improve net cash flows and satisfy creditors’ concerns. In terms of economic magnitudes, the
estimate implies that a typical covenant violation is associated with a 6.3 percentage point
decrease in the number of employees, which constitutes about 15.7 percent of its standard
deviation (0.401) among the full sample of firms.
Column [2] adds covenant control variables: operating cash flow, leverage, interest ex-
16

pense, net worth, current ratio, and market-to-book ratio. As expected, their inclusion lowers
the estimated coefficient of interest as the comparison group has similar (weak) performance
to violating firms. The point estimate drops to -0.042, remains significant at the 1 percent
confidence level, and continues to be large in economic terms. Column [3] further includes
lagged covenant controls to control for pre-violation trend differences between violators and
non-violators. The coefficient of interest remains essentially the same in terms of size and
statistical significance.
Column [4] augments the specification with the covenant controls both squared and
raised to the third power. The inclusion of these higher-order terms allows us to control
more flexibly for the firm fundamentals, on which covenants are written, and exploit the
discontinuous change in employment at the time of violation. The inclusion of these controls
make little difference to the estimate of β, which is -0.040 and still significant at the 1 percent
confidence level.
Next, we consider alternative measures of employment based on data from the LBD.
These results serve as both robustness checks and provide further information on the dy-
namics of employment following covenant violations. Furthermore, this analysis allows us to
better understand how firms improve operating performance through cost cutting (i.e., re-
ducing labor costs through the number of employees or wages per employee). Table III shows
the results of re-estimating equation (1) with the alternative dependent variables described
below.
Column [1] uses the annual change in the natural logarithm of payroll as a dependent
variable. Payroll is the total amount of wages and salaries given to employees summed
across a firm’s establishments. We see that covenant violations result in a 2.7 percentage
point reduction in wages and salaries paid to employees.
Columns [2] and [3] verify that our results are not an artifact of log-transforming our
dependent variables. We instead scale the annual change in number of employees and payroll
17
by average assets. Column [4] considers the symmetric growth rate of employment to address
outliers and potential extensive margin effects (Davis et al., 1998). Each column gives
results consistent with our findings so far: violations result in statistically and economically
significant drops in number of employees and the wage bill.
Overall, the micro-estimates provided in this section suggest loan covenant violations have
an economically large and statistically robust impact on firm-level employment. Our baseline
estimates indicate a cut in the number of employees among violating firms on the order of 4
to 6 percentage points relative to non-violators. Given the frequent occurrence of covenant
violations and contract renegotiations (Roberts and Sufi, 2009c), these estimates suggest that
creditor interventions might be an important determinant of employment outcomes. Our
findings line up quite well with existing estimates from the literature relying on other data
sources (e.g., hand-collected layoff announcements, as in Falato and Liang, 2015). Finally,
our estimates are quite reasonable in magnitude when compared with less frequent, more
severe financial distress events such as bond defaults and bankruptcy filings, which show
layoffs of 27 percent and 50 percent, respectively (Agrawal and Matsa, 2013; Hotchkiss,
1995).
3.1.1 Establishment Sales and Closures
We next examine whether covenant violations lead firms to withdraw resources on a
larger scale through selling or closing establishments. We initially study this decision at the
firm-level and, in Section 3.2, we examine the establishment-level sale and closure decision
within the same firm and how it depends on various establishment attributes.
We identify sales and closures through establishment longitudinal identifiers in LBD,
which indicate whether an establishment changes ownership or is closed. We define a firm-
level variable, Any Establishment Salei,t+1 to be equal to one if a firm sells any establishment
from year t to t + 1 and zero otherwise. An establishment closure variable is defined anal-
18

ogously. We then estimate a probit regression model variant of equation (1) with these
measures as dependent variables to examine the influence of creditors on firms’ establish-
ment and sale decisions. Table IV presents the results.
We start first with establishment sales. Column [1] shows a positive relation between
covenant violations and the likelihood of subsequent establishment sales. In columns [2] to
[4], we include covenant control variables along the lines of Table II. The point estimate is
about 0.100 and significant at at least the 10 percent confidence level. In economic terms, a
violation increases the probability of a sale by 32 percent of its standard deviation (0.315).
Columns [5] to [8] examine the firm-level probability of establishment closures. Consistent
with the evidence on sales, firms violating covenants experience a positive and economically
large increase in the probability of a closure relative to non-violators. The point estimate is
statistically significant at at least the 10 percent level, once we include covenant controls.
These results highlight the important role of creditors for establishment sales and closures,
complementing recent work examining the effects of shocks to productivity and demand
(Maksimovic and Phillips, 2002; Yang, 2008), as well as outcomes following mergers and
acquisitions (Maksimovic et al., 2011), and large equity holders (Brav et al., 2015; Davis
et al., 2014).
3.1.2 Further Supportive Evidence
In this section, we examine the robustness of these firm-level estimates. We first consider
alternative definitions of covenant violations based on the Dealscan database of private credit
agreements. This dataset provides actual covenant threshold levels for loan contracts at the
time of origination, which allows us to implement a RDD based on imputed rather than actual
violations, albeit for a smaller sample (Chava and Roberts, 2008). We code a firm-year as
a violation whenever the current value of the accounting variables (net worth or current
ratio) is below the threshold specified in the loan contract. We continue to consider only
19

new covenant violations, meaning both accounting variables must exceed their respective
thresholds in every quarter of the prior year and all data required to compute violations
must be non-missing.
Panel A of Table V show the results of estimating equation (1) using alternative violation
definitions. Column [1] defines a violation based on the net worth and/or current ratio
thresholds. The point estimate of β is -0.061 and statistically significant at the 1 percent
level. Column [2] combines the definitions based on Dealscan and SEC filings, defining a
violation to occur whenever either accounting variable falls below its threshold or a violation
is reported to the SEC. We see that the coefficient decreases to -0.040 and remains significant
at the 1 percent level.
Columns [3], [4], and [5] revert to the violation definition based on covenant thresholds
and restricts the sample to firm-year observations within increasingly narrow intervals around
the threshold (from ±20 to ±10 percent of the threshold). Implementing the RDD with a
narrow bandwidth means the violation is more likely to be random occurrence. This mitigates
the concern that information about future investment opportunities (not measured by the
control variables) may be captured by distance to the covenant threshold. Each column
reports the results of the estimation only including contemporaneous covenant controls, as
we implement a conventional RDD here. In each case the coefficient of interest is large
and statistically significant at conventional levels. Columns [5] shows that, on average, the
number of employees decreases by 4 percentage points post-violation, which is inline with
our baseline estimates. This reassures us that we are identifying the effect of covenant
violations on employment separately from changes driven by differences in fundamentals
between violators and non-violators.
We also investigate the internal validity of our baseline results by checking for pre-existing
trends in employment between violators and non-violators. Specifically, we examine the
difference in employment outcomes between violators and non-violators in the year prior to
20

the new covenant violation. In Panel B, we mechanically shift the violation event forward
by one year to a time, by construction, that we know there was no covenant violation. The
resulting point estimate of the impact of a covenant violation on employment is small in
magnitude and statistically indistinguishable from zero. This is true for all of the measures
of employment under consideration. This contrasts with our baseline estimate and suggests
the negative effect on employment is due to the covenant violation and not some pre-existing
trend in firm behavior.
As a final robustness check, we examine a setting where we are confident that interven-
tions by creditor has taken place and therefore the sharp adjustment in employment after the
violation is unlikely to simply reflect voluntary action on the part of the borrower. To this
end, we follow Nini et al. (2009) and consider covenant violations that lead to the introduc-
tion of new capital expenditure restrictions in renegotiated loan contracts. These restrictions
usually apply to annual cash capital expenditures plus new capital leases, expressed either
in dollar terms or as a percentage of earnings or revenue. While creditors are in a position
to adjust other contract terms (maturity, collateral, rates, etc.) after the covenant viola-
tion, Nini et al. (2009) show the elasticity of capital expenditure restrictions with respect to
violations is largest in magnitude.
Data for this exercise are provided by Nini et al. (2009).22 These data contain an unbiased
sample of 3,720 private credit agreements between banks and 1,931 publicly traded U.S.
corporations pulled from SEC filings and identified at the firm-year level. About 30% of
these contracts contain capital expenditure restrictions. We focus on the intersection of
this dataset and our Compustat-LBD firm-year level sample. To better identify the effect
of creditor interventions, we compare employment before and after the signing of a credit
agreement for three groups of firms. First, firms with new contracts that do not restrict
capital expenditures. Second, firms with new contracts that contains a new restriction
22We thank these authors for making these data publicly available online.
21
and the prior contract does not contain a restriction. Third, firms receiving a contract that
contains a restriction and the prior contract already contains a capital expenditure restriction
(or we are missing the prior contract). Based on these three groups, we define two indicator
variables: New Capital Expenditure Restriction (second group) and Old Capital Expenditure
Restriction (third group). The first group of firms without any capital expenditure restriction
either before or after the renegotiation will constitute the omitted group in our regression
analysis.23
Panel C of Table V estimates the employment effects of capital expenditure restrictions
across these three groups of firms. Columns [1] controls for industry and year fixed effects
and indicates that the introduction of a new capital expenditure restriction leads to a 9
percentage point reduction in employment. This effect is statistically significant at the
1 percent level. There is no such effect for firms signing a new contract without a new
restriction. Columns [2] to [4] repeat the estimation including additional sets of controls
and the point estimate remains negative—although the magnitude reduces to -0.065 with
the full set of controls—and statistically significant at conventional levels for the new capital
expenditure restriction group only.
This last piece of evidence supports the idea that the firm employment effects documented
in this section are the outcome of creditor intervention (brought about, for example, through
contractual restrictions) as opposed to self-correcting behavior on the part of borrowers.
3.2 Internal Resource Allocation: Establishment-Level Analysis
From this point on, we analyze the effects of creditor interventions at the establishment-
level. The Census data provide information on operational changes at firms and estab-
23Table IA.I of the Internet Appendix shows the summary statistics for the full sample of matched firm-years and conditional on having an old and new capital expenditure restriction. The univariate comparisonof employment changes suggests that employment cuts are concentrated among firms receiving new capitalexpenditure restrictions.
22

lishments, allowing us to examine important aspects of within-firm restructuring activity
following financial covenant violations that have not yet been explored in previous stud-
ies. Our primary contribution is to document precisely how creditor discipline leads to
well-documented firm-level operational improvements (e.g., Nini et al., 2009, 2012).
In Section 3.2.1, we examine resource allocation at core and non-core business lines using
data from the LBD. In Section 3.2.2, using high-quality measures of productivity based on
the ASM and CMF data, we examine how the productivity of manufacturing establishments
affects resource allocation after covenant violations.
3.2.1 Establishments Operating in Core and Peripheral Business Lines
We first examine the effects of covenant violations on resource allocation among establish-
ments operating in core and peripheral business lines within the same firm. Since peripheral
business lines are outside the main scope of the firm, these activities may be less developed,
could arise from managers’ private incentives, or where management may lack experience rel-
ative to core business lines (e.g., Bertrand et al., 2004; Gompers, 1996; Gormley and Matsa,
2015; Scharfstein and Stein, 2000). Thus, withdrawing resources from these establishments
and refocusing may improve operating efficiency and decrease the risk of failure, thus im-
proving firm performance and value (Berger and Ofek, 1995; Comment and Jarrell, 1995;
John and Ofek, 1995; Lang and Stulz, 1994; Schoar, 2002).
To formally test this idea we turn to the establishment-level data from LBD. We follow
Maksimovic and Phillips (2002) and, for each firm, classify a three-digit SIC industry as core
(peripheral) if the total value of payroll constitutes more (less) than 25 percent of the firm’s
total payroll. Each establishment within the firm is characterized as core or peripheral based
on its industry classification. We then estimate our establishment-level regression model
described in equation (2), which allows for differential sensitivity among establishments
operating in the firm’s core or peripheral business lines following a new covenant violation.
23

The estimated coefficients on Violationit×Corejt and Violationit×Peripheraljt measure these
heterogeneous responses. Table VI shows the results.
In columns [1] to [4] the dependent variable is the establishment-level change in the
natural logarithm of the number of employees. In column [1], we perform the estimation
without any covenant controls and find that covenant violations result in a decrease of 10.3
percentage points in core establishments and 13.4 percent in peripheral establishments. Both
point estimates are significant at 1 percent confidence level. In column [2], we add covenant
controls and the coefficients of interest are estimated to be -0.085 and -0.135, still statistically
significant at 1 percent confidence level. Columns [3] and [4] include further controls but the
finding does not change: firms decrease employment significantly at both core and peripheral
establishments, but the effect is about fifty percent larger at peripheral establishments.24
Columns [5] and [6] report results from probit regressions where the dependent variables
are indicator variables for establishment sales and closures, respectively. In the former
case, the dependent variable is equal to one if the establishment in question is sold in the
subsequent year and zero otherwise. Here, a similar pattern emerges: the coefficients of
interest are significantly positive for both types of establishment in both regressions, but
the point estimate for peripheral establishments is roughly fifty percent larger (for example,
0.157 versus 0.264 in the case of establishment closures). Moreover, these differences are
significant at the 1 percent level based on an F-test.
Table VII further examines the robustness of these results to our classifications of core
and peripheral industries. We conduct two tests. First, in columns [1] to [3], we use finer
information on establishment industry codes to classify industries. In particular, we focus
on four-digit SIC codes and maintain the 25 percent threshold (e.g., Giroud and Mueller,
2015). In columns [4] to [6], we maintain the use of three-digit SIC codes but now adopt a
24We formally test to see whether these coefficients are statistically distinct from each other using F-tests. In each case, we find the difference between coefficients is significantly different from zero at 1 percentconfidence level.
24

50 percent payroll threshold to classify industries. For both sets of tests, we find very similar
results relative to Table VI, indicating that this finding is not an artifact of our industry
classification scheme.
Overall, these establishment-level results indicate a large withdrawal of resources from
violating firms’ operations, particularly, establishments operating in peripheral industries.
Specifically, following covenant violations, firms decrease employment more at their contin-
uing peripheral establishments and, along the extensive margin, sell and close them signifi-
cantly more often. Thus, our findings suggest that increasing the focus of firms’ operations
following covenant violations is an important channel through which creditor interventions
may improve firm performance and valuations.
3.2.2 Establishment Productivity
We next analyze the effects of covenant violations on resource allocation among produc-
tive and unproductive establishments within the same firm. If creditor discipline improves
firms’ operating performance then it is plausible that resources should be withdrawn from
less productive establishments.25
To test this idea, we use several measures of productivity based on data from both LBD for
all firms and the CMF and ASM for the subsample of manufacturers. These unique data allow
us to capture labor and capital productivity, as well as total factor productivity. We examine
the effects of covenant violations on employment, investment, and establishment sales and
closures by estimating regression model (2). Essentially, we interact Covenant Violationit
with variables indicating whether establishment j’s productivity is above (Productivejt) or
below (Unproductivejt) the median productivity of the establishments belonging to the same
three-digit SIC industry in a given year (see also, Brav et al., 2015; Davis et al., 2014). We also
25Brav et al. (2015) argue that resource allocation and restructuring based on productivity constitutesan important determinant of the value created by hedge funds. Davis et al. (2014) provide similar evidencein the context of leveraged buyouts by private equity firms.
25

examine productivity rankings within the same firm (e.g., Giroud and Mueller, 2015). Thus,
we consider establishment-level productivity both measured relative to other establishments
across firms within the same industry, as well as relative to other establishments within the
same firm.26
We first examine the importance of labor productivity using LBD data. We proxy for
establishment-level labor productivity with its average wage, measured as the ratio of payroll
to the number of employees. If labor productivity determines wages then industry-level
heterogeneity in wages is consistent with dispersion in labor productivity (see, e.g., Silva,
2013). An establishment is therefore considered productive if its average wage lies above the
median among establishments in the same industry. We estimate equation (2) allowing high
and low labor productivity establishments to display differential sensitivity of employment
to covenant violations. The dependent variable is the annual change in the natural logarithm
of an establishment’s number of employees. Table VIII shows the results.
Column [1] first shows the results without including any covenant control variables. We
find the coefficient on unproductive establishments is negative, large in magnitude, and
statistically significant at the 1 percent confidence level. In stark contrast, the estimated
effect of violations on employment at productive establishments is small and statistically
indistinguishable from zero. In columns [2] to [4] we include progressively more covenant
controls and the same pattern emerges. The coefficient on unproductive establishments, β2, is
stable across specifications ranging from -0.201 to -0.212. This indicates that establishments
with relatively low labor productivity undergo large employment cutbacks of approximately
20 percentage points relative to non-violators’ establishments. No such effect is present at
establishments with relatively high labor productivity.
Next, we focus on the subsample of manufacturing firms using data from the CMF and
26If industry production is heterogeneous in terms of capital, labor, and total factor productivity thenwithin-firm productivity rankings might be misleading, especially for firms spread across several industries.
26
ASM. These data provide detailed information on manufacturing establishments, including
output and factor inputs, allowing us to construct an array of productivity measures. We
can measure total, labor, and capital productivity several ways both parametrically and
non-parametrically, which gives us confidence that measurement error is not driving our
results.
We first use total factor productivity (TFP), which measures the difference between actual
and predicted output for a given level of inputs, to estimate establishment productivity.27
We rank establishments on the basis of their within-firm productivity ranking—productive
(unproductive) establishments fall above (below) the median of TFP of the establishments
belonging to the same firm in a given year—and consider the within-industry ranking later in
a robustness test. Given the richness of the manufacturing firm data, we examine effects of
covenant violations on establishment-level investment, in addition to employment and sales
and closures. The results of this analysis are reported in Table IX.
In columns [1] to [4], the dependent variable is the annual change in the natural loga-
rithm of the number of employees. Column [1] indicates that firms cut employment at both
productive and unproductive establishments, although the layoffs are significantly higher at
unproductive establishments. The estimated coefficients show a decrease in number of em-
ployees of 7.7 and 23.5 percentage points for productive and unproductive establishments,
respectively. As we introduce covenant controls, the estimated effect on productive establish-
ments diminishes in size and statistical significance. In column [4], with the full set of controls
in the regression, layoffs at productive establishments are indistinguishable from zero. In
contrast, unproductive establishments experience employment cuts that are large and statis-
tically significant at the 1 percent confidence level throughout. Furthermore, F-tests confirm
27We follow a well-established literature to compute TFP using Census data (e.g., Foster et al., 2014, 2008;Giroud, 2013; Schoar, 2002; Syverson, 2004). In particular, TFP is estimated as the difference between actualand predicted output, where the latter is estimated using a log-linear Cobb-Douglas production function withcapital, labor, and materials as inputs.
27

that the difference in the estimates between productive and unproductive establishments is
always statistically significant at conventional levels. Finally, notice the similarity of point
estimates in column [4] of Tables VIII and IX, which suggests these findings do not appear
to be specific to the manufacturing industry.
Columns [5] to [8] display a similar pattern for investment. We consider the investment
rate as a dependent variable, which we measure as the annual change in establishment-level
capital expenditures scaled by the establishment-level capital stock. Following covenant
violations, violating firms cut the investment rate by almost 0.020 at unproductive estab-
lishments, relative to the establishments of non-violators. There is virtually zero effect on
productive establishments.
In columns [9] and [10], we examine establishment sales and closures, respectively. We
find that firms sell and close both productive and unproductive establishments. The increase
in the probability of a sale is similar in magnitude across productive and unproductive es-
tablishments, which is confirmed by an F-test. However, the probability of being closed is
significantly higher for unproductive establishments than for productive ones. Given estab-
lishment closures occur far more frequently than sales among violators (see Table I), these
findings indicate a significant withdrawal of resources from unproductive establishments
along the extensive margin.
Having documented a strong impact of establishment productivity on resource withdrawal
following covenant violations, in Table X we examine the robustness to alternative measures
of productive efficiency.
We first examine the annual change in employment and investment, respectively, using
a within-industry (three-digit SIC code) TFP ranking of establishments. These results are
shown in columns [1] and [5]. In both cases we find a similar result as compared to using
the within-firm productivity ranking. Indeed, in column [1] we see that following a violation
firms decrease the number of employees at unproductive establishments by 17.8 percentage
28

points (significant at the 1 percent level), whereas the change in employment at productive
establishments is statistically insignificant. Column [5] reports the analogous finding for
establishment-level investment.
We consider three more refined measures of labor productivity commonly used in the
literature (e.g., Brav et al., 2015). First, in column [2], we use value-added per labor hour,
which is total value of shipments minus material and energy costs divided by total labor
hours. Second, in column [3], we use output divided by total labor hours. Finally, in column
[4], we use wage per hour. Each time we use a within-industry productivity ranking to deter-
mine which establishments are relatively productive.28 It can be seen that following covenant
violations the withdrawal of labor resources occurs most strongly at establishments with low
labor productivity. In contrast to the productive establishment interaction, the unproductive
establishment interaction is always negative, larger in magnitude, and statistically significant
at the 1 percent confidence level.
Finally, in column [6] we examine how investment following covenant violations depends
on capital productivity, proxied for by return on capital (ROC) (e.g., Giroud and Mueller,
2015). We measure ROC as total value of shipments minus labor, material, and energy
costs scaled by capital stock. Very similar results emerge: compared to the investment
rate of non-violator establishments, the investment rate decreases by 0.014 among violat-
ing firms’ establishments with below-median ROC (significant at the 1 percent level) and
indistinguishable from zero in the case of productive establishments.
In summary, our evidence presented in this section highlights the importance of establish-
ment productivity in firm decision-making following covenant violations. We find consistent
evidence that violating firms cut employment and investment at unproductive establishments
and close them down more frequently. Overall, the withdrawal of resources from and dis-
28Similar results (unreported) emerge when we use a within-firm productivity ranking combined withthese alternative measures.
29

posal of relatively unproductive establishments appear a plausible second underlying channel
through which creditors help enhance firm value.
4 Conclusion
Using establishment-level data from the U.S. Census Bureau, we provide detailed evidence
on how U.S. publicly-traded corporations adjust their operations in response to violations of
financial covenants in private credit agreements. In doing so, we uncover two plausible chan-
nels that may explain the well-documented gains in violating firms’ operating performance
and market valuations following violations (e.g., Nini et al., 2009, 2012).
We first show that covenant violations are followed by significant employment cutbacks.
A typical violating firm lays off between 4 and 6 percent of its labor force, as compared
to similar non-violating firms. Furthermore, these violating firms are more likely to divest
existing establishments both through asset sales and closures. We establish these results
using information on covenant violations reported to the SEC (Nini et al., 2012), a RDD that
exploits covenant thresholds in loan contracts (Chava and Roberts, 2008), and an analysis
of new capital expenditure restrictions in renegotiated contracts (Nini et al., 2009).
Using the granularity of the Census data, we look inside the black box of the firm and doc-
ument two robust patterns of within-firm resource allocation following covenant violations.
First, we show that firms reduce the scope of their operations by withdrawing resources
significantly more from peripheral establishments outside of the firm’s core business lines.
Second, we provide evidence that total and individual factor productivities are important de-
terminants of resource allocation. Specifically, firms violating covenants subsequently reduce
employment and capital expenditures almost entirely at unproductive establishments.
Our micro-evidence sheds light on previously unexplored channels through which cred-
itors may have a disciplining influence on firms’ day-to-day operations, well outside of
30

bankruptcy. We find the shift of control rights associated with covenant violations brings
about significant operational changes, leading firms to refocus operations in favor of produc-
tive establishments within core business lines.
Our results are consistent with a valuable delegated monitoring role of creditors. Reg-
ulatory changes in the wake of the the Great Recession and recent financial innovations
may impede the ability of lenders to perform this role. Notably, stricter capital regulation
and new liquidity requirements levied on banks increase the cost of originating and holding
corporate loans, particularly long-term loans to risky borrowers that may benefit most from
bank monitoring. In addition, the introduction of “covenant light” corporate loan contracts
with weaker covenant protection—namely, loans excluding maintenance covenants (Ivashina
and Becker, 2015)—may reduce the occurrence of covenant violations and therefore scope for
creditor intervention. Finally, relatively new credit risk transfer mechanisms such as credit
default swaps separate control rights from potential losses (Parlour and Winton, 2013), which
may weaken incentives to intervene when borrowers violate covenants (Bolton and Oehmke,
2011; Chakraborty et al., 2015).
Investigating the role of banks and other creditors in corporate governance in rapidly
evolving, modern credit markets remains an exciting area for future research.
31
References
Aghion, P., Bolton, P., 1992. An Incomplete Contracts Approach to Financial Contracting. Reviewof Economic Studies 59, 473–94.
Agrawal, A. K., Matsa, D. A., 2013. Labor Unemployment Risk and Corporate Financing Decisions.Journal of Financial Economics 108, 449–470.
Amihud, Y., Lev, B., 1981. Risk Reduction as a Managerial Motive for Conglomerate Mergers. BellJournal of Economics pp. 605–617.
Bakke, T.-E., Whited, T. M., 2012. Threshold Events and Identification: A Study of Cash Short-falls. Journal of Finance 67, 1083–1111.
Baumol, W., 1959. Business Behavior, Value and Growth. Macmillan.
Beneish, M. D., Press, E., 1993. Costs of Technical Violation of Accounting-Based Debt Covenants.Accounting Review pp. 233–257.
Berger, P. G., Ofek, E., 1995. Diversification’s Effect on Firm Value. Journal of Financial Economics37, 39–65.
Bertrand, M., Duflo, E., Mullainathan, S., 2004. How Much Should We Trust Differences-in-Differences Estimates? Quarterly Journal of Economics pp. 249–275.
Bharath, S., Dahiya, S., Saunders, A., Srinivasan, A., 2007. So What Do I Get? The Bank’s Viewof Lending Relationships. Journal of Financial Economics 85, 368–419.
Bolton, P., Oehmke, M., 2011. Credit Default Swaps and the Empty Creditor Problem. Review ofFinancial Studies 24, 2617–2655.
Brav, A., Jiang, W., Kim, H., 2015. The Real Effects of Hedge Fund Activism: Productivity, AssetAllocation, and Labor Outcomes. Review of Financial Studies 28, 2723–2769.
Chakraborty, I., Chava, S., Ganduri, R., 2015. Credit Default Swaps and Moral Hazard in BankLending. Working Paper, Georgia Institute of Technology.
Chava, S., Roberts, M., 2008. How Does Financing Impact Investment? The Role of DebtCovenants. Journal of Finance 63, 2085–2121.
Chen, K. C., Wei, K. J., 1993. Creditors’ Decisions to Waive Violations of Accounting-Based DebtCovenants. Accounting Review pp. 218–232.
Comment, R., Jarrell, G. A., 1995. Corporate Focus and Stock Returns. Journal of financial Eco-nomics 37, 67–87.
Davis, S. J., Haltiwanger, J., Handley, K., Jarmin, R., Lerner, J., Miranda, J., 2014. Private Equity,Jobs, and Productivity. American Economic Review 104, 3956–90.
Davis, S. J., Haltiwanger, J. C., Schuh, S., 1998. Job Creation and Destruction. MIT Press.
32

Dewatripont, M., Tirole, J., 1994. A Theory of Debt and Equity: Diversity of Securities andManager-Shareholder Congruence. Quarterly Journal of Economics 109, 1027–54.
Falato, A., Liang, J. N., 2015. Do Creditor Rights Increase Employment Risk? Evidence from LoanCovenants. Journal of Finance, Forthcoming.
Foster, L., Grim, C., Haltiwanger, J., 2014. Reallocation in the Great Recession: Cleansing or Not?Working Paper, University of Maryland.
Foster, L., Haltiwanger, J., Syverson, C., 2008. Reallocation, Firm Turnover, and Efficiency: Se-lection on Productivity or Profitability? American Economic Review 98, 394–425.
Gale, D., Hellwig, M., 1985. Incentive-Compatible Debt Contracts: The One-Period Problem.Review of Economic Studies 52, 647–63.
Gilson, S. C., 1990. Bankruptcy, Boards, Banks, and Blockholders: Evidence on Changes in Corpo-rate Ownership and Control when Firms Default. Journal of Financial Economics 27, 355–387.
Gilson, S. C., John, K., Lang, L. H., 1990. Troubled Debt Restructurings: An Empirical Study ofPrivate Reorganization of Firms in Default. Journal of Financial Economics 27, 315–353.
Giroud, X., 2013. Proximity and Investment: Evidence from Plant-Level Data. Quarterly Journalof Economics 128, 861–915.
Giroud, X., Mueller, H. M., 2015. Capital and Labor Reallocation within Firms. Journal of Finance70, 1767–1804.
Gompers, P. A., 1996. Grandstanding in the Venture Capital Industry. Journal of Financial Eco-nomics 42, 133–156.
Gopalan, R., Nanda, V., Yerramilli, V., 2011. Does Poor Performance Damage the Reputation ofFinancial Intermediaries? Evidence from the Loan Syndication Market. Journal of Finance 66,2083–2120.
Gormley, T. A., Matsa, D. A., 2015. Playing it Safe? Managerial Preferences, Risk, and AgencyConflicts. Working Paper, University of Pennsylvania.
Grossman, S. J., Hart, O. D., 1983. An Analysis of the Principal-Agent Problem. Econometrica pp.7–45.
Hanka, G., 1998. Debt and the Terms of Employment. Journal of Financial Economics 48, 245–282.
Holmstrom, B., 1999. Managerial Incentive Problems: A Dynamic Perspective. Review of EconomicStudies 66, 169–182.
Hotchkiss, E. S., 1995. Post-Bankruptcy Performance and Management Turnover. Journal of Fi-nance pp. 3–21.
Ivashina, V., Becker, B., 2015. Covenant Light Contracts and Creditor Coordination. WorkingPaper, Harvard University.
33

Ivashina, V., Iverson, B. C., Smith, D. C., 2015. The Ownership and Trading of Debt Claims inChapter 11 Restructurings. Journal of Financial Economics, Forthcoming.
Ivashina, V., Nair, V. B., Saunders, A., Massoud, N., Stover, R., 2008. Bank Debt and CorporateGovernance. Review of Financial Studies 22, 41–77.
James, C., 1995. When do banks take equity in debt restructurings? Review of Financial Studies8, 1209–1234.
James, C., 1996. Bank Debt Restructurings and the Composition of Exchange Offers in FinancialDistress. Journal of Finance 51, 711–727.
Jensen, M., Meckling, W. H., 1976. Theory of the Firm: Managerial Behavior, Agency Costs andOwnership Structure. Journal of Financial Economics 3, 305–360.
Jiang, W., Li, K., Wang, W., 2012. Hedge Funds and Chapter 11. Journal of Finance 67, 513–560.
John, K., Ofek, E., 1995. Asset Sales and Increase in Focus. Journal of Financial Economics 37,105–126.
Kaplan, S., Minton, B. A., 1994. Appointments of Outsiders to Japanese Boards: Determinantsand Implications for Managers. Journal of Financial Economics 36, 225–258.
Kroszner, R. S., Strahan, P. E., 2001. Bankers on Boards: Monitoring, Conflicts of Interest, andLender Liability. Journal of Financial Economics 62, 415 – 452.
Lang, L. H., Stulz, R. M., 1994. Tobin’s Q, Corporate Diversification, and Firm Performance.Journal of Political Economy 102, 1248–1280.
Lee, D. S., Lemieux, T., 2010. Regression Discontinuity Designs in Economics. Journal of EconomicLiterature 48, 281–355.
Li, X., 2013. Productivity, Restructuring, and the Gains from Takeovers. Journal of FinancialEconomics 109, 250–271.
Maksimovic, V., Phillips, G., 2002. Do Conglomerate Firms Allocate Resources Inefficiently AcrossIndustries? Theory and Evidence. Journal of Finance pp. 721–767.
Maksimovic, V., Phillips, G., 2008. Conglomerate Firms and Internal Capital Markets. Handbookof Empirical Corporate Finance 1, 423.
Maksimovic, V., Phillips, G., Prabhala, N. R., 2011. Post-Merger Restructuring and the Boundariesof the Firm. Journal of Financial Economics 102, 317–343.
Marris, R., 1964. The Economic Theory of “Managerial” Capitalism. Macmillan.
Nickell, S., Wadhwani, S., 1991. Employment Determination in British Industry: Investigationsusing Micro-Data. Review of Economic Studies 58, 955–969.
Nini, G., Smith, D. C., Sufi, A., 2009. Creditor Control Rights and Firm Investment Policy. Journalof Financial Economics 92, 400 – 420.
34
Nini, G., Smith, D. C., Sufi, A., 2012. Creditor Control Rights, Corporate Governance, and FirmValue. Review of Financial Studies 25, 1713–1761.
Ozelge, S., Saunders, A., 2012. The Role of Lending Banks in Forced CEO Turnovers. Journal ofMoney, Credit and Banking 44, 631–659.
Pagano, M., 2010. Labour and Finance. Clarendon Lectures in Finance, Oxford University Press.
Parlour, C. A., Winton, A., 2013. Laying Off Credit Risk: Loan Sales versus Credit Default Swaps.Journal of Financial Economics 107, 25–45.
Petersen, M. A., 2009. Estimating Standard Errors in Finance Panel Data Sets: Comparing Ap-proaches. Review of Financial Studies 22, 435–480.
Rajan, R., Servaes, H., Zingales, L., 2000. The Cost of Diversity: The Diversification Discount andInefficient Investment. Journal of Finance 55, 35–80.
Roberts, M., Sufi, A., 2009a. Control Rights and Capital Structure: An Empirical Investigation.Journal of Finance 64, 1657–1695.
Roberts, M. R., Sufi, A., 2009b. Financial Contracting: A Survey of Empirical Research and FutureDirections. Annual Review of Financial Econonomics 1, 1–20.
Roberts, M. R., Sufi, A., 2009c. Renegotiation of Financial Contracts: Evidence from Private CreditAgreements. Journal of Financial Economics 93, 159–184.
Scharfstein, D. S., Stein, J., 2000. The Dark Side of Internal Capital Markets: Divisional Rent-Seeking and Inefficient Investment. Journal of Finance 55.
Schoar, A., 2002. Effects of Corporate Diversification on Productivity. Journal of Finance 57, 2379–2403.
Shleifer, A., Vishny, R., 1997. A Survey of Corporate Governance. Journal of Finance 52, 737–83.
Silva, R., 2013. Internal Labor Markets and Investment In Conglomerates. Working Paper, LondonBusiness School.
Smith, C., Warner, J. B., 1979. On Financial Contracting: An Analysis of Bond Covenants. Journalof Financial Economics 7, 117–161.
Stein, J. C., 2003. Agency, Information and Corporate Investment. Handbook of the Economics ofFinance 1, 111–165.
Syverson, C., 2004. Market Structure and Productivity: A Concrete Example. Journal of PoliticalEconomy 112, 1181–1222.
Taylor, A., Sansone, A., 2007. The Handbook of Loan Syndications and Trading. McGraw HillProfessional.
Townsend, R., 1979. Optimal Contracts and Competitive Markets with Costly State Verification.Journal of Economic Theory 21, 265–293.
35

Williamson, O., 1964. The Economics of Discretionary Behavior: Managerial Objectives in a The-ory of the Firm. Prentice-Hall.
Wruck, K. H., 1990. Financial Distress, Reorganization, and Organizational Efficiency. Journal ofFinancial Economics 27, 419–444.
Yang, L., 2008. The Real Determinants of Asset Sales. Journal of Finance 63, 2231–2262.
36

Table ISummary Statistics
This table provides sample summary statistics. Panel A provides firm-level statistics. Panels B
and C provide establishment-level statistics. The unit of observation in Panels A and B and C,
respectively, is a firm-year and establishment-year. All variables are defined in Appendix A.
Full Sample Non-Violators Violators
N Mean Std. N Mean Std. N Mean Std.
[1] [2] [3] [4] [5] [6] [7] [8] [9]
Panel A: Firm-Level
∆Log(Employment) 21,000 -0.061 0.401 19,000 -0.002 0.399 2,000 -0.062 0.424∆Log(Payroll) 21,000 0.000 0.410 19,000 0.004 0.408 2,000 -0.047 0.431Symmetric Employment Growth 21,000 0.018 0.308 19,000 0.018 0.306 2,000 0.029 0.334∆Employees/Average Assets 21,000 9.453 47.376 19,000 9.322 48.448 2,000 11.392 26.895∆Payroll/Average Assets 21,000 0.349 2.697 19,000 0.347 2.776 2,000 0.388 0.966Any Establishment Sale 21,000 0.112 0.315 19,000 0.111 0.314 2,000 0.121 0.327Any Establishment Closure 21,000 0.472 0.499 19,000 0.471 0.499 2,000 0.486 0.500Covenant Violation 21,000 0.063 0.244 19,000 0 0 2,000 1 0Operating Cash Flow 21,000 0.075 0.246 19,000 0.077 0.250 2,000 0.050 0.174Leverage 21,000 0.256 0.456 19,000 0.252 0.466 2,000 0.315 0.280Interest Expense 21,000 0.023 0.074 19,000 0.023 0.076 2,000 0.028 0.035Net Worth 21,000 0.432 0.967 19,000 0.435 0.995 2,000 0.393 0.371Current Ratio 21,000 2.772 4.615 19,000 2.821 4.744 2,000 2.048 1.724Market-to-Book 21,000 2.029 3.170 19,000 2.063 3.255 2,000 1.533 1.305
Panel B: Establishment-Level (LBD)
∆Log(Employment) 2,000,000 -0.138 0.664 1,900,000 -0.133 0.655 100,000 -0.251 0.832Establishment Sale 2,000,000 0.000 0.008 1,900,000 0.000 0.008 100,000 0.000 0.009Establishment Closure 2,000,000 0.054 0.227 1,900,000 0.053 0.224 100,000 0.087 0.282Covenant Violation 2,000,000 0.041 0.197 1,900,000 0 0 100,000 1 0Age 2,000,000 13.021 8.811 1,900,000 13.065 8.819 100,000 11.973 8.552Establishments per Firm 20,000 93.710 356.328 20,000 93.872 357 1,000 90 347Establishments per Segment 100,000 22.003 154.284 90,000 21.913 154 3,000 24.377 162Labor Productivity 2,000,000 0.051 6.968 1,900,000 0.052 7.114 100,000 0.029 0.050
Panel C: Establishment-Level (CMF/ASM)
∆Log(Employment) 60,000 -0.206 0.827 57,000 -0.198 0.809 3,000 -0.395 1.162∆Investment Rate 60,000 -0.007 0.156 57,000 -0.007 0.155 3,000 -0.021 0.168Establishment Sale 60,000 0.000 0.012 57,000 0.000 0.011 3,000 0.001 0.029Establishment Closure 60,000 0.038 0.190 57,000 0.036 0.185 3,000 0.082 0.274Covenant Violation 60,000 0.048 0.214 57,000 0 0 3,000 1 0Age 60,000 21.584 8.711 57,000 21.633 8.707 3,000 20.394 8.720Establishments per Firm 10,000 7.427 14.091 7,000 7.654 14.412 1,000 4.337 8Establishments per Segment 20,000 2.959 4.675 20,000 2.985 4.700 1,000 2.436 4.105Total Factor Productivity 60,000 1.841 0.641 57,000 1.844 0.64 3,000 1.761 0.627Labor Productivity (Alt. 1) 60,000 115.01 284 57,000 116.691 288 3,000 74.630 119Labor Productivity (Alt. 2) 60,000 219 544 57,000 221 544 3,000 173 542Labor Productivity (Alt. 3) 60,000 0.019 0.027 57,000 0.019 0.027 3,000 0.017 0.015Return on Capital 60,000 5.233 545 57,000 5.379 557 3,000 1.706 3.766
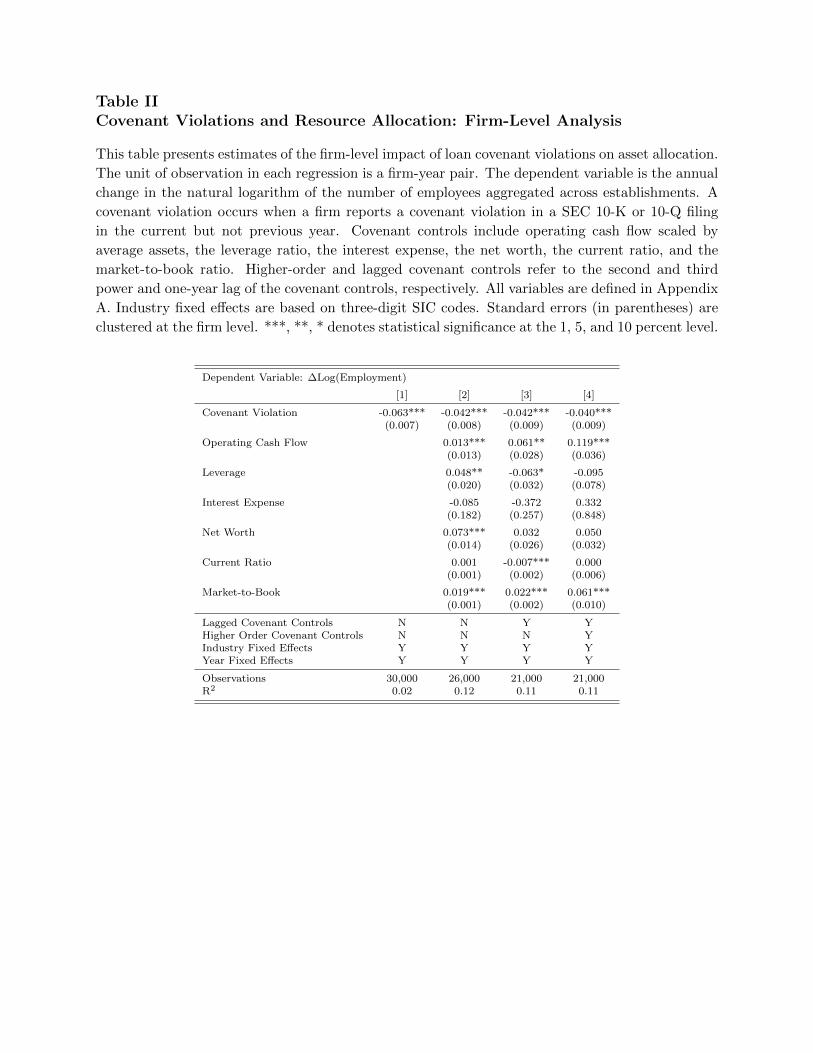
Table IICovenant Violations and Resource Allocation: Firm-Level Analysis
This table presents estimates of the firm-level impact of loan covenant violations on asset allocation.
The unit of observation in each regression is a firm-year pair. The dependent variable is the annual
change in the natural logarithm of the number of employees aggregated across establishments. A
covenant violation occurs when a firm reports a covenant violation in a SEC 10-K or 10-Q filing
in the current but not previous year. Covenant controls include operating cash flow scaled by
average assets, the leverage ratio, the interest expense, the net worth, the current ratio, and the
market-to-book ratio. Higher-order and lagged covenant controls refer to the second and third
power and one-year lag of the covenant controls, respectively. All variables are defined in Appendix
A. Industry fixed effects are based on three-digit SIC codes. Standard errors (in parentheses) are
clustered at the firm level. ***, **, * denotes statistical significance at the 1, 5, and 10 percent level.
Dependent Variable: ∆Log(Employment)
[1] [2] [3] [4]
Covenant Violation -0.063*** -0.042*** -0.042*** -0.040***(0.007) (0.008) (0.009) (0.009)
Operating Cash Flow 0.013*** 0.061** 0.119***(0.013) (0.028) (0.036)
Leverage 0.048** -0.063* -0.095(0.020) (0.032) (0.078)
Interest Expense -0.085 -0.372 0.332(0.182) (0.257) (0.848)
Net Worth 0.073*** 0.032 0.050(0.014) (0.026) (0.032)
Current Ratio 0.001 -0.007*** 0.000(0.001) (0.002) (0.006)
Market-to-Book 0.019*** 0.022*** 0.061***(0.001) (0.002) (0.010)
Lagged Covenant Controls N N Y YHigher Order Covenant Controls N N N YIndustry Fixed Effects Y Y Y YYear Fixed Effects Y Y Y Y
Observations 30,000 26,000 21,000 21,000R2 0.02 0.12 0.11 0.11
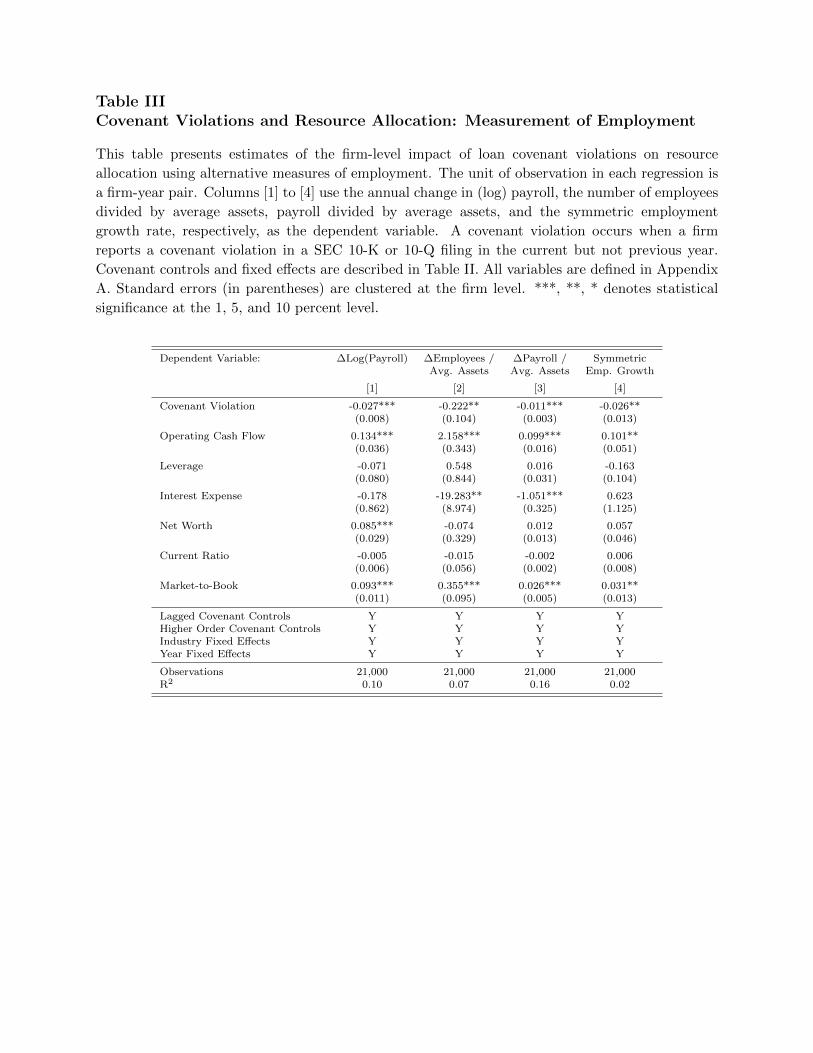
Table IIICovenant Violations and Resource Allocation: Measurement of Employment
This table presents estimates of the firm-level impact of loan covenant violations on resource
allocation using alternative measures of employment. The unit of observation in each regression is
a firm-year pair. Columns [1] to [4] use the annual change in (log) payroll, the number of employees
divided by average assets, payroll divided by average assets, and the symmetric employment
growth rate, respectively, as the dependent variable. A covenant violation occurs when a firm
reports a covenant violation in a SEC 10-K or 10-Q filing in the current but not previous year.
Covenant controls and fixed effects are described in Table II. All variables are defined in Appendix
A. Standard errors (in parentheses) are clustered at the firm level. ***, **, * denotes statistical
significance at the 1, 5, and 10 percent level.
Dependent Variable: ∆Log(Payroll) ∆Employees / ∆Payroll / SymmetricAvg. Assets Avg. Assets Emp. Growth
[1] [2] [3] [4]
Covenant Violation -0.027*** -0.222** -0.011*** -0.026**(0.008) (0.104) (0.003) (0.013)
Operating Cash Flow 0.134*** 2.158*** 0.099*** 0.101**(0.036) (0.343) (0.016) (0.051)
Leverage -0.071 0.548 0.016 -0.163(0.080) (0.844) (0.031) (0.104)
Interest Expense -0.178 -19.283** -1.051*** 0.623(0.862) (8.974) (0.325) (1.125)
Net Worth 0.085*** -0.074 0.012 0.057(0.029) (0.329) (0.013) (0.046)
Current Ratio -0.005 -0.015 -0.002 0.006(0.006) (0.056) (0.002) (0.008)
Market-to-Book 0.093*** 0.355*** 0.026*** 0.031**(0.011) (0.095) (0.005) (0.013)
Lagged Covenant Controls Y Y Y YHigher Order Covenant Controls Y Y Y YIndustry Fixed Effects Y Y Y YYear Fixed Effects Y Y Y Y
Observations 21,000 21,000 21,000 21,000R2 0.10 0.07 0.16 0.02
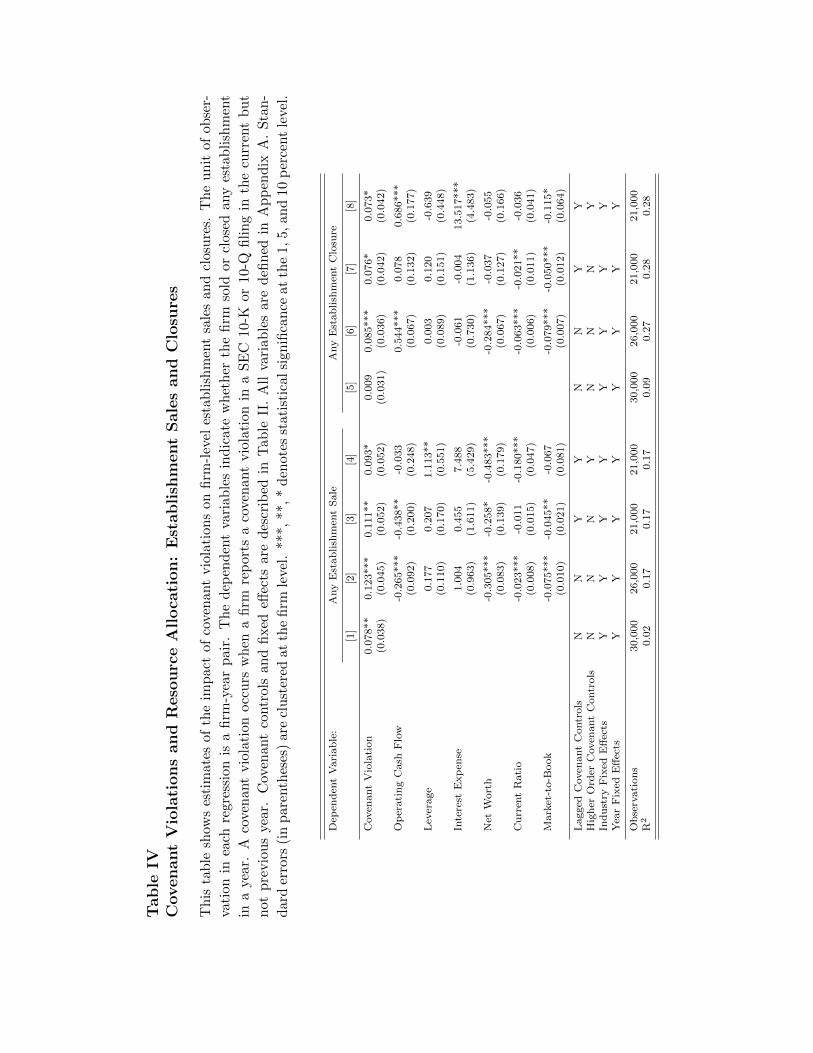
Tab
leIV
Coven
ant
Vio
lati
ons
an
dR
eso
urc
eA
lloca
tion:
Est
abli
shm
ent
Sale
sand
Clo
sure
s
Th
ista
ble
show
ses
tim
ate
sof
the
imp
act
ofco
ven
ant
vio
lati
ons
onfi
rm-l
evel
esta
bli
shm
ent
sale
san
dcl
osu
res.
Th
eu
nit
ofob
ser-
vati
on
inea
chre
gre
ssio
nis
afi
rm-y
ear
pai
r.T
he
dep
end
ent
vari
able
sin
dic
ate
wh
eth
erth
efi
rmso
ldor
clos
edan
yes
tab
lish
men
t
ina
yea
r.A
cove
nant
vio
lati
on
occ
urs
wh
ena
firm
rep
orts
aco
ven
ant
vio
lati
onin
aS
EC
10-K
or10
-Qfi
lin
gin
the
curr
ent
bu
t
not
pre
vio
us
year
.C
oven
ant
contr
ols
and
fixed
effec
tsar
ed
escr
ibed
inT
able
II.
All
vari
able
sar
ed
efin
edin
Ap
pen
dix
A.
Sta
n-
dard
erro
rs(i
np
are
nth
eses
)are
clu
ster
edat
the
firm
level
.**
*,**
,*
den
otes
stat
isti
calsi
gnifi
can
ceat
the
1,5,
and
10p
erce
nt
leve
l.
Dep
end
ent
Vari
ab
le:
Any
Est
ab
lish
men
tS
ale
Any
Est
ab
lish
men
tC
losu
re
[1]
[2]
[3]
[4]
[5]
[6]
[7]
[8]
Coven
ant
Vio
lati
on
0.0
78**
0.1
23***
0.1
11**
0.0
93*
0.0
09
0.0
85***
0.0
76*
0.0
73*
(0.0
38)
(0.0
45)
(0.0
52)
(0.0
52)
(0.0
31)
(0.0
36)
(0.0
42)
(0.0
42)
Op
erati
ng
Cash
Flo
w-0
.265***
-0.4
38**
-0.0
33
0.5
44***
0.0
78
0.6
86***
(0.0
92)
(0.2
00)
(0.2
48)
(0.0
67)
(0.1
32)
(0.1
77)
Lev
erage
0.1
77
0.2
07
1.1
13**
0.0
03
0.1
20
-0.6
39
(0.1
10)
(0.1
70)
(0.5
51)
(0.0
89)
(0.1
51)
(0.4
48)
Inte
rest
Exp
ense
1.0
04
0.4
55
7.4
88
-0.0
61
-0.0
04
13.5
17***
(0.9
63)
(1.6
11)
(5.4
29)
(0.7
30)
(1.1
36)
(4.4
83)
Net
Wort
h-0
.305***
-0.2
58*
-0.4
83***
-0.2
84***
-0.0
37
-0.0
55
(0.0
83)
(0.1
39)
(0.1
79)
(0.0
67)
(0.1
27)
(0.1
66)
Cu
rren
tR
ati
o-0
.023***
-0.0
11
-0.1
80***
-0.0
63***
-0.0
21**
-0.0
36
(0.0
08)
(0.0
15)
(0.0
47)
(0.0
06)
(0.0
11)
(0.0
41)
Mark
et-t
o-B
ook
-0.0
75***
-0.0
45**
-0.0
67
-0.0
79***
-0.0
50***
-0.1
15*
(0.0
10)
(0.0
21)
(0.0
81)
(0.0
07)
(0.0
12)
(0.0
64)
Lagged
Coven
ant
Contr
ols
NN
YY
NN
YY
Hig
her
Ord
erC
oven
ant
Contr
ols
NN
NY
NN
NY
Ind
ust
ryF
ixed
Eff
ects
YY
YY
YY
YY
Yea
rF
ixed
Eff
ects
YY
YY
YY
YY
Ob
serv
ati
on
s30,0
00
26,0
00
21,0
00
21,0
00
30,0
00
26,0
00
21,0
00
21,0
00
R2
0.0
20.1
70.1
70.1
70.0
90.2
70.2
80.2
8

Table VCovenant Violations and Resource Allocation: Robustness Checks
This table presents robustness checks for the estimates of the firm-level impact of loan covenant
violations on resource allocation. The unit of observation in each regression is a firm-year pair.
Panel A considers a threshold-based definition of covenant violations. The dependent variable is the
annual change in natural logarithm of the number of employees aggregated across establishments.
Columns [1] and [2] consider alternative covenant violation definitions based on covenants threshold
data. Column [1] defines a covenant violation to occur if either the net worth or current ratio falls
below their respective thresholds in the current but not previous year. Column [2] requires either a
reported covenant violation in a SEC 10-K or 10-Q filing or either net worth or current ratio to fall
below a threshold. Columns [3] to [5] use the covenant violation definition from [1], but restrict the
sample to firm-year observations where relevant accounting variables are within ±20, 15, and 10
percent of the covenant threshold. Panel B repeats the baseline estimation using a one-year lagged
(placebo) covenant violation. A placebo covenant violation occurs when a firm reports a covenant
violation in a SEC 10-K or 10-Q filing in the next year but not the current nor previous years.
Panel C considers the subsample of borrowers with credit agreements that contain covenants
with a direct restrictions on capital expenditure. The New Capital Expenditure Restriction
indicator variable equals one when the new contract contains a capital expenditure restriction and
the previous contract for the same borrower did not. The Old Capital Expenditure Restriction
indicator variable equals one when the new contract contains a capital expenditure restriction and
New Capital Expenditure Restriction is equal to zero. Covenant controls and fixed effects are
described in Table II. All variables are defined in Appendix A. Standard errors (in parentheses) are
clustered at the firm level. ***, **, * denotes statistical significance at the 1, 5, and 10 percent level.
Panel A: Threshold-Based Violations
Dependent Variable: ∆Log(Employment) RDD Bandwidth (Percent)
±20 ±15 ±10
[1] [2] [3] [4] [5]
Covenant Violation -0.061*** -0.040*** -0.047** -0.038* -0.040*(0.020) (0.008) (0.024) (0.021) (0.024)
Operating Cash Flow 0.317*** 0.128*** 0.237*** 0.317** 0.262**(0.090) (0.026) (0.103) (0.113) (0.123)
Leverage 0.071 -0.118* -0.115 -0.186 -0.204(0.224) (0.071) (0.109) (0.114) (0.128)
Interest Expense -3.439 0.509 0.751 0.759 1.171(2.411) (0.717) (1.001) (1.100) (1.189)
Net Worth 0.012 0.049 -0.003 -0.034 (0.039)(0.104) (0.027) (0.098) (0.100) (0.108)
Current Ratio -0.020 -0.002 -0.006 -0.010 -0.007(0.026) (0.006) (0.011) (0.010) (0.010)
Market-to-Book 0.033 0.063*** 0.039*** 0.033** 0.013(0.040) (0.009) (0.013) (0.016) (0.018)
Lagged Covenant Controls Y Y N N NHigher Order Covenant Controls Y Y N N NIndustry Fixed Effects Y Y Y Y YYear Fixed Effects Y Y Y Y Y
Observations 4,000 22,000 2,000 2,000 1,000R2 0.13 0.12 0.17 0.17 0.18

Panel B: Placebo Violations (One-Year Lag)
Dependent Variable: ∆Log(Emp.) ∆Log(Payroll) ∆Employees / ∆Payroll / SymmetricAvg. Assets Avg. Assets Emp. Growth
[1] [2] [3] [4] [5]
Covenant Violation 0.009 -0.013 -0.019 0.030 0.013(0.013) (0.013) (0.014) (0.552) (0.034)
Covenant Controls Y Y Y Y YLagged Covenant Controls Y Y Y Y YHigher Order Covenant Controls Y Y Y Y YIndustry Fixed Effects Y Y Y Y YYear Fixed Effects Y Y Y Y Y
Observations 21,000 21,000 21,000 21,000 21,000R2 0.10 0.10 0.02 0.07 0.16
Panel C: Capital Expenditure Restrictions
Dependent Variable: ∆Log(Employment)
[1] [2] [3] [4]
Old Capital Expenditure Restriction 0.012 0.018 0.022 0.022(0.015) (0.017) (0.018) (0.018)
New Capital Expenditure Restriction -0.090*** -0.070* -0.067* -0.065*(0.036) (0.036) (0.036) (0.036)
Operating Cash Flow -0.041 0.143 0.405*(0.113) (0.181) (0.232)
Leverage 0.094 -0.015 -0.067(0.077) (0.114) (0.263)
Interest Expense 0.683 1.110 2.457(0.758) (1.032) (2.544)
Net Worth 0.120** 0.127 0.108(0.061) (0.092) (0.124)
Current Ratio 0.012 0.011 -0.009(0.011) (0.011) (0.031)
Market-to-Book 0.040*** 0.050*** -0.031(0.010) (0.015) (0.045)
Lagged Covenant Controls N N Y YHigher Order Covenant Controls N N N YIndustry Fixed Effects Y Y Y YYear Fixed Effects Y Y Y Y
Observations 3,000 2,000 2,000 2,000R2 0.04 0.13 0.13 0.13
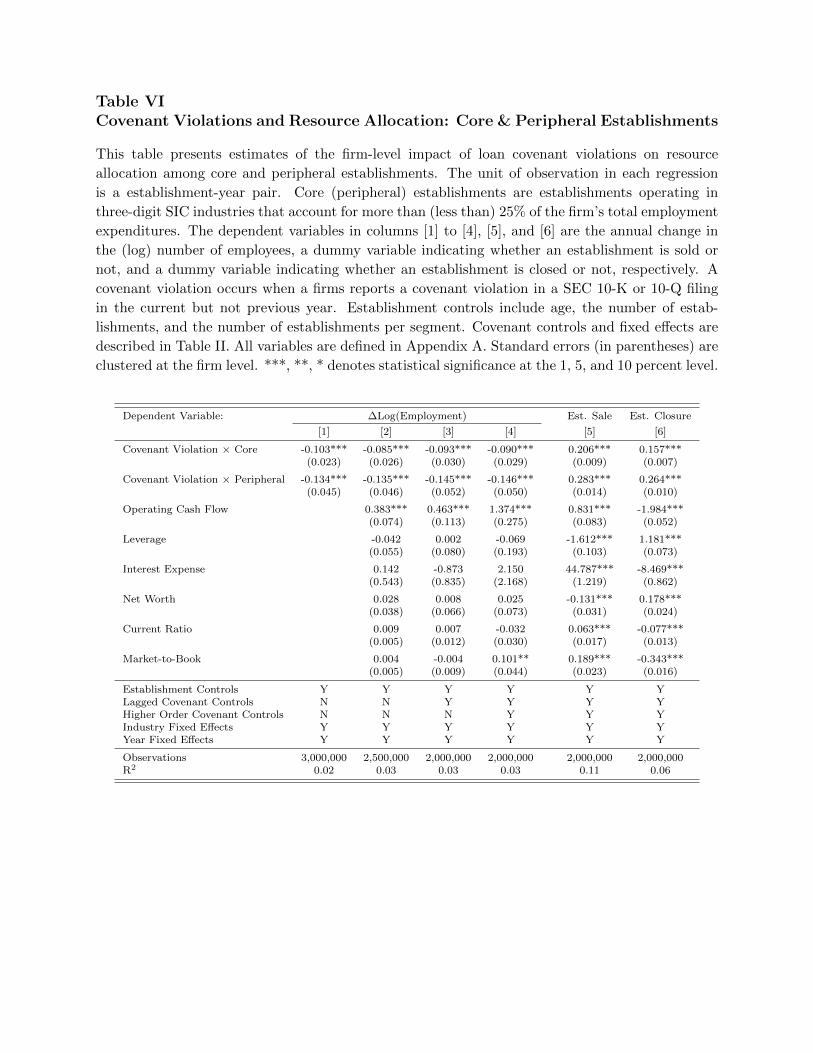
Table VICovenant Violations and Resource Allocation: Core & Peripheral Establishments
This table presents estimates of the firm-level impact of loan covenant violations on resource
allocation among core and peripheral establishments. The unit of observation in each regression
is a establishment-year pair. Core (peripheral) establishments are establishments operating in
three-digit SIC industries that account for more than (less than) 25% of the firm’s total employment
expenditures. The dependent variables in columns [1] to [4], [5], and [6] are the annual change in
the (log) number of employees, a dummy variable indicating whether an establishment is sold or
not, and a dummy variable indicating whether an establishment is closed or not, respectively. A
covenant violation occurs when a firms reports a covenant violation in a SEC 10-K or 10-Q filing
in the current but not previous year. Establishment controls include age, the number of estab-
lishments, and the number of establishments per segment. Covenant controls and fixed effects are
described in Table II. All variables are defined in Appendix A. Standard errors (in parentheses) are
clustered at the firm level. ***, **, * denotes statistical significance at the 1, 5, and 10 percent level.
Dependent Variable: ∆Log(Employment) Est. Sale Est. Closure
[1] [2] [3] [4] [5] [6]
Covenant Violation × Core -0.103*** -0.085*** -0.093*** -0.090*** 0.206*** 0.157***(0.023) (0.026) (0.030) (0.029) (0.009) (0.007)
Covenant Violation × Peripheral -0.134*** -0.135*** -0.145*** -0.146*** 0.283*** 0.264***(0.045) (0.046) (0.052) (0.050) (0.014) (0.010)
Operating Cash Flow 0.383*** 0.463*** 1.374*** 0.831*** -1.984***(0.074) (0.113) (0.275) (0.083) (0.052)
Leverage -0.042 0.002 -0.069 -1.612*** 1.181***(0.055) (0.080) (0.193) (0.103) (0.073)
Interest Expense 0.142 -0.873 2.150 44.787*** -8.469***(0.543) (0.835) (2.168) (1.219) (0.862)
Net Worth 0.028 0.008 0.025 -0.131*** 0.178***(0.038) (0.066) (0.073) (0.031) (0.024)
Current Ratio 0.009 0.007 -0.032 0.063*** -0.077***(0.005) (0.012) (0.030) (0.017) (0.013)
Market-to-Book 0.004 -0.004 0.101** 0.189*** -0.343***(0.005) (0.009) (0.044) (0.023) (0.016)
Establishment Controls Y Y Y Y Y YLagged Covenant Controls N N Y Y Y YHigher Order Covenant Controls N N N Y Y YIndustry Fixed Effects Y Y Y Y Y YYear Fixed Effects Y Y Y Y Y Y
Observations 3,000,000 2,500,000 2,000,000 2,000,000 2,000,000 2,000,000R2 0.02 0.03 0.03 0.03 0.11 0.06

Table VIICovenant Violations and Resource Allocation: Core & Peripheral Robustness
This table presents robustness checks for the estimates of the firm-level impact of loan covenant
violations on resource allocation across core and peripheral establishments using alternative
measures of core and peripheral. The unit of observation in each regression is a establishment-year
pair. Columns [1] to [3] define peripheral establishments as establishments operating in 4-digit SIC
industries accounting for less than 25% of the firm’s total employment expenditures. In columns
[4] to [6], they are establishments operating in 3-digit SIC industries that account for less than
50% of these expenditures. The dependent variables in columns [1] to [3] and [4] to [6] are annual
change in the (log) number of employees, a dummy variable indicating whether the establishment
is sold, and a dummy variable indicating whether the establishment is closed, respectively. A
covenant violation occurs when a firm reports a covenant violation in a SEC 10-K or 10-Q filing
in the current but not previous year. Establishment controls include age, the number of estab-
lishments, and the number of establishments per segment. Covenant controls and fixed effects are
described in Table II. All variables are defined in Appendix A. Standard errors (in parentheses) are
clustered at the firm level. ***, **, * denotes statistical significance at the 1, 5, and 10 percent level.
4-Digit SIC 50 Percent Cutoff
Dependent Variable: Establishment Establishment∆Log(Emp.) Sales Closures ∆Log(Emp.) Sales Closures
[1] [2] [3] [4] [5] [6]
Covenant Violation × Core -0.091*** 0.209*** 0.157*** -0.091*** 0.236*** 0.170***(0.030) (0.009) (0.007) (0.030) (0.009) (0.007)
Covenant Violation × Peripheral -0.136*** 0.262*** 0.246*** -0.131*** 0.254*** 0.357***(0.044) (0.014) (0.010) (0.044) (0.016) (0.011)
Operating Cash Flow 1.374*** 0.952*** -1.984*** 1.376*** 0.779 -2.241***(0.275) (0.083) (0.052) (0.274) (0.086) (0.053)
Leverage -0.068 -1.564*** 1.135*** -0.070 -1.842 1.006(0.193) (0.103) (0.073) (0.193) (0.105) (0.074)
Interest Expense 2.165 48.851*** -8.606*** 2.145 52.596*** -6.381***(2.168) (1.219) (0.862) (2.168) (1.258) (0.879)
Net Worth 0.023 -0.235*** 0.166*** 0.025 -0.156*** 0.121***(0.073) (0.031) (0.024) (0.073) (0.032) (0.024)
Current Ratio -0.033 0.172*** -0.079*** -0.032 0.030* -0.078(0.030) (0.017) (0.013) (0.030) (0.018) (0.013)
Market-to-Book 0.100** 0.032 -0.337*** 0.0101** 0.203** -0.339***(0.044) (0.022) (0.016) (0.044) (0.023) (0.016)
Establishment Controls Y Y Y Y Y YLagged Covenant Controls Y Y Y Y Y YHigher Order Covenant Controls Y Y Y Y Y YIndustry Fixed Effects Y Y Y Y Y YYear Fixed Effects Y Y Y Y Y Y
Observations 2,000,000 2,000,000 2,000,000 2,000,000 2,000,000 2,000,000R2 0.03 0.11 0.06 0.03 0.12 0.06
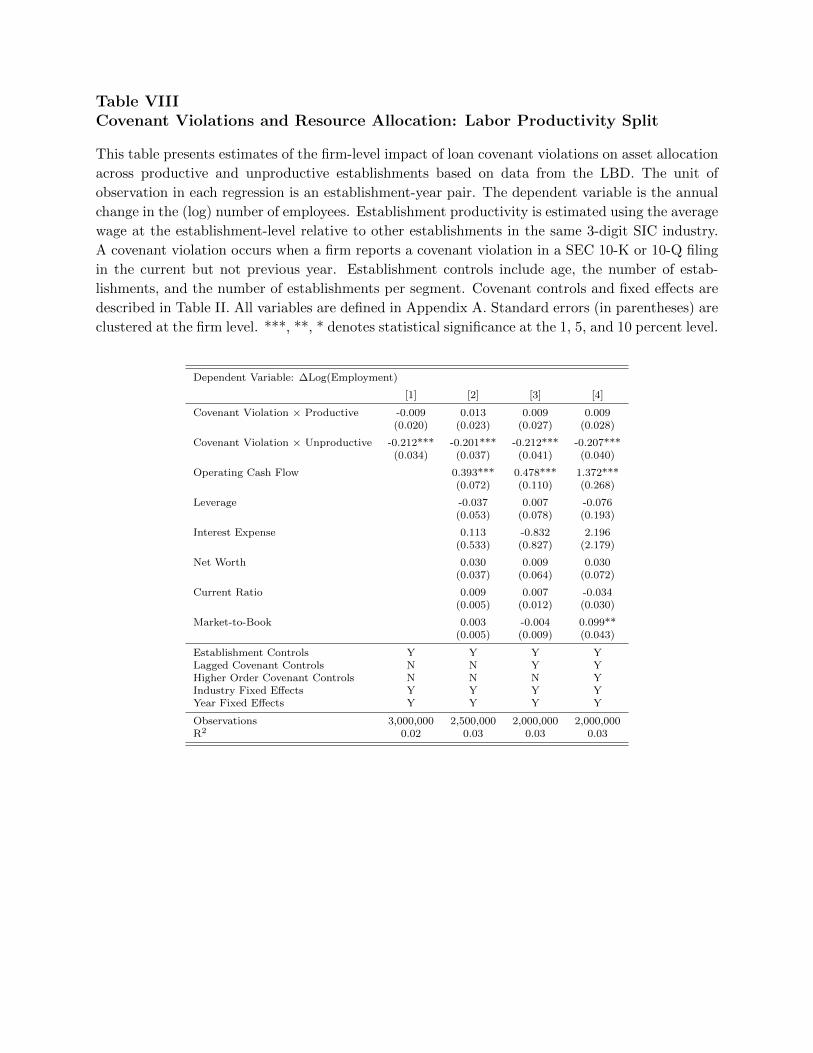
Table VIIICovenant Violations and Resource Allocation: Labor Productivity Split
This table presents estimates of the firm-level impact of loan covenant violations on asset allocation
across productive and unproductive establishments based on data from the LBD. The unit of
observation in each regression is an establishment-year pair. The dependent variable is the annual
change in the (log) number of employees. Establishment productivity is estimated using the average
wage at the establishment-level relative to other establishments in the same 3-digit SIC industry.
A covenant violation occurs when a firm reports a covenant violation in a SEC 10-K or 10-Q filing
in the current but not previous year. Establishment controls include age, the number of estab-
lishments, and the number of establishments per segment. Covenant controls and fixed effects are
described in Table II. All variables are defined in Appendix A. Standard errors (in parentheses) are
clustered at the firm level. ***, **, * denotes statistical significance at the 1, 5, and 10 percent level.
Dependent Variable: ∆Log(Employment)
[1] [2] [3] [4]
Covenant Violation × Productive -0.009 0.013 0.009 0.009(0.020) (0.023) (0.027) (0.028)
Covenant Violation × Unproductive -0.212*** -0.201*** -0.212*** -0.207***(0.034) (0.037) (0.041) (0.040)
Operating Cash Flow 0.393*** 0.478*** 1.372***(0.072) (0.110) (0.268)
Leverage -0.037 0.007 -0.076(0.053) (0.078) (0.193)
Interest Expense 0.113 -0.832 2.196(0.533) (0.827) (2.179)
Net Worth 0.030 0.009 0.030(0.037) (0.064) (0.072)
Current Ratio 0.009 0.007 -0.034(0.005) (0.012) (0.030)
Market-to-Book 0.003 -0.004 0.099**(0.005) (0.009) (0.043)
Establishment Controls Y Y Y YLagged Covenant Controls N N Y YHigher Order Covenant Controls N N N YIndustry Fixed Effects Y Y Y YYear Fixed Effects Y Y Y Y
Observations 3,000,000 2,500,000 2,000,000 2,000,000R2 0.02 0.03 0.03 0.03
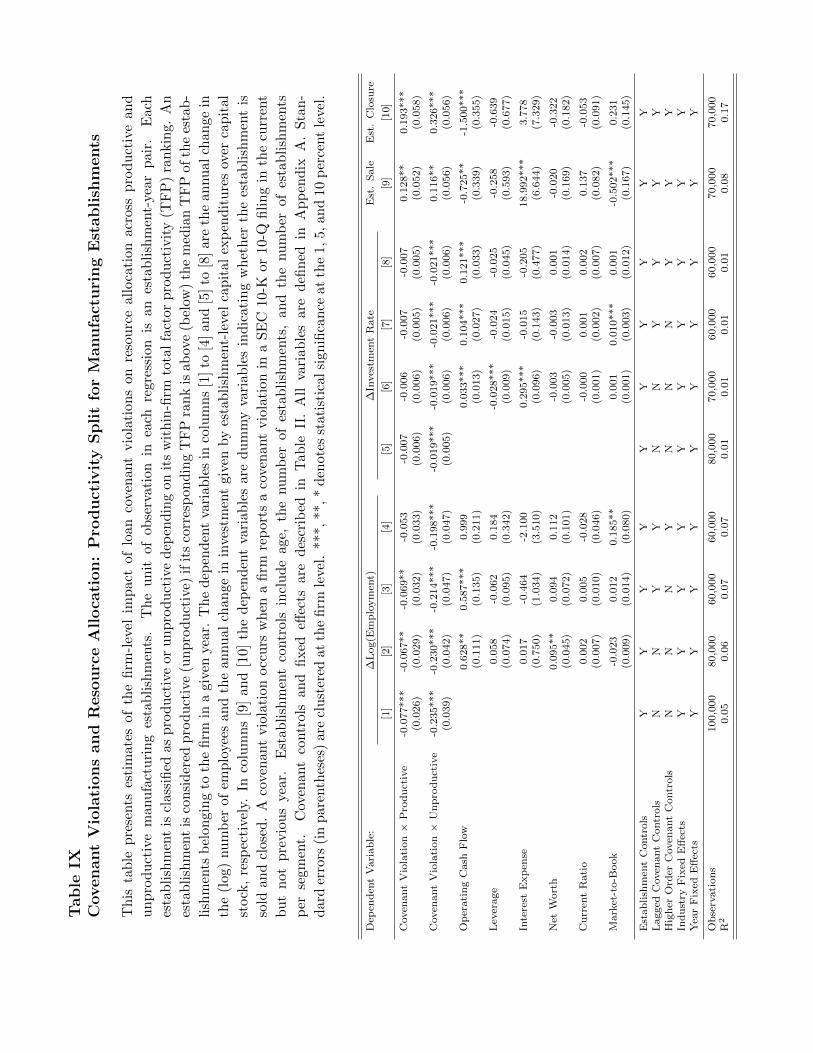
Tab
leIX
Coven
ant
Vio
lati
ons
an
dR
eso
urc
eA
lloca
tion:
Pro
duct
ivit
ySpli
tfo
rM
anufa
cturi
ng
Est
abli
shm
ents
Th
ista
ble
pre
sents
esti
mate
sof
the
firm
-lev
elim
pac
tof
loan
coven
ant
vio
lati
ons
onre
sou
rce
allo
cati
onac
ross
pro
du
ctiv
ean
d
un
pro
du
ctiv
em
anu
fact
uri
ng
esta
bli
shm
ents
.T
he
un
itof
obse
rvat
ion
inea
chre
gres
sion
isan
esta
bli
shm
ent-
year
pai
r.E
ach
esta
bli
shm
ent
iscl
ass
ified
as
pro
du
ctiv
eor
un
pro
du
ctiv
ed
epen
din
gon
its
wit
hin
-firm
tota
lfa
ctor
pro
du
ctiv
ity
(TF
P)
ran
kin
g.A
n
esta
bli
shm
ent
isco
nsi
der
edp
rod
uct
ive
(un
pro
du
ctiv
e)if
its
corr
esp
ond
ing
TF
Pra
nk
isab
ove
(bel
ow)
the
med
ian
TF
Pof
the
esta
b-
lish
men
tsb
elon
gin
gto
the
firm
ina
give
nyea
r.T
he
dep
end
ent
vari
able
sin
colu
mn
s[1
]to
[4]
and
[5]
to[8
]ar
eth
ean
nu
alch
ange
in
the
(log)
nu
mb
erof
emp
loye
esan
dth
ean
nu
alch
ange
inin
vest
men
tgi
ven
by
esta
bli
shm
ent-
leve
lca
pit
alex
pen
dit
ure
sov
erca
pit
al
stock
,re
spec
tive
ly.
Inco
lum
ns
[9]
and
[10]
the
dep
end
ent
vari
able
sar
ed
um
my
vari
able
sin
dic
atin
gw
het
her
the
esta
bli
shm
ent
is
sold
an
dcl
osed
.A
cove
nant
vio
lati
on
occ
urs
wh
ena
firm
rep
orts
aco
ven
ant
vio
lati
onin
aS
EC
10-K
or10
-Qfi
lin
gin
the
curr
ent
bu
tn
otp
revio
us
year.
Est
abli
shm
ent
contr
ols
incl
ud
eag
e,th
enu
mb
erof
esta
blish
men
ts,
and
the
nu
mb
erof
esta
bli
shm
ents
per
segm
ent.
Cov
enant
contr
ols
and
fixed
effec
tsar
ed
escr
ibed
inT
able
II.
All
vari
able
sar
ed
efin
edin
Ap
pen
dix
A.
Sta
n-
dard
erro
rs(i
np
are
nth
eses
)are
clu
ster
edat
the
firm
level
.**
*,**
,*
den
otes
stat
isti
calsi
gnifi
can
ceat
the
1,5,
and
10p
erce
nt
leve
l.
Dep
end
ent
Vari
ab
le:
∆L
og(E
mp
loym
ent)
∆In
ves
tmen
tR
ate
Est
.S
ale
Est
.C
losu
re
[1]
[2]
[3]
[4]
[5]
[6]
[7]
[8]
[9]
[10]
Coven
ant
Vio
lati
on×
Pro
du
ctiv
e-0
.077***
-0.0
67**
-0.0
69**
-0.0
53
-0.0
07
-0.0
06
-0.0
07
-0.0
07
0.1
28**
0.1
93***
(0.0
26)
(0.0
29)
(0.0
32)
(0.0
33)
(0.0
06)
(0.0
06)
(0.0
05)
(0.0
05)
(0.0
52)
(0.0
58)
Coven
ant
Vio
lati
on×
Un
pro
du
ctiv
e-0
.235***
-0.2
30***
-0.2
14***
-0.1
98***
-0.0
19***
-0.0
19***
-0.0
21***
-0.0
21***
0.1
16**
0.3
26***
(0.0
39)
(0.0
42)
(0.0
47)
(0.0
47)
(0.0
05)
(0.0
06)
(0.0
06)
(0.0
06)
(0.0
56)
(0.0
56)
Op
erati
ng
Cash
Flo
w0.6
28**
0.5
87***
0.9
99
0.0
33***
0.1
04***
0.1
21***
-0.7
25**
-1.5
00***
(0.1
11)
(0.1
35)
(0.2
11)
(0.0
13)
(0.0
27)
(0.0
33)
(0.3
39)
(0.3
55)
Lev
erage
0.0
58
-0.0
62
0.1
84
-0.0
28***
-0.0
24
-0.0
25
-0.2
58
-0.6
39
(0.0
74)
(0.0
95)
(0.3
42)
(0.0
09)
(0.0
15)
(0.0
45)
(0.5
93)
(0.6
77)
Inte
rest
Exp
ense
0.0
17
-0.4
64
-2.1
00
0.2
95***
-0.0
15
-0.2
05
18.9
92***
3.7
78
(0.7
50)
(1.0
34)
(3.5
10)
(0.0
96)
(0.1
43)
(0.4
77)
(6.6
44)
(7.3
29)
Net
Wort
h0.0
95**
0.0
94
0.1
12
-0.0
03
-0.0
03
0.0
01
-0.0
20
-0.3
22
(0.0
45)
(0.0
72)
(0.1
01)
(0.0
05)
(0.0
13)
(0.0
14)
(0.1
69)
(0.1
82)
Cu
rren
tR
ati
o0.0
02
0.0
05
-0.0
28
-0.0
00
0.0
01
0.0
02
0.1
37
-0.0
53
(0.0
07)
(0.0
10)
(0.0
46)
(0.0
01)
(0.0
02)
(0.0
07)
(0.0
82)
(0.0
91)
Mark
et-t
o-B
ook
-0.0
23
0.0
12
0.1
85**
0.0
01
0.0
10***
0.0
01
-0.5
02***
0.2
31
(0.0
09)
(0.0
14)
(0.0
80)
(0.0
01)
(0.0
03)
(0.0
12)
(0.1
67)
(0.1
45)
Est
ab
lish
men
tC
ontr
ols
YY
YY
YY
YY
YY
Lagged
Coven
ant
Contr
ols
NN
YY
NN
YY
YY
Hig
her
Ord
erC
oven
ant
Contr
ols
NN
NY
NN
NY
YY
Ind
ust
ryF
ixed
Eff
ects
YY
YY
YY
YY
YY
Yea
rF
ixed
Eff
ects
YY
YY
YY
YY
YY
Ob
serv
ati
on
s100,0
00
80,0
00
60,0
00
60,0
00
80,0
00
70,0
00
60,0
00
60,0
00
70,0
00
70,0
00
R2
0.0
50.0
60.0
70.0
70.0
10.0
10.0
10.0
10.0
80.1
7
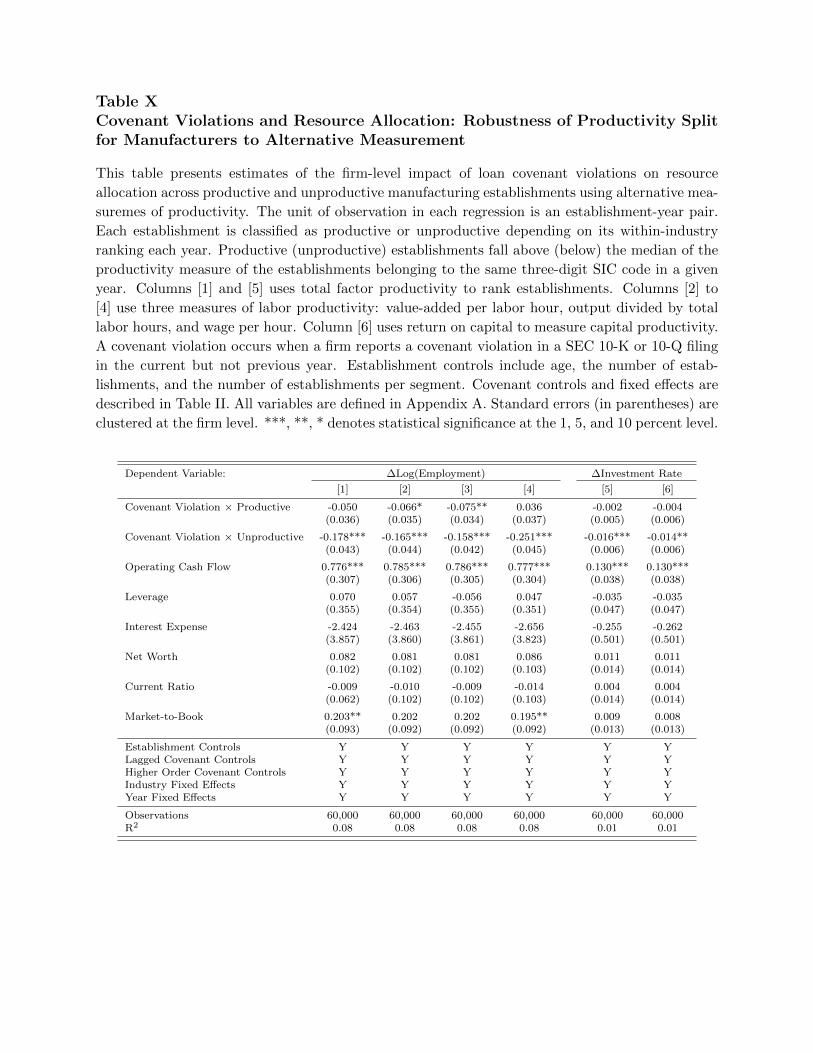
Table XCovenant Violations and Resource Allocation: Robustness of Productivity Splitfor Manufacturers to Alternative Measurement
This table presents estimates of the firm-level impact of loan covenant violations on resource
allocation across productive and unproductive manufacturing establishments using alternative mea-
suremes of productivity. The unit of observation in each regression is an establishment-year pair.
Each establishment is classified as productive or unproductive depending on its within-industry
ranking each year. Productive (unproductive) establishments fall above (below) the median of the
productivity measure of the establishments belonging to the same three-digit SIC code in a given
year. Columns [1] and [5] uses total factor productivity to rank establishments. Columns [2] to
[4] use three measures of labor productivity: value-added per labor hour, output divided by total
labor hours, and wage per hour. Column [6] uses return on capital to measure capital productivity.
A covenant violation occurs when a firm reports a covenant violation in a SEC 10-K or 10-Q filing
in the current but not previous year. Establishment controls include age, the number of estab-
lishments, and the number of establishments per segment. Covenant controls and fixed effects are
described in Table II. All variables are defined in Appendix A. Standard errors (in parentheses) are
clustered at the firm level. ***, **, * denotes statistical significance at the 1, 5, and 10 percent level.
Dependent Variable: ∆Log(Employment) ∆Investment Rate
[1] [2] [3] [4] [5] [6]
Covenant Violation × Productive -0.050 -0.066* -0.075** 0.036 -0.002 -0.004(0.036) (0.035) (0.034) (0.037) (0.005) (0.006)
Covenant Violation × Unproductive -0.178*** -0.165*** -0.158*** -0.251*** -0.016*** -0.014**(0.043) (0.044) (0.042) (0.045) (0.006) (0.006)
Operating Cash Flow 0.776*** 0.785*** 0.786*** 0.777*** 0.130*** 0.130***(0.307) (0.306) (0.305) (0.304) (0.038) (0.038)
Leverage 0.070 0.057 -0.056 0.047 -0.035 -0.035(0.355) (0.354) (0.355) (0.351) (0.047) (0.047)
Interest Expense -2.424 -2.463 -2.455 -2.656 -0.255 -0.262(3.857) (3.860) (3.861) (3.823) (0.501) (0.501)
Net Worth 0.082 0.081 0.081 0.086 0.011 0.011(0.102) (0.102) (0.102) (0.103) (0.014) (0.014)
Current Ratio -0.009 -0.010 -0.009 -0.014 0.004 0.004(0.062) (0.102) (0.102) (0.103) (0.014) (0.014)
Market-to-Book 0.203** 0.202 0.202 0.195** 0.009 0.008(0.093) (0.092) (0.092) (0.092) (0.013) (0.013)
Establishment Controls Y Y Y Y Y YLagged Covenant Controls Y Y Y Y Y YHigher Order Covenant Controls Y Y Y Y Y YIndustry Fixed Effects Y Y Y Y Y YYear Fixed Effects Y Y Y Y Y Y
Observations 60,000 60,000 60,000 60,000 60,000 60,000R2 0.08 0.08 0.08 0.08 0.01 0.01
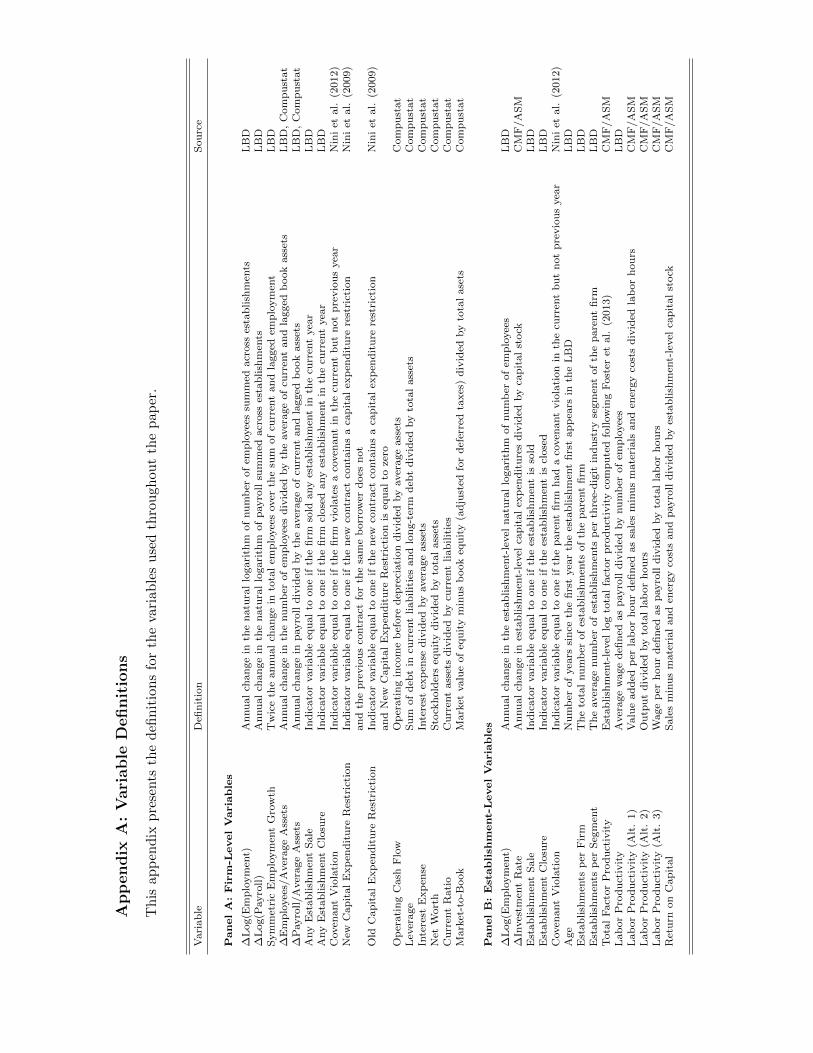
App
endix
A:
Vari
able
Definit
ions
Th
isap
pen
dix
pre
sents
the
defi
nit
ion
sfo
rth
eva
riab
les
use
dth
rou
ghou
tth
ep
aper
.
Vari
ab
leD
efin
itio
nS
ou
rce
PanelA:Firm
-LevelVariables
∆L
og(E
mp
loym
ent)
An
nu
al
change
inth
en
atu
ral
logari
thm
of
nu
mb
erof
emp
loyee
ssu
mm
edacr
oss
esta
blish
men
tsL
BD
∆L
og(P
ayro
ll)
An
nu
al
chan
ge
inth
en
atu
ral
logari
thm
of
payro
llsu
mm
edacr
oss
esta
bli
shm
ents
LB
DS
ym
met
ric
Em
plo
ym
ent
Gro
wth
Tw
ice
the
an
nu
al
chan
ge
into
tal
emp
loyee
sover
the
sum
of
curr
ent
an
dla
gged
emp
loym
ent
LB
D∆
Em
plo
yee
s/A
ver
age
Ass
ets
An
nu
al
chan
ge
inth
enu
mb
erof
emp
loyee
sd
ivid
edby
the
aver
age
of
curr
ent
an
dla
gged
book
ass
ets
LB
D,
Com
pu
stat
∆P
ayro
ll/A
ver
age
Ass
ets
An
nu
al
chan
ge
inp
ayro
lld
ivid
edby
the
aver
age
of
curr
ent
an
dla
gged
book
ass
ets
LB
D,
Com
pu
stat
Any
Est
ab
lish
men
tS
ale
Ind
icato
rvari
ab
leeq
ual
toon
eif
the
firm
sold
any
esta
blish
men
tin
the
curr
ent
yea
rL
BD
Any
Est
ab
lish
men
tC
losu
reIn
dic
ato
rvari
ab
leeq
ual
toon
eif
the
firm
close
dany
esta
blish
men
tin
the
curr
ent
yea
rL
BD
Coven
ant
Vio
lati
on
Ind
icato
rvari
ab
leeq
ual
toon
eif
the
firm
vio
late
sa
coven
ant
inth
ecu
rren
tb
ut
not
pre
vio
us
yea
rN
ini
etal.
(2012)
New
Cap
ital
Exp
end
itu
reR
estr
icti
on
Ind
icato
rvari
ab
leeq
ual
toon
eif
the
new
contr
act
conta
ins
aca
pit
al
exp
end
itu
rere
stri
ctio
nN
ini
etal.
(2009)
an
dth
ep
revio
us
contr
act
for
the
sam
eb
orr
ow
erd
oes
not
Old
Cap
ital
Exp
end
itu
reR
estr
icti
on
Ind
icato
rvari
ab
leeq
ual
toon
eif
the
new
contr
act
conta
ins
aca
pit
al
exp
end
itu
rere
stri
ctio
nN
ini
etal.
(2009)
an
dN
ewC
ap
ital
Exp
end
itu
reR
estr
icti
on
iseq
ual
toze
roO
per
ati
ng
Cash
Flo
wO
per
ati
ng
inco
me
bef
ore
dep
reci
ati
on
div
ided
by
aver
age
ass
ets
Com
pu
stat
Lev
erage
Su
mof
deb
tin
curr
ent
liab
ilit
ies
an
dlo
ng-t
erm
deb
td
ivid
edby
tota
lass
ets
Com
pu
stat
Inte
rest
Exp
ense
Inte
rest
exp
ense
div
ided
by
aver
age
ass
ets
Com
pu
stat
Net
Wort
hS
tock
hold
ers
equ
ity
div
ided
by
tota
lass
ets
Com
pu
stat
Cu
rren
tR
ati
oC
urr
ent
ass
ets
div
ided
by
curr
ent
liab
ilit
ies
Com
pu
stat
Mark
et-t
o-B
ook
Mark
etvalu
eof
equ
ity
min
us
book
equ
ity
(ad
just
edfo
rd
efer
red
taxes
)d
ivid
edby
tota
lase
tsC
om
pu
stat
PanelB:Establish
ment-LevelVariables
∆L
og(E
mp
loym
ent)
An
nu
al
chan
ge
inth
ees
tab
lish
men
t-le
vel
natu
ral
logari
thm
of
nu
mb
erof
emp
loyee
sL
BD
∆In
ves
tmen
tR
ate
An
nu
al
chan
ge
ines
tab
lish
men
t-le
vel
cap
ital
exp
end
itu
res
div
ided
by
cap
ital
stock
CM
F/A
SM
Est
ab
lish
men
tS
ale
Ind
icato
rvari
ab
leeq
ual
toon
eif
the
esta
blish
men
tis
sold
LB
DE
stab
lish
men
tC
losu
reIn
dic
ato
rvari
ab
leeq
ual
toon
eif
the
esta
blish
men
tis
close
dL
BD
Coven
ant
Vio
lati
on
Ind
icato
rvari
ab
leeq
ual
toon
eif
the
pare
nt
firm
had
aco
ven
ant
vio
lati
on
inth
ecu
rren
tb
ut
not
pre
vio
us
yea
rN
ini
etal.
(2012)
Age
Nu
mb
erof
yea
rssi
nce
the
firs
tyea
rth
ees
tab
lish
men
tfi
rst
ap
pea
rsin
the
LB
DL
BD
Est
ab
lish
men
tsp
erF
irm
Th
eto
tal
nu
mb
erof
esta
blish
men
tsof
the
pare
nt
firm
LB
DE
stab
lish
men
tsp
erS
egm
ent
Th
eaver
age
nu
mb
erof
esta
blish
men
tsp
erth
ree-
dig
itin
du
stry
segm
ent
of
the
pare
nt
firm
LB
DT
ota
lF
act
or
Pro
du
ctiv
ity
Est
ab
lish
men
t-le
vel
log
tota
lfa
ctor
pro
du
ctiv
ity
com
pu
ted
follow
ing
Fost
eret
al.
(2013)
CM
F/A
SM
Lab
or
Pro
du
ctiv
ity
Aver
age
wage
defi
ned
as
payro
lld
ivid
edby
nu
mb
erof
emp
loyee
sL
BD
Lab
or
Pro
du
ctiv
ity
(Alt
.1)
Valu
ead
ded
per
lab
or
hour
defi
ned
as
sale
sm
inu
sm
ate
rials
an
den
ergy
cost
sd
ivid
edla
bor
hou
rsC
MF
/A
SM
Lab
or
Pro
du
ctiv
ity
(Alt
.2)
Ou
tpu
td
ivid
edby
tota
lla
bor
hou
rsC
MF
/A
SM
Lab
or
Pro
du
ctiv
ity
(Alt
.3)
Wage
per
hou
rd
efin
edas
payro
lld
ivid
edby
tota
lla
bor
hou
rsC
MF
/A
SM
Ret
urn
on
Cap
ital
Sale
sm
inu
sm
ate
rial
an
den
ergy
cost
san
dp
ayro
lld
ivid
edby
esta
blish
men
t-le
vel
cap
ital
stock
CM
F/A
SM

Internet Appendix for
“Creditor Control Rights and Resource Allocation Within Firms”
Nuri Ersahin
Rustom M. Irani
University of Illinois at Urbana-Champaign
Hanh Le
University of Illinois at Chicago
April 2, 2016

Appendix IA.I: Summary Statistics for Capital Expenditures Restriction Sample
This table provides firm-level sample summary statistics for the set of firms with capital expen-
diture restrictions. The New Capital Expenditure Restriction indicator variable equals one when
the new contract contains a capital expenditure restriction and the previous contract for the same
borrower did not. The Old Capital Expenditure Restriction indicator variable equals one when
the new contract contains a capital expenditure restriction and New Capital Expenditure Restric-
tion is equal to zero. The unit of observation is a firm-year. All variables are defined in Appendix A.
Full Sample Old Restriction New Restriction
N Mean Std. N Mean Std. N Mean Std.
[1] [2] [3] [4] [5] [6] [4] [5] [6]
∆Log(Employment) 2,000 0.020 0.392 1,000 0.004 0.382 500 -0.069 0.594Operating Cash Flow 2,000 0.136 0.103 1,000 0.124 0.096 500 0.095 0.074Leverage 2,000 0.312 0.199 1,000 0.348 0.228 500 0.353 0.177Interest Expense 2,000 0.024 0.019 1,000 0.030 0.024 500 0.030 0.023Net Worth 2,000 0.397 0.214 1,000 0.373 0.274 500 0.353 0.219Current Ratio 2,000 1.864 0.192 1,000 1.940 1.070 500 1.823 0.959Market-to-Book 2,000 1.634 1.098 1,000 1.376 0.810 500 1.146 0.534
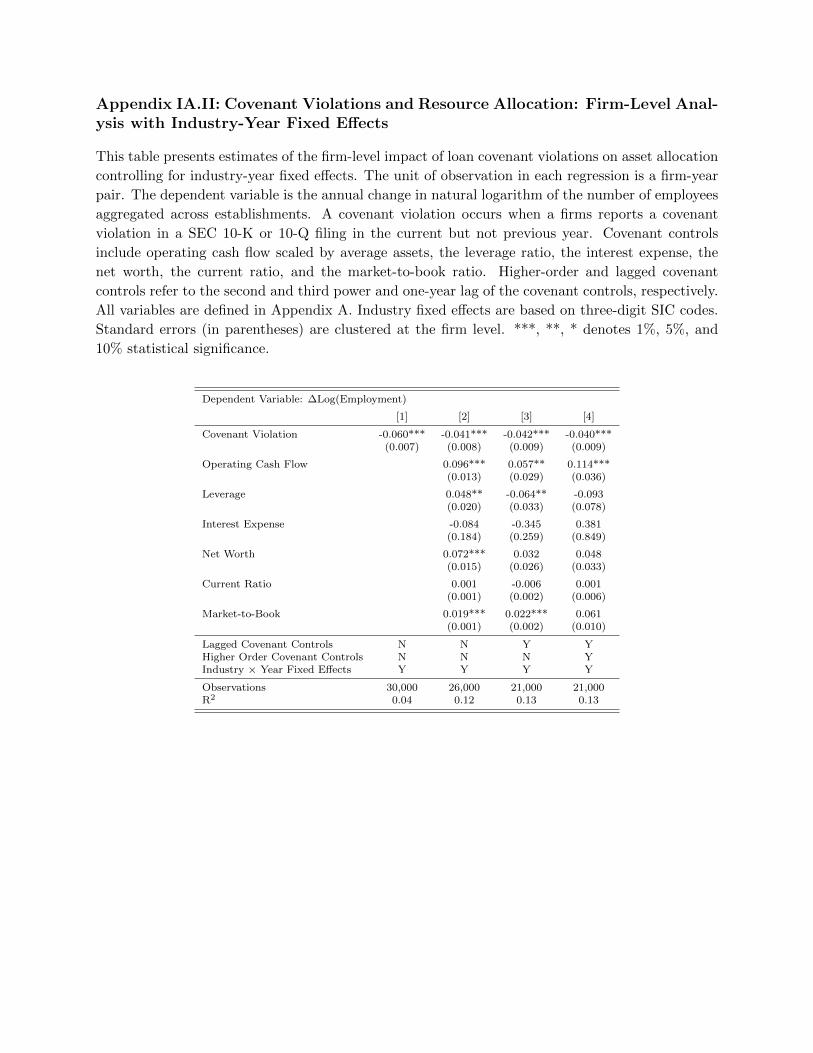
Appendix IA.II: Covenant Violations and Resource Allocation: Firm-Level Anal-ysis with Industry-Year Fixed Effects
This table presents estimates of the firm-level impact of loan covenant violations on asset allocation
controlling for industry-year fixed effects. The unit of observation in each regression is a firm-year
pair. The dependent variable is the annual change in natural logarithm of the number of employees
aggregated across establishments. A covenant violation occurs when a firms reports a covenant
violation in a SEC 10-K or 10-Q filing in the current but not previous year. Covenant controls
include operating cash flow scaled by average assets, the leverage ratio, the interest expense, the
net worth, the current ratio, and the market-to-book ratio. Higher-order and lagged covenant
controls refer to the second and third power and one-year lag of the covenant controls, respectively.
All variables are defined in Appendix A. Industry fixed effects are based on three-digit SIC codes.
Standard errors (in parentheses) are clustered at the firm level. ***, **, * denotes 1%, 5%, and
10% statistical significance.
Dependent Variable: ∆Log(Employment)
[1] [2] [3] [4]
Covenant Violation -0.060*** -0.041*** -0.042*** -0.040***(0.007) (0.008) (0.009) (0.009)
Operating Cash Flow 0.096*** 0.057** 0.114***(0.013) (0.029) (0.036)
Leverage 0.048** -0.064** -0.093(0.020) (0.033) (0.078)
Interest Expense -0.084 -0.345 0.381(0.184) (0.259) (0.849)
Net Worth 0.072*** 0.032 0.048(0.015) (0.026) (0.033)
Current Ratio 0.001 -0.006 0.001(0.001) (0.002) (0.006)
Market-to-Book 0.019*** 0.022*** 0.061(0.001) (0.002) (0.010)
Lagged Covenant Controls N N Y YHigher Order Covenant Controls N N N YIndustry × Year Fixed Effects Y Y Y Y
Observations 30,000 26,000 21,000 21,000R2 0.04 0.12 0.13 0.13