Embed Size (px)
Citation preview
HAL Id: hal-01710016https://hal-unilim.archives-ouvertes.fr/hal-01710016
Preprint submitted on 15 Feb 2018
HAL is a multi-disciplinary open accessarchive for the deposit and dissemination of sci-entific research documents, whether they are pub-lished or not. The documents may come fromteaching and research institutions in France orabroad, or from public or private research centers.
L’archive ouverte pluridisciplinaire HAL, estdestinée au dépôt et à la diffusion de documentsscientifiques de niveau recherche, publiés ou non,émanant des établissements d’enseignement et derecherche français ou étrangers, des laboratoirespublics ou privés.
Creditor rights and bank capital decisions: Conventionalvs. Islamic banking
Mohammad Bitar, Amine Tarazi
To cite this version:Mohammad Bitar, Amine Tarazi. Creditor rights and bank capital decisions: Conventional vs. Islamicbanking. 2018. �hal-01710016�
1
Creditor rights and bank capital decisions: Conventional vs. Islamic banking
Mohammad Bitar1†, Amine Tarazi2
1 Department of Finance, John Molson School of Business, Concordia University, 1455 Blvd. de Maisonneuve West, Montréal,
Canada
2 Université de Limoges, LAPE, 5 rue Félix Eboué, 87031 Limoges Cedex, France.
This draft: February 10, 2018
Abstract
Using a sample of banks operating in 24 countries, we provide robust evidence that stronger creditor
rights are associated with higher capital adequacy ratios of conventional banks but not of Islamic banks.
Such results are more effective on bank core capital, suggesting that bank managers tend to increase pure
equity to signal better monitoring efforts and avoid losing control in an environment characterized by
strong creditor protection. Except in less religious countries with less competitive markets, Islamic banks
appear to be less affected by creditor protection possibly because of the profit loss sharing (PLS) principle
that considers depositors as investors who agree to share profits and losses with the bank, thus making the
effect of creditor protection weaker or irrelevant in an Islamic banking context.
JEL classification: G21, G28, G32, K22
Keywords: Creditor rights, market power, religion, bank capital ratios, Islamic banks
† Corresponding author.
E-mail addresses: [email protected] (M. Bitar), [email protected] (A.Tarazi)
2
1. Introduction
Do creditor rights affect bank capital decisions? Is the impact on capital decisions identical for
conventional banks and Islamic banks? The literature has focused on the effect of creditor rights on bank
lending decisions such as loan spreads and maturities (Qian and Strahan, 2007; Bae and Goyal, 2009;
González, 2016), ownership structure of international syndicated loans (Esty and Megginson, 2003), and
multiple lending decisions (Djankov et al. 2006; Bennardo et al. 2015). However, research on the effect
of creditor rights on bank financing (capital) decisions is still scarce. While Daher (2017) provides
evidence that legal enforcement along with strong creditor protection reduce the negative impact of
financial covenants violation on debt issuance, Cho et al. (2014) report that the corporate finance
literature is still in its infancy when examining the role of creditor protection in influencing firms’
financing decisions. The same applies to the banking literature, which only reports two studies by
Houston et al. (2010), and Jayaraman and Thakor (2013).
Houston et al. (2010) argue that regulators force banks to hold higher capital ratios to incentivize
them to monitor their investments and protect their depositors and Jayaraman and Thakor (2013) explore
monitoring the role of bank capital and deposits. In this work, we focus on the constraints imposed by the
Sharia’a law on creditors (depositors) of Islamic banks, which are mainly represented by the investment
accounts holders (IAHs), and investigate whether the profit loss sharing principle (PLS) can affect the
relationship between creditor rights and capital ratios of these banks compared to their conventional
counterparts. For conventional banks, in the presence of a highly protective environment for creditors,
bank managers will tend to avoid excessive reliance on deposit-debt financing and by extension any
increase in leverage. In contrast, Islamic banks are not expected to account for creditor rights because the
Sharia’a law expects IAHs to share profit and losses and thus protection of their initial capital and returns
is not allowed. Under these circumstances, we predict that creditor rights will have a limited effect on
Islamic banks’ capital decisions while the opposite should be observed for conventional banks.
To empirically assess the impact of creditor rights on conventional and Islamic banks’ capital
decisions, we use a sample of 680 conventional banks and 113 Islamic banks operating in 24 countries
3
from 1999 to 2013. Using a Generalized Least Squares (GLS) model, we find that creditor rights have a
positive and significant effect on the capital ratio of conventional banks while the effect is rarely
significant for Islamic banks.
A deeper investigation shows that, consistent with the view that core capital is a better signalling
mechanism (Demirgüç-Kunt et al., 2013; Anginer et al., 2014; Bitar et al. 2016), such a relationship
essentially holds for conventional banks’ pure equity but remains insignificant for Islamic banks.
Moreover, a detailed breakdown of the different components of creditor rights shows that allowing
creditors to liquidate conventional bank assets and putting restrictions on any reorganisation plan play a
major role in the increase in core capital as a strong signalling mechanism to reinforce creditors’ trust in
bank supervision. Giving secured creditors the priority to claim over other creditors as well as giving
them the opportunity to decide whether they should replace the existent management in case of distress
also plays an important role. Eventually, the results also show that the positive impact of creditor rights
on conventional banks’ capital is stronger after the global financial crisis of 2007-2009 and more
pronounced for mature banks in common law and rich countries with a strong institutional environment
and sound governance, while still absent, for Islamic banks.
Islamic banks, however, might react differently depending on the extent of the competiveness of the
banking market and the degree of religiosity of a given country. Islamic banks with strong market power
might charge higher rates to borrowers for offering Sharia’a compliant products (Weill, 2011). On the
one hand, religious clients (borrowers) might be willing to pay more to make sure that the products they
receive are compliant with the Islamic law (Weill, 2011; Abedifar et al., 2013). Religious IAHs, on the
other hand, are expected to share profits and losses with the bank. As a result, in higher market power and
more religious environments creditor rights should not affect the capital decisions of Islamic banks. If,
however, markups are lower (higher competition) Islamic banks would be less profitable and/or less
solvent. Hence, creditor rights could play a role if IAHs are more worried and withdraw their deposits by
possibly moving them to conventional banks without requiring any interest (demand deposits) or at least
by threatening banks more easily.
In contrast, less religious clients might not be willing to pay higher rates to borrow from Islamic
banks which could weaken the demand for Islamic banks’ products and reduce their attractiveness. In
addition, higher rates might also lead to riskier investments and more volatile returns (Turk-Ariss, 2010).
Less religious IAHs are expected to be more sensitive to return rates and default risk than highly religious
ones and hence IAHs might behave similarly to depositors of conventional banks. Consequently, a
4
stronger protective environment for creditors might also put pressure on Islamic banks to hold higher
capital ratios to protect IAHs, preserve their confidence and thus avoid withdrawal risk. As a result, in
less religious countries with higher price markup (lower competition) the behavior of Islamic banks and
conventional banks might not be very different and the capital of both types of banks could be affected
creditor rights. We find compelling evidence that supports this view.
On the whole, our results are robust to alternative estimation techniques, including additional
control variables to mitigate the effect of omitted variables, an instrumental variable approach (IV) and a
Heckman estimation technique to control for endogeneity and selection bias, as well as a propensity score
matching technique (PSM) to reduce any bias in sample size, and other estimation methods.
Our study contributes to the literature on both conventional and Islamic banking in at least three
important ways. First, we highlight the existence of a strong positive effect of creditor rights on
conventional bank capital decisions but not for Islamic banks. However, we notice that managers of
Islamic banks could be behaving similarly to those of conventional banks in less religious countries with
less competitive banking markets. This could provide regulators and policy makers with an additional
tool to create more favorable corporate and institutional conditions to implement the Basel III capital
guidelines in a successful way. Second, we show that other factors such as inequality in countries’
income, legal origins, bank experience, and the extent of economic fluctuations have a significant
influence on conventional banks' capital decisions but not on those of Islamic banks. Third, we add to the
comparative literature on conventional and Islamic banks (Beck et al. 2013; Abedifar et al. 2013; Mollah
and Zaman, 2015, Bitar et al., 2017) by exploring the determinants of bank capital decisions and find
compelling evidence of dissimilarities between both bank types.
The rest of the paper is organized as follows. Section 2 briefly reviews the literature and research
focus. Section 3 describes the sample, the variables and the empirical model. Section 4 presents the main
results. Section 5 examines the impact of bank market power and religion. Section 6 reports the
sensitivity analyses while section 7 presents the alternative estimation techniques. Section 8 concludes.
2. Related literature and research focus
This paper adds to the growing literature on creditor rights by studying whether their role is
significant in shaping capital ratios across developing countries and by comparing their effect on
conventional and Islamic banks. While corporate finance and banking literatures provide abundant
evidence on the importance of creditor rights in influencing bank and firm risk taking (Houston et al.
5
2010; Acharya et al. 2011, Jayaraman and Thakor, 2013) and lending decisions (Djankov et al. 2006;
Qian and Strahan, 2007; González, 2016), few empirical studies investigate the impact of creditor rights
on capital ratios. In the corporate finance literature, Acharya et al. (2011) and Cho et al. (2014) show that
firms in countries with strong creditor rights tend to rely less on leverage (especially long-term debt),
suggesting that firm managers and shareholders are less willing to substitute safe capital such as equity
with risky capital such as long term debt to avoid any loss of control in cases of financial distress. Qian
and Strahan (2007) find that better protection of creditors facilitate firm access to longer maturity
borrowing and at lower interest rates because lenders are confident that they will be able to take assets or
at least threat to take assets in the event of firms default. Daher (2017) also finds that the existence of
strong legal enforcement and creditor protection reduce the negative effect of covenants violation on
firms’ debt issuance. In the banking literature, Houston et al. (2010) show that strong creditor rights are
associated with higher capital ratios, indicating that to attract depositors in the presence of high protective
environment for creditors, banks issue more equity capital. To increase their investments, banks need to
attract more depositors by signalling a credible monitoring incentive to potential ones. According to the
authors, one way to guarantee a credible bank monitoring and less risky behavior is through holding an
important amount of equity capital. By holding higher capital buffers, banks are committing to a certain
level of leverage without exploitation of depositors’ money. Such behavior reflects the “more skin in the
game” policy documented by Demirgüç-Kunt et al. (2013) by which banks increase their capital ratios to
assure depositors their willingness to internalize the costs of their default. We posit that if equity is used
to incentivize banks to create stronger monitoring tools to protect depositors by forcing bank managers to
internalize a greater proportion of the costs of default, reduce risk taking and financial leverage, then, in
the presence of a high protective environment for creditors, bank managers will tend to increase their
capital ratios and avoid excessive reliance on deposit-debt financing which will increase mismatches
between short maturity liabilities and bank assets.
In contrast to conventional banks, the funding structure of Islamic banks – which has to be Sharia’a
compliant – is based on three main sources: Capital, demand deposits and profit-loss sharing investment
accounts. First, Islamic banks’ depositors are considered more like IAHs than depositors. Through the use
of restricted and unrestricted investment accounts, depositors of Islamic banks are expected to take risk
and share profits and losses with banks. Their deposit returns are related to the success of bank
investments and therefore deposit insurance and other forms of creditors’ protection are prohibited
because they contradict the PLS concept. Accordingly, the effect of creditor rights should in principle be
ineffective for Islamic banks. Second and unlike their conventional counterparts, Islamic banks are
6
forbidden from using debt-like instruments in building-up their capital buffers, which explains their high
reliance on core capital and the quasi-absence of supplementary capital in their capital adequacy ratios.
In practice, however, the association between creditor rights and Islamic banks’ capital ratios can
depend on market power and the degree of religiosity. Islamic banks can benefit from religious clients
(borrowers) to gain market power. Weill (2011) argue that religious borrowers might exhibit a more
inelastic demand driven by loyalty and respect for the Sharia’a law. El-Gamal (2007) explain that
additional charges for offering Sharia’a products are considered as the “cost of being Muslim” while
Abedifar et al. (2013) refer to the additional cost as the price of offering Sharia’a compliant products. On
the depositors’ side, in more religious countries, IAHs accept to bear losses and to be loyal to their banks
which could reduce withdrawal risk (Abedifar et al., 2013), regardless of the return rate on their deposits.
Therefore, the role of capital as a monitoring mechanism is expected to be ineffective because creditors
are treated as pure investors. As a result, creditor rights are expected to have a limited effect on bank
capital ratios in religious countries with strong market power.
Nevertheless, less religious clients might be more sensitive to borrowing costs. In this case, the
competitiveness of Sharia’a compliant products could be lower which might also possibly increase the
probability of credit default (Weill, 2011). One important feature of Islamic banks is their reliance on
debt-like financing techniques such as Murabaha and Ijara. For instance, Beck et al. (2013) find that
Islamic banks have higher loans to deposit ratio, suggesting a larger involvement in traditional
intermediation activities. Turk-Ariss (2010) also finds that Islamic banks with higher market power
allocate a greater share of their assets to loans financing compared to conventional banks, yielding a
greater exposure to credit risk. Less religious IAHs are also expected to be more sensitive to return rates
and credit default risk. Accordingly, IAHs are expected to react similarly to depositors of conventional
banks. In doing so, a strong protective environment for creditor rights might put pressure on Islamic
banks to balance their higher credit risk exposure by holding higher capital ratios, as a strong signalling
and monitoring mechanism to preserve IAHs’ confidence, and avoid withdrawal risk. As a result, we
expect that creditor rights combined with strong market power will push Islamic banks to behave like
conventional banks except in highly religious countries.
7
3. Sample and methodology
3.1. Sample construction
The data used to construct our capital ratios and other bank-level characteristics are collected from
the Bankscope database. For each bank in the sample, we retrieve annual data from 1999 to 2013. Our
initial sample includes banks from 33 countries. We exclude countries such as Bahrain, Brunei, Cayman
Islands, Gambia, Iraq, Palestinian territories, Philippines, Qatar, and Sudan because they have no
available data on the creditor rights’ index. We also exclude banks if they do not have at least 3
continuous observations and banks with negative capital ratios. Our final sample consists of 793 banks
(including 113 Islamic banks) operating in 24 countries. Macroeconomic data such as GDP growth,
inflation, oil and mineral rents are obtained from the World Bank’s World Development Indicators
(WDI), whereas financial development and institutional variables are obtained from various sources, such
as the World Bank’s Worldwide Governance Indicators (WGI), Djankov et al. (2007), the CIA’s World
Fact Book, and the World Values Surveys (WVS).
3.2. Variables and empirical model
We follow Mollah and Zaman (2015) and use random-effect, Generalized Least Squares (GLS)
regressions. We use GLS technique for two reasons. First, regression models, such as OLS, ignore the
panel structure of our data. Second, the creditor rights index and the Islamic bank dummy are time-
invariant and cannot be estimated using a fixed-effect methodology. Accordingly, we employ the
following regression models:
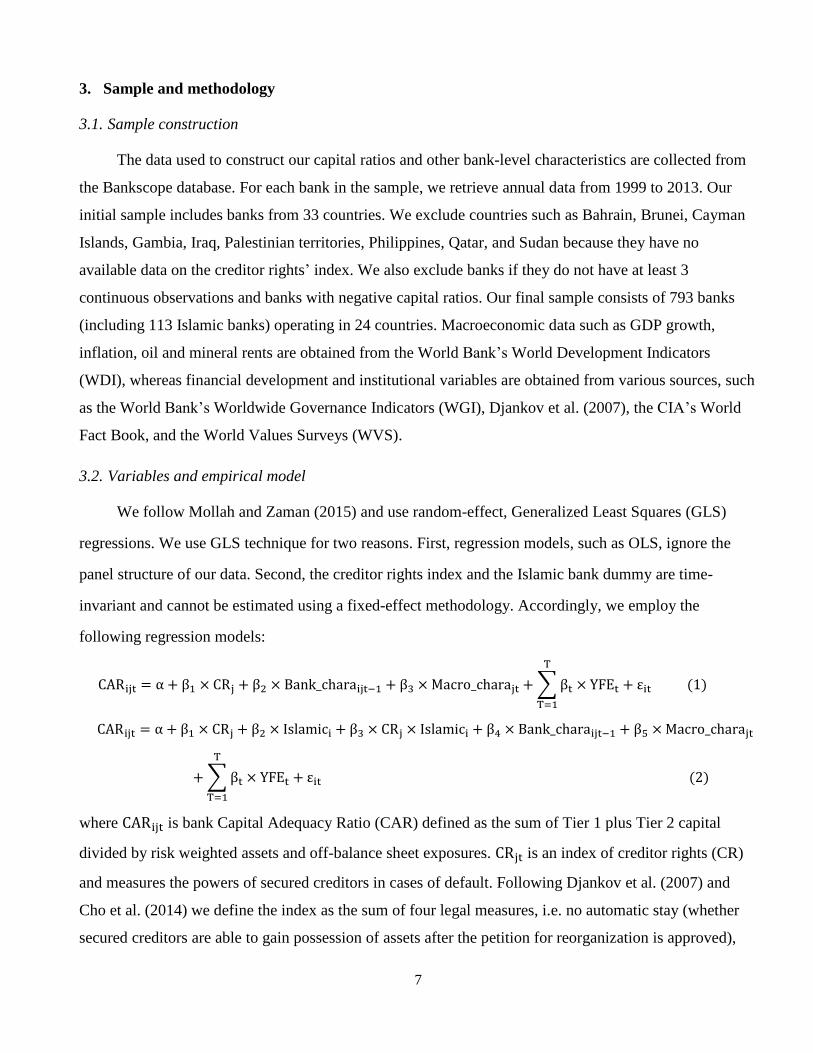
CARijt = α + β1 × CRj + β2 × Bank_charaijt−1 + β3 × Macro_charajt + ∑ βt × YFEt
T
T=1
+ εit (1)
CARijt = α + β1 × CRj + β2 × Islamici + β3 × CRj × Islamici + β4 × Bank_charaijt−1 + β5 × Macro_charajt
+ ∑ βt × YFEt
T
T=1
+ εit (2)
where CARijt is bank Capital Adequacy Ratio (CAR) defined as the sum of Tier 1 plus Tier 2 capital
divided by risk weighted assets and off-balance sheet exposures. CRjt is an index of creditor rights (CR)
and measures the powers of secured creditors in cases of default. Following Djankov et al. (2007) and
Cho et al. (2014) we define the index as the sum of four legal measures, i.e. no automatic stay (whether
secured creditors are able to gain possession of assets after the petition for reorganization is approved),
8
secured creditor paid first (whether secured creditors are ranked first in the distribution of proceeds of
liquidating a bankrupt institution compared to other creditors such as government or workers), restrictions
on reorganization (whether there are restrictions imposed, such as creditors’ consent or minimum
dividend, when a debtor files for reorganization), and no management stay (whether the creditors can
change the incumbent management during the reorganization), with a value of one if a country’s
regulations provide that specific type of protection, and zero otherwise. The aggregate creditor rights
index therefore ranges between zero and four with a higher value indicating stronger creditor protection.
Bank_deterijt−1 is bank-level determinants of capital ratios identified by the traditional banking and
corporate finance literature, i.e. logarithm of total assets (size), return on average assets (profitability),
loans to assets (diversification) , liquid assets to deposits and short term funding (liquidity), and fixed
assets to assets (tangibility). Macro_deterjt controls for differences in economic conditions and captures
the impact of macroeconomic variables, i.e. GDP growth, inflation rate, and natural resources, i.e. oil and
mineral rents, on bank capital ratios. We also use The World Bank’s World Governance Indicators (WGI)
to capture the role of the institutional environment in shaping the financial development in each country.
YFEt are the year fixed effects, and εit is a white-noise error term assumed to be normally distributed with
zero mean and constant variance, εit~𝑖𝑖𝑑 𝑁(0, 𝜎2). An Islamic bank dummy1 (Islamic) and an interaction
term between the Islamic bank dummy and the creditor rights index (Islamic × creditor rights) are
included in Eq. (2). Bank-level independent variables are lagged by one year for two reasons. First,
lagged independent variables might reduce endogeneity concerns. Second, most of the right hand
variables might take more than one year to show any pronounced effect. In addition, all bank-level
variables are winsorized at the 1% and the 99% levels to mitigate the effect outliers. Finally, we follow
Beck et al. (2013) and Anginer and Demirgüç-Kunt (2014) and cluster at the bank level, instead of the
country level for two reasons. First, some countries have a much larger number of observations than other
countries in the sample. Second, we have twenty-four countries. Therefore, clustering at the country level
might create biased results.
Table 1 presents summary statistics for the capital adequacy ratio, the core capital ratio (Tier1
capital), the creditor rights index as well as the bank level and the country level control variables for the
24 countries. The numbers suggest a large cross-country variation in capital ratios. For instance, the
capital adequacy ratio ranges from a minimum of 11.84% in Bangladesh to a maximum of 29.74% in
1 While some of the banks have Islamic windows, the bulk of their operations are conventional. Therefore, we expect that the
impact of creditor rights on capital ratios should remain identical without the exclusion of these banks.
9
Syria. Creditor rights scores also vary substantially across countries. We find that countries such as
Kenya, Lebanon and the United Kingdom rank towards the top of the creditor rights index whereas the
Senegal, Tunisia, and Yemen rank towards the bottom. The macroeconomic control variables such as
GDP growth, inflation, oil and mineral rents also vary widely across countries, indicating that it is very
important to control for these variables in our regressions. Finally, Table A.1 in Appendix A presents the
number of conventional and Islamic banks in each country while Table A.2 presents the correlation
matrix of the variables that enter our regressions. The sample is dominated by banks from the United
Kingdom for conventional banks and Malaysia for Islamic banks. We also notice that for the studied
period and on average, the number of available observations is rather weak and the percentage of reported
observations (N obs. %) is slightly higher for conventional banks (59.4%) than for Islamic ones (57.1%).
As for the correlation matrix, it does not show any major collinearity problems between our exogenous
variables.
[Insert Table 1 around here]
4. Main findings
We begin the investigation by reporting the effect of creditor rights on bank capital adequacy ratios
for the sample of conventional banks, the sample of Islamic banks and for the full sample. Results are
reported in Table 2. The Wald Chi2 tests are highly significant for all models, and the R-squared are
relatively high and similar to previous literature (Houston et al. 2010; Cho et al. 2014). Creditor rights are
positively associated with conventional banks’ capital ratios (β1 is positive and significant in Models 1
and 2) but not for Islamic banks (Models 5 and 6). The significant coefficients obtained when using the
full sample are hence driven by conventional banks. Panel B which considers the full sample by
performing tests on the sum of coefficients shows that the effect is also positive for conventional banks
(Models 9 and 10) but remain insignificant for Islamic banks ((β1+β3) is not statistically significant). Our
findings indicate that, in the presence of stronger creditor rights, conventional banks might effectively
need to hold more capital to gain confidence from depositors (Models 1 and 2) but not Islamic ones.
Because depositors (IAHs) of Islamic banks agree to share profits and bear losses when they occur, any
form of creditor protection to gain depositors’ confidence should be irrelevant under the Sharia’a law.
We now ask whether the positive effect of creditor rights on capital is the same for bank core
capital ratios. If creditor rights are indeed more effective in requiring banks to hold more capital to gain
depositors’ confidence, than the effect should be more pronounced on core capital ratios (Tier 1 capital)
than on capital adequacy ratios. Core capital is viewed by depositors and regulators as the most reliable
10
component in the capital adequacy ratio (Arnold et al. 2012). In addition, market participants refer to Tier
1 capital as the component that is available to absorb losses in situations of financial distress (Demirgüç-
Kunt et al. 2013; Anginer et al. 2014). Results are also reported in Table 2 and confirm our expectations
for conventional banks in the separate sample (Models 3 and 4) and the full sample (Models 11 and 12).
In an institutional environment that is characterised with stronger creditor protection, banks tend to hold
higher capital ratios in the form of core capital to provide a positive signal to regulators about bank
solvency and gain confidence from depositors. Although Islamic banks rely more on core capital2 than
conventional counterparts, the results remain insignificant (Panel A, Models 7 and 8, and Panel B,
Models 11 and 12).
[Insert Table 2 around here]
With regards to bank-level control variables, we find a negative and significant association between
size and capital ratios for the two bank types, possibly reflecting the argument of Beck et al. (2013) and
Abedifar et al. (2013) that larger banks are more experienced and more reputable that smaller ones. In
addition, large banks benefit from diversification and economy of scales, have lower bankruptcy costs
and a better access to capital markets. Finally, large Islamic banks have a more privileged position in
accessing Sharia’a compliant debt instruments and levering the use of investment accounts; thus they rely
less on capital. As for profitability, we find a positive and significant relationship with capital ratios,
possibly because banks in developing countries rely more on retained earnings especially if the economic
and financial environment is still not well developed. As a result, banks in these countries are more prone
to information asymmetry and transaction costs and hence raising either debt or equity might be more
expensive. The coefficient estimate of the loans-to-assets ratio shows a negative association with capital
ratios but only for conventional banks, suggesting that banks with important loan portfolios are less
exposed to risk than banks that prefer to invest in derivatives, other types of securities, and non-traditional
activities, and thus there is no need to hold higher capital buffers. The liquidity ratio is positive and
significant for Islamic banks, indicating that Islamic banks holding more liquid assets have a better
capacity of raising equity than less liquid Islamic banks possibly because they are less exposed to
information asymmetry. The coefficient is however not significant for conventional banks. Finally, the
2 Islamic banks are less capable of raising tier 2 capital because the Sharia’a law prohibits dealing with debt instruments such as
hybrid capital and subordinated debt (e.g. junior security and subordinated loans) as they require interest payments.
11
coefficient estimate for tangibility shows a positive and significant effect on bank capital ratios although
the results are not significant in all models. This can be explained by the fact that a higher proportion of
tangible assets in the bank balance sheet impede moral hazard problems, allows banks to have a clearer
view of the allocation of their resources, and makes them less sensitive to information asymmetry. This
implies that the cost of issuing equity is expected to be lower than the cost of raising debt. Therefore, the
presence of tangible assets is positively associated with bank capital ratios.
As for country-level control variables, we find that the governance indicator has a positive effect on
bank capital adequacy and core capital for both bank types, suggesting that in the presence of a strong
institutional environment in terms of rule of law, regulatory quality, and control of corruption, banks are
more capable of raising equity than debt. We also find that inflation is negatively associated with capital
ratios for both bank types possibly reflecting the tax shield benefit of debt and its positive association
with bank leverage. Finally, we show that banks operating in countries with higher oil and mineral rents
have higher capital ratios, suggesting that banks can benefit from the prices of natural resources to
increase their equity base in the form of retained earnings and/or reserves to protect against future
changes in economic conditions (political instability, oil prices volatility, etc.).
5. The impact of bank market power and religion
We now address the impact of bank market power and religion on the association between creditor
rights and capital ratios for conventional and Islamic banks. The literature often refers to the competition-
stability hypothesis – where market power results in less risk-taking– and the competition-fragility
hypothesis – where market power leads banks to charge higher interest rates on firms and households
which increases their default risk– to examine the impact of market power on bank stability and
performance. As for the impact of market power on bank capital ratios, the literature is scarce. While
Berger (2009), Turk-Ariss (2010a, b), and Forssbaeck (2015) argue that market power increases bank
stability by making banks hold higher capital ratios, Allen et al. (2011), Schaeck and Cihák (2012, 2014)
report opposite results and find that competition improves bank stability by incentivising banks to hold
higher capital ratios. Both sides of the literature conclude that holding sufficient level of bank capital is an
important tool to maintain bank incentives to monitor by internalising the cost of defaulting, thus
concurring with the findings of Demirguc-Kunt et al. (2013) on the important role of bank capital.
In this section, we bring the issue of market power and bank capital along with creditor rights to a
dual market where conventional and Islamic banks compete, an issue that has not been addressed in the
12
comparative literature between the two bank types. While the presence of strong creditor rights appears to
be driving conventional banks to hold higher capital ratios as a way to gain depositors’ confidence, we
now ask whether strong market power can alter bank managers’ capital decisions. Conventional banks
with strong market power tend to have riskier loan portfolios (Berger et al. 2009; Turk-Ariss, 2010a, b;
Forssbaeck, 2015). We argue that in the presence of a protective environment for creditors, conventional
banks will continue to hold higher capital ratios as an effective signalling mechanism to secure
depositors’ funds by internalizing the cost of default and gain their confidence (Houston et al., 2010).
Islamic banks might also hold higher capital ratios depending on the way they treat their IAHs. We
provide two competing arguments. First, charging higher rates for offering Sharia’a compliant products
might not be an issue for religious borrowers because their demand is driven by loyalty and respect to the
Islamic law (Weill, 2011; Abedifar et al., 2013). In addition, religious IAHs act as pure investors who
accept to be bear losses and to be loyal to their banks which could reduce withdrawal risk, regardless of
the interest rates proposed by conventional banks. Bitar et al. (2017) refer to this behavior as the goodwill
of religious depositors who believe that they preserve the Muslim culture and identity. Therefore, the
effect of creditor rights is limited and the role of capital should be negligible. Second, creditor rights are
expected to have a similar effect on capital ratios of Islamic banks compared to those of conventional
banks in less religious countries with strong market power. In these countries, borrowers might be less
interested in Sharia’a compliant products if the borrowing costs are higher than the borrowing rates
proposed by conventional banks. In addition, IAHs tend to react in a similar way to depositors of
conventional banks. They expect Islamic banks to protect their deposits against credit risk while
demanding competitive and less volatile return rates on their deposits. Therefore, a protective
environment for creditor rights might put pressure on Islamic banks to hold higher capital ratios in less
religious countries with strong marker power.
We test these conjectures by first introducing the Lerner index to Eqs. (1)–(2) as well as the
interaction term between creditor rights and the Lerner index (Creditor rights×Lerner). The Lerner index
is commonly used in the banking literature (Turk-Ariss 2010a, b; Weill, 2011; Meslier et al. 2017). It is
defined as the difference between the price of financial products and their marginal cost, divided by the
price. Banks are usually able to set a price that is higher to marginal cost in less competitive markets. As a
result, a higher value of Lerner index indicates higher market power and less competitive conditions.3 We
3 The Lerner index varies between 0 (highly competitive market/weak market power) and 1 (less competitive market/strong
market power). However, a negative index indicates an inefficient banking sector (Soedarmono et al., 2011).
13
follow Meslier et al. (2017) and use a three input cost function specification to estimate bank marginal
cost.
Results are presented in Table 3 for the capital adequacy ratio and the core capital ratio. Panel A
introduces the interaction term between Lerner index and creditor rights on capital ratios for the two bank
types. Panel B examines the relationship between bank capital reaction and creditor rights in an
environment with strong market power at different values of Lerner (25th, 50th, 75th, and 90th percentiles).4
[Insert Table 3 around here]
The results in Panel A show that the presence of high market power has no influence on the link
between creditor rights and the capital ratios of conventional banks (Models 1 to 4). The results in Panel
B suggest that the effect of creditor rights on capital ratios remains positive but marginally less effective
when market power is high ((β1+β3) is statistically significant). This would also mean that more market
power might slightly weaken but not eliminate the positive association between creditor rights and
conventional banks’ capital ratios.
As for Islamic banks, the interaction term shows positive and significant effect at the 1% level on
both the capital adequacy ratio and the core capital ratio (Panel A, Models 5 to 9). In Panel B, the results
show that high market power alters the insignificant sign of creditor rights, resulting in a positive effect
on capital ratios of Islamic banks as well ((𝛽1 + 𝛽3) is statistically significant). In other words, a
protective environment for creditor rights combined with strong market power might put pressure on
Islamic banks to hold higher capital ratios.
Our results so far suggest that creditor rights similarly affect the two bank types’ capital decisions
in less competitive markets while creditor protection is ineffective in shaping Islamic banks’ capital
decisions in more competitive ones. We now ask whether these findings are driven by the degree of
religiosity of the countries where banks are operating. In less religious countries, we expect IAHs to react
in a similar way to depositors of conventional banks. Regulatory authorities such as the Islamic Financial
Services Board (IFSB) and the Accounting and Auditing Organization for Islamic Financial Institutions
(AAOIFI) might put more pressure on Islamic banks to support IAHs and treat their accounts as a
4 We have performed the F-test (Wald) for the degree of significance between the different quantiles of (𝛽1 + 𝛽3) coefficients
of creditor rights×Lerner index. The impact on bank capital suggests significant differences between the lower and the upper
quantiles of the interaction coefficients for Islamic banks while these differences appear to be marginal or insignificant for
conventional banks.
14
Sharia’a compliant substitutes of conventional banks’ deposits (IFSB, 2011). In doing so, IAHs would no
longer be treated like investors but more like depositors. Therefore, if a less religious country’s
environment is characterized by a strong protection for creditors and high markups, Islamic banks might
tend to hold higher capital ratios as a signalling and monitoring mechanism to preserve IAHs confidence
and avoid withdrawal risk.
[Insert Table 4 around here]
To examine the effect of religion on the coefficient of the interaction between creditor rights and
Lerner index (creditor rights×Lerner) on capital ratios, we follow Abedifar et al. (2013) and Mollah et al.
(2016) and split our sample between highly religious countries (Muslim population > the upper quantile
of the total population) and less religious countries (Muslim population ≤ the upper quantile of the total
population).
Results are presented in Table 4 Panel A.1 for highly religious countries and Panel B.1 for less
religious ones. As expected, we find that the positive association of creditor rights×Lerner on capital
ratios of Islamic banks is mainly driven by banks in less religious countries (Panel B.1 Models 5 to 8). In
less religious countries, borrowers can decide not to use Islamic banks’ products if the borrowing cost is
higher and IAHs in these countries are expected to be less sensitive to the Sharia’a law and might decide
to withdraw their funds from Islamic banks if returns are volatile and deposits are not protected. In these
cases, creditor rights might be more effective in putting pressure on Islamic banks to hold higher capital
ratios as a signalling and monitoring mechanism to preserve IAHs confidence and avoid withdrawal risk.
In Panels A.2 and B.2 we also compute for different values of the Lerner index, the effect of creditor
rights on bank capital ratios. Our findings suggest that the positive and significant effect of creditor rights
becomes even stronger with higher values of the Lerner index (Models 5 to 8), thus providing additional
support that increased market power in less religious countries may effectively lead Islamic banks to hold
even more capital when creditor rights are higher.
6. Sensitivity analysis
6.1. Alternative measures of market power and religion
In the previous section, we computed the Lerner index for each country without separating
conventional and Islamic banks. We now compute the Lerner index for each year and for each bank
15
category5 to check the robustness of the results. Then, we calculate the Lerner index for all banks as the
sum of the Lerner index for conventional banks and the Lerner index for Islamic banks. We also use Eqs.
(1)–(2) to develop our model. We present the results in Table 5 Panel A.1 for the effect of creditor
rights×Lerner on conventional and Islamic banks’ capital ratios. As for the impact of religion, we replace
Muslim population with a variable that captures the importance of religion in each country computed by
using data from the World Values Surveys (WVS). Table 5 Panels B.1 and C.1 present the effect of
creditor rights×Lerner on conventional and Islamic banks’ capital ratios after splitting the sample between
countries where religion is considered very important (people consider that religion is very important >
the upper quantile of the surveyed population) versus countries where religion is considered less
important (people consider that religion is very important ≤ the upper quantile of the surveyed
population). Finally, Table 5 Panels A.2, B.2 and C.2 report the impact of creditor rights on bank capital
ratios when market power is high computed at different values of Lerner (25th, 50th, 75th, and 90th
percentiles).
[Insert Table 5 around here]
Table 5, Panels A.2, B.2, and C.2 further confirm the results. We find that when market power is
high, conventional banks continue to hold higher capital ratios in the presence of stronger creditor rights.
We also find that Islamic banks tend to hold higher capital ratios to provide a better signalling mechanism
and preserve IAHs confidence. The results across quantiles further suggest that increased market power in
less religious countries may effectively lead Islamic banks to protect even more their creditors and treat
them as a Sharia’a compliant substitute of conventional deposits, leading to a stronger positive effect of
creditor rights on their capital ratios.
6.2. Components of creditor rights
To further shed light on the association between creditor protection and capital decisions, we run
principal component analysis (PCA) on the four components of the creditor rights index – restrictions on
reorganization, no automatic stay, secured creditor paid first, and no management stay – to examine
which combination of creditor rights’ components is more effective in affecting bank capital. The PCA
findings shows that the first component loads restrictions on reorganization and no automatic stay
5 Islamic banks might also compete with each other in a segmented market. Accordingly, computing the Lerner index for each
country without separating conventional and Islamic banks might bias the results. Therefore, we re-estimate the Lerner index for
each bank category separately to capture the effect of bank competition within each bank category and examine whether the
within bank competition could affect our findings.
16
(CR_PCA1) while the second component combines secured creditor paid first and no management stay
(CR_PCA2). We then use the two components in Eq. (3) as follows:
CAPITALijt = α + β1 × CR_PCAj + β2 × Islamici + β3 × CR_PCAj × Islamici + β4 × Bank_charaijt−1
+ β5 × Macro_charajt + ∑ βt × YFEt
T
T=1
+ εit (3)
In Eq. (3), CAPITALijt represents bank i’s capital adequacy ratio and core capital ratio while
CR_PCAj are the two components extracted from PCA as mentioned above. The results presented in Table
6 Panel A show that the existence of restrictions on reorganization and no automatic stay are the factors
that put more pressure on conventional banks to increase their capital ratios. We also notice that this
positive effect is stronger on the core capital ratio than on the capital adequacy ratio. The findings are
consistent with our baseline findings on the importance of core capital as an effective signalling
mechanism to gain confidence from depositors. For the sample of Islamic banks, the results remain
insignificant. Panel B also suggests that the effect is positive for conventional banks in Models 9 and 11
(β1 is statistically significant) but remain insignificant for Islamic banks in Models 9 to 12 ((β1+β3) is not
statistically significant).
The findings for conventional banks suggest that the bankruptcy codes by prohibiting an automatic
stay of an assets and allowing automatic liquidations of insolvent bank by secured creditors might isolate
managers and shareholders from controlling the bank, thus giving greater bargaining power to creditors
against managers. In addition, imposing restrictions on bank management from filing for a reorganisation
plan without creditors’ consent, prioritize once again creditors’ rights against managers and shareholders.
Accordingly, a supportive environment for creditor protection might put pressure on bank managers to
send an effective signal about bank solvency by holding higher capital in the form of core capital to
maintain depositors’ confidence and avoid losing their bargaining advantages. As for Islamic banks, the
Sharia’a law requires depositors to be treated like investors who share profits and losses with the bank.
Viewed as investors, these depositors cannot benefit from any protection and thus they have no
bargaining power over bank management.
[Insert Table 6 around here]
6.3. Sample composition
Thus far, our results consistently indicate that higher protection for creditors might put pressure on
conventional banks to hold higher capital ratios to preserve depositors’ confidence. Except in less
17
religious countries with strong market power, creditor rights do not appear to have any significant effect
on the capital ratios of Islamic banks. Now, we investigate whether our baseline findings are driven by
other factors such as inequality in countries’ income, legal origins, bank experience, and periods of
economic fluctuations.
We first investigate whether the baseline results are driven by the uneven distribution of
observations across the group of countries depending on income inequalities. Djankov et al. (2007) argue
that rich countries might have a more efficient bankruptcy system and thus the legal enforcement for
creditor protection is more important. Accordingly, we expect conventional banks to react to strong
creditor protection by holding higher capital ratios but not Islamic banks. We use Eq. (4) and interact
creditor rights with two dummy variables (INCjt): (1) Poor (equals 1 if bank GDP per capita < median and
0 otherwise) and (2) Rich (equals 1 if bank GDP per capita >= median and 0 otherwise). Results in Table
6 Panel A show that conventional banks in rich countries tend to hold more additional capital as a
response to a stronger protection for creditors while the findings are not supportive for Islamic banks. The
results are consistently positive and significant at the 1% level in Models (1) and (2) and for the full
sample, thus confirming the findings Djankov et al. (2007) and our expectations.
CARijt = α + ∑ βINC × CRjt × INCjt
INC
INC=1
+ ∑ βR × CRjt × INCjt × Islamici +
INC
INC=1
β2 × Bank_charaijt−1 + β3
× Macro_charajt + ∑ βt × YFEt
T
T=1
+ εit (4)
Second, we refer to the law and finance literature and examine whether legal origins can affect the
association between creditor rights and bank capital decisions. According to Djankov et al. (2007) there
are five main legal origins: English, French, German, Nordic, and Socialist. Because our study only
concentrates on countries where conventional and Islamic banks operate, we count the existence of the
first three legal origins: 1) the English legal origin refers to the common law on England, and colonies to
which it spread, such as the KSA, the UAE, and Iran; 2) the French legal origin refers to the civil law of
France, and of their formal colonies, such as Algeria, Indonesia, and Turkey; and 3) the German legal
origin refers to the laws of the Germanic countries in central Europe such as Bosnia. We use Eq. (4) and
interact creditor rights with the three legal dummy variables. Table 7 Panel B suggests that in the
presence of stronger protection for creditors in common law countries, conventional banks tend to hold
18
much higher capital ratios to gain confidence from depositors, than in other legal systems. However,
again, Islamic banks are not affected. The results are stronger when replacing capital adequacy ratio with
core capital ratios (Models 2 and 6).
[Insert Table 7 around here]
Third, we test whether bank decision to hold higher capital ratios in the presence of more protective
environment for creditors is affected by the level of experience of the two bank types. We also use Eq. (4)
and interact creditor rights with three dummy variables that represent bank experience.6 Table 8 Panel A
results are consistently showing that in the presence of stronger creditor rights, mature conventional
banks tend to hold higher capital ratios to preserve depositors’ confidence. Interestingly, the results show
that in the presence of stronger creditor rights, young Islamic banks are also inclined to hold higher
capital ratios compared to their young conventional counterparts, and the rest of Islamic banks. The F-test
(Wald) for the degree of significance between creditor rights’ coefficients of Islamic and conventional
banks confirm these findings. The significant positive effect on young Islamic banks’ capital implies that
less experienced and less reputable banks might effectively need to hold higher capital ratios to gain
confidence of customers and attract new depositors.
Finally, we control for the fluctuation of the economy between periods of growth and financial
distress and examine whether the presence of strong creditor protection can influence bank decision to
hold higher capital during different periods of an economic cycle. Because the sample includes the
subprime crisis period, Table 8 Panel B uses the period before (1999–2006), during (2007–2009), and
after (2010–2013) the financial crisis. To do this, we also use Eq. (4) and interact creditor rights with
three dummy variables that represent periods (cycles) before, during, and after the subprime crisis. We
find that conventional banks in a highly protective environment for creditors tend to hold higher capital
ratios especially in the post crisis period but not Islamic ones. This could reflect the effect of stricter
6 Banks which have been operating for a period less than ten years old are categorized as young banks (equals 1 if young, 0
otherwise), and those which have been operating for a period ranging between ten and twenty years are considered middle-aged
banks (equals 1 if middle-aged, 0 otherwise). Finally, other banks which have been operating for more than twenty years are
considered mature banks (equals 1 if mature, 0 otherwise).

19
policies in terms of new banking regulatory guidelines and more protective institutional environment in
the period that followed the subprime crisis.
[Insert Table 8 around here]
7. Alternative estimation techniques
To examine the robustness of our main findings, we run a battery of alternative estimation
techniques. The results of these estimations are discussed in the following section and confirm our key
findings.
7.1. Other estimation methods
In this subsection, we examine the robustness of results using four alternative econometric
specifications. Table 9 Panel A reports the results from regressions using alternative techniques. First, we
use median regression because it is more robust to outliers and distributions with heavy tails. Second, we
use truncated regressions to address any bias related to the upper and the lower distribution of
observations for the dependent variable. Finally, we use logistic and probit regressions by creating a
binary variable that represents bank capital adequacy (equals 1 if bank capital ratio ≥ median and 0
otherwise) and examine whether the results hold. Importantly, the results in Table 9 Panel A show that
the estimated coefficients on creditor rights load significantly positively on bank capital in all these
estimations and models except for the sample of Islamic banks. 7 Panel B also suggests that conventional
banks hold higher capital adequacy ratio in the presence of a more protective environment for creditors
(𝛽1 is statistically significant) but not Islamic banks (𝛽1 + 𝛽3 is not significant) thus confirming that our
results are unaffected by the use of different estimation techniques.
[Insert Table 9 around here]
7.2. Additional control variables and propensity score matching
Although the empirical model is designed to mitigate the effect of omitted variables through the
inclusion of a large set of bank and country level control variables, one might argue that the positive
association between creditor rights and capital ratios is driven by other missing control variables or biased
by the number of banks in countries with higher creditor protection compared to countries with lower
7 We report the results for core capital ratio in Table A.3 in the Appendix.
20
creditor protection.8 Therefore, in a first step, we refer to the literature on bank regulation, monitoring and
supervision and control for additional country characteristics motivated by Barth et al. (2013) and Bitar et
al. (2016). In Table 10, Panel A, we add to the baseline model nine control variables that reflect
institutional environment: an index that measures regulatory barriers against bank engagement in
securitized market activities, insurance activities, and real estate investments (activity restrictions); an
index that captures the overall compliance of a country’s banking system with the Basel capital guidelines
(capital stringency), a measure that reflects the capacity of a country’s regulatory authority to take
corrective actions against bank management, bank owners and bank auditors in all circumstances
(supervisory power); a proxy measuring the number of mandatory policies on information transparency
(market discipline); a variable controlling for entry restrictions in terms of obtaining a banking licence
(entry requirements); a measure reflecting the informativeness of bank financial statements (information
disclosure); an indicator examining whether an external audit is required by regulatory authorities to
examine bank financial statements (audit); a proxy of the proportion of the ten biggest banks rated by
international rating agencies ( rated); and a dummy variable that takes on a value of 1if a country has an
explicit deposit insurance scheme and 0 otherwise (deposit insurance). In Panel A, we only report the
results for the coefficient of creditor rights to save space. These coefficients provide clear evidence that
the association between creditor rights and bank capital ratios is positive and significant in both the
sample of conventional banks and the entire sample while the results remain insignificant for Islamic
banks. In Panel B, we also add to the baseline model different factors of the world governance index,
including voice and accountability, political stability and absence of violence, government effectiveness,
regulatory quality, rule of law and control of corruption. The coefficients on creditor rights remain
unchanged for the two bank samples and the entire sample. Thus, our findings are not affected by the
inclusion of an additional set of control variables.
[Insert Table 10 around here]
In a second step, we employ a propensity score matching (PSM) technique proposed by Rosenbaum
and Raubin (1983) to verify the robustness of the results. PSM consists of matching observations of banks
based on the probability of increasing the country’s creditor rights. The comparison between banks in
countries with higher creditor protection and banks in countries with lower creditor protection is then
studied on the matched sample. To implement PSM, we create a creditor rights dummy variable that takes
on a value of one if a country’s creditor rights index has a value greater than or equal to the median, and
8 We report the results for core capital ratio in Table A.4 in the Appendix.
21
zero otherwise. We then estimate a logit model where we regress the creditor rights dummy on all the
control variables used in the baseline model and the year fixed effects. We use the scores estimated to
match each observation between countries with higher and lower creditor rights. Additionally, we employ
three different matching methods: K-nearest neighbors with the nearest neighbor with n=5, n=7, and
n=10; the Gaussian Kernel matching; and the radius matching. In all matched samples in Table 10 Panel
C, we continue to find evidence that matched conventional banks in countries with higher creditor rights
tend to hold higher capital ratios compared to matched conventional banks in countries with lower
creditor rights. We report the T statistics for the differences between the treated, countries with high
creditor protection group and countries with low creditor protection control group for each of the
methods. For creditor rights, the differences between the treated and control group varies between 0.952
and 1.093% for the capital adequacy ratio of conventional banks, between 0.144 and 3.229% for the
capital adequacy ratio of Islamic banks, and between 0.623 and 1.366% for the entire sample. These
differences are statistically significant at the 1% levels, except differences in the sample of Islamic banks.
7.3. Endogeneity and self-selection bias
We complement the analysis and perform several tests to address the issue of endogeneity which
could bias the results. First, we use an instrumental variable approach (IV) to mitigate concerns of
endogeneity. We regress the profitability ratio on instruments and regressors as reported in baseline
models (i.e. Table 2). Then, the predicted values of profitability replace the ratio in the baseline models.
Current literature on Islamic and conventional banks is largely silent about endogeneity and lacks of
specific instruments that can be used when examining the association between creditor rights and bank
capital. In this study, we refer to Meslier et al. (2017) and use the two-year lagged value of the
profitability ratio, the profitability ratio of the banking industry, as well as the lagged values of the bank-
and the country-level control variables. We also follow Barth et al. (2009) and conduct an F-test of the
excluded exogenous variables in the first-stage regressions. The null hypothesis of the test is that our
instrument does not explain cross-sectional differences in capital regulatory guidelines and measures. We
reject the null hypothesis at the 1% level in all models. The Kleibergen-Paap F-statistics indicate that our
instruments are valid. In addition, the non-significant value of the Hansen J-statistics (over-identification
test) shows that our instruments are not correlated with the error term. The results of the first-stage
regressions are reported in Table 11 Panel A, Models (1), (6), and (9) and mainly show that the two
instruments are positively associated with conventional and Islamic banks’ capital adequacy ratio. The
results of the second-stage regressions are reported in Table 11 Panel A, Models (2) and (3) for
22
conventional banks, Models (7) and (8) for Islamic banks, and (10) and (11) for the entire sample. We use
two estimation techniques: (1) Two Least Squares regression (2SLS) and (3) Generalized Method of
Moments (GMM). The second stage regression results show clear evidence of a positive and significant
association at the 1% level between creditor rights and capital ratios for conventional banks and the entire
sample while the effect is almost never significant for Islamic banks, thus providing additional support for
our earlier findings and suggest that the results are not driven by endogeneity. Table 11 Panels B and C
report the results after considering the effect of the interaction between creditor rights and bank market
power. The findings continue to show that both bank types have a similar behavior in holding higher
capital ratios when market power is strong (we also use core capital ratio as dependent variable in
appendix A.5).
[Insert Table 11 around here]
Second, we use a Heckman (1979) selection approach to correct for a potential self-selection bias.
The main objective of this technique is to control for any bias in sample choice between highly
capitalized banks and less capitalized ones. In a first step, we estimate a probit model that regresses a
dummy variable – that takes on a value of one if a bank’s capital adequacy ratio or core capital ratio has a
value greater than or equal to the median and zero otherwise – on the two instruments used before (cf.
lagged value of the profitability ratio and the profitability ratio of the banking industry) in addition to
bank- and country-level control variables and year fixed effect. In the second stage regression, we use the
capital adequacy ratio as the dependent variable (we also use core capital ratio as dependent variable in
appendix A.5), the creditor rights index as the independent variable, completed with the same control
variables and a self-selection parameter (measured as the inverse Mills ratio) estimated from the first-
stage regression. The results of the first stage regressions are reported in Table 11, Panel A, Models (4),
(9), and (14) and show that the two instruments are positively associated with the capital adequacy ratios.
The results of the second-stage regressions are also reported in Table 11, Panel A, Models (5), (10), and
(15) and continue to suggest that conventional banks are more capitalized in countries with higher
creditor rights index while the results are insignificant for Islamic banks. Table 11 Panels B and C report
very similar results after considering the effect of the interaction between creditor rights and bank market
power. Therefore, our results remain robust even after correcting for a potential self-selection bias.
23
8. Concluding remarks
The primary contribution of this paper is the investigation on whether creditor rights are an
important feature in shaping bank capital decisions for conventional and Islamic banks. Our findings
consistently indicate that in the presence of stronger creditor protection – and in particular, its
components related to the capacity of creditors to liquidate bank assets in cases of bankruptcy and putting
restrictions on any reorganisation plan by the bank management and thus giving greater bargaining power
to creditors against managers and shareholders – conventional banks tend to hold higher capital ratios
presumably to secure depositors’ confidence.
Our findings point to the importance of creditor protection as an additional tool that can used by
regulators and policy makers in aligning the interest of conventional banks’ managers and shareholders
with their depositors. In this regard, our findings are in line with those of Demirgüç-Kunt et al. (2013),
who document that by holding higher capital ratios bank managers become more prudent in their
investment decisions. In addition, higher capital ratios help preserving depositors’ confidence by creating
strong screening and monitoring incentives, which reduces bank leverage and risk taking incentives.
As regards Islamic banks, we find no significant association between creditor rights and capital
decisions. We relate this weak association to the specificities of Islamic banks where the PLS principle
imposed by the Sharia’a law considers Islamic bank depositors as investors who agree to share profits
and losses with the bank, thus neglecting the effect of creditor protection. As word of caution, however,
in less religious countries with strong market power, bank managers might be forced to protect their
depositors to avoid withdrawal risk and maintain their market share of deposits. Our findings provide
evidence that in such an environment, creditor rights do play a role in explaining the level of capital held
by both conventional and Islamic banks. Under such conditions, Sharia’a compliant deposits and
conventional deposits might be closer substitutes.
The current study adds to the conventional and Islamic banking comparative studies by shedding
light on the law and finance literature. While most of previous studies have examined the determinants of
Islamic banks’ profitability, efficiency and risk taking, compared to their conventional counterparts, our
study looks into how institutional factors such as creditor rights could differently shape bank capital
decisions for conventional and Islamic banks. Our work has important policy implications for dual
banking systems as the determinants of capital and capital buffers are different for the two type of banks.
Regulators and supervisors need to account for such differences in their monitoring process and in the
required amount of capital (pillar two of Basel III) for each bank individually.
24
References
Abedifar, P., Molyneux, P., and Tarazi, A. (2013) Risk in Islamic banking. Review of Finance 17, 2035–
2096.
Acharya, V.V., Amihud, Y., and Litov, L. (2011) Creditor rights and corporate risk-taking, Journal of
Financial Economics 102, 150-166.
Anginer, D., and Demirgüç-Kunt, A. (2014) Bank capital and systemic stability. Policy Research Working
Paper No. 6948, The World Bank, Washington, DC.
Anginer, D., Demirgüç-Kunt, A., and Zhu, M. (2014) How does bank competition affect bank systemic
risk? Journal of Financial Intermediation 23, 1–26.
Arnold, B., Borio, C., Ellis, L., and Moshirian, F. (2012) Systemic risk, macroprudential policy framework,
monitoring financial systems and the evolution of capital adequacy, Journal of Banking & Finance
36, 3125–3132.
Bae, K-H., Goyal, V.K. (2009) Creditor rights, enforcement, and bank loans, The Journal of Finance 64,
823–860.
Barth, J., Lin, C., Lin, P., and Song, F. (2009) Corruption in bank lending to firms: Cross country micro
evidence on the beneficial role of competition and information sharing, Journal of Financial
Economics 91, 361–388.
Beck, T., Demirgüç-Kunt, A., and Merrouche, O. (2013) Islamic vs. conventional banking: Business model,
efficiency and stability, Journal of Banking & Finance 37, 433–447.
Bennardo, A., Pagano, M., and Piccolo, S. (2015) Multiple bank lending, creditor rights, and information
sharing, Review of Finance 19, 519–570.
Bitar, M., Hassan, M.K., Pukthuanthong, K., and Walker, T. (2016) The performance of Islamic vs.
conventional banks: A note on the suitability of capital ratios, Working paper, John Molson School
of Business, Concordia University.
Bitar, M., Saad, W., and Benlemlih, M. (2016) Bank risk and performance in the MENA region: The
importance of capital requirements, Economic Systems 40, 398–421.
Bitar, M., Hassan, M.K., and Walker, T. (2017) Political systems and the financial soundness of Islamic
banks, Journal of Financial Stability 31, 18–44.
Cho, S. S., El-Ghoul, S., Guedhami, O., and Suh, J. (2014) Creditor rights and capital structure: Evidence
from international data, Journal of Corporate Finance 25, 40–60.
Daher, M. (2017) Creditor control rights, capital structure, and legal enforcement, Journal of Corporate
Finance 44, 308–330.
Demirgüç-Kunt, A., Detragiache, E., and Merrouche, O. (2013) Bank capital: Lessons from the financial
crisis, Journal of Money, Credit and Banking 45, 1147–1164.
Djankov, S., McLiesh, C. and Shleifer, A. (2007) Private credit in 129 countries, Journal of Financial
Economics 84, 299-329.
El-Gamal, M. (2007) Incoherence of contract-based Islamic financial jurisprudence in the age of financial
engineering, Rice University, mimeo.
Esty, B.C., and Megginson, W.L. (2003) Creditor rights, enforcement, and debt ownership structure:
Evidence from the global syndicated loan market, The Journal of Financial and Quantitative Analysis
38, 37–59.
Ghosh, S. (2016) Political transition and bank performance: how important was the Arab Spring? Journal
of Comparative Economics 44, 372–382.
González, F. (2016) Creditor rights, bank competition, and corporate investment during the global financial
crisis, Journal of Corporate Finance 37, 249–270.
25
Holmstrom, B., and Tirole, J. (1997) Financial Intermediation, Loanable Funds, and the Real Sector,
Quarterly Journal of Economics 112, 663–91.
Houston, J.F., Lin, C., Lin, P., and Ma, Y. (2010) Creditor rights, information sharing, and bank risk taking,
Journal of Financial Economics 96, 485–512.
Islamic Financial Services Board (IFSB) (2005) Capital adequacy standard for institutions (other than
insurance institutions) offering only Islamic financial services, Islamic Financial Services Board,
Malaysia.
Islamic Financial Services Board (IFSB) (2010) Guidance note on the practice of smoothing the profits
payout to investment accounts holders, Islamic Financial Services Board, Malaysia.
Islamic Financial Services Board (IFSB). (2011) Guidance note in connection with the IFSB capital
adequacy standard: The determination of Alfa in the capital adequacy ratio for institutions (other than
insurance institutions) offering only financial Islamic services, Islamic Financial Services Board,
Malaysia.
Jayaraman, S. and Thakor, A.V. (2013) The effect of creditor rights on bank monitoring, capital structure
and risk-taking, Finance working paper 387, European Corporate Governance Institute.
La Porta, R., Lopez-de-Silanes, F., Shleifer, A., and Vishny, R.W. (1997) Legal determinants of external
finance, The Journal of Finance 52, 1131–1150.
Meslier, C., Risfandy, T., and Tarazi, A. (2017) Dual market competition and deposit rate setting in Islamic
and conventional banks, Economic Modelling 63, 318 – 333.
Mollah, S. and Zaman, M. (2015) Shari’ah supervision, corporate governance, and performance:
Conventional vs. Islamic banks, Journal of Banking & Finance 58, 418–435.
Mollah, S., Hassan, K., Al-Farooque, O., and Mobarek, A. (2016) The governance, risk-taking, and
performance of Islamic banks, Journal of Financial Services Research, Forthcoming (In press).
Qian, J. and Strahan, P. E. (2007) How laws and institutions shape financial contracts: The case of bank
loans, The Journal of Finance 62, 2803–2834
Rajan, R.G., and Zingales, L. (1995) What do we know about capital structure? Some evidence from
international data. The Journal of Finance 50, 1421–1460.
Rosenbaum, P.R. and Rubin, D.B. (1983) The central role of the propensity score in observational studies
for causal effects, Biometrika 70, 41–55.
Soedarmono, W., Machrouh, F., Tarazi, A. (2011) Bank market power, economic growth and financial
stability: Evidence from Asian banks, Journal of Asian Economics 22, 460–470.
Turk-Ariss, R. (2010a) Competitive conditions in Islamic and conventional banking: A global perspective,
Review of Financial Economics 19, 101–108.
Turk-Ariss, R. (2010b) On the implications of market power in banking: Evidence from developing
countries, Journal of Banking & Finance 34, 765–775.
Weill, L. (2011) Do Islamic Banks Have Greater Market Power? Comparative Economics Studies 53, 291–
306.
26
Tables
Table 1
Summary statistics
Capital
adequacy
Core
capital
Creditor
rights
Size
Profitably
Risk
Liquidity
Tangibility
Governance GDP
growth
Inflation Oil Minerals
Panel A. Descriptive statistics by country
Albania 19.78 13.99 3.00 12.61 0.49 52.05 45.67 2.33 -0.39 5.03 3.15 2.11 0.24 Algeria 23.78 19.65 1.00 14.09 1.50 61.20 54.73 2.60 -0.87 3.61 9.00 22.99 0.12
Bangladesh 11.84 9.61 2.00 13.28 0.83 62.93 27.60 1.56 -0.89 5.82 5.43 0.11 0.00 Bosnia 21.51 23.62 3.00 12.15 0.42 73.64 49.35 5.49 -0.40 3.89 5.21 0.00 0.55
Egypt 16.67 13.34 2.00 14.53 0.85 41.42 37.78 1.20 -0.53 4.41 8.14 8.22 0.20
Indonesia 22.60 17.44 2.00 13.59 1.18 53.43 42.66 1.60 -0.63 5.11 10.67 4.14 1.65 Iran 16.71 17.30 2.00 16.03 1.47 60.22 30.33 3.59 -1.62 3.96 18.04 25.87 0.65
Jordan 22.21 20.99 1.00 14.64 1.13 44.89 42.18 1.63 -0.02 5.26 4.76 0.00 1.26
Kenya 24.43 22.29 4.00 11.97 1.58 66.21 41.86 2.91 -0.72 4.18 6.44 0.00 0.07 Kuwait 20.91 18.92 3.00 15.63 1.27 45.96 39.58 2.69 0.20 4.63 10.10 49.39 0.00
Lebanon 19.75 16.23 4.00 13.82 0.69 26.89 41.73 2.65 -0.55 4.34 2.14 0.00 0.00
Malaysia 20.66 17.75 3.00 15.14 0.89 50.31 45.16 0.49 0.35 5.13 3.48 6.63 0.11 Mauritania 27.60 . 1.00 11.49 1.28 50.58 50.03 5.56 -0.55 4.37 6.14 4.35 25.22
Pakistan 19.74 17.53 1.00 13.22 0.24 40.99 28.13 2.88 -1.01 4.05 10.94 0.83 0.05
Saudi Arabia 19.74 18.70 3.00 16.60 2.13 53.46 33.07 1.36 -0.22 5.10 6.58 43.80 0.02 Senegal 21.12 19.25 0.00 12.36 1.05 68.97 25.80 3.01 1.49 3.94 2.29 0.00 0.86
Singapore 28.51 26.00 3.00 15.31 1.04 46.52 35.23 0.41 0.33 5.77 0.87 0.00 0.00
South Africa 17.97 15.35 3.00 13.99 1.16 75.59 27.46 1.05 -1.52 3.34 7.10 0.12 2.18 Syria 29.59 26.87 3.00 13.45 0.46 35.27 79.44 3.94 -0.09 3.05 7.01 22.11 0.00
Tunisia 23.04 22.33 0.00 13.71 0.61 61.01 43.77 1.89 -0.12 4.11 3.54 3.76 0.65
Turkey 18.89 16.40 2.00 15.17 1.50 48.52 43.13 1.98 0.51 3.90 19.76 0.16 0.14
UAE 21.39 18.64 2.00 15.41 1.98 61.55 33.29 1.44 1.47 4.55 7.96 20.59 0.00
UK 21.00 15.54 4.00 14.32 0.37 37.45 70.65 0.86 -0.92 1.90 2.20 1.02 0.00
Yemen 29.74 19.22 0.00 12.34 0.62 24.06 51.44 2.45 -1.12 2.70 13.36 28.59 0.00
Panel B. Descriptive statistics for conventional banks
N 3633 2565 360 6257 6227 6211 5820 6094 360 360 360 360 360
Mean 20.07 16.54 2.75 14.01 1.00 49.83 45.79 1.80 -0.47 3.89 6.20 4.13 0.70
Min 10.05 7.51 0.00 9.69 -9.54 3.06 2.16 0.01 -1.62 -15.09 -18.93 0.00 0.00 Q1 13.40 10.45 2.00 12.54 0.40 33.03 20.52 0.50 -0.91 2.37 2.17 0.05 0.00
Median 16.60 14.06 3.00 13.86 1.01 52.24 34.27 1.12 -0.68 3.95 4.35 0.96 0.01
Q3 22.74 19.11 4.00 15.31 1.75 67.24 57.84 2.21 -0.22 5.78 8.26 4.34 0.32 Max 49.01 42.25 4.00 19.89 8.23 88.74 314.97 13.43 1.66 17.32 54.18 59.60 44.64
SD 10.11 8.77 1.18 2.09 2.00 22.75 42.55 2.20 0.66 2.95 7.69 8.59 3.32
Panel C. Descriptive statistics for Islamic banks
N 612 537 360 926 923 916 876 909 360 360 360 360 360
Mean 22.69 20.26 2.24 14.10 0.59 53.73 46.91 2.43 -0.35 4.44 8.78 13.26 0.57
Min 9.43 7.70 0.00 10.76 -20.14 0.03 1.46 0.00 -1.93 -15.09 -18.93 0.00 0.00
Q1 13.01 11.00 2.00 12.64 0.31 41.51 19.00 0.59 -0.96 3.00 3.30 0.82 0.00 Median 16.03 14.10 2.00 14.28 0.84 58.85 28.89 1.56 -0.45 4.86 6.81 6.00 0.03
Q3 23.10 21.28 3.00 15.50 1.54 69.58 48.82 2.95 0.31 6.15 12.60 22.50 0.33
Max 86.00 79.80 4.00 16.93 14.58 98.86 546.19 17.23 1.66 17.32 54.18 59.60 44.64 SD 17.97 16.55 0.99 1.79 3.13 22.94 68.97 3.05 0.87 3.27 9.02 15.45 2.78
Notes: This table presents descriptive statistics by country for the full sample (Panel A), for the sample of conventional banks (Panel B), and for the sample of Islamic banks
(Panel C). The reported values in Panel A are the means of the respective variables for each country. The sample consists of 793 conventional and Islamic banks operating in 24 countries over the period 1999–2013.
27
Table 2
The impact of creditor rights on bank capital ratios
Notes: Standard errors are clustered at the bank level and are reported in parentheses below their coefficient estimates.
* Statistical significance at the 10% level. ** Statistical significance at the 5% level.
*** Statistical significance at the 1% level.
Panel A. The impact of creditor rights on bank capital ratios
Model #
Expected
Signs
Conventional banks Islamic banks Full sample
Capital adequacy ratio Core capital ratio Capital adequacy ratio Core capital ratio Capital adequacy ratio Core capital ratio
(1) (2) (3) (4) (5) (6) (7) (8) (9) (10) (11) (12)
Creditor rights ? 0.354**
(0.171)
0.417**
(0.174)
0.539***
(0.175)
0.547***
(0.188)
0.918*
(0.505)
0.46
(0.555)
0.786
(0.515)
0.247
(0.604)
0.364**
(0.171)
0.440**
(0.171)
0.567***
(0.172)
0.564***
(0.182) Size - -0.688***
(0.089)
-0.709***
(0.088)
-0.938***
(0.083)
-0.942***
(0.085)
-1.287***
(0.327)
-1.681***
(0.308)
-1.666***
(0.378)
-2.096***
(0.344)
-0.713***
(0.085)
-0.75***
(0.085)
-0.972***
(0.082)
-0.992***
(0.084)
Profitability + 0.090** (0.044)
0.082* (0.045)
0.189*** (0.058)
0.188*** (0.059)
0.219*** (0.077)
0.192*** (0.067)
0.414*** (0.078)
0.365*** (0.073)
0.096** (0.039)
0.083** (0.039)
0.21*** (0.049)
0.201*** (0.049)
Risk +/- -0.041***
(0.009)
-0.043***
(0.008)
-0.041***
(0.010)
-0.043***
(0.011)
-0.005
(0.009)
0.003
(0.010)
-0.021
(0.014)
-0.013
(0.016)
-0.036***
(0.007)
-0.038***
(0.007)
-0.036***
(0.008)
-0.037***
(0.008) Liquidity +/- 0.004
(0.004)
0.005
(0.004)
-0.001
(0.008)
-0.001
(0.009)
0.004
(0.003)
0.006*
(0.004)
-0.001
(0.004)
-0.000
(0.004)
0.004*
(0.002)
0.006**
(0.003)
0.001
(0.004)
0.002
(0.005)
Tangibility +/- 0.132* (0.068)
0.109 (0.071)
0.051 (0.076)
0.009 (0.078)
0.427*** (0.157)
0.253 (0.156)
0.605*** (0.174)
0.437** (0.178)
0.168*** (0.063)
0.137** (0.065)
0.145* (0.076)
0.104 (0.079)
Governance +/- 1.244***
(0.271)
1.167***
(0.272)
1.653***
(0.231)
1.672***
(0.249)
1.7***
(0.530)
1.674***
(0.534)
1.828***
(0.552)
1.726***
(0.591)
1.267***
(0.242)
1.164***
(0.241)
1.61***
(0.210)
1.513***
(0.218) GDP growth + -0.022
(0.025)
-0.06
(0.021)
-0.053
(0.056)
-0.034
(0.073)
-0.027
(0.023)
-0.021
(0.021)
Inflation +/- -0.025* (0.013)
-0.008 (0.011)
-0.062** (0.026)
-0.049** (0.024)
-0.026** (0.011)
-0.014 (0.010)
Oil + 0.048***
(0.012)
0.019
(0.014)
0.144***
(0.025)
0.146***
(0.023)
0.062***
(0.012)
0.048***
(0.013)
Mineral + 0.159**
(0.069)
0.206**
(0.099)
0.247*
(0.146)
0.189
(0.116)
0.157**
(0.067)
0.2**
(0.085) Islamic ? -1.450
(1.227)
-1.211
(1.234)
0.565
(1.250)
0.782
(1.250)
Islamic × Creditor rights
? 0.453 (0.496)
0.099 (0.495)
-0.119 (0.532)
-0.425 (0.532)
Constant 28.44***
(1.498)
28.71***
(1.480)
29.81***
(1.598)
29.88***
(1.659)
33.26***
(5.080)
38.60***
(4.808)
38.23***
(5.816)
44.00***
(5.035)
28.48***
(1.406)
28.85***
(1.379)
29.76***
(1.414)
29.87***
(1.435) N 3,129 3,020 2,276 2,194 445 423 390 369 3,574 3,443 2,666 2,563
Year dummy Yes Yes Yes Yes Yes Yes Yes Yes Yes Yes Yes Yes
R2 0.179 0.22 0.239 0.271 0.246 0.382 0.25 0.38 0.185 0.232 0.233 0.282 Chi2 0.000*** 0.000*** 0.000*** 0.000*** 0.000*** 0.000*** 0.000*** 0.000*** 0.000*** 0.000*** 0.000*** 0.000***
Panel B. Impact of creditor rights on capital ratios of Islamic banks (𝛽1 + 𝛽3) compared to conventional banks (𝛽1)
? 0.817*
(0.461)
0.539
(0.465)
0.448
(0.502)
0.139
(0.503)
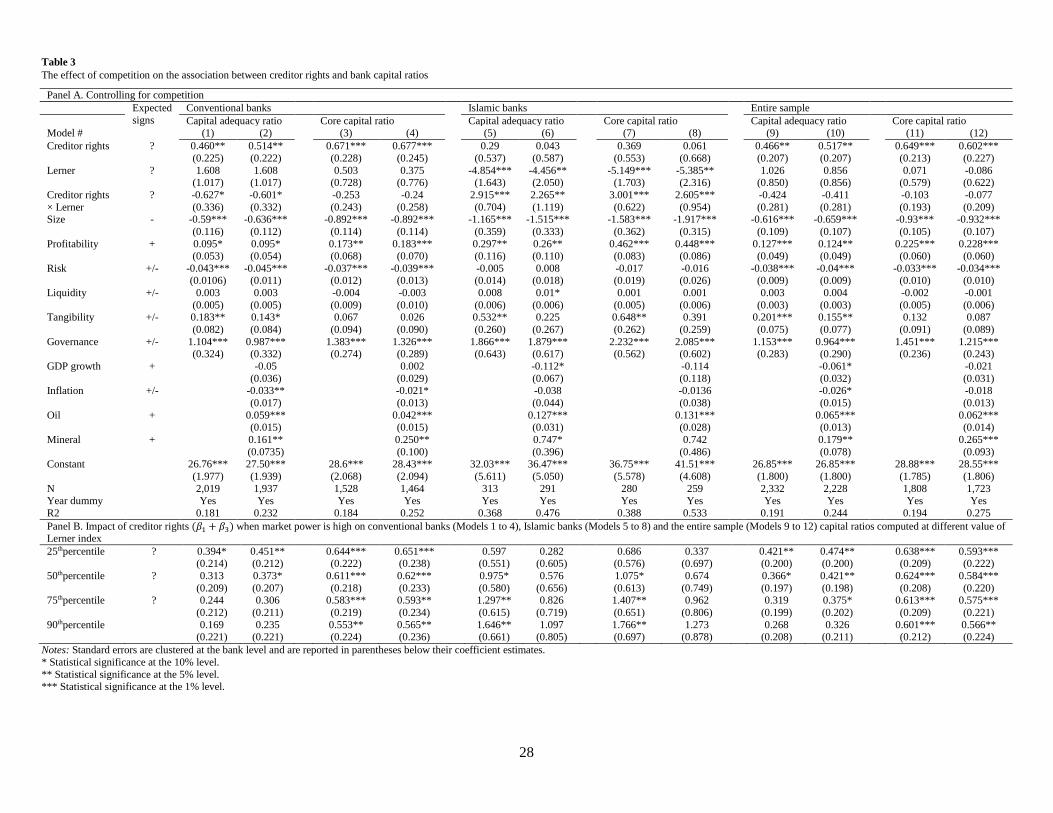
28
Table 3
The effect of competition on the association between creditor rights and bank capital ratios
Notes: Standard errors are clustered at the bank level and are reported in parentheses below their coefficient estimates.
* Statistical significance at the 10% level.
** Statistical significance at the 5% level. *** Statistical significance at the 1% level.
Panel A. Controlling for competition
Expected
signs
Conventional banks Islamic banks Entire sample
Capital adequacy ratio Core capital ratio Capital adequacy ratio Core capital ratio Capital adequacy ratio Core capital ratio Model # (1) (2) (3) (4) (5) (6) (7) (8) (9) (10) (11) (12)
Creditor rights ? 0.460**
(0.225)
0.514**
(0.222)
0.671***
(0.228)
0.677***
(0.245)
0.29
(0.537)
0.043
(0.587)
0.369
(0.553)
0.061
(0.668)
0.466**
(0.207)
0.517**
(0.207)
0.649***
(0.213)
0.602***
(0.227)
Lerner ? 1.608 (1.017)
1.608 (1.017)
0.503 (0.728)
0.375 (0.776)
-4.854*** (1.643)
-4.456** (2.050)
-5.149*** (1.703)
-5.385** (2.316)
1.026 (0.850)
0.856 (0.856)
0.071 (0.579)
-0.086 (0.622)
Creditor rights
× Lerner
? -0.627*
(0.336)
-0.601*
(0.332)
-0.253
(0.243)
-0.24
(0.258)
2.915***
(0.704)
2.265**
(1.119)
3.001***
(0.622)
2.605***
(0.954)
-0.424
(0.281)
-0.411
(0.281)
-0.103
(0.193)
-0.077
(0.209) Size - -0.59***
(0.116)
-0.636***
(0.112)
-0.892***
(0.114)
-0.892***
(0.114)
-1.165***
(0.359)
-1.515***
(0.333)
-1.583***
(0.362)
-1.917***
(0.315)
-0.616***
(0.109)
-0.659***
(0.107)
-0.93***
(0.105)
-0.932***
(0.107)
Profitability + 0.095*
(0.053)
0.095*
(0.054)
0.173**
(0.068)
0.183***
(0.070)
0.297**
(0.116)
0.26**
(0.110)
0.462***
(0.083)
0.448***
(0.086)
0.127***
(0.049)
0.124**
(0.049)
0.225***
(0.060)
0.228***
(0.060)
Risk +/- -0.043*** (0.0106)
-0.045*** (0.011)
-0.037*** (0.012)
-0.039*** (0.013)
-0.005 (0.014)
0.008 (0.018)
-0.017 (0.019)
-0.016 (0.026)
-0.038*** (0.009)
-0.04*** (0.009)
-0.033*** (0.010)
-0.034*** (0.010)
Liquidity +/- 0.003
(0.005)
0.003
(0.005)
-0.004
(0.009)
-0.003
(0.010)
0.008
(0.006)
0.01*
(0.006)
0.001
(0.005)
0.001
(0.006)
0.003
(0.003)
0.004
(0.003)
-0.002
(0.005)
-0.001
(0.006) Tangibility +/- 0.183**
(0.082)
0.143*
(0.084)
0.067
(0.094)
0.026
(0.090)
0.532**
(0.260)
0.225
(0.267)
0.648**
(0.262)
0.391
(0.259)
0.201***
(0.075)
0.155**
(0.077)
0.132
(0.091)
0.087
(0.089)
Governance +/- 1.104*** (0.324)
0.987*** (0.332)
1.383*** (0.274)
1.326*** (0.289)
1.866*** (0.643)
1.879*** (0.617)
2.232*** (0.562)
2.085*** (0.602)
1.153*** (0.283)
0.964*** (0.290)
1.451*** (0.236)
1.215*** (0.243)
GDP growth + -0.05
(0.036)
0.002
(0.029)
-0.112*
(0.067)
-0.114
(0.118)
-0.061*
(0.032)
-0.021
(0.031) Inflation +/- -0.033**
(0.017)
-0.021*
(0.013)
-0.038
(0.044)
-0.0136
(0.038)
-0.026*
(0.015)
-0.018
(0.013)
Oil + 0.059***
(0.015)
0.042***
(0.015)
0.127***
(0.031)
0.131***
(0.028)
0.065***
(0.013)
0.062***
(0.014)
Mineral + 0.161**
(0.0735)
0.250**
(0.100)
0.747*
(0.396)
0.742
(0.486)
0.179**
(0.078)
0.265***
(0.093) Constant 26.76***
(1.977)
27.50***
(1.939)
28.6***
(2.068)
28.43***
(2.094)
32.03***
(5.611)
36.47***
(5.050)
36.75***
(5.578)
41.51***
(4.608)
26.85***
(1.800)
26.85***
(1.800)
28.88***
(1.785)
28.55***
(1.806)
N 2,019 1,937 1,528 1,464 313 291 280 259 2,332 2,228 1,808 1,723 Year dummy Yes Yes Yes Yes Yes Yes Yes Yes Yes Yes Yes Yes
R2 0.181 0.232 0.184 0.252 0.368 0.476 0.388 0.533 0.191 0.244 0.194 0.275
Panel B. Impact of creditor rights (𝛽1 + 𝛽3) when market power is high on conventional banks (Models 1 to 4), Islamic banks (Models 5 to 8) and the entire sample (Models 9 to 12) capital ratios computed at different value of Lerner index
25thpercentile ? 0.394* (0.214)
0.451** (0.212)
0.644*** (0.222)
0.651*** (0.238)
0.597 (0.551)
0.282 (0.605)
0.686 (0.576)
0.337 (0.697)
0.421** (0.200)
0.474** (0.200)
0.638*** (0.209)
0.593*** (0.222)
50thpercentile ? 0.313
(0.209)
0.373*
(0.207)
0.611***
(0.218)
0.62***
(0.233)
0.975*
(0.580)
0.576
(0.656)
1.075*
(0.613)
0.674
(0.749)
0.366*
(0.197)
0.421**
(0.198)
0.624***
(0.208)
0.584***
(0.220) 75thpercentile ? 0.244
(0.212)
0.306
(0.211)
0.583***
(0.219)
0.593**
(0.234)
1.297**
(0.615)
0.826
(0.719)
1.407**
(0.651)
0.962
(0.806)
0.319
(0.199)
0.375*
(0.202)
0.613***
(0.209)
0.575***
(0.221)
90thpercentile 0.169 (0.221)
0.235 (0.221)
0.553** (0.224)
0.565** (0.236)
1.646** (0.661)
1.097 (0.805)
1.766** (0.697)
1.273 (0.878)
0.268 (0.208)
0.326 (0.211)
0.601*** (0.212)
0.566** (0.224)
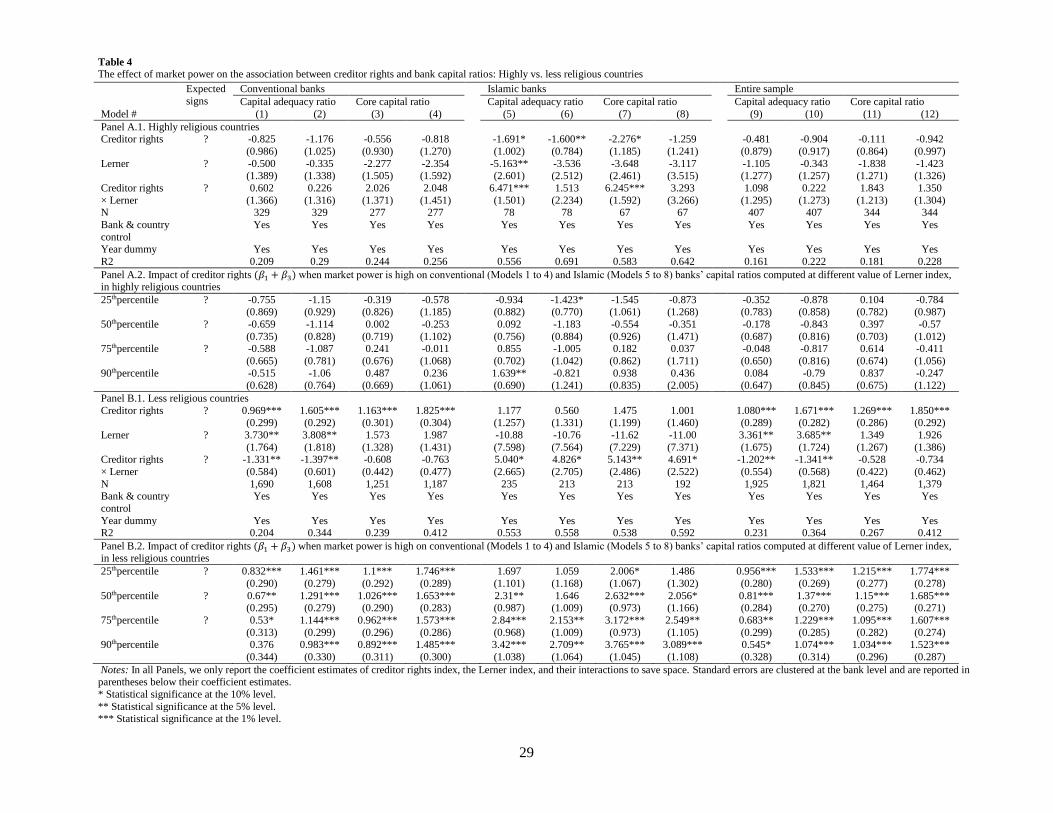
29
Table 4
The effect of market power on the association between creditor rights and bank capital ratios: Highly vs. less religious countries
Notes: In all Panels, we only report the coefficient estimates of creditor rights index, the Lerner index, and their interactions to save space. Standard errors are clustered at the bank level and are reported in parentheses below their coefficient estimates.
* Statistical significance at the 10% level.
** Statistical significance at the 5% level. *** Statistical significance at the 1% level.
Expected
signs
Conventional banks Islamic banks Entire sample
Capital adequacy ratio Core capital ratio Capital adequacy ratio Core capital ratio Capital adequacy ratio Core capital ratio
Model # (1) (2) (3) (4) (5) (6) (7) (8) (9) (10) (11) (12)
Panel A.1. Highly religious countries Creditor rights ? -0.825
(0.986)
-1.176
(1.025)
-0.556
(0.930)
-0.818
(1.270)
-1.691*
(1.002)
-1.600**
(0.784)
-2.276*
(1.185)
-1.259
(1.241)
-0.481
(0.879)
-0.904
(0.917)
-0.111
(0.864)
-0.942
(0.997)
Lerner ? -0.500 (1.389)
-0.335 (1.338)
-2.277 (1.505)
-2.354 (1.592)
-5.163** (2.601)
-3.536 (2.512)
-3.648 (2.461)
-3.117 (3.515)
-1.105 (1.277)
-0.343 (1.257)
-1.838 (1.271)
-1.423 (1.326)
Creditor rights
× Lerner
? 0.602
(1.366)
0.226
(1.316)
2.026
(1.371)
2.048
(1.451)
6.471***
(1.501)
1.513
(2.234)
6.245***
(1.592)
3.293
(3.266)
1.098
(1.295)
0.222
(1.273)
1.843
(1.213)
1.350
(1.304) N 329 329 277 277 78 78 67 67 407 407 344 344
Bank & country
control
Yes Yes Yes Yes Yes Yes Yes Yes Yes Yes Yes Yes
Year dummy Yes Yes Yes Yes Yes Yes Yes Yes Yes Yes Yes Yes
R2 0.209 0.29 0.244 0.256 0.556 0.691 0.583 0.642 0.161 0.222 0.181 0.228
Panel A.2. Impact of creditor rights (𝛽1 + 𝛽3) when market power is high on conventional (Models 1 to 4) and Islamic (Models 5 to 8) banks’ capital ratios computed at different value of Lerner index, in highly religious countries
25thpercentile ? -0.755 (0.869)
-1.15 (0.929)
-0.319 (0.826)
-0.578 (1.185)
-0.934 (0.882)
-1.423* (0.770)
-1.545 (1.061)
-0.873 (1.268)
-0.352 (0.783)
-0.878 (0.858)
0.104 (0.782)
-0.784 (0.987)
50thpercentile ? -0.659
(0.735)
-1.114
(0.828)
0.002
(0.719)
-0.253
(1.102)
0.092
(0.756)
-1.183
(0.884)
-0.554
(0.926)
-0.351
(1.471)
-0.178
(0.687)
-0.843
(0.816)
0.397
(0.703)
-0.57
(1.012) 75thpercentile ? -0.588
(0.665)
-1.087
(0.781)
0.241
(0.676)
-0.011
(1.068)
0.855
(0.702)
-1.005
(1.042)
0.182
(0.862)
0.037
(1.711)
-0.048
(0.650)
-0.817
(0.816)
0.614
(0.674)
-0.411
(1.056)
90thpercentile -0.515 (0.628)
-1.06 (0.764)
0.487 (0.669)
0.236 (1.061)
1.639** (0.690)
-0.821 (1.241)
0.938 (0.835)
0.436 (2.005)
0.084 (0.647)
-0.79 (0.845)
0.837 (0.675)
-0.247 (1.122)
Panel B.1. Less religious countries
Creditor rights ? 0.969***
(0.299)
1.605***
(0.292)
1.163***
(0.301)
1.825***
(0.304)
1.177
(1.257)
0.560
(1.331)
1.475
(1.199)
1.001
(1.460)
1.080***
(0.289)
1.671***
(0.282)
1.269***
(0.286)
1.850***
(0.292)
Lerner ? 3.730**
(1.764)
3.808**
(1.818)
1.573
(1.328)
1.987
(1.431)
-10.88
(7.598)
-10.76
(7.564)
-11.62
(7.229)
-11.00
(7.371)
3.361**
(1.675)
3.685**
(1.724)
1.349
(1.267)
1.926
(1.386) Creditor rights
× Lerner
? -1.331**
(0.584)
-1.397**
(0.601)
-0.608
(0.442)
-0.763
(0.477)
5.040*
(2.665)
4.826*
(2.705)
5.143**
(2.486)
4.691*
(2.522)
-1.202**
(0.554)
-1.341**
(0.568)
-0.528
(0.422)
-0.734
(0.462)
N 1,690 1,608 1,251 1,187 235 213 213 192 1,925 1,821 1,464 1,379 Bank & country
control
Yes Yes Yes Yes Yes Yes Yes Yes Yes Yes Yes Yes
Year dummy Yes Yes Yes Yes Yes Yes Yes Yes Yes Yes Yes Yes R2 0.204 0.344 0.239 0.412 0.553 0.558 0.538 0.592 0.231 0.364 0.267 0.412
Panel B.2. Impact of creditor rights (𝛽1 + 𝛽3) when market power is high on conventional (Models 1 to 4) and Islamic (Models 5 to 8) banks’ capital ratios computed at different value of Lerner index, in less religious countries
25thpercentile ? 0.832***
(0.290)
1.461***
(0.279)
1.1***
(0.292)
1.746***
(0.289)
1.697
(1.101)
1.059
(1.168)
2.006*
(1.067)
1.486
(1.302)
0.956***
(0.280)
1.533***
(0.269)
1.215***
(0.277)
1.774***
(0.278)
50thpercentile ? 0.67** (0.295)
1.291*** (0.279)
1.026*** (0.290)
1.653*** (0.283)
2.31** (0.987)
1.646 (1.009)
2.632*** (0.973)
2.056* (1.166)
0.81*** (0.284)
1.37*** (0.270)
1.15*** (0.275)
1.685*** (0.271)
75thpercentile ? 0.53*
(0.313)
1.144***
(0.299)
0.962***
(0.296)
1.573***
(0.286)
2.84***
(0.968)
2.153**
(1.009)
3.172***
(0.973)
2.549**
(1.105)
0.683**
(0.299)
1.229***
(0.285)
1.095***
(0.282)
1.607***
(0.274) 90thpercentile 0.376
(0.344)
0.983***
(0.330)
0.892***
(0.311)
1.485***
(0.300)
3.42***
(1.038)
2.709**
(1.064)
3.765***
(1.045)
3.089***
(1.108)
0.545*
(0.328)
1.074***
(0.314)
1.034***
(0.296)
1.523***
(0.287)
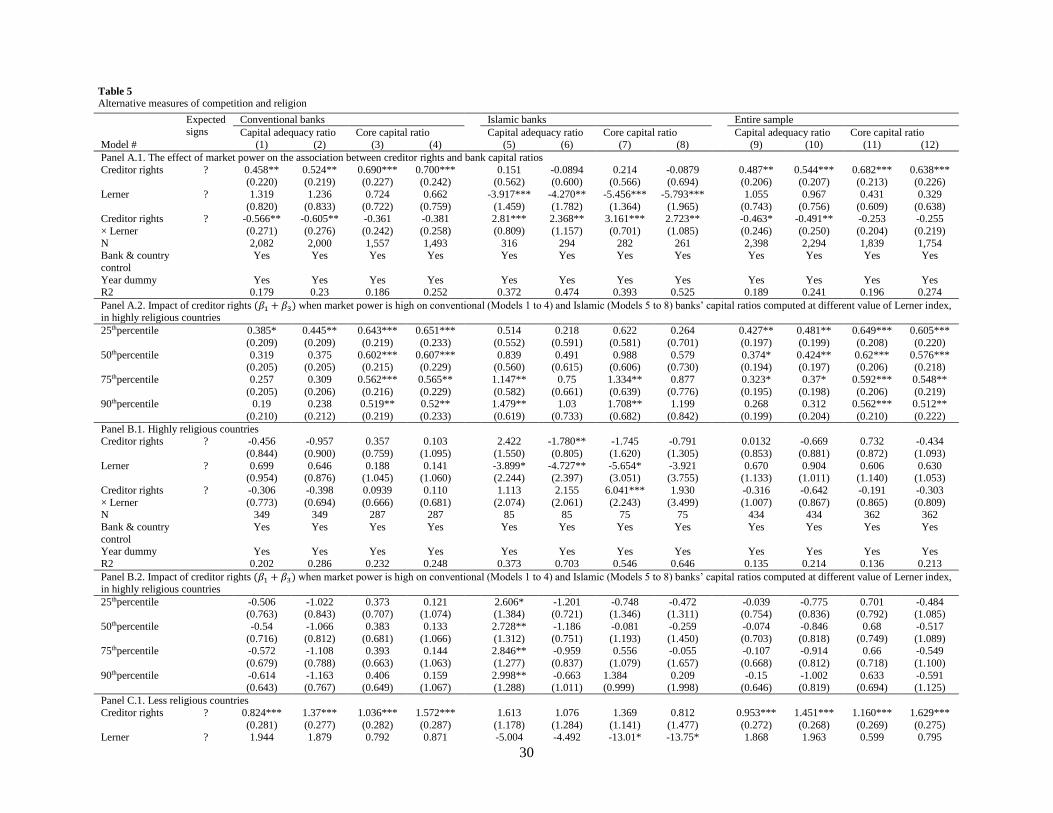
30
Table 5
Alternative measures of competition and religion
Expected signs
Conventional banks Islamic banks Entire sample
Capital adequacy ratio Core capital ratio Capital adequacy ratio Core capital ratio Capital adequacy ratio Core capital ratio Model # (1) (2) (3) (4) (5) (6) (7) (8) (9) (10) (11) (12)
Panel A.1. The effect of market power on the association between creditor rights and bank capital ratios
Creditor rights ? 0.458** (0.220)
0.524** (0.219)
0.690*** (0.227)
0.700*** (0.242)
0.151 (0.562)
-0.0894 (0.600)
0.214 (0.566)
-0.0879 (0.694)
0.487** (0.206)
0.544*** (0.207)
0.682*** (0.213)
0.638*** (0.226)
Lerner ? 1.319
(0.820)
1.236
(0.833)
0.724
(0.722)
0.662
(0.759)
-3.917***
(1.459)
-4.270**
(1.782)
-5.456***
(1.364)
-5.793***
(1.965)
1.055
(0.743)
0.967
(0.756)
0.431
(0.609)
0.329
(0.638) Creditor rights
× Lerner
? -0.566**
(0.271)
-0.605**
(0.276)
-0.361
(0.242)
-0.381
(0.258)
2.81***
(0.809)
2.368**
(1.157)
3.161***
(0.701)
2.723**
(1.085)
-0.463*
(0.246)
-0.491**
(0.250)
-0.253
(0.204)
-0.255
(0.219)
N 2,082 2,000 1,557 1,493 316 294 282 261 2,398 2,294 1,839 1,754
Bank & country
control
Yes Yes Yes Yes Yes Yes Yes Yes Yes Yes Yes Yes
Year dummy Yes Yes Yes Yes Yes Yes Yes Yes Yes Yes Yes Yes R2 0.179 0.23 0.186 0.252 0.372 0.474 0.393 0.525 0.189 0.241 0.196 0.274
Panel A.2. Impact of creditor rights (𝛽1 + 𝛽3) when market power is high on conventional (Models 1 to 4) and Islamic (Models 5 to 8) banks’ capital ratios computed at different value of Lerner index, in highly religious countries
25thpercentile 0.385*
(0.209)
0.445**
(0.209)
0.643***
(0.219)
0.651***
(0.233)
0.514
(0.552)
0.218
(0.591)
0.622
(0.581)
0.264
(0.701)
0.427**
(0.197)
0.481**
(0.199)
0.649***
(0.208)
0.605***
(0.220)
50thpercentile 0.319 (0.205)
0.375 (0.205)
0.602*** (0.215)
0.607*** (0.229)
0.839 (0.560)
0.491 (0.615)
0.988 (0.606)
0.579 (0.730)
0.374* (0.194)
0.424** (0.197)
0.62*** (0.206)
0.576*** (0.218)
75thpercentile 0.257
(0.205)
0.309
(0.206)
0.562***
(0.216)
0.565**
(0.229)
1.147**
(0.582)
0.75
(0.661)
1.334**
(0.639)
0.877
(0.776)
0.323*
(0.195)
0.37*
(0.198)
0.592***
(0.206)
0.548**
(0.219) 90thpercentile 0.19
(0.210)
0.238
(0.212)
0.519**
(0.219)
0.52**
(0.233)
1.479**
(0.619)
1.03
(0.733)
1.708**
(0.682)
1.199
(0.842)
0.268
(0.199)
0.312
(0.204)
0.562***
(0.210)
0.512**
(0.222)
Panel B.1. Highly religious countries Creditor rights ? -0.456
(0.844)
-0.957
(0.900)
0.357
(0.759)
0.103
(1.095)
2.422
(1.550)
-1.780**
(0.805)
-1.745
(1.620)
-0.791
(1.305)
0.0132
(0.853)
-0.669
(0.881)
0.732
(0.872)
-0.434
(1.093)
Lerner ? 0.699 (0.954)
0.646 (0.876)
0.188 (1.045)
0.141 (1.060)
-3.899* (2.244)
-4.727** (2.397)
-5.654* (3.051)
-3.921 (3.755)
0.670 (1.133)
0.904 (1.011)
0.606 (1.140)
0.630 (1.053)
Creditor rights
× Lerner
? -0.306
(0.773)
-0.398
(0.694)
0.0939
(0.666)
0.110
(0.681)
1.113
(2.074)
2.155
(2.061)
6.041***
(2.243)
1.930
(3.499)
-0.316
(1.007)
-0.642
(0.867)
-0.191
(0.865)
-0.303
(0.809) N 349 349 287 287 85 85 75 75 434 434 362 362
Bank & country
control
Yes Yes Yes Yes Yes Yes Yes Yes Yes Yes Yes Yes
Year dummy Yes Yes Yes Yes Yes Yes Yes Yes Yes Yes Yes Yes
R2 0.202 0.286 0.232 0.248 0.373 0.703 0.546 0.646 0.135 0.214 0.136 0.213
Panel B.2. Impact of creditor rights (𝛽1 + 𝛽3) when market power is high on conventional (Models 1 to 4) and Islamic (Models 5 to 8) banks’ capital ratios computed at different value of Lerner index,
in highly religious countries
25thpercentile -0.506 (0.763)
-1.022 (0.843)
0.373 (0.707)
0.121 (1.074)
2.606* (1.384)
-1.201 (0.721)
-0.748 (1.346)
-0.472 (1.311)
-0.039 (0.754)
-0.775 (0.836)
0.701 (0.792)
-0.484 (1.085)
50thpercentile -0.54
(0.716)
-1.066
(0.812)
0.383
(0.681)
0.133
(1.066)
2.728**
(1.312)
-1.186
(0.751)
-0.081
(1.193)
-0.259
(1.450)
-0.074
(0.703)
-0.846
(0.818)
0.68
(0.749)
-0.517
(1.089) 75thpercentile -0.572
(0.679)
-1.108
(0.788)
0.393
(0.663)
0.144
(1.063)
2.846**
(1.277)
-0.959
(0.837)
0.556
(1.079)
-0.055
(1.657)
-0.107
(0.668)
-0.914
(0.812)
0.66
(0.718)
-0.549
(1.100)
90thpercentile -0.614 (0.643)
-1.163 (0.767)
0.406 (0.649)
0.159 (1.067)
2.998** (1.288)
-0.663 (1.011)
1.384 (0.999)
0.209 (1.998)
-0.15 (0.646)
-1.002 (0.819)
0.633 (0.694)
-0.591 (1.125)
Panel C.1. Less religious countries
Creditor rights ? 0.824***
(0.281)
1.37***
(0.277)
1.036***
(0.282)
1.572***
(0.287)
1.613
(1.178)
1.076
(1.284)
1.369
(1.141)
0.812
(1.477)
0.953***
(0.272)
1.451***
(0.268)
1.160***
(0.269)
1.629***
(0.275) Lerner ? 1.944 1.879 0.792 0.871 -5.004 -4.492 -13.01* -13.75* 1.868 1.963 0.599 0.795
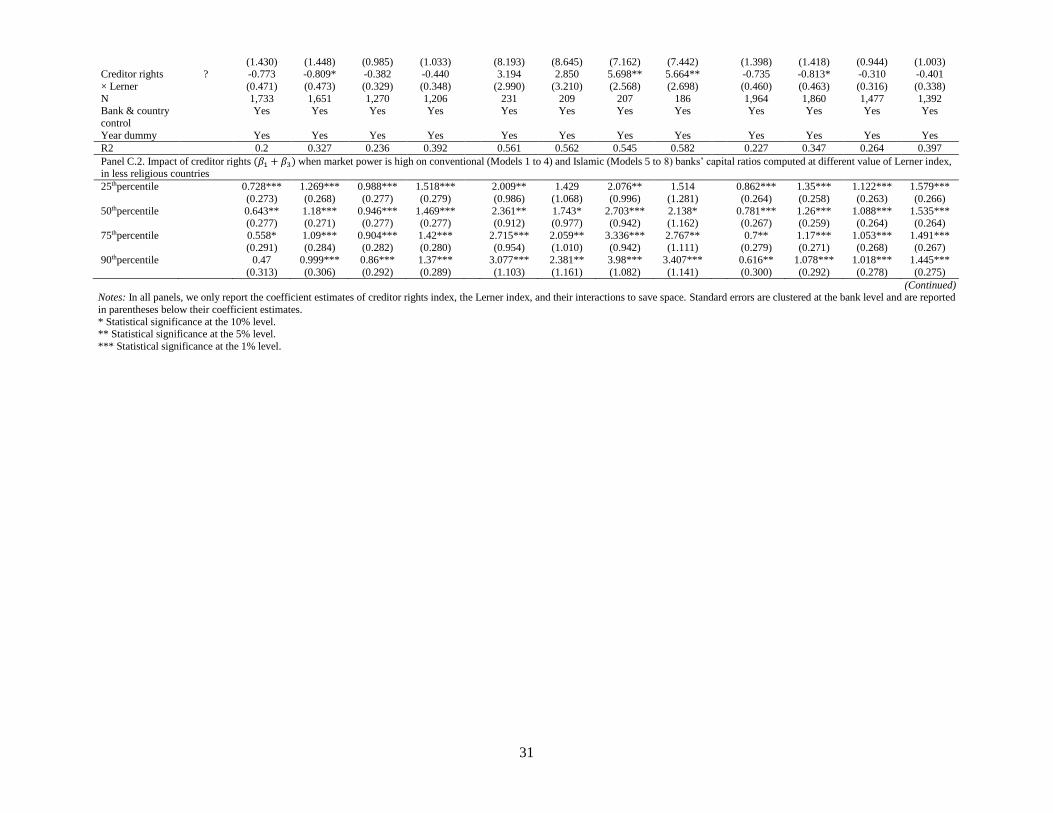
31
(Continued) Notes: In all panels, we only report the coefficient estimates of creditor rights index, the Lerner index, and their interactions to save space. Standard errors are clustered at the bank level and are reported
in parentheses below their coefficient estimates.
* Statistical significance at the 10% level. ** Statistical significance at the 5% level.
*** Statistical significance at the 1% level.
(1.430) (1.448) (0.985) (1.033) (8.193) (8.645) (7.162) (7.442) (1.398) (1.418) (0.944) (1.003) Creditor rights
× Lerner
? -0.773
(0.471)
-0.809*
(0.473)
-0.382
(0.329)
-0.440
(0.348)
3.194
(2.990)
2.850
(3.210)
5.698**
(2.568)
5.664**
(2.698)
-0.735
(0.460)
-0.813*
(0.463)
-0.310
(0.316)
-0.401
(0.338)
N 1,733 1,651 1,270 1,206 231 209 207 186 1,964 1,860 1,477 1,392 Bank & country
control
Yes Yes Yes Yes Yes Yes Yes Yes Yes Yes Yes Yes
Year dummy Yes Yes Yes Yes Yes Yes Yes Yes Yes Yes Yes Yes
R2 0.2 0.327 0.236 0.392 0.561 0.562 0.545 0.582 0.227 0.347 0.264 0.397
Panel C.2. Impact of creditor rights (𝛽1 + 𝛽3) when market power is high on conventional (Models 1 to 4) and Islamic (Models 5 to 8) banks’ capital ratios computed at different value of Lerner index, in less religious countries
25thpercentile 0.728***
(0.273)
1.269***
(0.268)
0.988***
(0.277)
1.518***
(0.279)
2.009**
(0.986)
1.429
(1.068)
2.076**
(0.996)
1.514
(1.281)
0.862***
(0.264)
1.35***
(0.258)
1.122***
(0.263)
1.579***
(0.266)
50thpercentile 0.643** (0.277)
1.18*** (0.271)
0.946*** (0.277)
1.469*** (0.277)
2.361** (0.912)
1.743* (0.977)
2.703*** (0.942)
2.138* (1.162)
0.781*** (0.267)
1.26*** (0.259)
1.088*** (0.264)
1.535*** (0.264)
75thpercentile 0.558*
(0.291)
1.09***
(0.284)
0.904***
(0.282)
1.42***
(0.280)
2.715***
(0.954)
2.059**
(1.010)
3.336***
(0.942)
2.767**
(1.111)
0.7**
(0.279)
1.17***
(0.271)
1.053***
(0.268)
1.491***
(0.267)
90thpercentile 0.47
(0.313)
0.999***
(0.306)
0.86***
(0.292)
1.37***
(0.289)
3.077***
(1.103)
2.381**
(1.161)
3.98***
(1.082)
3.407***
(1.141)
0.616**
(0.300)
1.078***
(0.292)
1.018***
(0.278)
1.445***
(0.275)
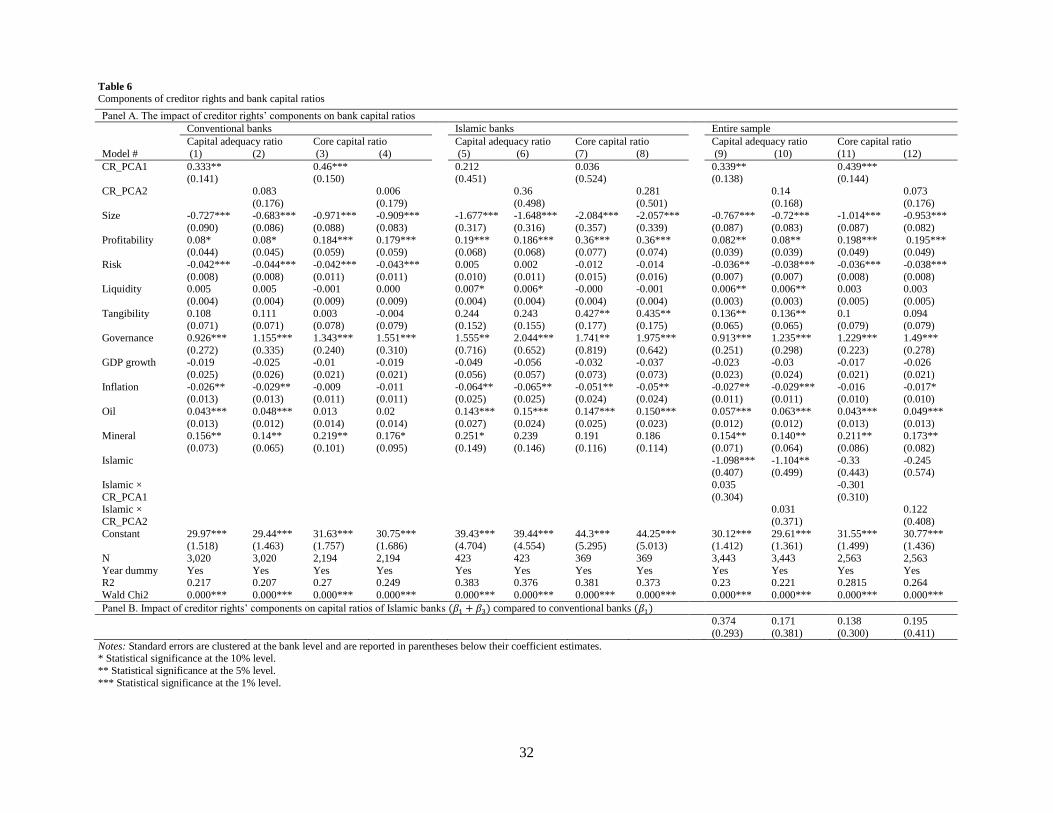
32
Table 6
Components of creditor rights and bank capital ratios
Notes: Standard errors are clustered at the bank level and are reported in parentheses below their coefficient estimates. * Statistical significance at the 10% level.
** Statistical significance at the 5% level.
*** Statistical significance at the 1% level.
Panel A. The impact of creditor rights’ components on bank capital ratios
Conventional banks Islamic banks Entire sample
Capital adequacy ratio Core capital ratio Capital adequacy ratio Core capital ratio Capital adequacy ratio Core capital ratio
Model # (1) (2) (3) (4) (5) (6) (7) (8) (9) (10) (11) (12)
CR_PCA1 0.333** (0.141)
0.46*** (0.150)
0.212 (0.451)
0.036 (0.524)
0.339** (0.138)
0.439*** (0.144)
CR_PCA2 0.083
(0.176)
0.006
(0.179)
0.36
(0.498)
0.281
(0.501)
0.14
(0.168)
0.073
(0.176) Size -0.727***
(0.090)
-0.683***
(0.086)
-0.971***
(0.088)
-0.909***
(0.083)
-1.677***
(0.317)
-1.648***
(0.316)
-2.084***
(0.357)
-2.057***
(0.339)
-0.767***
(0.087)
-0.72***
(0.083)
-1.014***
(0.087)
-0.953***
(0.082)
Profitability 0.08*
(0.044)
0.08*
(0.045)
0.184***
(0.059)
0.179***
(0.059)
0.19***
(0.068)
0.186***
(0.068)
0.36***
(0.077)
0.36***
(0.074)
0.082**
(0.039)
0.08**
(0.039)
0.198***
(0.049)
0.195***
(0.049)
Risk -0.042***
(0.008)
-0.044***
(0.008)
-0.042***
(0.011)
-0.043***
(0.011)
0.005
(0.010)
0.002
(0.011)
-0.012
(0.015)
-0.014
(0.016)
-0.036**
(0.007)
-0.038***
(0.007)
-0.036***
(0.008)
-0.038***
(0.008) Liquidity 0.005
(0.004)
0.005
(0.004)
-0.001
(0.009)
0.000
(0.009)
0.007*
(0.004)
0.006*
(0.004)
-0.000
(0.004)
-0.001
(0.004)
0.006**
(0.003)
0.006**
(0.003)
0.003
(0.005)
0.003
(0.005)
Tangibility 0.108 (0.071)
0.111 (0.071)
0.003 (0.078)
-0.004 (0.079)
0.244 (0.152)
0.243 (0.155)
0.427** (0.177)
0.435** (0.175)
0.136** (0.065)
0.136** (0.065)
0.1 (0.079)
0.094 (0.079)
Governance 0.926***
(0.272)
1.155***
(0.335)
1.343***
(0.240)
1.551***
(0.310)
1.555**
(0.716)
2.044***
(0.652)
1.741**
(0.819)
1.975***
(0.642)
0.913***
(0.251)
1.235***
(0.298)
1.229***
(0.223)
1.49***
(0.278) GDP growth -0.019
(0.025)
-0.025
(0.026)
-0.01
(0.021)
-0.019
(0.021)
-0.049
(0.056)
-0.056
(0.057)
-0.032
(0.073)
-0.037
(0.073)
-0.023
(0.023)
-0.03
(0.024)
-0.017
(0.021)
-0.026
(0.021)
Inflation -0.026** (0.013)
-0.029** (0.013)
-0.009 (0.011)
-0.011 (0.011)
-0.064** (0.025)
-0.065** (0.025)
-0.051** (0.024)
-0.05** (0.024)
-0.027** (0.011)
-0.029*** (0.011)
-0.016 (0.010)
-0.017* (0.010)
Oil 0.043***
(0.013)
0.048***
(0.012)
0.013
(0.014)
0.02
(0.014)
0.143***
(0.027)
0.15***
(0.024)
0.147***
(0.025)
0.150***
(0.023)
0.057***
(0.012)
0.063***
(0.012)
0.043***
(0.013)
0.049***
(0.013) Mineral 0.156**
(0.073)
0.14**
(0.065)
0.219**
(0.101)
0.176*
(0.095)
0.251*
(0.149)
0.239
(0.146)
0.191
(0.116)
0.186
(0.114)
0.154**
(0.071)
0.140**
(0.064)
0.211**
(0.086)
0.173**
(0.082)
Islamic -1.098*** (0.407)
-1.104** (0.499)
-0.33 (0.443)
-0.245 (0.574)
Islamic ×
CR_PCA1
0.035
(0.304)
-0.301
(0.310)
Islamic ×
CR_PCA2
0.031
(0.371)
0.122
(0.408)
Constant 29.97*** (1.518)
29.44*** (1.463)
31.63*** (1.757)
30.75*** (1.686)
39.43*** (4.704)
39.44*** (4.554)
44.3*** (5.295)
44.25*** (5.013)
30.12*** (1.412)
29.61*** (1.361)
31.55*** (1.499)
30.77*** (1.436)
N 3,020 3,020 2,194 2,194 423 423 369 369 3,443 3,443 2,563 2,563
Year dummy Yes Yes Yes Yes Yes Yes Yes Yes Yes Yes Yes Yes R2 0.217 0.207 0.27 0.249 0.383 0.376 0.381 0.373 0.23 0.221 0.2815 0.264
Wald Chi2 0.000*** 0.000*** 0.000*** 0.000*** 0.000*** 0.000*** 0.000*** 0.000*** 0.000*** 0.000*** 0.000*** 0.000***
Panel B. Impact of creditor rights’ components on capital ratios of Islamic banks (𝛽1 + 𝛽3) compared to conventional banks (𝛽1)
0.374
(0.293)
0.171
(0.381)
0.138
(0.300)
0.195
(0.411)
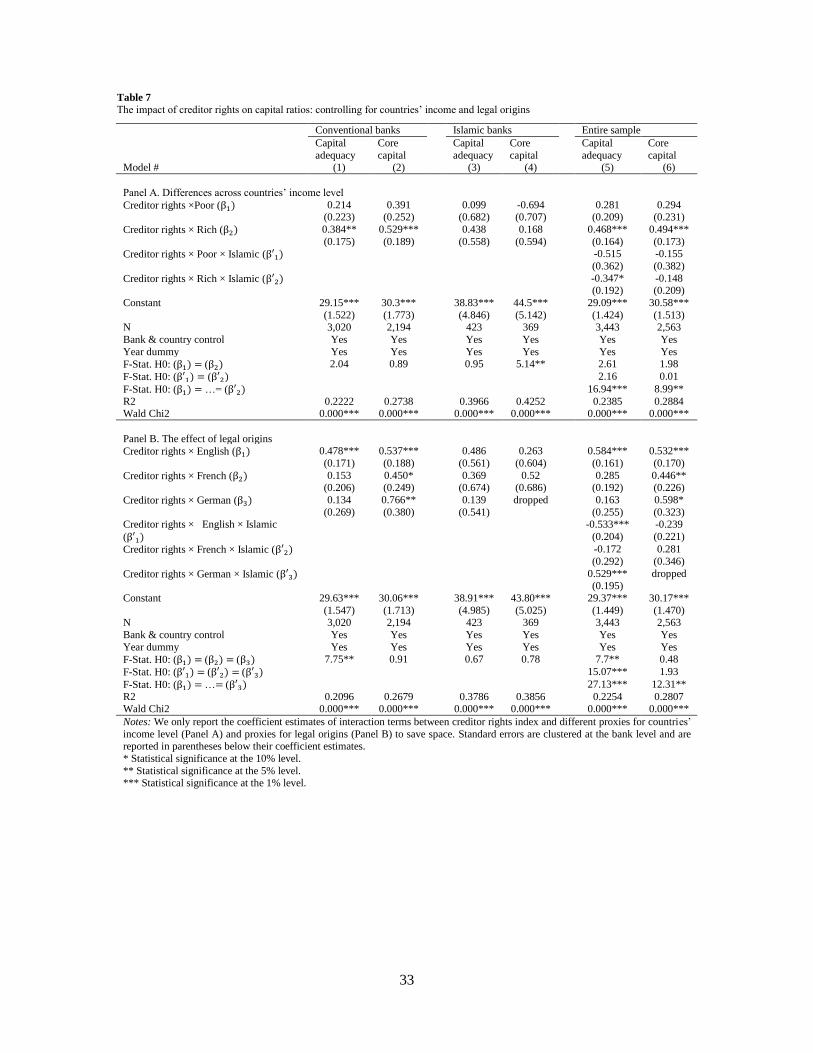
33
Table 7
The impact of creditor rights on capital ratios: controlling for countries’ income and legal origins
Conventional banks Islamic banks Entire sample
Capital
adequacy
Core
capital
Capital
adequacy
Core
capital
Capital
adequacy
Core
capital Model # (1) (2) (3) (4) (5) (6)
Panel A. Differences across countries’ income level
Creditor rights ×Poor (β1) 0.214 (0.223)
0.391 (0.252)
0.099 (0.682)
-0.694 (0.707)
0.281 (0.209)
0.294 (0.231)
Creditor rights × Rich (β2) 0.384**
(0.175)
0.529***
(0.189)
0.438
(0.558)
0.168
(0.594)
0.468***
(0.164)
0.494***
(0.173)
Creditor rights × Poor × Islamic (β′1) -0.515
(0.362)
-0.155
(0.382)
Creditor rights × Rich × Islamic (β′2) -0.347* (0.192)
-0.148 (0.209)
Constant 29.15***
(1.522)
30.3***
(1.773)
38.83***
(4.846)
44.5***
(5.142)
29.09***
(1.424)
30.58***
(1.513)
N 3,020 2,194 423 369 3,443 2,563
Bank & country control Yes Yes Yes Yes Yes Yes
Year dummy Yes Yes Yes Yes Yes Yes
F-Stat. H0: (β1) = (β2) 2.04 0.89 0.95 5.14** 2.61 1.98
F-Stat. H0: (β′1) = (β′2) 2.16 0.01
F-Stat. H0: (β1) = …= (β′2) 16.94*** 8.99**
R2 0.2222 0.2738 0.3966 0.4252 0.2385 0.2884 Wald Chi2 0.000*** 0.000*** 0.000*** 0.000*** 0.000*** 0.000***
Panel B. The effect of legal origins
Creditor rights × English (β1) 0.478***
(0.171)
0.537***
(0.188)
0.486
(0.561)
0.263
(0.604)
0.584***
(0.161)
0.532***
(0.170)
Creditor rights × French (β2) 0.153 (0.206)
0.450* (0.249)
0.369 (0.674)
0.52 (0.686)
0.285 (0.192)
0.446** (0.226)
Creditor rights × German (β3) 0.134
(0.269)
0.766**
(0.380)
0.139
(0.541)
dropped 0.163
(0.255)
0.598*
(0.323) Creditor rights × English × Islamic
(β′1)
-0.533***
(0.204)
-0.239
(0.221)
Creditor rights × French × Islamic (β′2) -0.172
(0.292)
0.281
(0.346)
Creditor rights × German × Islamic (β′3) 0.529*** (0.195)
dropped
Constant 29.63***
(1.547)
30.06***
(1.713)
38.91***
(4.985)
43.80***
(5.025)
29.37***
(1.449)
30.17***
(1.470) N 3,020 2,194 423 369 3,443 2,563
Bank & country control Yes Yes Yes Yes Yes Yes
Year dummy Yes Yes Yes Yes Yes Yes
F-Stat. H0: (β1) = (β2) = (β3) 7.75** 0.91 0.67 0.78 7.7** 0.48
F-Stat. H0: (β′1) = (β′2) = (β′3) 15.07*** 1.93
F-Stat. H0: (β1) = …= (β′3) 27.13*** 12.31**
R2 0.2096 0.2679 0.3786 0.3856 0.2254 0.2807 Wald Chi2 0.000*** 0.000*** 0.000*** 0.000*** 0.000*** 0.000***
Notes: We only report the coefficient estimates of interaction terms between creditor rights index and different proxies for countries’
income level (Panel A) and proxies for legal origins (Panel B) to save space. Standard errors are clustered at the bank level and are reported in parentheses below their coefficient estimates.
* Statistical significance at the 10% level.
** Statistical significance at the 5% level. *** Statistical significance at the 1% level.
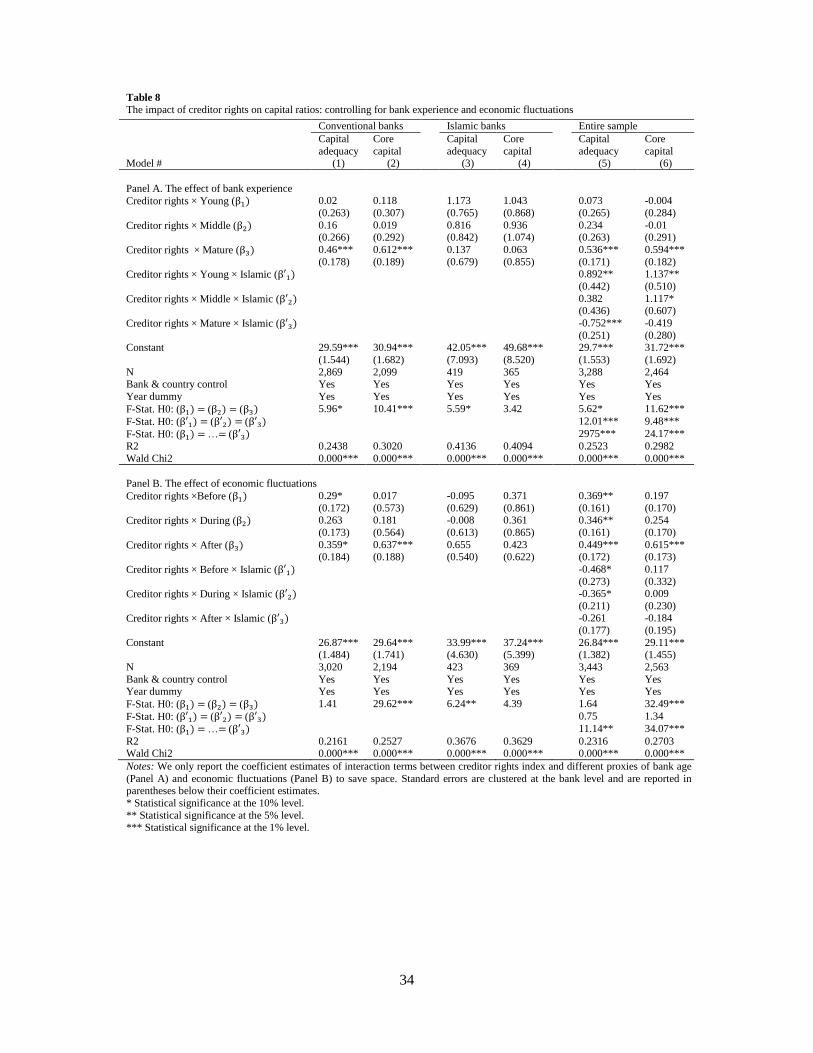
34
Table 8
The impact of creditor rights on capital ratios: controlling for bank experience and economic fluctuations
Notes: We only report the coefficient estimates of interaction terms between creditor rights index and different proxies of bank age
(Panel A) and economic fluctuations (Panel B) to save space. Standard errors are clustered at the bank level and are reported in parentheses below their coefficient estimates.
* Statistical significance at the 10% level.
** Statistical significance at the 5% level. *** Statistical significance at the 1% level.
Conventional banks Islamic banks Entire sample
Capital
adequacy
Core
capital
Capital
adequacy
Core
capital
Capital
adequacy
Core
capital Model # (1) (2) (3) (4) (5) (6)
Panel A. The effect of bank experience
Creditor rights × Young (β1) 0.02
(0.263)
0.118
(0.307)
1.173
(0.765)
1.043
(0.868)
0.073
(0.265)
-0.004
(0.284)
Creditor rights × Middle (β2) 0.16 (0.266)
0.019 (0.292)
0.816 (0.842)
0.936 (1.074)
0.234 (0.263)
-0.01 (0.291)
Creditor rights × Mature (β3) 0.46***
(0.178)
0.612***
(0.189)
0.137
(0.679)
0.063
(0.855)
0.536***
(0.171)
0.594***
(0.182)
Creditor rights × Young × Islamic (β′1) 0.892**
(0.442)
1.137**
(0.510)
Creditor rights × Middle × Islamic (β′2) 0.382 (0.436)
1.117* (0.607)
Creditor rights × Mature × Islamic (β′3) -0.752***
(0.251)
-0.419
(0.280) Constant 29.59***
(1.544)
30.94***
(1.682)
42.05***
(7.093)
49.68***
(8.520)
29.7***
(1.553)
31.72***
(1.692)
N 2,869 2,099 419 365 3,288 2,464 Bank & country control Yes Yes Yes Yes Yes Yes
Year dummy Yes Yes Yes Yes Yes Yes
F-Stat. H0: (β1) = (β2) = (β3) 5.96* 10.41*** 5.59* 3.42 5.62* 11.62***
F-Stat. H0: (β′1) = (β′2) = (β′3) 12.01*** 9.48***
F-Stat. H0: (β1) = …= (β′3) 2975*** 24.17***
R2 0.2438 0.3020 0.4136 0.4094 0.2523 0.2982
Wald Chi2 0.000*** 0.000*** 0.000*** 0.000*** 0.000*** 0.000***
Panel B. The effect of economic fluctuations
Creditor rights ×Before (β1) 0.29*
(0.172)
0.017
(0.573)
-0.095
(0.629)
0.371
(0.861)
0.369**
(0.161)
0.197
(0.170)
Creditor rights × During (β2) 0.263
(0.173)
0.181
(0.564)
-0.008
(0.613)
0.361
(0.865)
0.346**
(0.161)
0.254
(0.170)
Creditor rights × After (β3) 0.359*
(0.184)
0.637***
(0.188)
0.655
(0.540)
0.423
(0.622)
0.449***
(0.172)
0.615***
(0.173)
Creditor rights × Before × Islamic (β′1) -0.468*
(0.273)
0.117
(0.332)
Creditor rights × During × Islamic (β′2) -0.365*
(0.211)
0.009
(0.230)
Creditor rights × After × Islamic (β′3) -0.261
(0.177)
-0.184
(0.195)
Constant 26.87*** (1.484)
29.64*** (1.741)
33.99*** (4.630)
37.24*** (5.399)
26.84*** (1.382)
29.11*** (1.455)
N 3,020 2,194 423 369 3,443 2,563
Bank & country control Yes Yes Yes Yes Yes Yes Year dummy Yes Yes Yes Yes Yes Yes
F-Stat. H0: (β1) = (β2) = (β3) 1.41 29.62*** 6.24** 4.39 1.64 32.49***
F-Stat. H0: (β′1) = (β′2) = (β′3) 0.75 1.34
F-Stat. H0: (β1) = …= (β′3) 11.14** 34.07***
R2 0.2161 0.2527 0.3676 0.3629 0.2316 0.2703 Wald Chi2 0.000*** 0.000*** 0.000*** 0.000*** 0.000*** 0.000***
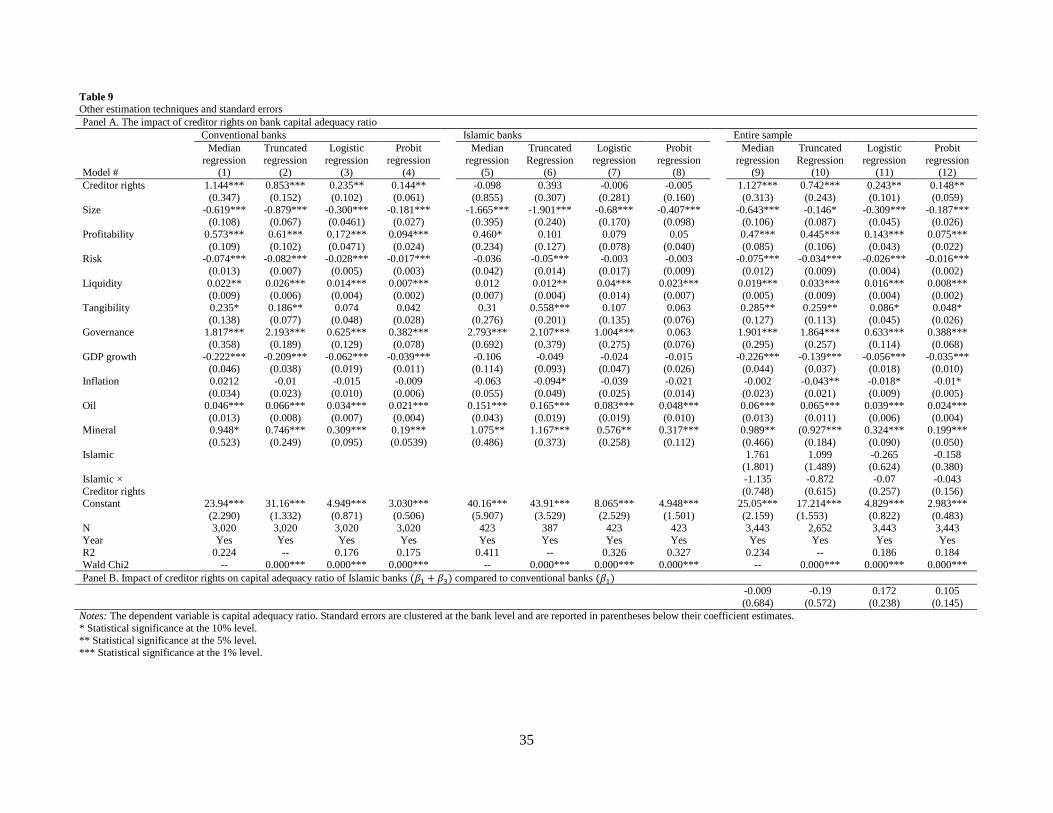
35
Table 9
Other estimation techniques and standard errors
Notes: The dependent variable is capital adequacy ratio. Standard errors are clustered at the bank level and are reported in parentheses below their coefficient estimates.
* Statistical significance at the 10% level.
** Statistical significance at the 5% level. *** Statistical significance at the 1% level.
Panel A. The impact of creditor rights on bank capital adequacy ratio
Conventional banks Islamic banks Entire sample
Model #
Median
regression (1)
Truncated
regression (2)
Logistic
regression (3)
Probit
regression (4)
Median
regression (5)
Truncated
Regression (6)
Logistic
regression (7)
Probit
regression (8)
Median
regression (9)
Truncated
Regression (10)
Logistic
regression (11)
Probit
regression (12)
Creditor rights 1.144***
(0.347)
0.853***
(0.152)
0.235**
(0.102)
0.144**
(0.061)
-0.098
(0.855)
0.393
(0.307)
-0.006
(0.281)
-0.005
(0.160)
1.127***
(0.313)
0.742***
(0.243)
0.243**
(0.101)
0.148**
(0.059)
Size -0.619*** (0.108)
-0.879*** (0.067)
-0.300*** (0.0461)
-0.181*** (0.027)
-1.665*** (0.395)
-1.901*** (0.240)
-0.68*** (0.170)
-0.407*** (0.098)
-0.643*** (0.106)
-0.146* (0.087)
-0.309*** (0.045)
-0.187*** (0.026)
Profitability 0.573***
(0.109)
0.61***
(0.102)
0.172***
(0.0471)
0.094***
(0.024)
0.460*
(0.234)
0.101
(0.127)
0.079
(0.078)
0.05
(0.040)
0.47***
(0.085)
0.445***
(0.106)
0.143***
(0.043)
0.075***
(0.022) Risk -0.074***
(0.013)
-0.082***
(0.007)
-0.028***
(0.005)
-0.017***
(0.003)
-0.036
(0.042)
-0.05***
(0.014)
-0.003
(0.017)
-0.003
(0.009)
-0.075***
(0.012)
-0.034***
(0.009)
-0.026***
(0.004)
-0.016***
(0.002)
Liquidity 0.022** (0.009)
0.026*** (0.006)
0.014*** (0.004)
0.007*** (0.002)
0.012 (0.007)
0.012** (0.004)
0.04*** (0.014)
0.023*** (0.007)
0.019*** (0.005)
0.033*** (0.009)
0.016*** (0.004)
0.008*** (0.002)
Tangibility 0.235*
(0.138)
0.186**
(0.077)
0.074
(0.048)
0.042
(0.028)
0.31
(0.276)
0.558***
(0.201)
0.107
(0.135)
0.063
(0.076)
0.285**
(0.127)
0.259**
(0.113)
0.086*
(0.045)
0.048*
(0.026) Governance 1.817***
(0.358)
2.193***
(0.189)
0.625***
(0.129)
0.382***
(0.078)
2.793***
(0.692)
2.107***
(0.379)
1.004***
(0.275)
0.063
(0.076)
1.901***
(0.295)
1.864***
(0.257)
0.633***
(0.114)
0.388***
(0.068)
GDP growth -0.222*** (0.046)
-0.209*** (0.038)
-0.062*** (0.019)
-0.039*** (0.011)
-0.106 (0.114)
-0.049 (0.093)
-0.024 (0.047)
-0.015 (0.026)
-0.226*** (0.044)
-0.139*** (0.037)
-0.056*** (0.018)
-0.035*** (0.010)
Inflation 0.0212
(0.034)
-0.01
(0.023)
-0.015
(0.010)
-0.009
(0.006)
-0.063
(0.055)
-0.094*
(0.049)
-0.039
(0.025)
-0.021
(0.014)
-0.002
(0.023)
-0.043**
(0.021)
-0.018*
(0.009)
-0.01*
(0.005) Oil 0.046***
(0.013)
0.066***
(0.008)
0.034***
(0.007)
0.021***
(0.004)
0.151***
(0.043)
0.165***
(0.019)
0.083***
(0.019)
0.048***
(0.010)
0.06***
(0.013)
0.065***
(0.011)
0.039***
(0.006)
0.024***
(0.004) Mineral 0.948*
(0.523)
0.746***
(0.249)
0.309***
(0.095)
0.19***
(0.0539)
1.075**
(0.486)
1.167***
(0.373)
0.576**
(0.258)
0.317***
(0.112)
0.989**
(0.466)
(0.927***
(0.184)
0.324***
(0.090)
0.199***
(0.050)
Islamic 1.761 (1.801)
1.099 (1.489)
-0.265 (0.624)
-0.158 (0.380)
Islamic ×
Creditor rights
-1.135
(0.748)
-0.872
(0.615)
-0.07
(0.257)
-0.043
(0.156) Constant 23.94***
(2.290)
31.16***
(1.332)
4.949***
(0.871)
3.030***
(0.506)
40.16***
(5.907)
43.91***
(3.529)
8.065***
(2.529)
4.948***
(1.501)
25.05***
(2.159)
17.214***
(1.553)
4.829***
(0.822)
2.983***
(0.483)
N 3,020 3,020 3,020 3,020 423 387 423 423 3,443 2,652 3,443 3,443 Year Yes Yes Yes Yes Yes Yes Yes Yes Yes Yes Yes Yes
R2 0.224 -- 0.176 0.175 0.411 -- 0.326 0.327 0.234 -- 0.186 0.184
Wald Chi2 -- 0.000*** 0.000*** 0.000*** -- 0.000*** 0.000*** 0.000*** -- 0.000*** 0.000*** 0.000***
Panel B. Impact of creditor rights on capital adequacy ratio of Islamic banks (𝛽1 + 𝛽3) compared to conventional banks (𝛽1)
-0.009
(0.684)
-0.19
(0.572)
0.172
(0.238)
0.105
(0.145)
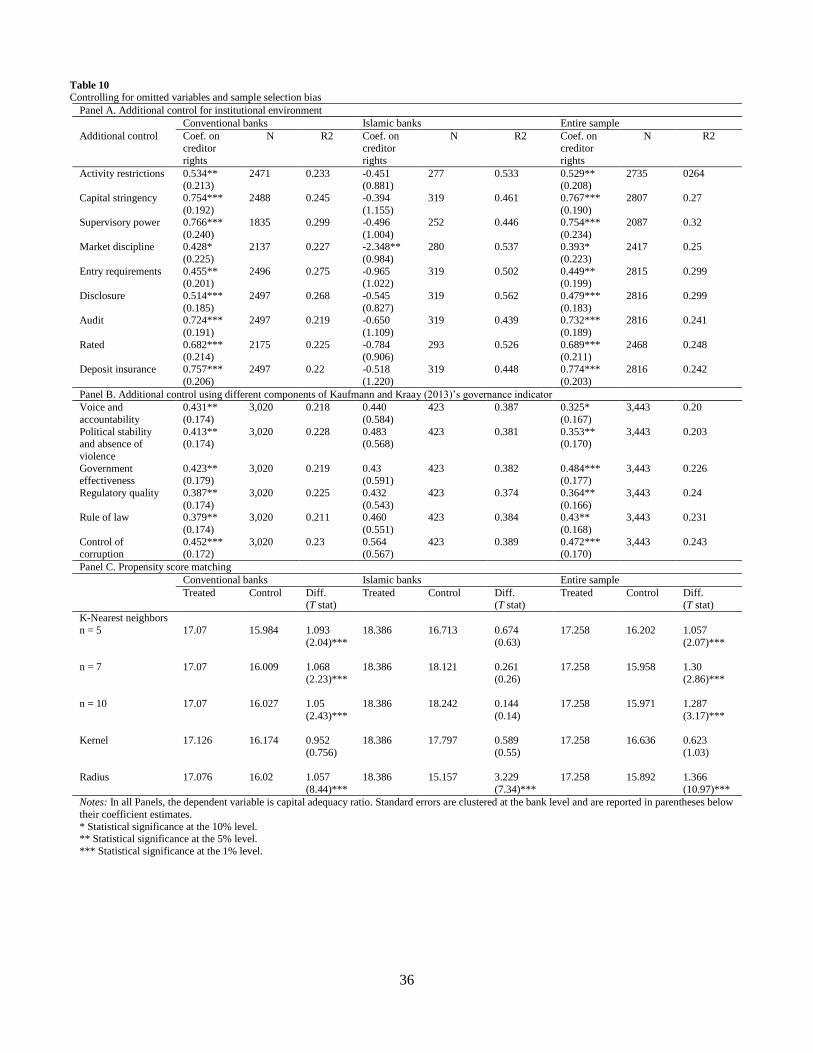
36
Table 10
Controlling for omitted variables and sample selection bias
Panel A. Additional control for institutional environment
Conventional banks Islamic banks Entire sample
Additional control Coef. on
creditor
rights
N R2 Coef. on
creditor
rights
N R2 Coef. on
creditor
rights
N R2
Activity restrictions 0.534** (0.213)
2471 0.233 -0.451 (0.881)
277 0.533 0.529** (0.208)
2735 0264
Capital stringency 0.754***
(0.192)
2488 0.245 -0.394
(1.155)
319 0.461 0.767***
(0.190)
2807 0.27
Supervisory power 0.766***
(0.240)
1835 0.299 -0.496
(1.004)
252 0.446 0.754***
(0.234)
2087 0.32
Market discipline 0.428*
(0.225)
2137 0.227 -2.348**
(0.984)
280 0.537 0.393*
(0.223)
2417 0.25
Entry requirements 0.455** (0.201)
2496 0.275 -0.965 (1.022)
319 0.502 0.449** (0.199)
2815 0.299
Disclosure 0.514***
(0.185)
2497 0.268 -0.545
(0.827)
319 0.562 0.479***
(0.183)
2816 0.299
Audit 0.724***
(0.191)
2497 0.219 -0.650
(1.109)
319 0.439 0.732***
(0.189)
2816 0.241
Rated 0.682*** (0.214)
2175 0.225 -0.784 (0.906)
293 0.526 0.689*** (0.211)
2468 0.248
Deposit insurance 0.757***
(0.206)
2497 0.22 -0.518
(1.220)
319 0.448 0.774***
(0.203)
2816 0.242
Panel B. Additional control using different components of Kaufmann and Kraay (2013)’s governance indicator
Voice and
accountability
0.431**
(0.174)
3,020 0.218 0.440
(0.584)
423 0.387 0.325*
(0.167)
3,443 0.20
Political stability and absence of
violence
0.413** (0.174)
3,020 0.228 0.483 (0.568)
423 0.381 0.353** (0.170)
3,443 0.203
Government effectiveness
0.423** (0.179)
3,020 0.219 0.43 (0.591)
423 0.382 0.484*** (0.177)
3,443 0.226
Regulatory quality 0.387**
(0.174)
3,020 0.225 0.432
(0.543)
423 0.374 0.364**
(0.166)
3,443 0.24
Rule of law 0.379**
(0.174)
3,020 0.211 0.460
(0.551)
423 0.384 0.43**
(0.168)
3,443 0.231
Control of
corruption
0.452***
(0.172)
3,020 0.23 0.564
(0.567)
423 0.389 0.472***
(0.170)
3,443 0.243
Panel C. Propensity score matching
Conventional banks Islamic banks Entire sample
Treated Control Diff. (T stat)
Treated Control Diff. (T stat)
Treated Control Diff. (T stat)
K-Nearest neighbors
n = 5 17.07 15.984 1.093
(2.04)***
18.386 16.713 0.674
(0.63)
17.258 16.202 1.057
(2.07)***
n = 7 17.07 16.009 1.068
(2.23)***
18.386 18.121 0.261
(0.26)
17.258 15.958 1.30
(2.86)***
n = 10 17.07 16.027 1.05
(2.43)***
18.386 18.242 0.144
(0.14)
17.258 15.971 1.287
(3.17)***
Kernel 17.126 16.174 0.952
(0.756)
18.386 17.797 0.589
(0.55)
17.258 16.636 0.623
(1.03)
Radius 17.076 16.02 1.057
(8.44)***
18.386 15.157 3.229
(7.34)***
17.258 15.892 1.366
(10.97)***
Notes: In all Panels, the dependent variable is capital adequacy ratio. Standard errors are clustered at the bank level and are reported in parentheses below
their coefficient estimates.
* Statistical significance at the 10% level. ** Statistical significance at the 5% level.
*** Statistical significance at the 1% level.
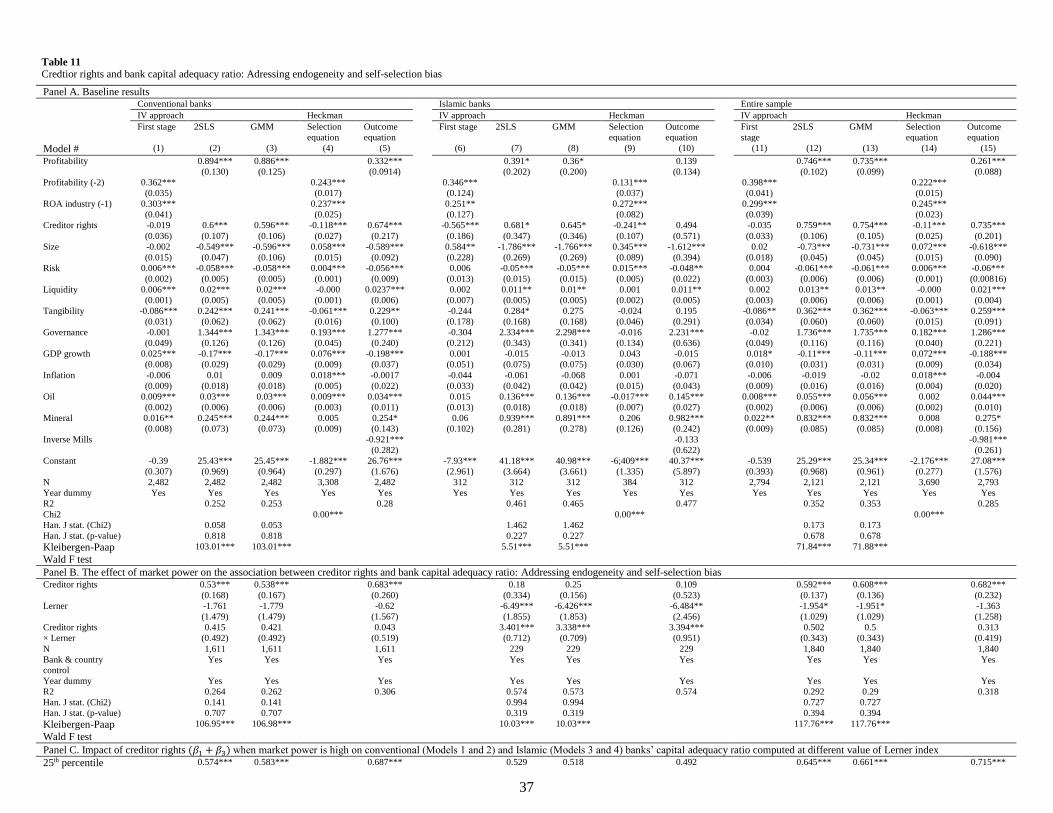
37
Table 11
Credtior rights and bank capital adequacy ratio: Adressing endogeneity and self-selection bias
Panel A. Baseline results
Conventional banks Islamic banks Entire sample
IV approach Heckman IV approach Heckman IV approach Heckman
First stage 2SLS GMM Selection
equation
Outcome
equation
First stage 2SLS GMM Selection
equation
Outcome
equation
First
stage
2SLS GMM Selection
equation
Outcome
equation
Model # (1) (2) (3) (4) (5) (6) (7) (8) (9) (10) (11) (12) (13) (14) (15)
Profitability 0.894***
(0.130)
0.886***
(0.125)
0.332***
(0.0914)
0.391*
(0.202)
0.36*
(0.200)
0.139
(0.134)
0.746***
(0.102)
0.735***
(0.099)
0.261***
(0.088)
Profitability (-2) 0.362***
(0.035)
0.243***
(0.017)
0.346***
(0.124)
0.131***
(0.037)
0.398***
(0.041)
0.222***
(0.015)
ROA industry (-1) 0.303***
(0.041)
0.237***
(0.025)
0.251**
(0.127)
0.272***
(0.082)
0.299***
(0.039)
0.245***
(0.023)
Creditor rights -0.019
(0.036)
0.6***
(0.107)
0.596***
(0.106)
-0.118***
(0.027)
0.674***
(0.217)
-0.565***
(0.186)
0.681*
(0.347)
0.645*
(0.346)
-0.241**
(0.107)
0.494
(0.571)
-0.035
(0.033)
0.759***
(0.106)
0.754***
(0.105)
-0.11***
(0.025)
0.735***
(0.201)
Size -0.002
(0.015)
-0.549***
(0.047)
-0.596***
(0.106)
0.058***
(0.015)
-0.589***
(0.092)
0.584**
(0.228)
-1.786***
(0.269)
-1.766***
(0.269)
0.345***
(0.089)
-1.612***
(0.394)
0.02
(0.018)
-0.73***
(0.045)
-0.731***
(0.045)
0.072***
(0.015)
-0.618***
(0.090)
Risk 0.006***
(0.002)
-0.058***
(0.005)
-0.058***
(0.005)
0.004***
(0.001)
-0.056***
(0.009)
0.006
(0.013)
-0.05***
(0.015)
-0.05***
(0.015)
0.015***
(0.005)
-0.048**
(0.022)
0.004
(0.003)
-0.061***
(0.006)
-0.061***
(0.006)
0.006***
(0.001)
-0.06***
(0.00816)
Liquidity 0.006***
(0.001)
0.02***
(0.005)
0.02***
(0.005)
-0.000
(0.001)
0.0237***
(0.006)
0.002
(0.007)
0.011**
(0.005)
0.01**
(0.005)
0.001
(0.002)
0.011**
(0.005)
0.002
(0.003)
0.013**
(0.006)
0.013**
(0.006)
-0.000
(0.001)
0.021***
(0.004)
Tangibility -0.086***
(0.031)
0.242***
(0.062)
0.241***
(0.062)
-0.061***
(0.016)
0.229**
(0.100)
-0.244
(0.178)
0.284*
(0.168)
0.275
(0.168)
-0.024
(0.046)
0.195
(0.291)
-0.086**
(0.034)
0.362***
(0.060)
0.362***
(0.060)
-0.063***
(0.015)
0.259***
(0.091)
Governance -0.001
(0.049)
1.344***
(0.126)
1.343***
(0.126)
0.193***
(0.045)
1.277***
(0.240)
-0.304
(0.212)
2.334***
(0.343)
2.298***
(0.341)
-0.016
(0.134)
2.231***
(0.636)
-0.02
(0.049)
1.736***
(0.116)
1.735***
(0.116)
0.182***
(0.040)
1.286***
(0.221)
GDP growth 0.025***
(0.008)
-0.17***
(0.029)
-0.17***
(0.029)
0.076***
(0.009)
-0.198***
(0.037)
0.001
(0.051)
-0.015
(0.075)
-0.013
(0.075)
0.043
(0.030)
-0.015
(0.067)
0.018*
(0.010)
-0.11***
(0.031)
-0.11***
(0.031)
0.072***
(0.009)
-0.188***
(0.034)
Inflation -0.006
(0.009)
0.01
(0.018)
0.009
(0.018)
0.018***
(0.005)
-0.0017
(0.022)
-0.044
(0.033)
-0.061
(0.042)
-0.068
(0.042)
0.001
(0.015)
-0.071
(0.043)
-0.006
(0.009)
-0.019
(0.016)
-0.02
(0.016)
0.018***
(0.004)
-0.004
(0.020)
Oil 0.009***
(0.002)
0.03***
(0.006)
0.03***
(0.006)
0.009***
(0.003)
0.034***
(0.011)
0.015
(0.013)
0.136***
(0.018)
0.136***
(0.018)
-0.017***
(0.007)
0.145***
(0.027)
0.008***
(0.002)
0.055***
(0.006)
0.056***
(0.006)
0.002
(0.002)
0.044***
(0.010)
Mineral 0.016**
(0.008)
0.245***
(0.073)
0.244***
(0.073)
0.005
(0.009)
0.254*
(0.143)
0.06
(0.102)
0.939***
(0.281)
0.891***
(0.278)
0.206
(0.126)
0.982***
(0.242)
0.022**
(0.009)
0.832***
(0.085)
0.832***
(0.085)
0.008
(0.008)
0.275*
(0.156)
Inverse Mills -0.921***
(0.282)
-0.133
(0.622)
-0.981***
(0.261)
Constant -0.39
(0.307)
25.43***
(0.969)
25.45***
(0.964)
-1.882***
(0.297)
26.76***
(1.676)
-7.93***
(2.961)
41.18***
(3.664)
40.98***
(3.661)
-6;409***
(1.335)
40.37***
(5.897)
-0.539
(0.393)
25.29***
(0.968)
25.34***
(0.961)
-2.176***
(0.277)
27.08***
(1.576)
N 2,482 2,482 2,482 3,308 2,482 312 312 312 384 312 2,794 2,121 2,121 3,690 2,793
Year dummy Yes Yes Yes Yes Yes Yes Yes Yes Yes Yes Yes Yes Yes Yes Yes
R2 0.252 0.253 0.28 0.461 0.465 0.477 0.352 0.353 0.285
Chi2 0.00*** 0.00*** 0.00***
Han. J stat. (Chi2) 0.058 0.053 1.462 1.462 0.173 0.173
Han. J stat. (p-value) 0.818 0.818 0.227 0.227 0.678 0.678
Kleibergen-Paap Wald F test
103.01*** 103.01*** 5.51*** 5.51*** 71.84*** 71.88***
Panel B. The effect of market power on the association between creditor rights and bank capital adequacy ratio: Addressing endogeneity and self-selection bias
Creditor rights 0.53***
(0.168)
0.538***
(0.167)
0.683***
(0.260)
0.18
(0.334)
0.25
(0.156)
0.109
(0.523)
0.592***
(0.137)
0.608***
(0.136)
0.682***
(0.232)
Lerner -1.761
(1.479)
-1.779
(1.479)
-0.62
(1.567)
-6.49***
(1.855)
-6.426***
(1.853)
-6.484**
(2.456)
-1.954*
(1.029)
-1.951*
(1.029)
-1.363
(1.258)
Creditor rights
× Lerner
0.415
(0.492)
0.421
(0.492)
0.043
(0.519)
3.401***
(0.712)
3.338***
(0.709)
3.394***
(0.951)
0.502
(0.343)
0.5
(0.343)
0.313
(0.419)
N 1,611 1,611 1,611 229 229 229 1,840 1,840 1,840
Bank & country
control
Yes Yes Yes Yes Yes Yes Yes Yes Yes
Year dummy Yes Yes Yes Yes Yes Yes Yes Yes Yes
R2 0.264 0.262 0.306 0.574 0.573 0.574 0.292 0.29 0.318
Han. J stat. (Chi2) 0.141 0.141 0.994 0.994 0.727 0.727
Han. J stat. (p-value) 0.707 0.707 0.319 0.319 0.394 0.394
Kleibergen-Paap
Wald F test
106.95*** 106.98*** 10.03*** 10.03*** 117.76*** 117.76***
Panel C. Impact of creditor rights (𝛽1 + 𝛽3) when market power is high on conventional (Models 1 and 2) and Islamic (Models 3 and 4) banks’ capital adequacy ratio computed at different value of Lerner index
25th percentile 0.574*** 0.583*** 0.687*** 0.529 0.518 0.492 0.645*** 0.661*** 0.715***
38
Notes: In all Panels, the dependent variable is capital adequacy ratio. In panel B, we only report the coefficient estimates of creditor rights index, the Lerner index, and their interactions to save space. Standard errors are clustered
at the bank level and are reported in parentheses below their coefficient estimates.
* Statistical significance at the 10% level. ** Statistical significance at the 5% level.
*** Statistical significance at the 1% level.
.
(0.146) (0.144) (0.253) (0.341) (0.341) (0.563) (0.129) (0.127) (0.232)
50th percentile 0.628***
(0.142)
0.637***
(0.140)
0.693***
(0.260)
0.98***
(0.371)
0.951**
(0.370)
1.022
(0.645)
0.71**
(0.132)
0.726***
(0.130)
0.756***
(0.244)
75th percentile 0.674***
(0.160)
0.684***
(0.158)
0.698**
(0.280)
1.355***
(0.412)
1.319***
(0.410)
1.356*
(0.707)
0.765***
(0.145)
0.781***
(0.144)
0.79***
(0.262)
90th percentile 0.723***
(0.195)
0.734***
(0.193)
0.703**
(0.312)
1.762***
(0.467)
1.718***
(0.465)
1.758**
(0.791)
0.825***
(0.168)
0.841***
(0.167)
0.828***
(0.290)
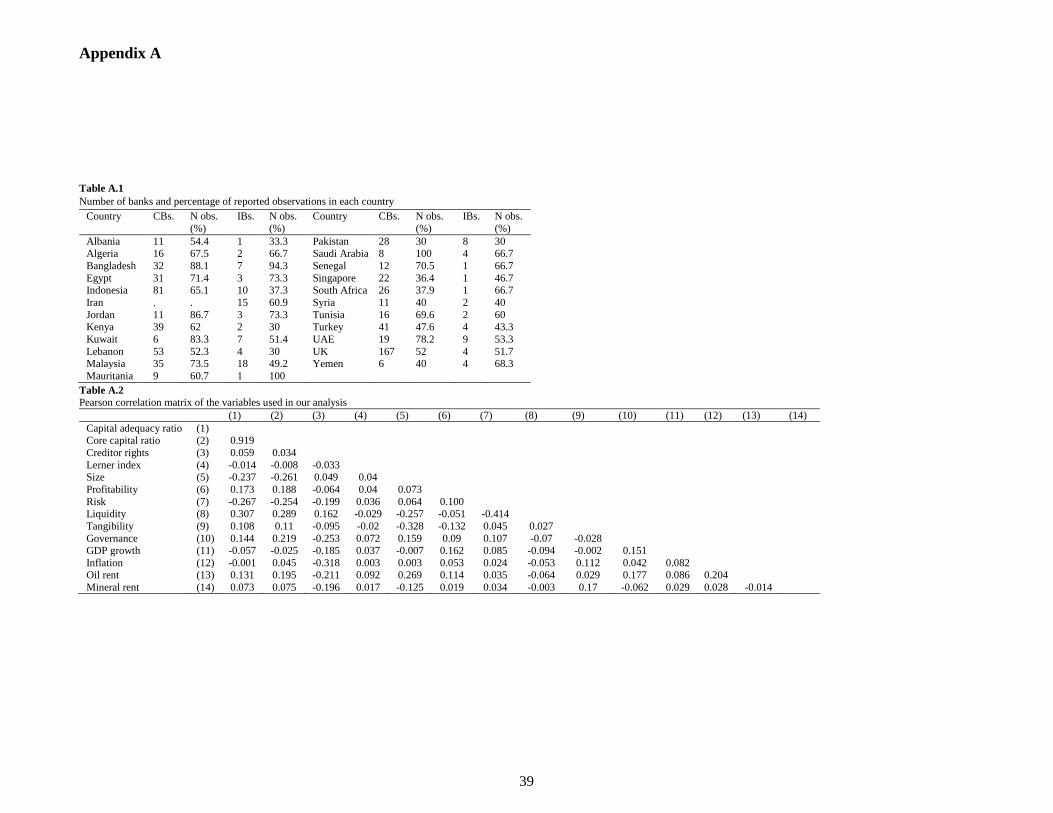
39
Appendix A
Table A.1
Number of banks and percentage of reported observations in each country
Country CBs. N obs.
(%)
IBs. N obs.
(%)
Country CBs. N obs.
(%)
IBs. N obs.
(%)
Albania 11 54.4 1 33.3 Pakistan 28 30 8 30
Algeria 16 67.5 2 66.7 Saudi Arabia 8 100 4 66.7
Bangladesh 32 88.1 7 94.3 Senegal 12 70.5 1 66.7
Egypt 31 71.4 3 73.3 Singapore 22 36.4 1 46.7 Indonesia 81 65.1 10 37.3 South Africa 26 37.9 1 66.7
Iran . . 15 60.9 Syria 11 40 2 40
Jordan 11 86.7 3 73.3 Tunisia 16 69.6 2 60 Kenya 39 62 2 30 Turkey 41 47.6 4 43.3
Kuwait 6 83.3 7 51.4 UAE 19 78.2 9 53.3
Lebanon 53 52.3 4 30 UK 167 52 4 51.7 Malaysia 35 73.5 18 49.2 Yemen 6 40 4 68.3
Mauritania 9 60.7 1 100
Table A.2
Pearson correlation matrix of the variables used in our analysis
(1) (2) (3) (4) (5) (6) (7) (8) (9) (10) (11) (12) (13) (14)
Capital adequacy ratio (1) Core capital ratio (2) 0.919
Creditor rights (3) 0.059 0.034
Lerner index (4) -0.014 -0.008 -0.033 Size (5) -0.237 -0.261 0.049 0.04
Profitability (6) 0.173 0.188 -0.064 0.04 0.073
Risk (7) -0.267 -0.254 -0.199 0.036 0.064 0.100 Liquidity (8) 0.307 0.289 0.162 -0.029 -0.257 -0.051 -0.414
Tangibility (9) 0.108 0.11 -0.095 -0.02 -0.328 -0.132 0.045 0.027
Governance (10) 0.144 0.219 -0.253 0.072 0.159 0.09 0.107 -0.07 -0.028 GDP growth (11) -0.057 -0.025 -0.185 0.037 -0.007 0.162 0.085 -0.094 -0.002 0.151
Inflation (12) -0.001 0.045 -0.318 0.003 0.003 0.053 0.024 -0.053 0.112 0.042 0.082 Oil rent (13) 0.131 0.195 -0.211 0.092 0.269 0.114 0.035 -0.064 0.029 0.177 0.086 0.204
Mineral rent (14) 0.073 0.075 -0.196 0.017 -0.125 0.019 0.034 -0.003 0.17 -0.062 0.029 0.028 -0.014
40
Table A.3
Other estimation techniques and standard errors
Notes: The dependent variable is core capital ratio. Standard errors are clustered at the bank level and are reported in parentheses below their coefficient estimates. * Statistical significance at the 10% level.
** Statistical significance at the 5% level.
*** Statistical significance at the 1% level.
Panel A. The impact of creditor rights on bank core capital ratio
Conventional banks Islamic banks Entire sample
Model #
Median
regression
(1)
Truncated
regression
(2)
Logistic
regression
(3)
Probit
regression
(4)
Median
regression
(5)
Truncated
Regression
(6)
Logistic
regression
(7)
Probit
regression
(8)
Median
regression
(9)
Truncated
Regression
(10)
Logistic
regression
(11)
Probit
regression
(12)
Creditor rights 1.309***
(0.290)
0.381***
(0.127)
0.305**
(0.134)
0.19**
(0.079)
0.311
(0.911)
0.334
(0.385)
0.034
(0.365)
0.029
(0.201)
1.218***
(0.282)
0.377***
(0.127)
0.282**
(0.128)
0.176**
(0.076)
Size -0.808*** (0.105)
-0.903*** (0.056)
-0.41*** (0.065)
-0.241*** (0.036)
-1.908*** (0.354)
-2.706*** (0.272)
-0.747*** (0.214)
-0.447*** (0.121)
-0.818*** (0.108)
-0.991*** (0.57)
-0.41*** (0.062)
-0.243*** (0.035)
Profitability 0.776***
(0.127)
0.496***
(0.081)
0.347***
(0.082)
0.180***
(0.039)
0.804***
(0.189)
0.355*
(0.182)
0.228*
(0.123)
0.129**
(0.063)
0.664***
(0.095)
0.416***
(0.069)
0.291***
(0.067)
0.152***
(0.033) Risk -0.067***
(0.012)
-0.057***
(0.0064)
-0.034***
(0.008)
-0.02***
(0.004)
-0.094***
(0.029)
-0.058***
(0.018)
-0.007
(0.016)
-0.005
(0.009)
-0.066***
(0.011)
-0.059***
(0.006)
-0.031***
(0.007)
-0.019***
(0.004)
Liquidity 0.011 (0.008)
0.008* (0.004)
0.01 (0.011)
0.004 (0.004)
0.002 (0.022)
0.002 (0.006)
0.05*** (0.016)
0.029*** (0.009)
0.016** (0.006)
0.01*** (0.003)
0.014 (0.011)
0.006 (0.005)
Tangibility 0.291**
(0.124)
0.152**
(0.063)
0.149**
(0.067)
0.084**
(0.039)
0.757**
(0.311)
0.686***
(0.200)
0.361**
(0.170)
0.213**
(0.092)
0.367***
(0.131)
0.246***
(0.059)
0.186***
(0.062)
0.104***
(0.035) Governance 1.970***
(0.369)
1.184***
(0.155)
0.964***
(0.159)
0.57***
(0.092)
2.473***
(0.689)
2.261***
(0.405)
0.724**
(0.340)
0.438**
(0.198)
1.953***
(0.300)
1.208***
(0.144)
0.861***
(0.140)
0.516***
(0.082)
GDP growth -0.171*** (0.050)
-0.108*** (0.035)
-0.059*** (0.023)
-0.037*** (0.013)
0.056 (0.246)
-0.083 (0.128)
-0.052 (0.066)
-0.031 (0.035)
-0.165*** (0.051)
-0.106*** (0.036)
-0.049** (0.022)
-0.03** (0.013)
Inflation 0.027
(0.024)
0.002
(0.017)
-0.007
(0.012)
-0.004
(0.007)
-0.053
(0.060)
-0.126**
(0.057)
-0.015
(0.033)
-0.011
(0.017)
0.02
(0.024)
-0.017
(0.016)
-0.009
(0.011)
-0.006
(0.006)
Oil 0.055***
(0.014)
0.049***
(0.007)
0.031***
(0.009)
0.019***
(0.005)
0.1***
(0.030)
0.172***
(0.023)
0.059***
(0.017)
0.035***
(0.009)
0.066***
(0.014)
0.067***
(0.006)
0.036***
(0.007)
0.022***
(0.004)
Mineral 1.283*** (0.207)
0.539*** (0.102)
0.384*** (0.115)
0.225*** (0.061)
1.054 (0.708)
1.251*** (0.384)
0.319 (0.220)
0.192 (0.119)
1.303*** (0.192)
0.621*** (0.100)
0.363*** (0.104)
0.215*** (0.055)
Islamic 1.979
(1.934)
0.058
(0.807)
-0.013
(0.706)
-0.003
(0.414) Islamic ×
Creditor rights
-1.063
(0.812)
-0.071
(0.321)
-0.213
(0.282)
-0.128
(0.167)
Constant 23.38*** (1.763)
29.77*** (1.151)
6.948*** (1.411)
4.146*** (0.709)
47.14*** (5.681)
53.82*** (3.837)
8.871** (3.826)
5.342** (2.148)
23.40*** (1.694)
30.742*** (1.071)
6.575*** (1.314)
4.007*** (0.688)
N 2,194 1,780 2,194 2,194 369 305 366 366 2,563 2,085 2,563 2,563
Year Yes Yes Yes Yes Yes Yes Yes Yes Yes Yes Yes Yes R2 0.345 n.a. 0.217 0.212 0.434 n.a. 0.309 0.31 0.347 n.a. 0.217 0.212
Wald Chi2 n.a. 0.000*** 0.000*** 0.000*** n.a. 0.000*** 0.000*** 0.000*** n.a. 0.000*** 0.000*** 0.000***
Panel B. Impact of creditor rights on core capital ratio of Islamic banks (𝛽1 + 𝛽3) compared to conventional banks (𝛽1)
0.155
(0.713)
0.306
(0.299)
0.068
(0.256)
0.048
(0.151)
41
Table A.4
Controlling for omitted variables and sample selection bias
Notes: In all Panels, the dependent variable is core capital ratio. Standard errors are clustered at the bank level and are reported in parentheses below their coefficient
estimates.
* Statistical significance at the 10% level. ** Statistical significance at the 5% level.
*** Statistical significance at the 1% level.
Panel A. Additional control for institutional environment
Conventional banks Islamic banks Entire sample
Additional control Coef. on
creditor rights
N R2 Coef. on
creditor rights
N R2 Coef. on
creditor rights
N R2
Activity restrictions 0.286
(0.215)
1,817 0.305 -0.144
(0.934)
234 0.487 0.307
(0.211)
2,051 0.325
Capital stringency 0.705*** (0.198)
1,860 0.307 -0.540 (1.225)
290 0.477 0.728*** (0.192)
2,150 0.329
Supervisory power 0.867***
(0.295)
1,355 0.378 -0.333
(1.423)
228 0.477 0.869***
(0.275)
1,583 0.408
Market discipline 0.376
(0.237)
1,529 0.283 -1.946*
(1.066)
254 0.543 0.367
(0.236)
1,783 0.297
Entry requirements 0.353* (0.213)
1,864 0.364 -1.092 (1.022)
290 0.534 0.344* (0.208)
2,154 0.385
Disclosure 0.303
(0.192)
1,865 0.354 -0.2
(0.576)
290 0.611 0.238
(0.186)
2,155 0.39
Audit 0.679***
(0.199)
1,865 0.271 -0.855
(1.219)
290 0.467 0.695***
(0.194)
2,155 0.29
Rated 0.605*** (0.225)
1,632 0.287 -1.143 (0.966)
269 0.521 0.635*** (0.221)
1,901 0.3
Deposit insurance 0.723***
(0.216)
1,865 0.273 -0.813
(1.241)
290 0.468 0.746***
(0.211)
2,155 0.322
Panel B. Additional control using different components of Kaufmann and Kraay (2013)’s governance indicators
Voice and accountability 0.552***
(0.187)
2,194 0.272 0.196
(0.645)
369 0.396 0.396**
(0.181)
2,563 0.224
Political stability and
absence of violence
0.52***
(0.189)
2,194 0.271 0.211
(0.656)
369 0.382 0.446**
(0.181)
2,563 0.248
Government effectiveness
0.546*** (0.191)
2,194 0.273 0.27 (0.654)
369 0.382 0.599*** (0.188)
2,563 0.262
Regulatory quality 0.452**
(0.192)
2,194 0.28 0.088
(0.617)
369 0.368 0.424**
(0.175)
2,563 0.292
Rule of law 0.541***
(0.187)
2,194 0.267 0.246
(0.605)
369 0.38 0.524***
(0.177)
2,563 0.274
Control of corruption 0.571***
(0.184)
2,194 0.288 0.575
(0.602)
369 0.409 0.587***
(0.177)
2,563 0.304
Panel C. Propensity score matching
Conventional banks Islamic banks Entire sample
Treated Control Diff.
(T stat)
Treated Control Diff.
(T stat)
Treated Control Diff.
(T stat)
K-Nearest neighbors
n = 5 14.1 13.39 0.71
(1.40)
16.54 15.87 0.67
(0.61)
14.44 14.32 0.12
(0.49)
n = 7 14.1 13.28 0.82
(1.82)**
16.54 16.2 0.35
(0.32)
14.44 13.9 0.54
(1.23)
n = 10 14.1 13.24 0.86
(2.12)***
16.54 16.29 0.25
(0.24)
14.44 13.83 0.61
(1.57)
Kernel 14.2 13.91 0.26
(0.37)
16.54 15.9 0.64
(0.57)
14.44 14.68 -0.24
(0.58)
Radius 14.1 13.64 0.46
(3.64)***
16.54 13.49 3.05
(6.34)***
14.44 13.62 0.82
(6.32)***
42
Table A.5
Creditor rights and bank core capital ratio: Addressing endogeneity and self-selection bias
The dependent variable is core capital ratio. In panel B, we only report the coefficient estimates of creditor rights index, the Lerner index, and their interactions to save space. Standard errors are clustered at the bank level and are
reported in parentheses below their coefficient estimates. * Statistical significance at the 10% level.
** Statistical significance at the 5% level.
*** Statistical significance at the 1% level.
Panel A. Baseline results
Conventional banks Islamic banks Entire sample
IV approach Heckman IV approach Heckman IV approach Heckman
First stage 2SLS GMM Selection
equation
Outcome
equation
First stage 2SLS GMM Selection
equation
Outcome
equation
First
stage
2SLS GMM Selection
equation
Outcome
equation
Model # (1) (2) (3) (4) (5) (6) (7) (8) (9) (10) (11)
Profitability 0.875***
(0.121)
0.844***
(0.117)
0.433***
(0.099)
0.563*
(0.300)
0.55*
(0.296)
0.344*
(0.183)
0.746***
(0.102)
0.735***
(0.099)
0.773***
(0.218)
Profitability (-2) 0.438***
(0.047)
0.282***
(0.021)
0.274**
(0.122)
0.112***
(0.040)
0.43***
(0.056)
0.239***
(0.018)
ROA industry (-1) 0.306***
(0.044)
0.227***
(0.027)
0.225**
(1.095)
0.283***
(0.084)
0.301***
(0.041)
0.239***
(0.025)
Creditor rights -0.047
(0.043)
0.808***
(0.116)
0.788***
(0.115)
-0.092***
(0.030)
0.839***
(0.243)
-0.543***
(0.163)
0.474
(0.413)
0.465
(0.411)
-0.299***
(0.113)
0.193
(0.669)
-0.056
(0.041)
0.759***
(0.106)
0.754***
(0.105)
-0.088***
(0.028)
0.773***
(0.218)
Size -0.005
(0.016)
-0.693***
(0.046)
-0.697***
(0.046)
0.095***
(0.017)
-0.742***
(0.088)
0.668***
(0.179)
-1.959***
(0.323)
-1.949***
(0.319)
0.445***
(0.099)
-1.635***
(0.397)
0.019
(0.016)
-0.73***
(0.045)
-0.731***
(0.045)
0.107***
(0.016)
-0.761***
(0.087)
Risk 0.005***
(0.002)
-0.059***
(0.006)
-0.059***
(0.006)
0.008***
(0.002)
-0.059***
(0.011)
0.026***
(0.008)
-0.071***
(0.021)
-0.071***
(0.021)
0.019***
(0.005)
-0.059**
(0.025)
0.006***
(0.002)
-0.061***
(0.006)
-0.061***
(0.006)
0.01***
(0.001)
-0.061***
(0.010)
Liquidity 0.004**
(0.002)
0.011*
(0.006)
0.011*
(0.006)
0.000
(0.001)
0.013
(0.010)
0.012***
(0.002)
0.008
(0.013)
0.008
(0.013)
0.001
(0.002)
0.012
(0.0141)
0.004***
(0.001)
0.013**
(0.006)
0.013**
(0.006)
0.000
(0.001)
0.015*
(0.009)
Tangibility -0.093**
(0.041)
0.32***
(0.068)
0.325***
(0.067)
-0.06***
(0.019)
0.304***
(0.100)
-0.411**
(0.172)
0.537**
(0.212)
0.532**
(0.211)
-0.021
(0.050)
0.401
(0.290)
-0.111**
(0.043)
0.362***
(0.060)
0.362***
(0.060)
-0.067***
(0.017)
0.342***
(0.092)
Governance -0.015
(0.062)
1.793***
(0.130)
1.788***
(0.130)
0.238***
(0.050)
1.746***
(0.263)
-0.485**
(0.227)
2.54***
(0.389)
2.525***
(0.384)
-0.12
(0.141)
2.383***
(0.655)
-0.041
(0.057)
1.736***
(0.116)
1.735***
(0.116)
0.22***
(0.044)
1.68***
(0.226)
GDP growth 0.033***
(0.010)
-0.126***
(0.032)
-0.127***
(0.032)
0.089***
(0.011)
-0.144***
(0.039)
-0.023
(0.065)
0.035
(0.096)
0.032
(0.096)
0.042
(0.031)
0.047
(0.089)
0.027*
(0.014)
-0.11***
(0.031)
-0.11***
(0.031)
0.085***
(0.010)
-0.127***
(0.036)
Inflation -0.011
(0.011)
-0.009
(0.018)
-0.012
(0.017)
0.015***
(0.005)
-0.019
(0.019)
-0.017
(0.021)
-0.083**
(0.041)
-0.084**
(0.040)
-0.008
(0.016)
-0.088**
(0.044)
-0.008
(0.010)
-0.019
(0.016)
-0.02
(0.016)
0.016***
(0.005)
-0.026
(0.017)
Oil 0.007***
(0.002)
0.043***
(0.006)
0.045***
(0.006)
0.008***
(0.003)
0.047***
(0.012)
0.02*
(0.011)
0.125***
(0.021)
0.125***
(0.021)
-0.017**
(0.007)
0.131***
(0.026)
0.008***
(0.003)
0.055***
(0.006)
0.056***
(0.006)
0.001
(0.002)
0.06***
(0.010)
Mineral -0.013
(0.027)
0.833***
(0.091)
0.832***
(0.091)
-0.024
(0.019)
0.85***
(0.156)
0.001
(0.050)
0.978***
(0.293)
0.967***
(0.290)
0.123
(0.113)
1.033***
(0.261)
-0.001
(0.025)
0.832***
(0.085)
0.832***
(0.085)
-0.016
(0.016)
0.85***
(0.139)
-0.649**
(0.296)
0.32
(0.765)
-0.539**
(0.245)
Constant -0.25
(0.315)
24.69***
(1.009)
-3.002***
(0.332)
-0.649**
(0.296)
-10.45***
(2.515)
42.93***
(4.863)
42.77***
(4.814)
-7.997***
(1.477)
38.00***
(6.745)
-0.73
(0.284)
25.29***
(0.968)
25.34***
(0.961)
-3.251***
(0.282)
25.5***
(1.760)
N 1,836 1,836 1,836 2,997 1,836 285 285 285 372 285 2,121 2,121 2,121 3,364 2,121
Chi2 0.00*** 0.00*** 0.00***
Year dummy Yes Yes Yes Yes Yes Yes Yes Yes Yes Yes Yes Yes Yes Yes Yes
R2 0.35 0.353 0.368 0.453 0.454 0.463 0.352 0.353 0.366
Han. J stat. (Chi2) 1.066 1.066 0.06 0.06 0.173 0.173
Han. J stat. (p-value) 0.302 0.302 0.806 0.806 0.678 0.678
Kleibergen-Paap
Wald F test
89.6*** 89.6*** 3.98*** 3.98*** 71.84*** 71.88***
Panel B. The effect of market power on the association between creditor rights and bank core capital ratio: Addressing endogeneity and self-selection bias Creditor rights 0.767***
(0.206)
0.762***
(0.206)
0.875**
(0.354)
0.011
(0.429
0.011
(0.397)
-0.136
(0.713)
0.696***
(0.157)
0.694***
(0.102)
0.743**
(0.292)
Lerner -1.861
(0.566)
-1.822
(1.699)
-0.792
(1.948)
-7.306***
(2.267)
-7.306***
(1.976)
-7.334***
(2.719)
-2.109**
(1.045)
-2.106**
(1.044)
-1.581
(1.390)
Creditor rights
× Lerner
0.489
(0.566)
0.475
(0.564)
0.138
(0.644)
3.604***
(0.837)
3.604***
(0.800)
3.591***
(1.022)
0.585*
(0.349)
0.584*
(0.349)
0.412
(0.463)
N 1,234 1,234 1,234 206 206 206 1,440 1,440 1,440
Bank & country
control
Yes Yes Yes Yes Yes Yes Yes Yes Yes Yes
Year dummy Yes Yes Yes Yes Yes Yes Yes Yes Yes Yes
R2 0.366 0.368 0.384 0.595 0.595 0.596 0.384 0.384 0.394
Han. J stat. (Chi2) 0.107 0.107 0.456 0.456 0.016 0.016
Han. J stat. (p-value) 0.743 0.743 0.499 0.499 0.900 0.900
Kleibergen-Paap Wald F test
111.39*** 115.39*** n.a. n.a. 113.19*** 113.19***