Embed Size (px)
Citation preview

Air Force Institute of TechnologyAFIT Scholar
Theses and Dissertations Student Graduate Works
3-23-2017
Creep of Hi-Nicalon™ S Ceramic Fiber Tows at900°C In Air and In Silicic Acid-Saturated SteamRonald K. Mitchell
Follow this and additional works at: https://scholar.afit.edu/etd
Part of the Ceramic Materials Commons
This Thesis is brought to you for free and open access by the Student Graduate Works at AFIT Scholar. It has been accepted for inclusion in Theses andDissertations by an authorized administrator of AFIT Scholar. For more information, please contact [email protected].
Recommended CitationMitchell, Ronald K., "Creep of Hi-Nicalon™ S Ceramic Fiber Tows at 900°C In Air and In Silicic Acid-Saturated Steam" (2017). Thesesand Dissertations. 1734.https://scholar.afit.edu/etd/1734

CREEP OF HI-NICALON™ S CERAMIC FIBER TOWS AT 900°C IN AIR AND IN
SILICIC ACID-SATURATED STEAM
THESIS
Ronald K. Mitchell, Master Sergeant, USAF
AFIT-ENY-MS-17-M-277
DEPARTMENT OF THE AIR FORCE
AIR UNIVERSITY
AIR FORCE INSTITUTE OF TECHNOLOGY
Wright-Patterson Air Force Base, Ohio
DISTRIBUTION STATEMENT A:
APPROVED FOR PUBLIC RELEASE; DISTRIBUTION UNLIMITED.

The views expressed in this thesis are those of the author and do not reflect the official policy
or position of the United States Air Force, Department of Defense, or the United States
Government. This material is declared a work of the U.S. Government and is not subject to
copyright protection in the United States.

AFIT-ENY-17-M-277
CREEP OF HI-NICALON™ S CERAMIC FIBER TOWS AT 900°C IN AIR AND IN
SILICIC ACID-SATURATED STEAM
THESIS
Presented to the Faculty
Department of Aeronautics and Astronautics
Graduate School of Engineering and Management
Air Force Institute of Technology
Air University
Air Education and Training Command
In Partial Fulfillment of the Requirements for the
Degree of Master of Science in Astronautical Engineering
Ronald K. Mitchell, BS
Master Sergeant, USAF
March 2017
DISTRIBUTION STATEMENT A.
APPROVED FOR PUBLIC RELEASE; DISTRIBUTION UNLIMITED.

AFIT-ENY-17-M-277
CREEP OF HI-NICALON™ S CERAMIC FIBER TOWS AT 900°C IN AIR AND IN
SILICIC ACID-SATURATED STEAM
Ronald K. Mitchell, BS
Master Sergeant, USAF
Committee Membership:
Dr. Marina B. Ruggles-Wrenn
Chair
Dr. Randall S. Hay
Member
Dr. Thomas Eason, III
Member

v
AFIT-ENY-17-M-277
Abstract
Advanced SiC/SiC ceramic matrix composites (CMCs) are being considered for
demanding aerospace applications such as aircraft engine hot-section components. In these
applications the composites will be subjected to cyclic and sustained loadings at elevated
temperature in aggressive combustion environments. Current aircraft engines employ
Nickel-based superalloys in applications such turbine blades, where the metallic alloys must
perform at or near their operating temperature limits in highly corrosive environments. The
SiC/SiC composites, which offer low density, high strength and fracture toughness at
elevated temperatures could potentially replace Nickel-based superalloy in aircraft engine
applications. However, before the SiC/SiC composites can be safely used in advanced
aerospace applications their durability at elevated temperatures in service harsh environments
must be assured. Therefore a thorough understanding of mechanical performance of SiC/SiC
composites and their constituents in service environments is critical to design and life
prediction of these materials. When composite is subjected to mechanical loading in
combustion environment, surface matrix cracks form. Then steam (one of the main
component of the service environment) enters the composite through matrix crack and reacts
with the SiC matrix to leach Si and become saturated with Si(OH)4. The silicic acid-
saturated steam travels into the composite interior and attacks the oxidation prone reinforcing
SiC fibers. Hence thorough understanding of performance and durability of advanced SiC
fibers at elevated temperatures in silicic acid-saturated steam is of paramount importance.
This effort investigates creep of Hi-Nicalon™ S SiC fibers at 900°C in air and in Si(OH)4
saturated steam. The fiber tows consisting of approximately 500 filaments with an average

vi
diameter of 12 m were subjected to creep tests at 900°C using a unique testing facility
developed at AFIT, Creep stresses ranged from 3.5 to 1180 MPa in air and from 3.5 to 800
MPa in Si(OH)4 saturated steam. Primary and secondary creep regimes were observed in all
tests. Creep run-out defined as 100 h at creep stress was achieved at 736 MPa in air, but only
at 3.5 MPa in Si(OH)4 saturated steam. Creep rates in Si(OH)4 saturated steam were
approximately an order of magnitude higher than those in air. Post-test microstructural
examination revealed passive oxidation of fibers tested in air or in steam, and showed no
evidence of active oxidation.

vii
AFIT-ENY-17-M-277
Acknowledgments
I would like to thank my advisor, Dr. Marina Ruggles-Wrenn. She was a phenomenal
instructor and mentor. She has provided sound guidance and leadership and has earned my
respect for her command presence. She always found time to provide counsel, tirelessly
providing me with the information I needed to finish my thesis. I could not have completed
my research without the maintenance team headed by J.S. They were available day or night
for any problem I had in the laboratory. The hours J.S. spent training and guiding me
through the process of experimentation and SEM work were invaluable and I could not have
completed without him. I would also like to thank Dr. R.H. for his extremely helpful
analysis of microscopy images and guidance on research material. I would like to thank my
parents. My father , a mechanical engineer by his own hand, thanks for teaching me to
never quit and how to work. And my mother, thanks for keeping me on the straight and
narrow path with my schoolwork all those years ago. Finally, and most importantly, I’d like
to acknowledge the support and patience of my beautiful, compassionate, and loving wife
and children for being there for me and keeping me on point as I traversed the world of
academia.
Ronald K. Mitchell

viii
Table of Contents
Abstract ......................................................................................................................................v
Table of Contents .................................................................................................................... viii
List of Figures .............................................................................................................................x
List of Tables ........................................................................................................................ xviii
I. Introduction .........................................................................................................................1
II. Background ............................................................................................................................4
2.1 Ceramic Matrix Composites ...............................................................................................4
2.2 Silicon Carbide ..................................................................................................................6
2.2.1 Silicon Carbide Ceramic ..............................................................................................7
2.2.2 Silicon Carbide Fiber ...................................................................................................8
2.3 Creep................................................................................................................................... 10
III. Material and Test Specimen ............................................................................................... 14
3.1 Material ........................................................................................................................... 14
3.2 Test Specimen ................................................................................................................. 16
IV. Experimental Arrangements and Procedures ................................................................... 20
4.1 Experimental Facility .................................................................................................. 20
4.2 Temperature Profiles ................................................................................................... 26
4.3 Strain Measurement .................................................................................................... 27
4.4 Experimental Procedures for Creep Testing in Air and in Steam ...................................... 31
V. Results and Discussion ....................................................................................................... 32

ix
5.1 Creep of Hi-Nicalon™ S Fiber Tows at 900°C ............................................................ 32
5.2 Post-Test Microstructural Analysis of Hi-Nicalon™ S Fiber Tows .................................. 41
VI. Conclusions and Recommendations ................................................................................ 49
6.1 Conclusions .................................................................................................................. 49
6.2 Recommendations ........................................................................................................ 50
Appendix A. SEM Images ......................................................................................................... 51
Bibliography ............................................................................................................................. 76

x
List of Figures
Figure 1. Composite crack propagation path. b) Fiber pullout: Silceram glass ceramic
reinforced with SiC fibers [1] ......................................................................................... 2
Figure 2. a) β –SiC (3C-SiC) zincblende crystal structure b) α –SiC (6H-SiC) hexagonal
crystal structure .............................................................................................................. 7
Figure 3. SiC powder in refined/unprocessed state. ............................................................... 8
Figure 4. Chemical Vapor Deposition (CVD) process for manufacture of SiC fibers [4]. ....... 8
Figure 5. Cross sectional view of CVD processed SiC fiber [4]. ............................................ 9
Figure 6. Generalized polymer pyrolysis fiber process diagram [4]. ...................................... 9
Figure 7. Three stages of creep deformation: Primary, Secondary and Tertiary. ................... 11
Figure 8. Hi-Nicalon™ S fiber tow on a spool [15] ............................................................. 14
Figure 9. Fiberglass tabs used for fiber tow testing. ............................................................. 16
Figure 10. Tab layout for fiber tow testing........................................................................... 17
Figure 11. Sample preparation board. .................................................................................. 18
Figure 12. Placing primary tab and attaching fiber tow. ....................................................... 18
Figure 13. Test specimen preparation process. ..................................................................... 19
Figure 14. Fiber tow specimen mounted in the creep testing rig. Reproduced from Robertson
[10]. ............................................................................................................................. 22
Figure 15. MHI HGA-S-CX1300 heater (a) and controller (b) [23]. .................................... 24
Figure 16. Creep test facility configured for saturated steam tests. Reproduced from
Robertson [10] ............................................................................................................. 25
Figure 17. Alumina tube used for steam saturation with silica wool. Reproduced from Piper
[20]. ............................................................................................................................. 25

xi
Figure 18. Silica wool inserted into the tube. Reproduced from Piper [20]. .......................... 25
Figure 19. Temperature profile obtained in air at 900°C. ..................................................... 26
Figure 20. Temperature profile obtained in saturated steam at 900°C. ................................. 27
Figure 21. Creep strain vs. time for Hi-Nicalon™ S fiber tows at 900°C in air. ................... 34
Figure 22. Creep strain vs. time for Hi-Nicalon™ S fiber tows at 900°C in air. ................... 34
Figure 23. Creep strain vs. time for Hi-Nicalon™ S fiber tows at 900°C in silicic acid-
saturated steam. ............................................................................................................ 35
Figure 24. Creep strain vs. time for Hi-Nicalon™ S fiber tows at 900°C in silicic acid-
saturated steam. ............................................................................................................ 35
Figure 25. Steady-state creep strain rate vs. applied creep stress for Hi-Nicalon™ S fiber
tows at 700°C [20], 800°C [19], and 900°C in air and in saturated steam............... Error!
Bookmark not defined.
Figure 27. Creep stress vs. time to rupture for Hi-Nicalon™ S fiber tows at 900°C in air and
in saturated steam. Data at 900°C in air from Shillig [ref] is included. Arrow indicates
specimen failure did not occur when test was terminated. ............................................. 38
Figure 28. Steady-state creep rate vs. applied stress for Hi-Nicalon S fiber tows at 800 and
900°C in laboratory air, steam and silicic-acid saturated steam. Results from Robertson
[10] and Shillig [22] are included for comparison. ........................................................ 39
Figure 29. Creep stress vs. time to rupture for Hi-Nicalon S fiber tows at 800 and 900°C in
laboratory air, steam and silicic-acid saturated steam. Results from Robertson [10] and
Shillig [22] are included for comparison. ...................................................................... 40
Figure 30. FEI Quanta 450 Scanning Electron Microscope .................................................. 41

xii
Figure 31. Hi-NicalonTM
S fiber tow specimens tested in creep at 900°C in air and in silicic
acid-saturated steam prepared for examination with an SEM ........................................ 42
Figure 32. Representative fiber from HI-Nicalon S fiber tow specimen subjected to 3.5 MPa
at 900°C in silicic acid-saturated steam for 100 h. Oxide scale is visible (see arrows). .. 44
Figure 33. Representative fiber from HI-Nicalon S fiber tow specimen subjected to 3.5 MPa
at 900°C in silicic acid-saturated steam for 100 h. Fiber interface bridge is visible (see
arrows). ........................................................................................................................ 45
Figure 34. Evidence of environmentally assisted crack growth (EACG) of a) Silicic acid-
saturated steam sample, “Steam 13” and b) “Steam 6” ................................................ 46
Figure 35. Silicic acid-saturated steam exposure leading to longitudinal fiber scale
development during “Steam 1” fiber tow test. .............................................................. 47
Figure 36. Longitudinal fiber scale development during “Air 3” fiber tow test..................... 47
Figure 37. Brittle fracture of “Air 5” fiber tow specimen in air at 900°C. Fracture
propagation point seen by arrow. .................................................................................. 48
Figure 38. SEM micrograph of the Hi-Nicalon™ S specimen “Virgin Sample” examining
surface features ............................................................................................................ 51
Figure 39. SEM micrograph of the Hi-Nicalon™ S specimen “Virgin Sample” examining
surface features ............................................................................................................ 51
Figure 40. SEM micrograph of the Hi-Nicalon™ S specimen “Virgin Sample” examining
surface features ............................................................................................................ 52
Figure 41. SEM micrograph of the Hi-Nicalon™ S specimen “Virgin Sample” examining
surface features ............................................................................................................ 53

xiii
Figure 42. SEM micrograph of the Hi-Nicalon™ S specimen “Virgin Sample” examining
surface features ............................................................................................................ 53
Figure 43. SEM micrograph of the Hi-Nicalon™ S specimen “Air 1” examining fiber
surface in middle portion of fiber (σcr = 3.4695 MPa, tf > 100 h) ................................. 54
Figure 44. SEM micrograph of the Hi-Nicalon™ S specimen “Air 1” examining fiber
surface in middle portion of fiber (σcr = 3.4695 MPa, tf > 100 h) ................................. 54
Figure 45. SEM micrograph of the Hi-Nicalon™ S specimen “Air 2” examining fiber
surface in lower portion of fiber (σcr = 802 MPa, tf = 2.94 h) ....................................... 55
Figure 46. SEM micrograph of the Hi-Nicalon™ S specimen “Air 2” examining the lower
fracture surface of a fiber (σcr = 802 MPa, tf = 2.94 h) ................................................. 55
Figure 47. SEM micrograph of the Hi-Nicalon™ S specimen “Air 2” examining fiber
surface in upper portion of fiber (σcr = 802 MPa, tf = 2.94 h) ....................................... 56
Figure 48. SEM micrograph of the Hi-Nicalon™ S specimen “Air 2” examining the upper
fracture surface of a fiber (σcr = 802 MPa, tf = 2.94 h) ................................................. 56
Figure 49. SEM micrograph of the Hi-Nicalon™ S specimen “Air 3” examining the lower
fracture surface of a fiber (σcr = 802 MPa, > 100 h) ...................................................... 57
Figure 50. SEM micrograph of the Hi-Nicalon™ S specimen “Air 3” examining fiber surface
in lower portion of a fiber (σcr = 802 MPa, > 100 h) ..................................................... 57
Figure 51. SEM micrograph of the Hi-Nicalon™ S specimen “Air 3” examining upper
fracture surface of a fiber (σcr = 802 MPa, > 100 h) ...................................................... 58
Figure 52. SEM micrograph of the Hi-Nicalon™ S specimen “Air 3” examining fiber surface
in upper portion of a fiber (σcr = 802 MPa, > 100 h) ..................................................... 58

xiv
Figure 53. SEM micrograph of the Hi-Nicalon™ S specimen “Air 5” examining lower
fracture surface of a fiber (σcr = 1180 MPa, t = 0.12 h) ................................................. 59
Figure 54. SEM micrograph of the Hi-Nicalon™ S specimen “Air 5” examining fiber surface
in lower portion of a fiber (σcr = 1180 MPa, t = 0.12 h). ............................................... 59
Figure 55. SEM micrograph of the Hi-Nicalon™ S specimen “Air 5” examining upper
fracture surface of a fiber (σcr = 1180 MPa, t = 0.12 h). ................................................ 60
Figure 56. SEM micrograph of the Hi-Nicalon™ S specimen “Air 5” examining fiber surface
in upper portion of a fiber (σcr = 1180 MPa, t = 0.12 h). ............................................... 60
Figure 57. SEM micrograph of the Hi-Nicalon™ S specimen “Steam 1” examining fiber
surfaces in middle portion of fiber tow (σcr = 3.5 MPa, > 100 h). .................................. 61
Figure 58. SEM micrograph of the Hi-Nicalon™ S specimen “Steam 1” examining middle
cross section of a fiber. Note defined silica scale growth. (σcr = 3.5 MPa, > 100 h). ...... 61
Figure 59. SEM micrograph of the Hi-Nicalon™ S specimen “Steam 1” examining middle
surface of a fiber (σcr = 3.5 MPa, > 100 h). ................................................................... 62
Figure 60. SEM micrograph of the Hi-Nicalon™ S specimen “Steam 1” examining middle
cross section of a fiber. Note defined silica scale growth. (σcr = 3.5 MPa, > 100 h). ..... 63
Figure 61. SEM micrograph of the Hi-Nicalon™ S specimen “Steam 1” examining middle
cross section of a fiber. Note defined longitudinal silica scale growth from fiber contact.
(σcr = 3.5 MPa, > 100 h). .............................................................................................. 63
Figure 62. SEM micrograph of the Hi-Nicalon™ S specimen “Steam 1” examining middle
cross section of a fiber. (σcr = 3.5 MPa, > 100 h). ......................................................... 64

xv
Figure 63. SEM micrograph of the Hi-Nicalon™ S specimen “Steam 16” examining fiber
surface on lower portion of a fiber. Note longitudinal silica scale. (σcr = 497 MPa, t =
63.84 h). ....................................................................................................................... 64
Figure 64. SEM micrograph of the Hi-Nicalon™ S specimen “Steam 16” examining lower
fracture surface of a fiber (σcr = 497 MPa, t = 63.84 h). ................................................ 65
Figure 65. SEM micrograph of the Hi-Nicalon™ S specimen “Steam 16” examining fiber
surface on upper portion of a fiber. Note longitudinal fiber-fiber contact scale (σcr = 497
MPa, t = 63.84 h). ........................................................................................................ 65
Figure 66. SEM micrograph of the Hi-Nicalon™ S specimen “Steam 16” examining upper
fracture surface of a fiber (σcr = 497 MPa, t = 63.84 h). ................................................ 66
Figure 67. SEM micrograph of the Hi-Nicalon™ S specimen “Steam 13” examining fiber
surface on lower portion of a fiber (σcr = 600 MPa, t = 55.21 h). .................................. 66
Figure 68. SEM micrograph of the Hi-Nicalon™ S specimen “Steam 13” examining lower
fracture surface of a fiber (σcr = 600 MPa, t = 55.21 h). ................................................ 67
Figure 69. SEM micrograph of the Hi-Nicalon™ S specimen “Steam 13” examining fiber
surface on upper portion of a fiber (σcr = 600 MPa, t = 55.21 h). .................................. 67
Figure 70. SEM micrograph of the Hi-Nicalon™ S specimen “Steam 13” examining upper
fracture surface of a fiber (σcr = 600 MPa, t = 55.21 h). ................................................ 68
Figure 71. SEM micrograph of the Hi-Nicalon™ S specimen “Steam 11” examining fiber
surface on lower portion of a fiber. Note anomalous longitudinal scale (σcr = 736 MPa, t
= 21.5 h). ..................................................................................................................... 68
Figure 72. SEM micrograph of the Hi-Nicalon™ S specimen “Steam 11” examining lower
fracture surface of a fiber (σcr = 736 MPa, t = 21.5 h). .................................................. 69

xvi
Figure 73. SEM micrograph of the Hi-Nicalon™ S specimen “Steam 11” examining fiber
surface on upper portion of a fiber. Note anomalous longitudinal scale (σcr = 736 MPa, t
= 21.5 h). ..................................................................................................................... 69
Figure 74. SEM micrograph of the Hi-Nicalon™ S specimen “Steam 11” examining upper
fracture surface of a fiber (σcr = 736 MPa, t = 21.5 h). .................................................. 70
Figure 75. SEM micrograph of the Hi-Nicalon™ S specimen “Steam 12” examining lower
surface on lower portion of a fiber. (σcr = 654.5 MPa, t = 14.1 h)................................ 70
Figure 76. SEM micrograph of the Hi-Nicalon™ S specimen “Steam 12” examining lower
fracture surface of a fiber (654.5 MPa, t = 14.1 h). ....................................................... 71
Figure 77. SEM micrograph of the Hi-Nicalon™ S specimen “Steam 12” examining lower
fiber tow (654.5 MPa, t = 14.1 h). ................................................................................ 71
Figure 78. SEM micrograph of the Hi-Nicalon™ S specimen “Steam 12” examining lower
fiber tow. Note signs of unsaturated steam exposure (spider webbing/silica leeching at
interface) (654.5 MPa, t = 14.1 h). ................................................................................ 72
Figure 79. SEM micrograph of the Hi-Nicalon™ S specimen “Steam 12” examining lower
fiber tow. Note signs of unsaturated steam exposure (spider webbing/silica leeching at
interface) (654.5 MPa, t = 14.1 h). ................................................................................ 72
Figure 80. SEM micrograph of the Hi-Nicalon™ S specimen “Steam 12” examining lower
fiber tow. Note signs of unsaturated steam exposure (spider webbing/silica leeching at
interface) (654.5 MPa, t = 14.1 h). ................................................................................ 73
Figure 81. SEM micrograph of the Hi-Nicalon™ S specimen “Steam 12” examining lower
fiber tow. Note signs of unsaturated steam exposure (spider webbing/silica leeching at
interface) (654.5 MPa, t = 14.1 h). ................................................................................ 73

xvii
Figure 82. SEM micrograph of the Hi-Nicalon™ S specimen “Steam 12” examining upper
fiber tow. Note signs of saturated steam exposure (dewetting [30]/silica deposition)
(654.5 MPa, t = 14.1 h). ............................................................................................... 74
Figure 83. SEM micrograph of the Hi-Nicalon™ S specimen “Steam 12” examining upper
fiber tow. Note signs of saturated steam exposure (dewetting [30]/silica deposition)
(654.5 MPa, t = 14.1 h). ............................................................................................... 74
Figure 84. SEM micrograph of the Hi-Nicalon™ S specimen “Steam 12” examining upper
fiber tow. Note signs of saturated steam exposure (pronounced silica scale deposition,
also reported by Roberston [10]) (654.5 MPa, t = 14.1 h). ............................................ 75

xviii
List of Tables
Table 1. Process for commercial and developmental polymer-derived ceramic fibers [7]. .... 10
Table 2. Creep mechanisms in fine-grained polycrystalline ceramics [14]. .......................... 13
Table 3. Typical properties of Hi-Nicalon™ S fiber tow; data reproduced from NGS
Advanced Fibers Co., Ltd. [18] .................................................................................... 15
Table 4. Effective gauge lengths of Hi-NicalonTM
S fibers at 900C ..................................... 31
Table 5. Summary of tensile creep test results for Hi-Nicalon™ S fiber tows at 900°C in
laboratory air and in silicic acid-saturated steam. ......................................................... 32
Table 6. Hi-Nicalon™ S specimens analyzed using scanning electron microscope. ............. 43

1
I. Introduction
Aerospace and thermal energy systems demand an ever increasing material capability
to operate and sustain at higher temperatures and load levels. As aircraft are being designed
to travel higher, faster, farther, it has become clear that structural materials must compensate
for increasing requirements. Advanced ceramic matrix composites (CMCs) are key to fulfill
this need. Adversity is the father of all ingenuity, a universal truth in scientific advancement.
Composite materials are no different, the rapid development and use of composites began in
the 1940s mainly due to military necessity, the expansion of polymer markets, and high
strength applications needing a suitable replacement.
The first iteration of new materials came in the form of glass fiber reinforced
polymers (GFRPs) in the 1940s. GFRPs presented a high strength material for possible
military considerations. However, replacing a nosecone or helicopter rotor with these new
materials posed a significant problem, brittle behavior. Also GFRPs suffered significantly in
the area of quality control. Part to part, the material failed at different cycles/loads. This is
attributed to flaws in the materials, such as a micro cracks on the surface/internal flaws, a
problem not previously seen with metallic alloys to the extent displayed with this new
material. The stress-to-failure varied significantly between identical components. The
number of flaws and their sizes were different for each manufactured piece. The realm of
fracture mechanics was forced to re-evaluate how this class of materials was treated and
implemented. A significant milestone in the development of composite materials was the
realization of scientists and engineers that if fibers could be placed in a matrix of a lower
fracture strength material, they could arrest crack propagation (see Figure 1). The fiber
added strength to the fragile polymer through their strong interfacial bonds.

2
Figure 1. Composite crack propagation path. b) Fiber pullout: Silceram glass ceramic
reinforced with SiC fibers [1]
The second iteration of composites occurred in the 1950s in France. A need arose for
higher modulus fibers for new applications, i.e. space travel. Sputnik’s launch in 1957
marked the beginning of the space race, thus driving the need to develop even
stronger/lightweight materials that could break Earth’s gravity and survive the high
temperature re-entry of space vehicles. Carbon (graphite) fibers and Boron fibers were
introduced as a new type of reinforcement to meet the growing demands. Boron fibers
presented a stronger replacement than its Carbon counterparts, but manufacturing capabilities

3
and lower cost pushed Carbon to the forefront. One customer that was not as constrained by
cost was the US military. Unfortunately, with all the possible applications of Boron fiber
reinforced composites, the material never made a name for itself in industry. One exception
is a material developed by DuPont called Kevlar. Initial efforts for applications failed until
the new material was spun and formed into a weave. The resulting fibers/weaves were five
time stronger than steel.
The third iteration, and the subject of this thesis, was the development of metal matrix
composites (MMCs) and ceramic matrix composites (CMCs). CMCs came to fruition with
the development of high temperature structural fibers, such as SiC. This was a key hurdle to
overcome due to the high temperatures needed for sintering. These SiC fibers decreased the
thermal coefficient of expansion, and when used as continuous fibers, increased thermal and
strength properties at operating temperatures as well as provided significant creep resistance
in the new composites. These SiC fibers merited further development, and continue to do so
[1].

4
II. Background
2.1 Ceramic Matrix Composites
Ceramic matrix composites (CMCs) provide material characteristics very desirable
for many engineering applications. They incorporate high strength, high plastic deformation
resistance, and temperature/chemical resistance as well as increase the flaw tolerance in
comparison to monolithic materials. These attributes make them an ideal replacement for
many applications in propulsion systems or thermodynamic cycles. Although there are many
types of CMCs, (i.e. oxide/non-oxide, continuous fiber/whisker fiber, etc), continuous fiber
CMCs are of most importance for the aforementioned applications. Continuous fiber re-
enforcement increases crack resistance, or commonly referred to as fracture resistance.
Properly designed fiber/matrix interfaces arrest/deflect cracks under normal loading
conditions, thus preventing early failure. The fiber can still support the load sufficiently
enough to categorize the failure as a “graceful” failure, a fibrous failure similar to that which
occurs in wood [2].
The ceramic matrix binds the CMC together and transfers the load to the fibers. Its
properties are established by the types of constitutive atoms, type of bonding (ionic or
covalent), and its crystal structure. Oxide matrices are typically paired with oxide fibers and
non-oxide matrices are paired with non-oxides. Typical types are C/C, C/SiC, SiC/SiC, and
Ox/Ox. The properties of the matrix material, which may be nearly identical with respect to
chemical composition, typically differ from the fiber properties usually differing by an order
of magnitude [3]. The matrix must bind the composite together while delineating the fiber
interface to ensure non brittle behavior. A compliant material is coated onto the fiber
material, typically called an interphase material. Ideally, the interphase material has a

5
layered crystal structure that is parallel to the fibers. The interphase should be well bonded
to the fiber, but not as thoroughly coupled to the matrix [4].
CMC constituent materials are typically very brittle. Even though the 2 components
are brittle, CMCs exhibit excellent strength/toughness. They are damageable elastic
materials which, when placed under load, micro cracking occurs initiating fiber/matrix (F/M)
de-bonding. This de-bonding decreases stiffness and non-linear stress/strain is exhibited.
This de-bonding is ideal behavior for “non-brittle” behavior, however, oxygen diffusion
increases causing oxygen embrittlement [5]. This embrittlement is a type of stress corrosion
cracking (SCC) which occurs at a higher rate in the region with the highest stress intensity,
perpendicular to the applied load, and is commonly referred as environmentally assisted
crack growth (EACG). CMCs should be chosen for material properties that are best suited
for the temperature/pressure range, chemical resistance, oxidation resistance, and structural
applications.
Discontinuous fiber reinforced CMCs (i.e. whisker, particulate nanocomposite)
exhibit high yield strengths (YS) and ultimate tensile strengths (UTS) approaching 1000
MPa. Conversely, continuous fiber reinforced CMCs have approximately 75 MPa (YS) and
350 MPa UTS. However, continuous fibers are responsible for establishing a much higher
strain to failure (STF) and thus, they have much higher fracture toughness. These fibers also
establish the load carrying capability of the CMC (yield strength and ultimate strength).
Defects in CMCs are virtually impossible to eradicate, but when coupled with the
material properties between the fibers/matrix, they create “matrix cracking strength”.
Typically, the matrix cracking strength and YS of CMCs are one and the same. As the load
increases in a CMC cracking initiates, the stress-strain relationship becomes nonlinear. This

6
fact, coupled with the lower YS/UTS, ensures that most continuous fiber SiC/SiC
components are designed to be used well below their yield strength. For short interval
applications the high STF property of these continuous fiber CMCs allow them to be used
above their proportional limit, giving them exceptional resistance to thermal shock and
ensures graceful failure [5].
2.2 Silicon Carbide
Silicon Carbide was discovered in ca. 1905 by Henri Moissan in samples excavated
from Diablo Canyon, Arizona in the late 1890s. The aptly named, Moissanite, meteorite
contained single SiC crystals with extraordinary isotopic characteristics. The nature of these
primitive pre-solar grains is defined in terms of the ratios of 29
Si/28
Si and 30
Si/28
Si. It is
speculated that these SiC crystal rich meteorites where collected in the accretion discs as our
solar system was formed. However, these isotopic ratios are not dominant in our sun
indicating they were formed closer to the center of the Milky Way galaxy. Of significant
note, the cubic-β polymorph showed dominant compared to the α-polymorph in contradiction
of laboratory experiments, specifically at the high temperatures the crystals must have been
subjected to during formation in early stars. β –SiC (3C-SiC) is formed at temperatures
below 1700°C, whereas α –SiC (6H-SiC) is formed above 1700°C (see Figure 2). This
anomaly is yet to be explained [6].
7
Figure 2. a) β –SiC (3C-SiC) zincblende crystal structure b) α –SiC (6H-SiC) hexagonal
crystal structure
2.2.1 Silicon Carbide Based Ceramics
In SiC/SiC CMCs, β –SiC is the type typically used. The Carbon/Silicon atoms are
tetrahedral bonded in the zinc-blende structure, containing very strong bonds. A monolithic
ceramic SiC material (see Figure 3) of this type has high hardness and strength but suffers
from low fracture toughness (extremely brittle) compared to other common engineering
alloys. Typically, the fracture toughness, K1C of monolithic ceramics do not exceed values of
5 MPa(m1/2
) (note: discontinuous fiber CMC (whisker fibers): 7-12 MPa(m1/2
), and
continuous fiber CMC: 30 MPa(m1/2
) ) [5]. SiC exhibits increased resistance to acids,
alkalis, and molten salts up to 800°C. SiC exhibits excellent oxidation resistance at
temperatures exceeding 1600°C due to a protective oxidative layer (sacrificial Si to SiO2).
Near stoichiometric SiC (minimal impurities at grain boundaries), demonstrates sustained
high temperature strength and chemical resistance [7].

8
Figure 3. SiC powder in refined/unprocessed state.
2.2.2 Silicon Carbide Fiber
One of the oldest types of SiC fiber manufacturing is chemical vapor deposition
(CVD). As seen in Figure 4 and Figure 5 high temperature resistant material is selected,
drawn into a fine diameter wire, and heated to the desired temperature for material deposition
(typically Tungsten/ β-Carbon for SiC deposition). This process creates a large diameter
fiber (>75 µm) and is typically unsuitable for weaving [4].
Figure 4. Chemical Vapor Deposition (CVD) process for manufacture of SiC fibers [5].

9
Figure 5. Cross sectional view of CVD processed SiC fiber [5].
This type of SiC fiber is called SCS, was first fabricated by Textron consists of
stoichiometric SiC with a columnar grain structure which radiates outward from the core.
The diameters of SCS can range from 79-140 µm [5].
Currently, most SiC fibers that are commercially available have diameters less than
20 µm. They are in multifilament bundles (fiber tows) and are created using pyrolysis of
organosilicon polymers (see Figure 6 and Table 1).
Figure 6. Generalized polymer pyrolysis fiber process diagram [5].

10
Table 1. Process for commercial and developmental polymer-derived ceramic fibers [4].
Company Fiber Spin Method Cure Method Ceramic Composition
NCK a
CG
NICALON melt air oxidation Si-C-O
HI-NICALON
melt electron beam SiC + C
HI-
NICALON S melt electron beam SiC
Ube b TYRANNO melt air oxidation Si-C-O-Ti melt electron beam Si-C-Ti TYRANNO-
Z melt air oxidation Si-C-O-Zr
melt electron beam Si-C-Zr
MER/UMc — solution dry thermal +
chemical SiC
3M/UF d — solution dry thermal + chemical
SiC + C or SiC
DCC e SYLRAMIC melt air oxidation SiC + TiB2
Bayer f —
melt
chemical Si-N-B-C-O or Si-N-B-O
2.3 Creep
Creep is a time-dependent deformation under an applied load usually occurring at high
temperature (commonly referenced at temperatures above 0.5*Tm), but can also occur at
room temperature in certain materials. In CMCs creep is typically seen at a low strain-rate
and intermediate stress loading condition [8]. As discussed in Section 1, CMCs represent a
significant advance in aerospace and thermal applications. In a jet engine combustion

11
chamber, these materials would be subjected to high temp (up to 2000°C), long duration, and
cyclic loading. Creep deformation ultimately concludes with a brittle rupture if steps are not
taken to prevent catastrophic failure. As seen in Figure 7 Creep is divided into three
regimes: primary, secondary and tertiary.
Figure 7. Three stages of creep deformation: Primary, Secondary and Tertiary.
Primary creep begins with an extremely high rate and slows with time. Secondary
creep, the region of most interest for CMCs, has a uniform rate “quasi-steady-state regime”
[9]. And finally, tertiary creep has an accelerated creep rate and ultimately terminates when
the material breaks/ruptures. Tertiary creep in non-brittle materials is associated with both
necking and formation of grain boundary voids. In ceramic materials, tertiary creep does not
occur. As stated, secondary creep is of most interest in CMCs. Steady state creep at elevated
temperatures is driven by multiple mechanisms as seen in Table 2.

12
A common formulation of steady state creep is derived from the Arrhenius equation
[10].
𝜀̇ = 𝐵𝐷𝜇𝑏
𝑘𝑇(
𝑏
𝑑)
𝑝
(𝜎
𝜇)
𝑛
(1)
where 𝜀̇ is the strain rate, 𝐵 is a constant, 𝐷 is the diffusion coefficient, 𝜇 is the shear
modulus, 𝑏 is magnitude of the Burgers vector, 𝑘 is the Boltzmann constant, 𝑇 is the absolute
temperature, 𝑑 is the grain size diameter, 𝜎 is the applied tensile stress, 𝑝 is the grain size
power law exponent and 𝑛 is the stress power law exponent. The diffusion coefficient 𝐷, is
given by the expression:
𝐷 = 𝐷𝑜 exp (−𝑄
𝑅𝑇) (2)
where Do is a frequency factor, Q is the creep activation energy, and R is the universal gas
constant [11]. As seen in Equation (3), a power law equation is a very common approach to
determine creep mechanism. Experimental creep data can be used to determine values stress
exponent, 𝑛 [12] (see Table 2).
ε̇ = Aσn (3)

13
Table 2. Creep mechanisms in fine-grained polycrystalline ceramics [13].
n
stress exponent
p
grain size exponent
Mechanism
1 2 Diffusional creep through lattice
(Nabarro-Herring creep)
1 3 Diffusional creep along grain
boundaries (Coble creep)
2 1 Grain boundary sliding and interface-
reaction controlled creep
4 3 Grain boundary sliding and
cavity growth
3-5 0 Dislocation creep: 3 –glide controlled,
5 –climb controlled
>5 Cavity growth controlled creep

14
III. Material and Test Specimen
3.1 Material
This research studied Hi-Nicalon™ S fiber tows produced by Nippon Carbon Co Ltd
of Tokyo, Japan (see Figure 8). Hi-Nicalon™ S is a near stoichiometric β-SiC fiber
produced via near-oxygen free utilizing de-carbonization pyrolysis and electron beam curing.
It has significantly higher modulus, better creep resistance, and better oxidation resistance
than previous generations of Hi- NicalonTM
fibers [14].
Figure 8. Hi-Nicalon™ S fiber tow on a spool [14]
The fiber tows consisted of approximately 500 filaments with an average diameter of
12 µm [15]. The cross sectional area of the fiber tow calculated as 5.658x10⁻⁸
m2
was used in
all engineering stress calculations. Mechanical strength properties reported for small-

15
diameter SiC fibers, such as Hi Nicalon Type STM
are typically obtained from single fiber
tests and are usually higher than the values obtained for multi-filament fiber tows. Notably,
the average strength reported for a single Hi NicalonTM
Type S fiber is 1900 MPa, while the
average strength reported for a Hi NicalonTM
Type S fiber tow is 1450 MPa [16]. However,
CMCs are reinforced with woven or braided fiber tows rather than single fibers. Due to the
weaving process, fibers are tightly packed and 90% of neighboring fibers contact one
another. These fiber tows are the fundamental unit of any CMC. Hence mechanical testing
of fiber tows offer better insight into performance of the composite than testing of single
filaments as fiber tows. Typical properties of Hi-Nicalon™ S fiber tow, as provided by the
manufacturer, are summarized in Table 3.
Table 3. Typical properties of Hi-Nicalon™ S fiber tow; data reproduced from NGS
Advanced Fibers Co., Ltd. [17]
Number of filaments 500
Filament diameter (µm) 12
Product Form Tow
Sizing Agent PVA
Linear density, tex (g/km) 198
Oxygen content (wt%) 0.8
Modulus of Elasticity (GPA) 380
16
3.2 Test Specimen
Test specimens were prepared utilizing the three tab method developed by Steffens
[18]. This method was also used by Robertson [19], Sprinkle [11], and Piper [20]. A
detailed step-by-step description of the specimen preparation process is given in Appendix
A1 of Steffens [19].
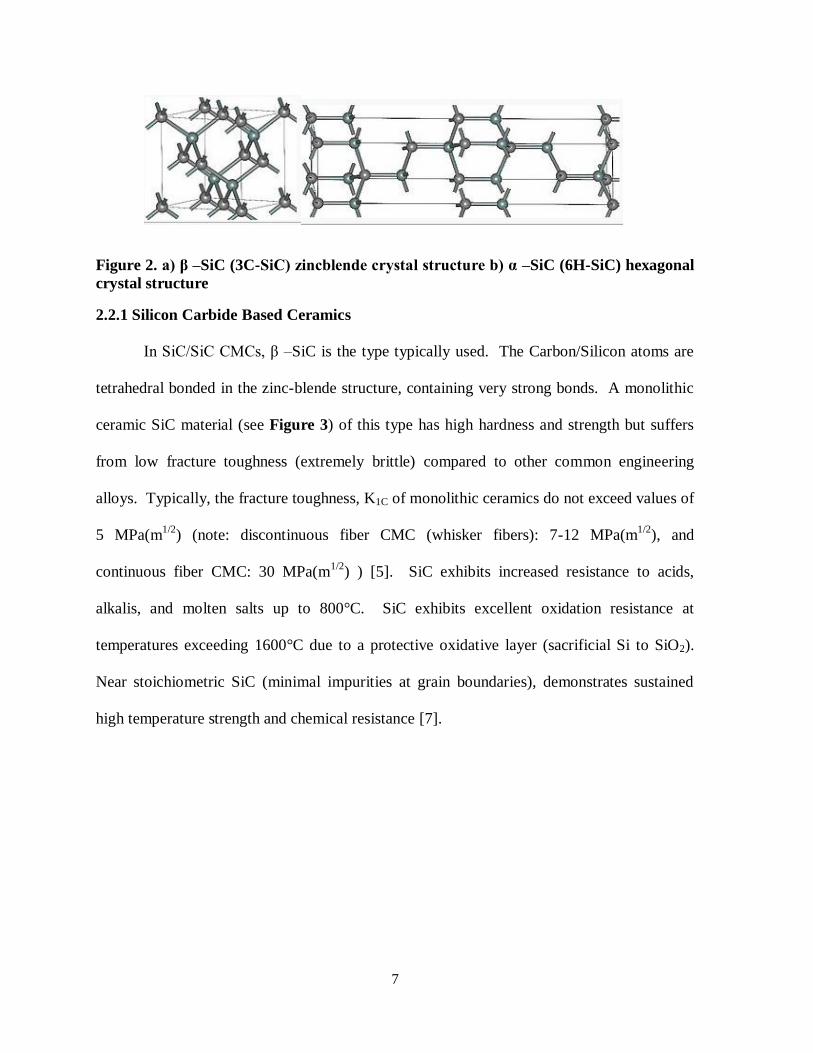
Each fiber was fastened utilizing three fiberglass tabs (primary, secondary, and
tertiary). The primary tab is 1.0 in x 1.5 in (0.0254 m x 0.0381 m), the secondary tab is 1.0
in x 1.0 in (0.0254 m x 0.0254 m), and the tertiary tab is 0.75 in x 0.75 in (0.0191 m x 0.0191
m) (see Figure 9).
Figure 9. Fiberglass tabs used for fiber tow testing.
A hole was punched along the centerline of each primary tab. The hole is used to
suspend the specimens from the hook fixture for tensile creep testing. The primary and

17
secondary tabs where sanded to prevent sharp edges from impinging on the samples during
handling and testing. A schematic of the three-tab arrangement is shown in Figure 10.
Figure 10. Tab layout for fiber tow testing.
For test specimen preparation the primary tabs were secured on the grid of the sample
preparation board (see Figure 11) with a 7 in (0.178 m) gap between the tabs along one of
the gridlines and another gridline bisecting the hole punched in the primary tab. A length of
fiber tow was cut from the spool, aligned along the gridline and attached to the primary tabs
with tape (see Figure 12). The secondary tab was attached using a two part epoxy. The
epoxy used required a 5-min cure for handling and a recommended 24 hour cure for working.
After 5 minutes, the excess fiber was folded over the secondary tab and the tertiary tab was

18
then applied using epoxy. After 5 minutes, the excess fiber protruding from the tertiary tab
was removed using a razor blade (see Figure 13).
Figure 11. Sample preparation board.
Figure 12. Placing primary tab and attaching fiber tow.

19
Figure 13. Test specimen preparation process.

20
IV. Experimental Arrangements and Procedures
4.1 Experimental Facility
The tests for this research were conducted at AFIT in the Mechanics of Advanced
Aerospace Materials Laboratory, Department of Aeronautics and Astronautics. The baseline
fiber-tow testing facility was originally built by Armani [13] for testing of oxide fiber tows at
elevated temperature in air and in and steam environments. Steffens [21] and Shillig [22]
modified the experimental setup for testing of SiC fiber tows. Shillig discovered that steam
environment caused severe degradation of SiC fiber tows during creep tests. Shillig reported
that the bottom sections of SiC fiber tows tested at elevated temperature in steam exhibited
signs of active oxidation, while the top sections of the fiber tow exhibited signs of passive
oxidation. Recognizing that steam entered through a feeding tube located at the bottom of the
test chamber, it was concluded that steam leached Si from the SiC fibers as it traveled
upwards through the test chamber and became saturated with silicic acid (Si[OH]4) as it
reached the top of the test chamber. Steam became chemically altered as it traveled upwards
along the fiber tow causing the oxidation mechanism to change from active oxidation in the
bottom section of the tow to passive oxidation in the top section of the fiber tow. Steam
entering the test chamber had to be saturated with silicic acid in order to produce consistent
oxidation of the fiber tow specimen.
Subsequently, Robertson [19] and Sprinkle [11] modified the fiber tow testing
facility to deliver silicic acid-saturated steam to the test chamber. Furthermore, the modified
facility permitted heating steam to test temperature prior to entering the test chamber. It
should be noted that testing SiC fiber tows at elevated temperature in silicic acid-saturated
steam effectively mimics the conditions imposed on the SiC fibers reinforcing SiC/SiC

21
composite. When a SiC/SiC composite is subjected to mechanical loading in steam, fiber-
bridged matrix cracks form on the surface of the composite. If these cracks are exposed to
steam environment, steam enters through the cracks and reacts the SiC matrix, leaching Si
from the matrix to become saturated with Si[OH]4. The silicic acid-saturated steam then
travels into the interior of the composite to attack the oxidation prone SiC fibers. Robertson
[24] successfully used the modified experimental facility to test Hi Nicalon™ S fiber tows in
creep at 800 °C in air and in silicic acid-saturated steam. Piper [20] explored creep
performance of Hi Nicalon™ S fiber tows at 700°C in air and in silicic acid-saturated steam.
In this research, we aim to investigate creep performance of Hi Nicalon™ S fiber tows at 900
°C in air and in silicic acid-saturated steam.
A detailed description of the modified test facility is given by Roberson [24]. A brief
summary of the fiber tow testing facility is provided below. All tests employed an alumina
susceptor (tube with end caps), which fits inside the furnace. The specimen test section is
located inside the susceptor, with the ends of the specimen passing through slots in the
susceptor (see Fig. 16). The use of alumina susceptor for testing in air provides for a more
uniform temperature distribution along the test specimen. When testing in steam, silicic
acid-saturated steam is introduced into the susceptor (through a feeding tube near the bottom
of the susceptor) in a continuous stream with a slightly positive pressure, expelling the dry air
and creating a near 100% silicic acid-saturated steam environment inside the susceptor.
A detailed description of the modified test facility is given by Roberson [24]. A brief
summary of the fiber tow testing facility is provided below. All tests employed an alumina
susceptor (tube with end caps), which fits inside the furnace. The specimen test section is
located inside the susceptor, with the ends of the specimen passing through slots in the

22
susceptor (see Figure 14). The use of alumina susceptor for testing in air provides for a
more uniform temperature distribution along the test specimen. When testing in steam,
silicic acid-saturated steam is introduced into the susceptor (through a feeding tube near the
bottom of the susceptor) in a continuous stream with a slightly positive pressure, expelling
the dry air and creating a near 100% silicic acid-saturated steam environment inside the
susceptor. The elevated temperature test environment was provided by an MTS 653.03A
two-zone resistance furnace equipped with four silicon carbide heating elements and two R-
type non-contact control thermocouples, which supply feedback to two MTS 409.83
temperature controllers.
Figure 14. Fiber tow specimen mounted in the creep testing rig. Reproduced from
Robertson [19].

23
A high resolution linear variable differential transformer (LVDT) was used to
measure the displacement of the specimen throughout the test. Temperature profiles were
measured throughout the length of the furnace with a K-type thermocouple utilizing a
hydraulic ram actuator and MTS digital controller. Using the calculated temperature profiles,
an effective gauge length of the fiber tow specimen can be calculated. Using the effective
lengths, engineering strain can be calculated from the recorded displacement of the LVDT.
Technique for determining temperature profiles and methods for calculating strain from
displacement measurements are discussed in sections 4.2 and 4.3 below.
For tests in silicic acid-saturated steam, a steam generator manufactured by
Micropyretics Heaters International (MHI), model HGA-H was used. Previous research
conducted by Armani [13], Steffens [21], Shillig [22], Robertson [19], and Piper [20] utilized
both HGA-H and HGA-S steam generators. The HGA-S model is identical to the HGA-H in
terms of internal components and function, as well as additional thermocouples for
temperature readout and control.
A peristaltic pump, Cole Parmer ® model 7518-10, was used to deliver 16-16.6 ml of
de-ionized water to the steam generator. As flow rates above or below the prescribed design
limits could cause damage to the steam generator, an alumina tube orthogonal to the
susceptor steam inlet tube was used to regulate steam flow into the test chamber to prevent
damage to the SiC fiber. The de-ionized water was supplied from a 50 gal reservoir.
24
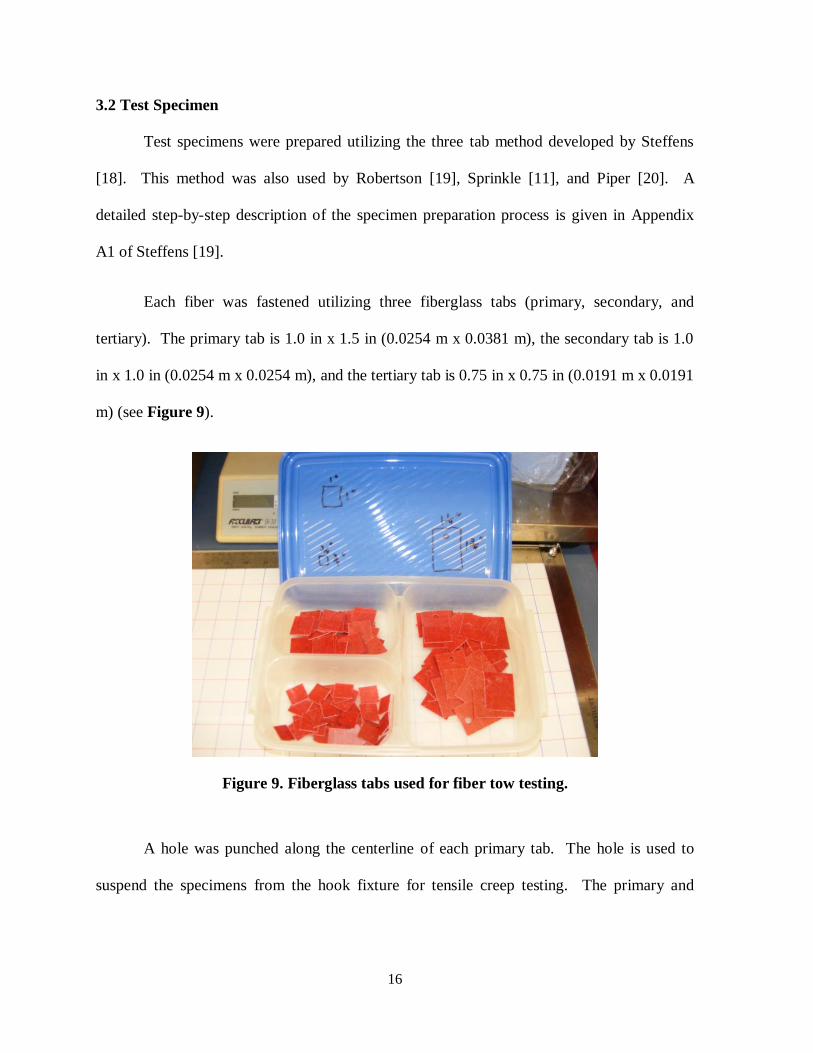
Figure 15. MHI HGA-S-CX1300 heater (a) and controller (b) [23].
After leaving the HGA-H/S steam generator, the steam entered into an alumina tube
that contained sacrificial silica in order to saturate the steam with silicic acid (see Figure 17
and Figure 18). The alumina tube was placed inside two MHI CXI1300 heaters. (see Figure
15(a)), The MHI CX1300 heaters equipped with heating coils manufactured by I Squared R
Element Co. and encased in RATH KVS 174/400 insulation. The two CX1300 heaters were
controlled by an IBPAN controller shown in Figure 15(b). The output of the IBPAN
controller was sent to a transformer for the appropriate voltage adjustment before powering
the CX1300 heaters. The CX1300 heaters were controlled by a variable rheostat. As the
steam moves through the alumina tube filled with silica wool, it becomes saturated with
silicic acid and is heated to the desired test temperature. Then the saturated steam heated to
the test temperature enters the test chamber. The overall experimental facility is shown in
Figure 16.

25
Figure 16. Creep test facility configured for saturated steam tests. Reproduced from
Robertson [19]
Figure 17. Alumina tube used for steam saturation with silica wool. Reproduced from
Piper [20].
Figure 18. Silica wool inserted into the tube. Reproduced from Piper [20].
26
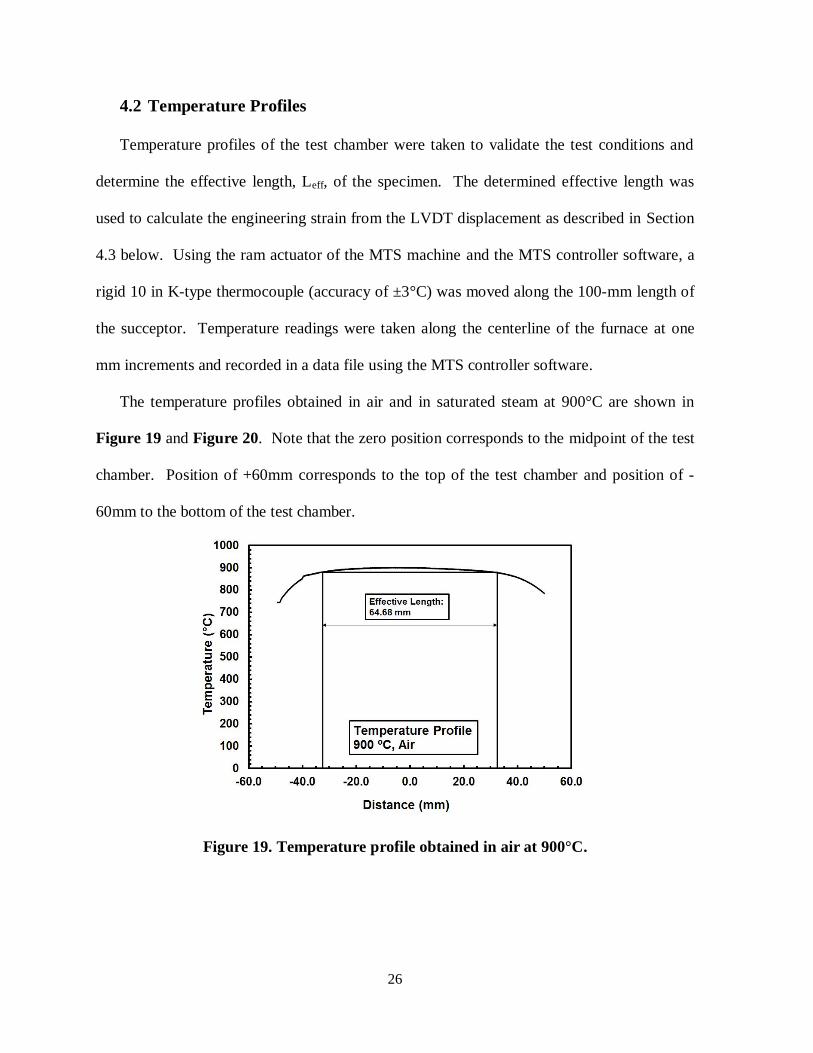
4.2 Temperature Profiles
Temperature profiles of the test chamber were taken to validate the test conditions and
determine the effective length, Leff, of the specimen. The determined effective length was
used to calculate the engineering strain from the LVDT displacement as described in Section
4.3 below. Using the ram actuator of the MTS machine and the MTS controller software, a
rigid 10 in K-type thermocouple (accuracy of ±3°C) was moved along the 100-mm length of
the succeptor. Temperature readings were taken along the centerline of the furnace at one
mm increments and recorded in a data file using the MTS controller software.
The temperature profiles obtained in air and in saturated steam at 900°C are shown in
Figure 19 and Figure 20. Note that the zero position corresponds to the midpoint of the test
chamber. Position of +60mm corresponds to the top of the test chamber and position of -
60mm to the bottom of the test chamber.
Figure 19. Temperature profile obtained in air at 900°C.

27
Figure 20. Temperature profile obtained in saturated steam at 900°C.
4.3 Strain Measurement
As seen in Figure 14, tensile creep tests were performed using a dead-weight creep
rig. The elongation of the fiber tow specimen was measured with an LVDT (Schaevitz M12-
30) connected to the bottom tab of the fiber tow specimen. The rod extending from the
bottom of the LVDT core held the dead weight. An MTS FlexTest 40 digital controller was
used to record the displacement data.
The nature of the fiber tow test specimens does not permit the use of direct contact
strain measurement using extensometry. Therefore, indirect methods must be used to
determine the strain in the fiber tow specimen. The elongation of the fiber tow specimen was
measured with an LVDT (Schaevitz M12-30) connected to the bottom tab of the fiber tow
specimen. An MTS FlexTest 40 digital controller was used to record the displacement (fiber
elongation) data. Strain was calculated from the specimen elongation measurements using
published methods [24], [25], [26]. Because the cold grip method was used, specimen

28
elongation was measured outside the furnace. Thus the total recorded specimen elongation
was the sum of contributions from parts of the specimen located in different temperature
zones: the hot zone (at uniform test temperature of 900°C), the temperature gradient zone and
the cold zone. Temperature profiles measured for the furnace were employed to determine
the effective gauge lengths of 64.68 mm at 900°C in air and 68.87 mm at 900°C in silicic
acid-saturated steam, which were used to calculate creep strain and strain rate in the hot zone.
This method was successfully used to determine strain and strain rates from displacement
data obtained in elevated-temperature creep tests of oxide fiber tows [13] and SiC fiber tows
[19], [11], [20]. The detailed description of this method to determine strain and strain rate
from displacement measurement is given elsewhere [13]. A brief description is offered
below.
Consider a fiber tow test specimen of length 2L. Taking the midpoint of the
specimen gauge length as zero, creep is considered to occur over the length from –L to L.
The creep strain and creep strain rate can be calculated as:
𝜀𝑚 =∆𝑙
2𝐿= ∫ 𝜀�̇�𝑑𝑡
𝑡
0
(4)
𝜀�̇� =𝑚𝑒𝑎𝑠𝑢𝑟𝑒𝑑 𝑒𝑥𝑡𝑒𝑛𝑠𝑖𝑜𝑛 𝑟𝑎𝑡𝑒
2𝐿=
1
2𝐿∫ 𝜀̇𝑑𝑙
𝐿
−𝐿
(5)
Note that the total measured strain and strain rate calculated with Equation (4) and
Equation (5) account for the variations in strain and strain rate along the length, 2L, of the
specimen subjected to a temperature profile. Intuitively, the amount of strain will be greatest

29
at the hottest section. The strain and strain rates at the desired test temperature at the center
of the furnace are denoted by the subscript 0. The strain at the center of the furnace is
calculated as the time integral of the strain rate at the center of the furnace and also described
as the overall change in length of the specimen, ∆𝑙, divided by a hypothetical length,
(2𝐿)𝑒𝑓𝑓 , the effective gauge length. The effective gauge length is described as the gauge
length obtained under the peak temperature and zero strain is achieved under the lower
temperature. The strain at the desired maximum temperature can be calculated as:
𝜀𝑜 = ∫ 𝜀�̇�𝑑𝑡𝑡
0
= ∆𝑙
(2𝐿)𝑒𝑓𝑓 (6)
The strain rate at the maximum temperature at the midpoint of the furnace can be
expressed in terms of the effective gauge length as:
𝜀�̇� =𝑚𝑒𝑎𝑠𝑢𝑟𝑒𝑑 𝑒𝑥𝑡𝑒𝑛𝑠𝑖𝑜𝑛 𝑟𝑎𝑡𝑒
(2𝐿)𝑒𝑓𝑓=
1
(2𝐿)𝑒𝑓𝑓
∫ 𝜀̇𝑑𝑙𝐿
−𝐿
(7)
The ratio of Equation (5) to Equation (7) can be written as:
𝜀�̇�
𝜀0̇=
∆𝑙
(2𝐿)𝑒𝑓𝑓 (8)

30
Stress is constant in dead-weight creep testing and temperature can be considered as a
function of location along the specimen according to the temperature profile. Applying these
variables to the general power creep law yields:
𝜀̇ = 𝐴𝜎𝑛exp (−𝑄
𝑅𝑇(𝑙)) (9)
Combining Equation (5), Equation (8) and Equation (9), the ratio can be expressed
as measured strain rate to actual strain rate as a function of temperature only:
𝜀�̇�
𝜀0̇=
1
2𝐿∫ exp {
−𝑄
𝑅(
1
𝑇(𝑙)−
1
𝑇0)} 𝑑𝑙
𝐿
−𝐿
(10)
This ratio can be expressed as a numerical summation of increments of length, h,
where L=hk and k is an integer. The ratio of measured to actual strain rate becomes:
𝜀�̇�
𝜀0̇=
1
2𝑘∑ exp {
−𝑄
𝑅(
1
𝑇(𝑙)−
1
𝑇0)}
𝑘
𝑖=−𝑘
(11)
The effective gauge length is now calculated as:
:
(2𝐿)𝑒𝑓𝑓 = 2𝐿 (𝜀�̇�
𝜀0̇) (12)

31
The effective gauge length can now be used to determine the strain and strain rate of
the fiber tow specimen using the displacement calculations from the LVDT. This approach,
along with the temperature profiles determined in Section 4.2 and creep activation energy of
177 kJ/mol reported for Hi-Nicalon™ S [27] was used to calculate effective gauge lengths in
air and in steam at 900°C. The calculated effective lengths in air and in steam are shown in
Table 4.
Table 4. Effective gauge lengths of Hi-NicalonTM
S fibers at 900C
Air Saturated Steam
Effective Length (mm) 64.68 68.88
This approach differs from that used by Hammond [28] and Yun et al. [29] in that they
assumed that the majority of creep deformation occurred only within the furnace hot zone
and therefore used the flat portion of the temperature profile to determine the gauge length.
This approach is both subjective because it relies on human determination of the flat zone
and is dependent of the flatness of the temperature profile and the sharpness at which the
temperature drops off at the edges of the hot zone. Alternatively, this method is somewhat
more independent of the shape of the temperature profile.
4.4 Experimental Procedures for Tensile Creep Testing in Air and in Silicic
Acid–Saturated Steam
As discussed in Section 4.1 above, the test facility utilizes a steam generation system
to introduce silicic acid saturated steam into the susceptor containing the test specimen. For
detailed procedures for specimen mounting and creep testing the reader is referred to
Appendix A2 of Steffens [21] and in Appendix A of Piper [20].

32
V. Results and Discussion
5.1 Creep of Hi-Nicalon™ S Fiber Tows at 900°C
Hi-Nicalon™ S fiber tows were subjected to tensile creep tests at 900°C in dry air
and in silicic acid-saturated steam. Creep run-out was set to 100h. Creep-rupture test results
produced in this work are summarized in Table 5 below. Creep strain accumulation, steady-
state creep rate, and rupture time are shown for each creep stress level and environment.
Table 5. Summary of tensile creep test results for Hi-Nicalon™ S fiber tows at 900°C in
laboratory air and in silicic acid-saturated steam.
Specimen Test Creep Creep Steady-State Creep
ID Environment Stress Lifetime Creep Rate Strain
(MPa) (h) (s-1
) (%)
S1 Steam 3.5 100† 9.0 E -10 0.066
S16 Steam 497 63.84 2.0 E -9 0.140
S13 Steam 600 55.21 5.0 E -9 0.303
S11 Steam 736 21.5 8.0 E -8 0.260
S3 Steam 800 0.07 8.0 E -6 0.250
A1 Air 3.5 100† 9.0 E -10 0.078
A3 Air 736 100† 5.0 E -9 0.033
A2 Air 802 2.94 2.0E -8 0.048
A5 Air 1180 0.117 9.0 E -5 0.240
† Creep run-out defined as 100 h at creep stress. Failure of specimen did not occur when
the test was terminated
We note that interpreting results obtained in creep tests of fiber tows is not a trivial
endeavor. Numerous assumptions are made in order to facilitate the analysis of creep test
data. To facilitate the calculation of creep stress (load) levels we assume that each fiber tow
has the same number of intact fibers and that each fiber has the same cross sectional area.
While this assumption is not unreasonable, it does not always accurately represent the
realistic fiber tow. The silicic acid-saturated steam generated and transferred through the

33
steam generator train is assumed to be contaminate free, although it is reasonable to expect
some transference of particulate contaminates from the Alumina tube. Additionally, in
elevated temperature tests oxidation of the fibers in the tow also takes place, causing the
changes in fiber cross-section. A constant cross-sectional area of the fiber tow is used in
stress calculations, yet the cross-sectional area is unlikely to remain constant throughout the
entire test. Many fibers maintain close proximity to one another inside the fiber tow, a
uniform contact area is assumed. Finally, it is difficult to determine whether the progressive
strain accumulation with time observed in the creep experiment is indeed due to creep
deformation of the fibers. It is possible that individual fibers (or small groups of fibers) fail
progressively during the creep test. The load is then transferred to the remaining fibers
causing the stress carried by the intact fibers to increase during the test. In this case the
increasing strain is not due to creep deformation but rather due to continuously increasing
stress.
Representative creep strain vs. time curves obtained at 900°C in air (Figure 21,
Figure 22) and in saturated steam (Figure 23, Figure 24) are shown in Figures x and y,
respectively. Creep curves produced in all tests exhibit primary and secondary creep
regimes, but no tertiary creep. At 900°C primary creep transitions into secondary creep fairly
early in creep life; primary creep persists during the first 8-10 h of the creep test.

34
Figure 21. Creep strain vs. time for Hi-Nicalon™ S fiber tows at 900°C in air.
Figure 22. Creep strain vs. time for Hi-Nicalon™ S fiber tows at 900°C in air.

35
Figure 23. Creep strain vs. time for Hi-Nicalon™ S fiber tows at 900°C in silicic acid-
saturated steam.
Figure 24. Creep strain vs. time for Hi-Nicalon™ S fiber tows at 900°C in silicic acid-
saturated steam.

36
At 900°C the presence of steam has a noticeable effect on creep strains and creep
lifetimes. At 900°C in air, creep run-out was achieved at 736 MPa. In contrast, at 900°C in
saturated steam, creep run-out was achieved only at near zero stress of 3.5 MPa. Creep strain
produced at 736 MPa at 900°C in saturated steam is nearly an order of magnitude higher than
that obtained in air. Detrimental effects of steam are evident.
Steady-state creep was reached in all experiments and dominated the majority of the
creep lifetime. Creep rate as a function of applied stress is presented in Error! Reference
source not found.. The presence of silicic acid-saturated steam increases creep rates of the
Hi-Nicalon S fiber tow. At 900°C the creep rates of the Hi-NicalonTM
S fiber tow in
saturated steam are approximately one order of magnitude higher than those obtained in air.
Fitting the creep results obtained at 900°C in silicic acid saturated steam with a
temperature-independent power law equation [12]:
nA
where is the minimum creep rate, A is a temperature-dependent coefficient that accounts
for the activation energy and other variables, and is the applied stress, yields a stress
exponent n ≈ 5.69. Mechanical failure of the steam generation system during this effort
prevented further testing in air due to time constraints, further testing in air is needed to
calculate the corresponding stress exponent. The stress exponent n ≈ 5.69 obtained at 900°C
in saturated steam suggests cavity growth controlled creep as the primary creep mechanism.
Roberston [19] found the stress exponent of n ≈ 4.1 at 800°C in saturated steam. Piper [20]
determined the stress exponent as n ≈ 5.3 at 700°C in saturated steam. These results suggest
that as the temperature increases, the creep mechanism operating in Hi-Nicalon™ S fibers
changes from climb controlled dislocation towards cavity growth controlled creep.

37
Additional testing is needed to reduce the data scatter and obtain more accurate values of the
stress exponent. Detailed microstructural evaluation of the tested samples would lead to a
more definitive conclusion regarding the controlling creep mechanisms.
Figure 25. Steady-state creep strain rate vs. applied creep stress for Hi-Nicalon™ S
fiber tows at 900°C in air and in saturated steam.
The stress-rupture behavior at 900 °C in air and in saturated steam is summarized in
Figure 26 together with the results obtained at 900°C in air by Shillig [22]. As expected, the
creep lifetime decreases with increasing applied stress. At 900°C, saturated steam reduced
creep lifetimes by approximately one order of magnitude. Notably, a similar one order of
magnitude decrease in creep lifetimes was reported for Hi-Nicalon S fibers at 700°C by Piper
[20] and at 800°C by Robertson [19].

38
Figure 26. Creep stress vs. time to rupture for Hi-Nicalon™ S fiber tows at 900°C in air
and in saturated steam. Data at 900°C in air from Shillig [22] is included. Arrow
indicates specimen failure did not occur when test was terminated.
It is instructive to compare the results obtained for Hi-NicalonTM
S fibers in silicic-
acid saturated steam with those obtained in unsaturated steam. Creep strain rate vs. applied
stress results obtained at 800 and 900 °C in laboratory air, in unsaturated steam and in
saturated steam are presented in Figure 27. Results at 800°C in air are from Shillig [22] and
Robertson [19]. Results at 800°C in unsaturated steam are from Shillig. Results at 800°C in
saturated steam are from Robertson. Results at 900°C in air are from Shillig and current
effort. Results at 900°C in unsaturated steam are from Shillig. Results at 900°C in saturated
steam are from current effort.

39
Figure 27. Steady-state creep rate vs. applied stress for Hi-Nicalon S fiber tows at 800
and 900°C in laboratory air, steam and silicic-acid saturated steam. Results from
Robertson [19] and Shillig [22] are included for comparison.
Comparison of the results obtained at elevated temperature in unsaturated steam and
in silicic acid-saturated steam allows us to determine which of these two environments
causes greater degradation of the creep performance of Hi-NicalonTM
S fibers. As seen in
Figure 27, creep rates produced at 800 and 900 °C in silicic acid-saturated steam are an order
of magnitude higher than creep rates produced in dry air. However, creep rates produced at
800 and 900 °C in silicic acid-saturated steam are an order of magnitude lower than creep
rates in unsaturated steam. Clearly the unsaturated steam causes considerably greater
degradation of the creep resistance of Hi-NicalonTM
S fibers than the unsaturated steam. This
result bodes well for the advanced SiC/SiC CMCs reinforced with Hi-NicalonTM
S fibers. As
mentioned in Section 4.1 above, steam attacking the SiC/SiC CMC operating in combustion
1.E-10
1.E-09
1.E-08
1.E-07
10 100 1000 10000
Cre
ep
Str
ain
Ra
te (
s-1
)
Stress (MPa)
800°C, Air
800°C, Steam
800°C, Sat Steam
900°C, Air
900°C, Steam
900°C, Sat Steam

40
environment will enter the composite through matrix cracks, will leach Si from the SiC
matrix and become saturated with silicic acid as it travels towards the reinforcing fibers. We
can expect better performance from the advanced SiC/SiC composites at elevated
temperature in steam than that indicated by the early work of Steffens [21] and Shillig [22].
These observations are confirmed when we compare the stress-rupture results obtained 800
and 900 °C for Hi-NicalonTM
S fibers in silicic-acid saturated steam with those obtained in
unsaturated steam in Figure 28, where results at 800°C in air are from Shillig [22], results at
800°C in unsaturated steam are from Shillig, results at 800°C in saturated steam are from
Robertson [19], results at 900°C in air are from Shillig and current effort, results at 900°C in
unsaturated steam are from Shillig, and results at 900°C in saturated steam are from current
effort.
Figure 28. Creep stress vs. time to rupture for Hi-Nicalon S fiber tows at 800 and 900°C
in laboratory air, steam and silicic-acid saturated steam. Results from Robertson [19]
and Shillig [22] are included for comparison.
0
200
400
600
800
1000
1200
1400
0 1 10 100
Str
ess
(M
Pa)
Time (h)
800°C, Air
800°C, Steam
800°C, Sat Steam
900°C, Air
900°C, Steam
900°C, Sat Steam
Indicates Run-out
.1 500

41
5.2 Post-Test Microstructural Analysis of Hi-Nicalon™ S Fiber Tows
Post-test microstructural analysis of the Hi-Nicalon™ S fiber tow specimens was
conducted using a FEI Quanta 450 scanning electron microscope (SEM) Figure 29. A total
of sixteen specimens taken from nine fiber tows, five tested in saturated steam and four tested
in air, were analyzed. Fiber tow specimens were prepared for examination with an SEM
using standard methods. A detailed description of the SEM specimen preparation is given
elsewhere [19], [20], [11]. The method for SEM sample preparation is briefly outlined
below.
Figure 29. FEI Quanta 450 Scanning Electron Microscope
Fiber tows were prepared for microstructural analysis by mounting the fibers on an
aluminum puck with a 45° surface. First, double-sided carbon tape was applied to the angled
surface of the mounting puck. The fibers were then pressed onto the carbon tape such that the
portion of the fibers to be analyzed protruded 1-5 mm above the angled surface. After placing
the fibers on the puck, a layer of silver paint was applied in order to secure the fibers in

42
place. The silver paint also provides electric conductivity between the fibers and the
aluminum puck, which is required for SEM imaging. After the fibers were securely fixed in
place, the remainder of the fiber tow was cut at the bottom of the angled surface to separate it
from the specimen to be analyzed.
Figure 30. Hi-NicalonTM
S fiber tow specimens tested in creep at 900°C in air and in
silicic acid-saturated steam prepared for examination with an SEM
All fiber tow specimens tested in this work were examined with an SEM. In the case
of fiber tow specimens that failed during creep test, three samples were examined with an
SEM: (1) fiber tow fracture surfaces, (2) a section of the fiber tow located above the fracture
and (3) a section of the fiber tow located below the fracture. In the case of the fiber tow
specimens that achieved creep run-out of 100 h, the section near the mid-point of the fiber
tow was examined with an SEM. A summary of the SEM specimens examined in this work
is given in Table 6.

43
Table 6. Hi-Nicalon™ S specimens analyzed using scanning electron microscope.
Specimen Creep Test (MPa) Creep Test
Duration (h)
SEM Specimen
Location Within Fiber
Tow
A1 3.5 100* Midpoint
A2 802 2.94 Upper Section
Lower Section
A3 736 100* Upper Section
Lower Section
A5 1180 0.12 Upper Section
Lower Section
S1 3.5 100* Midpoint
S11 736 21.50 Upper Section
Lower Section
S12 654 14 Upper Section
Lower Section
S13 600 55.20 Upper Section
Lower Section
S16 497 63.80 Upper Section
Lower Section
* Run-out, defined as 100 h at creep stress. Failure of specimen did not occur when the test
was terminated.
Previous work by Steffens [21] and Shillig [22] demonstrated that unsaturated steam
entering the test chamber lead to variations in oxidation process along the fiber tow
specimen. Active oxidation was observed in the bottom section of the fiber tow, while
passive oxidation and formation of thick silica was reported near the top of the fiber.
Conversely, fiber tows tested in silicic acid saturated steam by at 800°C by Robertson [19]
and at 700°C by Piper [20] , exhibited passive oxidation along the length of the fiber tow
specimens. Both Robertson and Piper observed that tested fibers had uniform appearance and
reported consistent silica scale growth on the surface of tested fibers. As in the case of fiber
tows tested in saturated steam at 700 and 800°C, fiber tows tested at 900°C in saturated

44
steam also had uniform surface appearance along the entire length of the fiber tow specimen.
Recall that in the case of fiber tows tested in saturated steam at 700 and 800 °C the growth of
silica scale on the fiber surface was not discernible under an SEM. In contrast, in the case of
fibers tested in saturated steam at 900°C the growth of silica scale becomes clearly visible, as
evidenced in Figure 31 and Figure 32. As discussed in 5.1, the fibers within a fiber tow
specimen maintain close proximity to one another during testing. Silica scale growth at
times appeared to encompass multiple fibers; as evidenced by the scale fracture in Figure 32.
Figure 31. Representative fiber from HI-Nicalon S fiber tow specimen subjected to 3.5
MPa at 900°C in silicic acid-saturated steam for 100 h. Oxide scale is visible (see
arrows).

45
Figure 32. Representative fiber from HI-Nicalon S fiber tow specimen subjected to 3.5
MPa at 900°C in silicic acid-saturated steam for 100 h. Fiber interface bridge is visible
(see arrows).
It is recognized that the as-processed SiC fibers contain microstructural defects.
Evidence of environmentally assisted crack growth was noted in fracture surfaces of samples
tested in saturated steam with creep stress of 600 MPa and 736 MPa (see Figure 33).
Significant portions of the fiber fracture surfaces appear to be oxidized, indicating that a
large crack has formed during creep test prior to final fracture of the fiber tow. Moreover,
growth of silica crystals is believed to be seen in the oxidized region of the fracture surface at
the leading edge of crack (see Figure 33b).

46
Figure 33. Evidence of environmentally assisted crack growth (EACG) of a) Silicic
acid-saturated steam sample, “Steam 13” and b) “Steam 6”
A number of fibers showed dark areas as well as mottled areas running axially along
the fiber length, which are presumably a result of contact between fibers during testing (see
Figure 34 and Figure 35). In the case of fibers tested in saturated steam, such linear regions
were accompanied by visible silica formation. Note that similar darks and mottled areas
along the lines of contact between two fibers were also observed at 800°C by Robertson [19]
and at 700°C by Piper [20].

47
Figure 34. Silicic acid-saturated steam exposure leading to longitudinal fiber scale
development during “Steam 1” fiber tow test.
Figure 35. Longitudinal fiber scale development during “Air 3” fiber tow test.
Fracture surfaces of all tested fibers were analyzed using SEM. The fracture surfaces
showed evidence of classic brittle fracture. The fracture surface appears to be perpendicular
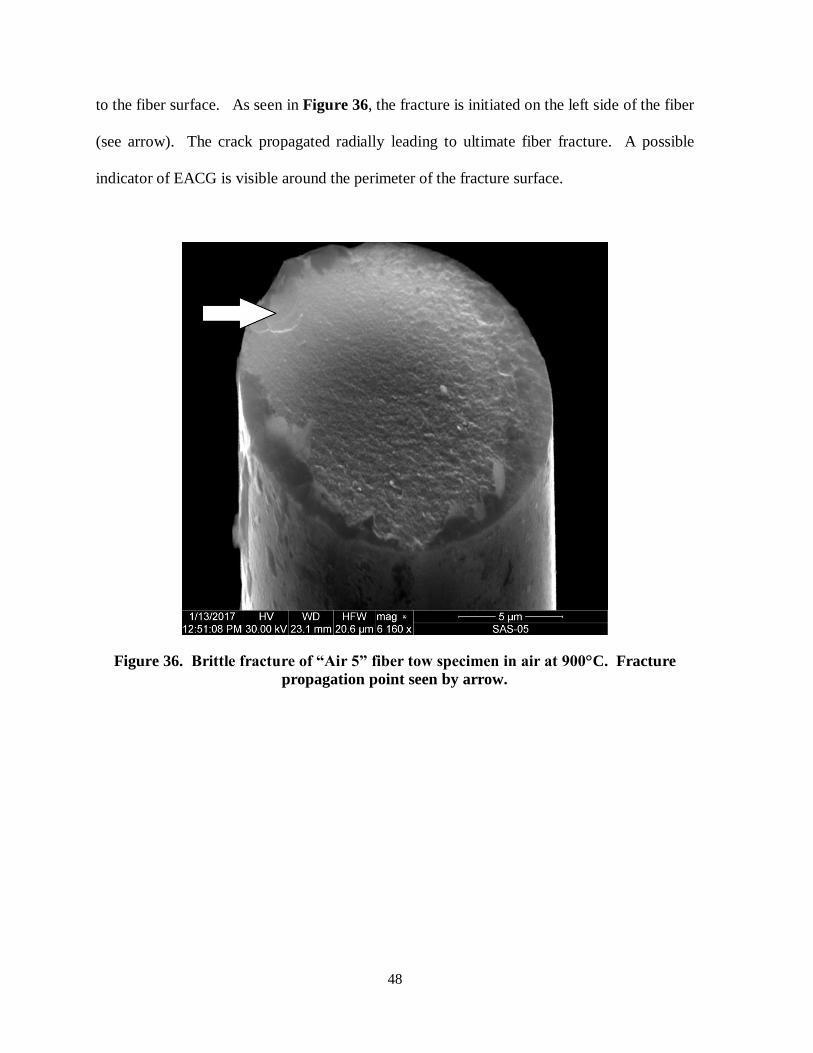
48
to the fiber surface. As seen in Figure 36, the fracture is initiated on the left side of the fiber
(see arrow). The crack propagated radially leading to ultimate fiber fracture. A possible
indicator of EACG is visible around the perimeter of the fracture surface.
Figure 36. Brittle fracture of “Air 5” fiber tow specimen in air at 900°C. Fracture
propagation point seen by arrow.

49
VI. Conclusions and Recommendations
6.1 Concluding Remarks
The effects of silicic acid-saturated steam on creep of Hi-NicalonTM
S fiber tows at 900°C
were investigated in creep tests conducted in silicic acid-saturated saturated steam and in
laboratory air. The presence of silicic acid-saturated steam significantly degraded creep
performance of Hi-NicalonTM
S fibers. In saturated steam, creep lifetimes were reduced by
approximately one order of magnitude compared to those produced in air. In silicic acid-
saturated steam, creep run-out of 100 h was achieved only at near zero stress of 3.5 MPa. At
900°C in air, creep runout was achieved at 736 MPa. Creep rates obtained in silicic acid-
saturated steam were an order of magnitude higher than those produced in air.
Results obtained in saturated steam at 900°C as well as those obtained at 800°C [19] were
compared with creep results produced at 900 and 800 °C in unsaturated steam [22].
Comparison revealed that unsaturated steam was significantly more damaging to Hi-
NicalonTM
S fibers than silicic acid-saturated steam. While the presence of saturated steam
reduced creep lifetimes by one order of magnitude, unsaturated steam degraded creep
lifetimes by two orders of magnitude. While the creep rates in saturated steam were one
order of magnitude higher than those in air, creep rates in unsaturated steam were two orders
of magnitude higher than the rates obtained at 900°C in air [22].
Microstructural analysis of fiber tows tested in creep in silicic acid-saturated steam at
900°C with an SEM revealed evidence of silica scale growth. A small number of fibers
showed evidence of environmentally assisted crack growth.

50
6.2 Recommendations
Creep behavior of Hi-Nicalon™ S fiber tows has been investigated at 700°C [20]
800°C [19] and 900°C in air and in silicic acid-saturated steam. Notably, silica scale growth
was more pronounced at 900°C. The effects of silicic acid-saturated steam on creep of Hi-
Nicalon™ at a wider range of temperatures remain to be investigated. Testing at
temperatures above 900°C is likely to promote the growth of silica scale on the fibers. Thus
the results obtained at temperatures > 900°C will provide additional evidence needed to
determine the effects of a well-developed silica scale on creep performance of Hi-Nicalon™
fibers in the presence of silicic acid saturated steam.
SEM images were collected to analyze the failure mechanisms and oxidation of the
fibers creep tested at 900°C in silicic acid-saturated steam. This work should be
complemented by transmission electron microscopy (TEM) analysis of the fibers. TEM
allows higher magnification and a greater level of fidelity in determining the presence of an
oxide layer or other deposits on the surfaces of the fibers.
Future creep testing of Hi Nicalon S fibers at elevated temperatures in air or in
saturated steam environments should include acoustic emission to capture individual fiber
failure events. The acoustic emission data will be instrumental in determining whether
progressive deformation of the fiber tow under constant applied load is indeed due creep of
fibers or due to progressive failures of individual filaments within the tow.

51
Appendix A. SEM Images
Figure 37. SEM micrograph of the Hi-Nicalon™ S specimen “Virgin Sample”
examining surface features
Figure 38. SEM micrograph of the Hi-Nicalon™ S specimen “Virgin Sample”
examining surface features

52
Figure 39. SEM micrograph of the Hi-Nicalon™ S specimen “Virgin Sample”
examining surface features

53
Figure 40. SEM micrograph of the Hi-Nicalon™ S specimen “Virgin Sample”
examining surface features
Figure 41. SEM micrograph of the Hi-Nicalon™ S specimen “Virgin Sample”
examining surface features

54
Figure 42. SEM micrograph of the Hi-Nicalon™ S specimen “Air 1” examining fiber
surface in middle portion of fiber (σcr = 3.4695 MPa, tf > 100 h)
Figure 43. SEM micrograph of the Hi-Nicalon™ S specimen “Air 1” examining fiber
surface in middle portion of fiber (σcr = 3.4695 MPa, tf > 100 h)

55
Figure 44. SEM micrograph of the Hi-Nicalon™ S specimen “Air 2” examining fiber
surface in lower portion of fiber (σcr = 802 MPa, tf = 2.94 h)
Figure 45. SEM micrograph of the Hi-Nicalon™ S specimen “Air 2” examining the
lower fracture surface of a fiber (σcr = 802 MPa, tf = 2.94 h)
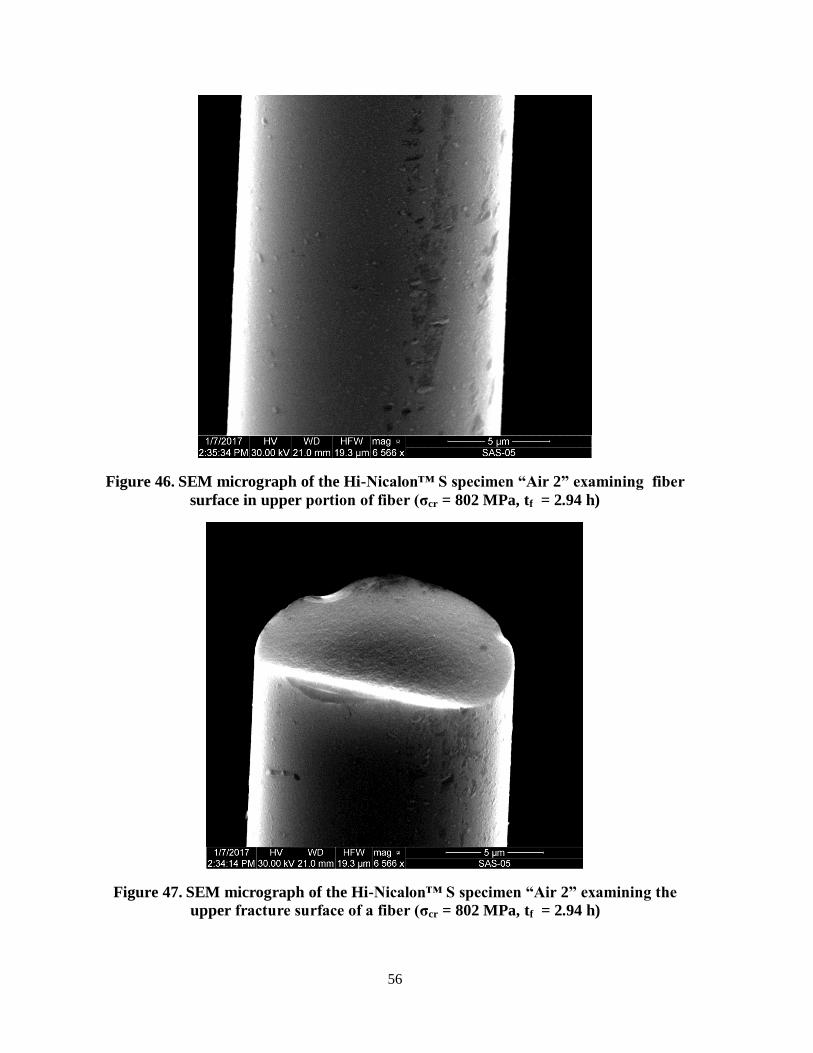
56
Figure 46. SEM micrograph of the Hi-Nicalon™ S specimen “Air 2” examining fiber
surface in upper portion of fiber (σcr = 802 MPa, tf = 2.94 h)
Figure 47. SEM micrograph of the Hi-Nicalon™ S specimen “Air 2” examining the
upper fracture surface of a fiber (σcr = 802 MPa, tf = 2.94 h)

57
Figure 48. SEM micrograph of the Hi-Nicalon™ S specimen “Air 3” examining the
lower fracture surface of a fiber (σcr = 802 MPa, > 100 h)
Figure 49. SEM micrograph of the Hi-Nicalon™ S specimen “Air 3” examining fiber
surface in lower portion of a fiber (σcr = 802 MPa, > 100 h)

58
Figure 50. SEM micrograph of the Hi-Nicalon™ S specimen “Air 3” examining upper
fracture surface of a fiber (σcr = 802 MPa, > 100 h)
Figure 51. SEM micrograph of the Hi-Nicalon™ S specimen “Air 3” examining fiber
surface in upper portion of a fiber (σcr = 802 MPa, > 100 h)

59
Figure 52. SEM micrograph of the Hi-Nicalon™ S specimen “Air 5” examining lower
fracture surface of a fiber (σcr = 1180 MPa, t = 0.12 h)
Figure 53. SEM micrograph of the Hi-Nicalon™ S specimen “Air 5” examining fiber
surface in lower portion of a fiber (σcr = 1180 MPa, t = 0.12 h).

60
Figure 54. SEM micrograph of the Hi-Nicalon™ S specimen “Air 5” examining upper
fracture surface of a fiber (σcr = 1180 MPa, t = 0.12 h).
Figure 55. SEM micrograph of the Hi-Nicalon™ S specimen “Air 5” examining fiber
surface in upper portion of a fiber (σcr = 1180 MPa, t = 0.12 h).

61
Figure 56. SEM micrograph of the Hi-Nicalon™ S specimen “Steam 1” examining fiber
surfaces in middle portion of fiber tow (σcr = 3.5 MPa, > 100 h).
Figure 57. SEM micrograph of the Hi-Nicalon™ S specimen “Steam 1” examining
middle cross section of a fiber. Note defined silica scale growth. (σcr = 3.5 MPa, > 100 h).

62
Figure 58. SEM micrograph of the Hi-Nicalon™ S specimen “Steam 1” examining
middle surface of a fiber (σcr = 3.5 MPa, > 100 h).
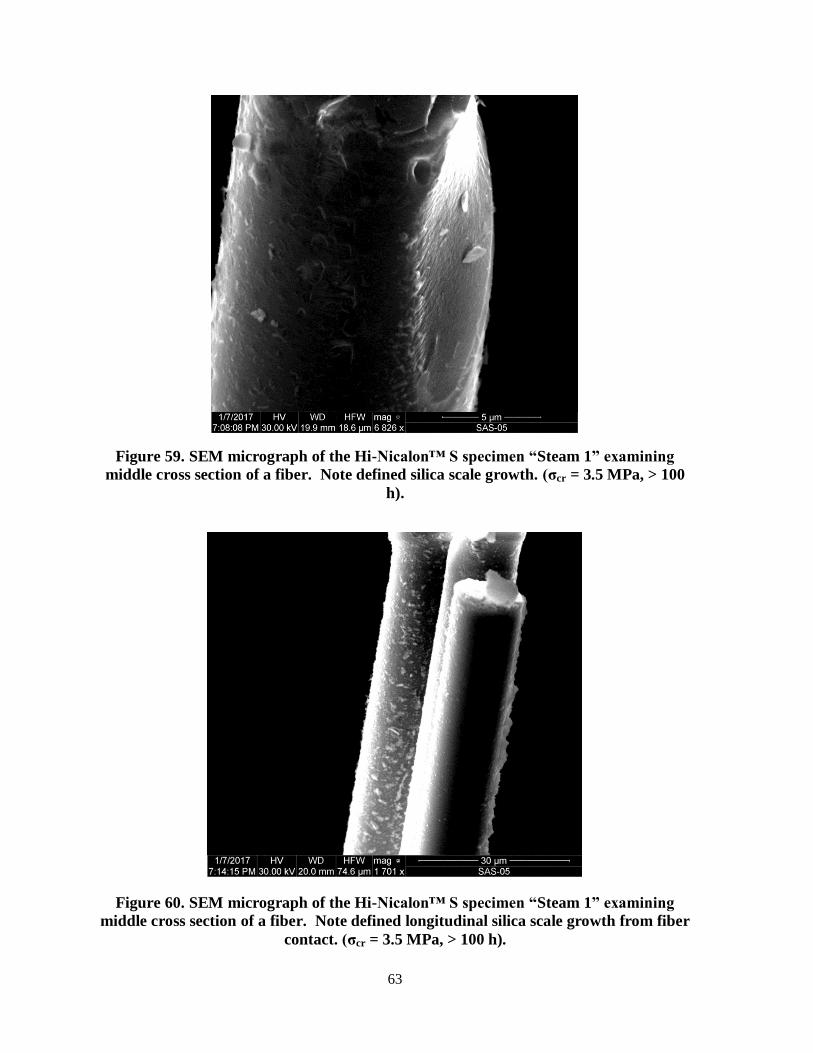
63
Figure 59. SEM micrograph of the Hi-Nicalon™ S specimen “Steam 1” examining
middle cross section of a fiber. Note defined silica scale growth. (σcr = 3.5 MPa, > 100
h).
Figure 60. SEM micrograph of the Hi-Nicalon™ S specimen “Steam 1” examining
middle cross section of a fiber. Note defined longitudinal silica scale growth from fiber
contact. (σcr = 3.5 MPa, > 100 h).

64
Figure 61. SEM micrograph of the Hi-Nicalon™ S specimen “Steam 1” examining
middle cross section of a fiber. (σcr = 3.5 MPa, > 100 h).
Figure 62. SEM micrograph of the Hi-Nicalon™ S specimen “Steam 16” examining
fiber surface on lower portion of a fiber. Note longitudinal silica scale. (σcr = 497 MPa, t
= 63.84 h).

65
Figure 63. SEM micrograph of the Hi-Nicalon™ S specimen “Steam 16” examining
lower fracture surface of a fiber (σcr = 497 MPa, t = 63.84 h).
Figure 64. SEM micrograph of the Hi-Nicalon™ S specimen “Steam 16” examining
fiber surface on upper portion of a fiber. Note longitudinal fiber-fiber contact scale (σcr
= 497 MPa, t = 63.84 h).

66
Figure 65. SEM micrograph of the Hi-Nicalon™ S specimen “Steam 16” examining
upper fracture surface of a fiber (σcr = 497 MPa, t = 63.84 h).
Figure 66. SEM micrograph of the Hi-Nicalon™ S specimen “Steam 13” examining
fiber surface on lower portion of a fiber (σcr = 600 MPa, t = 55.21 h).

67
Figure 67. SEM micrograph of the Hi-Nicalon™ S specimen “Steam 13” examining
lower fracture surface of a fiber (σcr = 600 MPa, t = 55.21 h).
Figure 68. SEM micrograph of the Hi-Nicalon™ S specimen “Steam 13” examining
fiber surface on upper portion of a fiber (σcr = 600 MPa, t = 55.21 h).

68
Figure 69. SEM micrograph of the Hi-Nicalon™ S specimen “Steam 13” examining
upper fracture surface of a fiber (σcr = 600 MPa, t = 55.21 h).
Figure 70. SEM micrograph of the Hi-Nicalon™ S specimen “Steam 11” examining
fiber surface on lower portion of a fiber. Note anomalous longitudinal scale (σcr = 736
MPa, t = 21.5 h).

69
Figure 71. SEM micrograph of the Hi-Nicalon™ S specimen “Steam 11” examining
lower fracture surface of a fiber (σcr = 736 MPa, t = 21.5 h).
Figure 72. SEM micrograph of the Hi-Nicalon™ S specimen “Steam 11” examining
fiber surface on upper portion of a fiber. Note anomalous longitudinal scale (σcr = 736
MPa, t = 21.5 h).

70
Figure 73. SEM micrograph of the Hi-Nicalon™ S specimen “Steam 11” examining
upper fracture surface of a fiber (σcr = 736 MPa, t = 21.5 h).
Figure 74. SEM micrograph of the Hi-Nicalon™ S specimen “Steam 12” examining
lower surface on lower portion of a fiber. (σcr = 654.5 MPa, t = 14.1 h).

71
Figure 75. SEM micrograph of the Hi-Nicalon™ S specimen “Steam 12” examining
lower fracture surface of a fiber (654.5 MPa, t = 14.1 h).
Figure 76. SEM micrograph of the Hi-Nicalon™ S specimen “Steam 12” examining
lower fiber tow (654.5 MPa, t = 14.1 h).

72
Figure 77. SEM micrograph of the Hi-Nicalon™ S specimen “Steam 12” examining
lower fiber tow. Note signs of unsaturated steam exposure (spider webbing/silica
leeching at interface) (654.5 MPa, t = 14.1 h).
Figure 78. SEM micrograph of the Hi-Nicalon™ S specimen “Steam 12” examining
lower fiber tow. Note signs of unsaturated steam exposure (spider webbing/silica
leeching at interface) (654.5 MPa, t = 14.1 h).

73
Figure 79. SEM micrograph of the Hi-Nicalon™ S specimen “Steam 12” examining
lower fiber tow. Note signs of unsaturated steam exposure (spider webbing/silica
leeching at interface) (654.5 MPa, t = 14.1 h).
Figure 80. SEM micrograph of the Hi-Nicalon™ S specimen “Steam 12” examining
lower fiber tow. Note signs of unsaturated steam exposure (spider webbing/silica
leeching at interface) (654.5 MPa, t = 14.1 h).

74
Figure 81. SEM micrograph of the Hi-Nicalon™ S specimen “Steam 12” examining
upper fiber tow. Note signs of saturated steam exposure (dewetting [30]/silica
deposition) (654.5 MPa, t = 14.1 h).
Figure 82. SEM micrograph of the Hi-Nicalon™ S specimen “Steam 12” examining
upper fiber tow. Note signs of saturated steam exposure (dewetting [30]/silica
deposition) (654.5 MPa, t = 14.1 h).

75
Figure 83. SEM micrograph of the Hi-Nicalon™ S specimen “Steam 12” examining
upper fiber tow. Note signs of saturated steam exposure (pronounced silica scale
deposition, also reported by Roberston [19]) (654.5 MPa, t = 14.1 h).

76
Bibliography
[1] T. P. a. B. Bensaude-Vincent, "History of Composites," The Dibner Institute for the History of
Science and Technology, 2001. [Online]. Available:
http://authors.library.caltech.edu/5456/1/hrst.mit.edu/hrs/materials/public/composites/Compo
sites_Overview.htm#1st_generation. [Accessed 8 September 2016].
[2] [email protected], "Structure and Properties of Ceramics/American Ceramic Society," 21 May
2014. [Online]. Available: http://ceramics.org/learn-about-ceramics/structure-and-properties-of-
ceramics. [Accessed 7 September 2016].
[3] F. Raether, "Ceramic Matrix Composites– an Alternative for Challenging Construction Tasks,"
CERAMICAPPLICATIONS, pp. 45-49, 2013.
[4] C. o. A. F. f. H.-T. C. Composites, Ceramic Fibers and Coatings: Advanced Materials for the
Twenty-First Century, National Research Council, 1998.
[5] D. O. DEFENSE, "VOLUME 5. CERAMIC MATRIX COMPOSITES," COMPOSITE MATERIALS
HANDBOOK, pp. 47-67, 2002.
[6] J. Kelly, "Silicon Carbide - Older than the stars," [Online]. Available:
http://img.chem.ucl.ac.uk/www/kelly/history.htm. [Accessed 7 September 2016].
[7] M. Adams, "Silicon Carbide SiC properties," Accuratus, 2013. [Online]. Available:
http://accuratus.com/silicar.html. [Accessed 7 September 2016].
[8] W. R. C. a. M. J. M. J. B. Wachtman, Mechanical Properties of Ceramics: Second Edition, John
Wiley & Sons, 2009.
[9] J.-P. Poirier, Creep of Crystals High-Temperature Deformation Processes in Metals, Ceramics and
Minerals, Cambridge University Press, 1985.
[1
0]
W. R. C. M. J. M. John B. Wachtman, Mechanical Properties of Ceramics, 2nd Edition, Wiley,
2009.
[1
1]
K. B. Sprinkle, CREEP OF SYLRAMIC-iBN FIBER TOWS AT ELEVATED TEMPERATURE IN AIR AND IN
SILICIC ACID-SATURATED STEAM, WPAFB: Air Force Institute of Technology (AU), 2015.
[1
2]
J. Bennett and J. Smith, "Fundamentals of Refractory Technology," Ceramic Transactions, vol.
125, 2001.
[1 C. J. Armani, "Creep Performance of Oxide Ceramic Fiber Materials at Elevated Temperature in

77
3] Air and in Steam," PhD Dissertation. Air Force Institute of Technology (AU), Wright-Patterson Air
Force Base, March 2011.
[1
4]
L. Nipon Carbon Co, "Hi Nicalon Type S only," Nippon Carbon Co, Ltd, [Online]. Available:
http://www.carbon.co.jp/english/products/silicon_carbide/. [Accessed 20 November 2016].
[1
5]
A. S. Systems, "Hi Nicalon Type S only," ATK Space Systems Inc, [Online]. Available:
http://www.coiceramics.com/pdfs/hi-nicalon-types_1-17-06.pdf. [Accessed 20 November 2016].
[1
6]
H. Y. J. DiCarlo, "Thermomechanical Characterization of SiC Fiber Tows and Implications for
CMC," Materials Division, NASA Lewis Research Center, Cleveland, OH.
[1
7]
L. NGS Advanced Fibers Co., "Product NGS Advanced Fibers," NGS Advanced Fibers Co., Ltd,
2013. [Online]. Available: http://www.ngs-advanced-fibers.com/eng/item/. [Accessed 02 Feb
2016].
[1
8]
B. R. Stephens, Creep of Hi Nicalon S Ceramic Fiber Tows at Elevated Temperature in Air and
Steam, Wright Patterson AFB, OH: Air Force Institute of Technology, 2012.
[1
9]
S. J. Robertson, "Creep of Hi-Nicalon S Ceramic Fiber Tows at Intermediate Temperatures in Air
and in Steam," PhD Dissertation. Air Force Institute of Technology (AU), Wright-Patterson Air
Force Base, (projected for publication in September 2015).
[2
0]
M. W. Piper, Creep of Hi Nicalon S Ceramic Fiber Tows at 700C in Air and In Silicic Acid-Saturated
Steam, Wright Patterson AFB, OH: Air Force Institute of Technology, 2016.
[2
1]
B. R. Steffens, "Creep of Hi-Nicalon S Ceramic Fiber Tows at Elevated Temperature in Air and in
Steam," MS Thesis. Air Force Institute of Technology (AU), Wright-Patterson Air Force Base,
March 2012.
[2
2]
T. R. Shillig, "Creep of Hi-Nicalon S Fiber Tows at Elevated Temperature in Air and in Steam," MS
Thesis. Air Force Institute of Technology (AU), Wright-Patterson Air Force Base, March 2013.
[2
3]
M. H. I. (MHI), "HGA-S-01," MHI, [Online]. Available: http://mhi-inc.com/store/steam-
generators/steam-generators-devices/hga-s-devices/hga-s-01-superheated-steam-generator.
[Accessed 16 01 2016].
[2
4]
R. M. Morrell, "A Tenile Creep-Testing Apparatus for Ceramic Materials Using Simple Knife-Edge
Universal Joints," Journal of Physics E: Scientific Instruments, vol. 5, no. 5, pp. 465-467, 1972.
[2
5]
F. A. Kandil and B. F. Dyson, "Tensile Creep of Ceramics: The Development of a Testing Facility,"
International Journal of High Technology Ceramics, vol. 4, no. 2-4, pp. 243-262, 1988.

78
[2
6]
J. A. DiCarlo, "Property Goals and Test Methods for High Temperature Ceramic Fiber
Reinforcement," Ceramics International, vol. 23, no. 4, pp. 283-289, 1997.
[2
7]
J. L. Cédric Sauder, "Tensile Creep Behavior of SiC-Based Fibers With a Low Oxygen Content,"
Journal of the American Ceramic Society, vol. 90, no. 4, p. 10, 2007.
[2
8]
V. Hammond, "Creep Rupture of an Oxide/Oxide Composite Fiber," University of Virginia, 2001.
[2
9]
G. J. a. D. J. Yun H.M., "Tensile Creep and Stress-Rupture Behavior of Polymer Derived SiC
Fibers," 1994.
[3
0]
Y. Almadori, "From Solid-State Dewetting of Ultrathin, Compressively Strained Silicon–
Germanium-on-Insulator Films to Mastering the Stoichiometry of Si1–xGex Nanocrystals," The
Journal of Physical Chemistry, vol. 120, no. 13, p. 8, 2016.
[3
1]
M. A. M. Krishan Kumar Chawla, Mechanical Behavior of Materials, Prentice Hall, 1998.
[3
2]
C. J. Armani, Creep Performance of Oxide Ceramic Fiber Materials at Elevated Temperature in Air
and in Steam, WPAFB: Air Force Inistitute of Technology (AU), 2011.
[3
3]
N. Jacobson, F. D.S., R. R.C., S. J.L. and O. E.J., "SiC Recession Caused by SiO2 Scale Volatility
under Combustion Conditions: II, Thermodynamics and Gaseous-Diffusion Model," Journal of the
American Ceramic Society, vol. 82, no. 7, p. 8, 1999.