Embed Size (px)
Citation preview

CRESC Working Paper Series
Working Paper No.75
John Buchanan, Julie Froud, Sukhdev Johal,
Adam Leaver and Karel Williams
December 2009
For further information:
Centre for Research on Socio-Cultural Change (CRESC)
Faculty of Social Sciences
The Open University
Walton Hall
Milton Keynes
MK7 6AA
UK
Tel: +44 (0)1908 654458 Fax: +44 (0)1908 654488
Email: [email protected] or [email protected]
Web: www.cresc.ac.uk

CRESC Working papers
- 2 -
UNDISCLOSED AND UNSUSTAINABLE:
PROBLEMS OF THE UK NATIONAL BUSINESS MODEL1
John Buchanan1, Julie Froud2, Sukhdev Johal3,
Adam Leaver2 and Karel Williams4
1 Workplace Research Centre, University of Sydney
2 Manchester Business School
3 School of Management, Royal Holloway, University of London
4 Centre for Research in Socio-Cultural Change (CRESC), University of Manchester
Corresponding author:
Karel Williams
CRESC
University of Manchester
178 Waterloo Place
Oxford Road
Manchester M13 9PL
Email: [email protected]
ABSTRACT
This paper presents new arguments and evidence about public and private employment
creation in the UK. Our measures of public sector employment count state employees
and estimate para-state employees whose private employment is state supported. On
this basis, state and para-state since 1998 account for more than half the job creation
nationally and for much more in the ex-industrial regions. Our argument is that the UK
has an undisclosed business model of using publicly supported employment to cover
the continuing failure of the private sector to generate and distribute welfare through
job creation.
KEY WORDS: business model, employment, finance, state and para-state
1This paper is dedicated to L. J. Williams (1927-2004), historian and economist, who used political
arithmetic to study the relations between democracy, employment and welfare.

Undisclosed and unsustainable: problems of the UK national business model
- 3 -
INTRODUCTION
This paper argues that the United Kingdom has an undisclosed business model of using
publicly supported employment to cover the continuing failure of the private sector to
generate welfare through job creation in the 1990s and 2000s. The business model
was never deliberately hidden but equally never articulated or explicit as New Labour
and our political classes presided over a distribution of welfare through job creation in
ways which were not the subject of public discussion and criticism. This opacity was
partly caused by the increasingly uninformative and irrelevant nature of the official
statistics on employment in an economy of outsourcing. Official statistics precisely
count the number of public employees in the state sector but official statistics do not
adequately count the growing number of private employees in the para-state sector.
The para-state includes activities like rubbish collecting or nursery education which are
revenue dependent on government funding and activities like private health care that
is dependent in many ways on government support. On our estimates in this paper,
the para-state sector in the UK now employs a number equal to one-third of the total
number of public sector employees. The UK business model of expanding state and
para-state employment was never sustainable in the longer term because government
expenditure and subsidy are limited. And these emerging problems have been
crystallised and focused by the financial crisis which removes the pre-2007 stimulus of
public reflation and private asset bubble. Going forward, the UK cannot sustain a
reasonable diffusion of prosperity into disadvantaged regions and social groups; while
the upcoming public expenditure cuts will aggravate the UK’s national problems.
Our argument is deliberately framed using elastic cultural images like business model
and unsustainability rather than scientistic political economy concepts like regimes of
accumulation. The idea of a national business model may initially seem paradoxical
but, as we have argued elsewhere, business model is an extendible term. At the
enterprise level, for example, it can cover meeting diverse stakeholder expectations in
non-profit organisations like the BBC (Leaver et al., 2009) as well as how to generate
shareholder value in the corporatised private sector. In this article we extend the
business model term to the national economy. Because jobs are the primary way of
distributing welfare, the national business model issue is whether and how the
economy can generate the quantity and quality of employment necessary to distribute
welfare and diffuse prosperity across regions and social groups. Sustainability and
unsustainability are even fuzzier metaphors whose meaning changes with time and
place and these shifts need to be brought into our analysis. So this article also
CRESC Working papers
- 4 -
examines how various authors from the 1970s to the present have socially constructed
the sustainability of the British national economy through dystopian or utopian visions
of national decline and renewal. These visions shift from the problems of
deindustrialisation in the 1970s to the achievements of the financial services sector or
the creative industries in the 2000s.
The article deploys a narrative and numbers approach which combines analysis of
narrative visions with some old fashioned political arithmetic about jobs and
employment. As in our earlier work on giant firm strategy (Froud et al., 2006), this
article works by counterposing jointly authored social stories and our own
independent analysis of the numbers. The first section of this article focuses on
utopian and dystopian visions which construct economic narratives of national renewal
or decline, partly by citing numbers that suit a prior concept of national strengths and
weaknesses. Then in the next two sections of the article, we shift to a more open,
numbers based political arithmetic about the sources of jobs and income since the
early 1990s which define the national business model. Section two challenges the
pretensions of finance by showing that this sector has created few jobs since the late
1990s, but does reinforce inequalities by strengthening the South versus the North and
the working rich against the rest. Section three presents new estimates of expanding
employment within the state sector of public employees and the para-state sector of
private employees dependent on public support. In a fourth, concluding section, we
bring narrative and numbers together to draw out the implications of limited job
creation in an anaemic private sector and to raise some issues about the appropriate
form and nature of regional and national policy.
1. UTOPIAN AND DYSTOPIAN VISIONS: NATIONAL AND GLOBAL
Advanced capitalist economies work partly by constructing narratives about how they
are and where they are going. Social scientists sometimes represent their versions of
these stories as models or ideal types with labels like Anglo-Saxon Capitalism or Post-
Fordism. But it is probably more sensible to focus more broadly on the economic
visions which are consumed individually by the broadsheet reader after being
produced collectively by the political classes, business and media as well as academics.
Hence this section presents an analysis of successive dystopian and utopian visions of
the problems and achievements of the UK economy in an international context from
the early 1970s onwards.

Undisclosed and unsustainable: problems of the UK national business model
- 5 -
‘How we are’ visions typically work by removing the uneven, partial, unresolved and
contradictory elements of the case while the ‘where we are going’ vision of the future
works by extrapolating into an inherently uncertain future. Both kinds of vision are not
so much varieties or stages of capitalism as heroic projections of benign or alarming
current trends or developments at the enterprise, sectoral or national level. When
narrative is in the ascendant, numbers and empirical cases are typically used
rhetorically to illustrate a pre-existing point as when one sector like manufacturing or
finance is presented as the ‘leading’ force for national renewal or decline. The utopian
or dystopian vision accentuates the positive or the negative to construct a scenario of
achievement and opportunity, or problems and threat. Put another way, utopias and
dystopias are the grounded, collective hopes and fears of the present about a future
that does (or does not) work.
There is neither simple cyclical alternation between utopia and dystopia nor any
mechanical, one on one correspondence between achieved economic performance
and optimism or pessimism. But, it is unusual for any vision of utopia or dystopia to
last more than 15 years because capitalism works unpredictably through long
upswings which sedate scepticism and through long downswings or shorter recessions
which validate introspection. The history of British national visions since the 1970s is
one of slow alternation: 1970s and 1980s dystopias about “too few producers” faded
into euphoria about City success and knowledge industries in the 15 glorious years
after the early 1990s; although dystopia was creeping back even before the onset of
financial crisis in 2007. These national visions are nested in the broader changing vision
of the global economy which has moved in parallel. We have macro economic dystopia
about limits to growth in the 1970s followed by a more utopian vision of benign
globalisation in the 1990s which was increasingly challenged in the 2000s when climate
change and global warming became more urgent.
The global visions are interesting because, whereas British visions of the national
future have been predominantly about whether and how production can be increased,
the global dystopias have always been about how expanded consumption (and
production) is unsustainable. There are sharp unresolved differences here about the
possibility and desirability of increasing consumption of material goods and
commercialised services as visions of global dystopias generally rework Malthusian
pessimism about constraints on expansion. The economists’ Meadows et al. frame the
1970s global vision, (1972) book Limits to Growth which dramatised the limits by
modelling exponential increases in consumption against known resources and

CRESC Working papers
- 6 -
generated fears which were then apparently confirmed by oil crises. These dark macro
fears returned in the 2000s with a much broader base in natural science evidence
about global warming. Most notably the economist Stern’s Review (2006) predicted
climate change would (like wars and depression in the twentieth century) create
“major disruption”. The future is always uncertain because of the unpredictability of
capitalism and the limits of modelling but Stern clearly represents the best evidenced
of all dystopias.
In between, there was euphoria as some enthusiasts presented benign globalisation as
the latter day 1990s equivalent of free trade in the 1840s. On this scenario, low wage
industrialisation diffused prosperity in Asia and exported cheap manufactures and
surplus funds to Western economies who could find a different role in a new
international division of labour whose viability was apparently confirmed by the US
capacity to create jobs and a financial sector which managed global flows. As with the
dystopias before and afterwards, the success of the utopian vision of globalisation was
not that it compelled agreement but that it forced critics to debate on the terrain of
globalization. Thus, Reich (1991) added empirical qualifications about the quality of
some of the jobs in the USA while Stiglitz (2002) added political criticism of the global
neo-liberal agenda.
Against this changing backdrop, there was then a changing vision of the UK’s
distinctive national problems. In the dystopian 1970s and 1980s the vision of the (right
and left) economists was of “too few producers” as national debate operated with a
productionist definition of sustainability. From this point of view, the question was:
would manufacturing generate a suitable quantum of work and exports (because
nothing else would). From the centre-right in their 1977 book, the Oxford economists
Bacon and Eltis diagnosed a problem of “crowding out” as the expansion of the UK
public sector diminished employment and investment in marketable goods and
services. From the centre-left, Singh’s famous 1977 Cambridge paper on
“deindustrialisation” opened onto a vision of job loss and payments constraint after
private sector manufacturing decline; a vision that was apparently confirmed in the
Thatcher recession of the early 1980s which saw the permanent loss of more than 20%
of British manufacturing jobs in just over 18 months.
The next phase of UK debate was one of confused transition from pessimism to
optimism, complicated by several developments, including the second Thatcher
recession after 1989 and the explicit recommendation of imported systems of

Undisclosed and unsustainable: problems of the UK national business model
- 7 -
industrial production. The pain of living was partly assuaged by the drug of dreams and
promises of revival and prosperity. As the unpleasant consequences of manufacturing
job loss became clearer, so visionary dreams of a revitalised future for manufacturing
beyond “mass production” became more important in Britain and in all the long
industrialised countries. Hence, the Piore and Sabel (1984) book, which announced
flexible specialisation and promoted Italian style industrial districts, was curiously
subtitled “possibilities of prosperity”. The Womack, Jones and Roos (1990) book
announced Lean Production and promoted Japan, before explaining how all Western
firms could prosper by using some variant on the Toyota Production System which
incidentally generated good work. The various accounts of Post-Fordism subsequently
generalised about emerging new realities largely by constructing a future which
inverted the supposed characteristics of old style mass production in a new epoch
where flexibilised production would meet differentiated demand.
But after five years or more of upswing by the later 1990s, things were being
constructed quite differently because UK national prosperity was now being discussed
as achievement not promise. Every prediction of the Left prophets of doom in the
1970s and 1980s had now come to pass and the outcome was a triumph in the 1990s.
The deindustrialised future had arrived when the UK was running a substantial and
growing trade deficit, while manufacturing employment declined at a faster rate in the
later 1990s. And yet centre-right academics were triumphalist. Britain was now
outperforming its continental European rivals by generating more growth and less
unemployment; and this outperformance was confidently attributed to the
invigorating Thatcherite policies of defeating organised labour, deregulating the labour
market, privatising utilities and council housing and extending the sphere of markets
and finance. When Eltis, after retirement, published Britain, Europe and the EMU
(2000) he celebrated rising living standards, more inward investment and other
indicators of the “transformation” in Britain which was consequently outperforming its
European neighbours.
Manifest success and confident attribution encouraged New Labour to accept this
scenario about Thatcherism as pain for gain. Meanwhile business leaders and
government boosters in the later 1990s converged on a new vision. An onwards and
upwards national trajectory would be sustained by the continued expansion of post-
industrial leading sectors like financial services and creative industries, which were
both ‘bigged up’ by selectively citing totals and removing points of reference. The
financial services sector promoted itself at every opportunity because finance after

CRESC Working papers
- 8 -
deregulation needed a favourable regulatory environment which was justified partly
by elaborating a story of its achievement. Thus, the City of London Corporation
website presented finance as a shining example of sectoral success which made a
major national contribution in jobs, payments and taxes. The creative industries were
more disparate and heterogeneous so that they had to be discovered through addition
by New Labour politicians during the ‘Cool Britannia’ phase. Nearly a decade later,
NESTA (2006) was able to add together advertising, TV, video games, music and design
to find that these activities together accounted for 5% of UK employment and 4% of
exports.
As always with visions, the point was not that everybody agreed and, for example, the
claims about creative industries were strongly challenged (e.g. Atkinson and Elliott,
2007). But ideas about finance as a socially valuable leading sector undoubtedly helped
to rationalise popular “feel good" and encouraged policy makers in the belief that it
was important to maintain the competitiveness of London as a financial centre through
light touch regulation. The importance of this alibi was demonstrated by the way in
which the City returned to its established story about the social value of finance after
the 2007 crisis, when the Wigley (2008) and Bischoff reports (2009) counted the
benefits of finance in the hope that this might now deflect “over regulation”.
These visions are not futurology which generates reliable, useful predictions because
they often tell us more about the present than the future and are usually discredited
by events within a decade. But visions should not be discounted as ephemeral
confusions because they can usefully focus attention on what might be called supply
side design flaws originating in capitalist modes of calculation. The 1980s debates
about deindustrialisation usefully highlighted how firms and national sectors could
manage their way to decline and retreat by making conservative financial calculations
about investment in product and process (see Hayes and Abernathy (1980), Williams et
al. (1983). More recently, the shift to shareholder value forms of calculation after the
1990s has required firms to cut back on social overhead costs including socially
necessary provision for skill formation (see Watson et al., 2003).
Furthermore, some visions do need to be taken more seriously than others. The scale
and gravity of the consequences of climate change gives this global dystopia a force
and importance for action which none of its predecessors ever had. The Stern
calculation about investing 1% of GDP on green measures to prevent a 20% reduction
in global GDP is no doubt illustrative and rhetorical because it depends on low discount

Undisclosed and unsustainable: problems of the UK national business model
- 9 -
rates as part of a cost-benefit analysis which works by cumulating imprecise estimates.
But the climate change dystopia is different because there is a fundamental
asymmetry here between the global social benefits of being right and the inescapable
and overwhelming costs of being wrong. Costly intervention against global warming
needs to be set in this context. If Stern and others are right, we are collectively
wrecking the planet by global warming with massive consequences which can be
prevented or ameliorated; if Stern and others are wrong, then we will have made
some green investments which in the event prove unnecessary. The question arising
from this vision is not whether but how to intervene against climate change.
2. THE CONTRIBUTION OF FINANCE: SOME POLITICAL ARITHMETIC
At this point, the form of argument changes as we turn to political arithmetic
represented in the earlier visionary debates by Bacon and Eltis and by Singh who all
favoured a tabular, descriptive form of knowledge. That was displaced as mainstream
economics went algebraic after the early 1980s and the old style applied economists
were discursively cleansed from British university economics departments whose new
paradigm was mathematical techniques plus formalised theory. Political economy was
reinvented elsewhere in discourses like international political economy and human
geography; which were however different from old-style applied economics because
they added new preoccupations like Bretton Woods or new inflections like the cultural
turn. In all this, the radical force of old style six tables and a commentary description
has been overlooked and one of our aims is to demonstrate the neglected potential of
this kind of political arithmetic.
In this section we use political arithmetic to challenge established views about the
contribution of finance by considering numbers employed in the finance sector; and in
the next section we use political arithmetic to develop new problem definitions by
proposing new measures of state and para-state employment inside and outside the
public sector. Before doing so, we can begin by confronting the scepticism of social
constructionists who see numbers as just another rhetoric derived from pre-existing
frames. Many of the visions considered in the last section select illustrative numbers,
factoids and vignettes to dramatise a future that does (or does not) work. But, this
section shows it is possible to use numbers in a different way to acquire new
knowledge. In this case, the exploratory use of numbers has two key preconditions:
first, a very clear concept of the relevant numbers about job creation: second, new
measures of public employment which extend the field of the visible and take the
argument in new directions.

CRESC Working papers
- 10 -
Conceptually, employment data is relevant to our argument because income from
employment is the primary mode of wealth distribution in economically developed,
high income countries despite the introduction of large scale transfer payments and
funded pensions. In the USA, for example, we can calculate the share of income from
employment in total income for different income quintiles. From IRS sources in the
2000s, some 80% or more of all income in the three middle income quintiles comes
from employment (Froud et al., 2010 forthcoming). Only at the extremes of the
income distribution do social security transfer payments or unearned rentier income
(including retirement pensions) become important as sources for whole quintile
groups. From this point of view, the primary welfare question in all the advanced
economies is always how many jobs (and what kind of jobs) the national economy is
creating. This is particularly so in the UK case over the recent period from 1992 to 2007
which was one of sustained, strong output growth. This would ordinarily lead to
employment growth because, moderated by productivity trends and real wage
increases, labour always takes the largest share of output. The relevant empirics are
given in the Office for National Statistics (ONS) ‘Blue Book’ (2009) which shows that UK
real output on the Gross Value Added measure, increased by an average of 4% per
annum; and which also discloses that labour’s share of this output averaged more than
55% over these years, The arithmetically logical result will be new job creation; and the
question of how many jobs and in what sectors is then an open empirical question
which requires analysis of employment trends in different sectors.
It is difficult to answer the question about sectoral trends in an outsourced economy
where allocating employment to different sectors is complicated because demand
from one sector increasingly sustains employment in another. These complications will
be addressed step by step in the discussion of finance and para-finance in this section
and of state and para-state employment in the next section. In our alternative banking
report (CRESC, 2009), we have questioned the UK finance sector’s self-justifying story
about how the expansion of financial services since the 1980s has been a great
national success story. Here, we want to narrow the focus on to the one issue of
employment, and in the next few paragraphs present numbers which demonstrate
that finance was never a leading sector in terms of new job creation (even if we
include para-finance jobs in other sectors sustained by demand from finance). But
finance did play a major role in increasing inequality vertically by its effects on the
national distribution of earned income and horizontally by accentuating increasing
inequality between the major regions.

Undisclosed and unsustainable: problems of the UK national business model
- 11 -
Table 1: Employees in Great Britain split by selected sectors
Employees
Manufacturing Business
services
excluding
banking and
finance
Banking and
financial services
All sectors
No. No. No. No.
1991 4,162,160 2,354,984 1,018,354 21,575,943
1992 3,990,125 2,417,971 985,783 21,340,633
1993 3,818,090 2,480,958 953,212 21,105,322
1994 3,902,763 2,690,669 965,007 21,485,547
1995 3,987,436 2,900,379 976,801 21,865,771
1996 4,052,608 2,968,115 962,796 22,258,468
1997 4,059,561 3,204,866 978,422 22,849,283
1998 4,039,508 3,486,491 1,031,595 24,355,038
1999 3,917,413 3,643,194 1,075,602 24,827,367
2000 3,782,139 3,883,247 1,062,602 25,214,661
2001 3,596,616 3,909,842 1,105,103 25,490,324
2002 3,413,814 3,912,449 1,100,848 25,593,757
2003 3,229,533 3,982,007 1,072,463 25,710,687
2004 3,078,424 4,165,090 1,053,758 26,067,535
2005 2,948,205 4,440,183 1,042,877 26,496,650
2006 2,868,488 4,541,700 1,045,879 26,351,583
2007 2,820,867 4,704,406 1,054,084 26,599,204
Change
1991-
2007
-1,341,293 2,349,422 35,730 5,023,261
Notes: The data excludes Northern Ireland and the self-employed. There is a break in
the series in 1998 and 2005. The authors estimated data used for 1992 and 1994.
Source: Nomis, Office for National Statistics, London.
We can begin by considering the published official data on job creation and private
sector employment growth. From 1991-2007, the total number of employees (private
and public, excluding self-employed) increased by 5 million from 21.6 to 26.6 million in
the UK and, on official measures, the private sector accounted for 68% of that growth
(NOMIS)
CRESC Working papers
- 12 -
Table 1 shows that in line with established trends in the private sector, manufacturing
employment continued to decline and service sector employment grew. Over
seventeen years, the statistics show that British manufacturing employment declined
by nearly 1.3 million to 2.8 million in 2007; and private business services employment
increased about 2.4 million to 5.8 million. After dividing private service employment
into different categories and isolating finance employment, the official statistics show
that all the growth in employment is in general “business services” where employment
more or less doubled to 4.7 million. The trend in numbers employed in “banking and
financial services” was flat because the total of just over 1 million was more or less
exactly the same in 2007 as in 1991. Official statistics show that the employment base
in the finance sector is very limited and, quite remarkably, numbers employed in the
finance sector did not increase in the huge finance-led boom of the 2000s.
The next question is to what extent these figures can be taken at face value. The
answer depends on two considerations. First, on an understanding of the official
classificatory procedures and criteria used to allocate jobs to finance and other
sectors; and, second, on some estimation of the extent of para-financial employment
i.e. the indirect out of sector employment sustained by demand from finance which is
officially counted in other sectors like general business services.
The official categories are designed so that the finance sector totals include most of
the jobs sustained by demand from finance. For example, using the Standard Industrial
Classification (SIC03) criterion, employees in call centres which work for financial
services companies will be allocated to financial services because the aim is to allocate
employees by “industry” activity not by the type of job performed; only call centres
which work for companies from several different sectors (such as utilities and financial
services) are allocated to general business services. The demand of the wholesale
sector in the City of London does generate additional para-finance jobs in law,
accountancy and consultancy. Activities like private equity are heavy users of such
support services, whose jobs are mainly counted in the general business services
category, and the finance-led boom before 2007 undoubtedly did increase such para-
finance employment. But these complications need not detain us for long because, if
the direct employment base in the finance sector is relatively small, the indirect
employment base in para-finance cannot be large. This follows from what we know
empirically about the pattern of backward linkages from manufacturing and services
and what we can then reason about the logic of varying the numerator on a small
denominator.
Undisclosed and unsustainable: problems of the UK national business model
- 13 -
The Keynesian studies of employment multiplier effects engage with a rather different
object than industrial activity and sectoral boundaries. But such studies all show much
stronger backwards supply linkages from manufacturing jobs than from service jobs
which are generally less technically dependent on supplier inputs. In the US economy
according to Bivens (2003) each US manufacturing job supports 1.66 supplier jobs and
the comparable figures are 0.82 for a personal/business service job and 0.50 for a
health services job. If the industry sector is broadly defined, many of these backwards
linkage jobs would be, in official statistical terms, counted inside the relevant sector as
with car component jobs supporting jobs in final assembly in the car industry. So the
multiplicands which should be applied to estimate out of sector para-employment
should be substantially smaller. For this reason, our central estimate is that each job
inside the finance sector creates 0.50 of a para-finance job outside sector. At this point
the small size of finance sector employment becomes relevant because, if finance
directly employs only one million in sector, it does not matter greatly whether a
multiplicand of 0.30 or 0.50 or 0.80 is used to estimate job creation out of sector. If we
shift from suspiciously low 0.30 to implausibly high 0.80 estimates of the out of sector
multiplicand, the estimated total of para-finance jobs only varies by 500,000 on a UK
employee workforce of 26 million. If we take our middling estimate of 0.50, the total
number of finance and para-finance employees is never more than 1.5 million, or not
much more than half the number employed by British manufacturing even in its
current emaciated state. When all the qualifications about para-finance have been
considered, finance remains a relatively small source of employment, which has
created almost no new jobs over the past fifteen years and (by implication) other
forces are driving the general growth of “business services”.
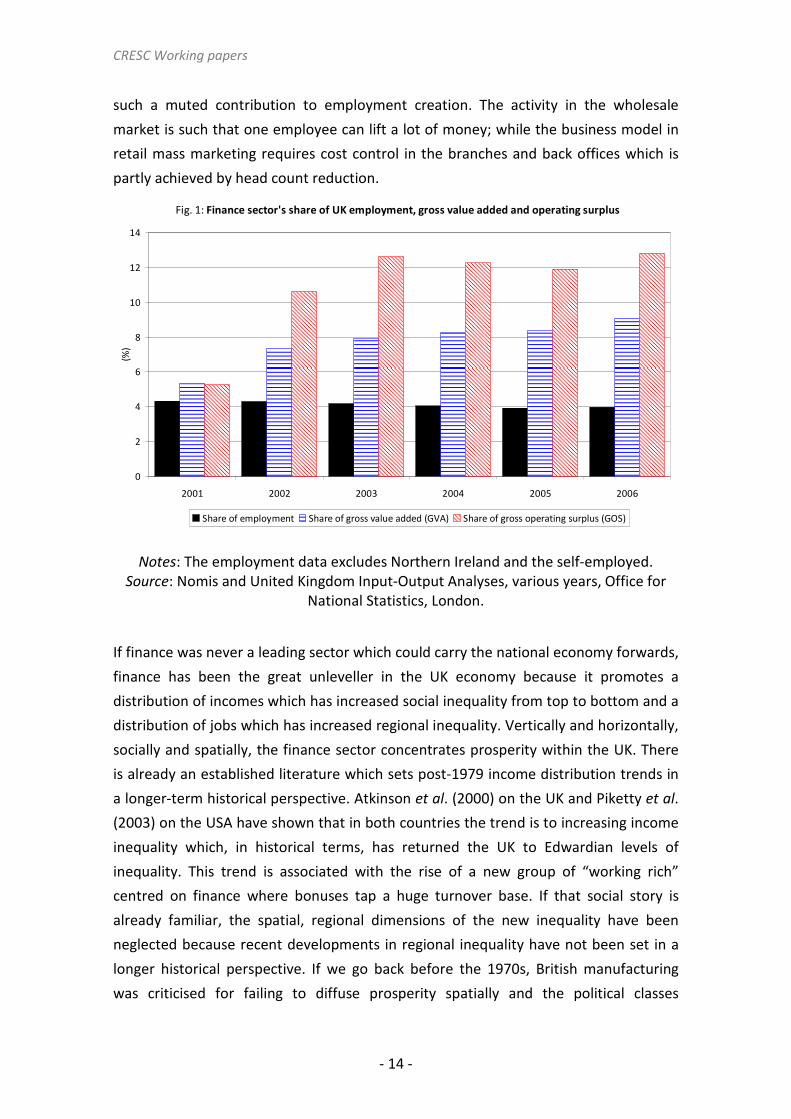
If we take a broader statistical view of the characteristics of the finance sector, it is
notable that finance has always made a much stronger contribution to output and
profits than to employment growth. As figure 1 shows, any generalisation is
complicated by the way in which the share of the finance sector in output and profits
varies cyclically. From a trough low of just 5.3% in 2001, the finance sector’s share of
UK output (GVA) increased to 9.1%; while the sector’s share of profits (GOS) had
increased to 12.8% just before the bubble burst. By way of contrast the finance
sector’s share of British employment is always smaller, generally stable and modestly
declining. The finance sector, in 1992 directly employed 4.7% of the British workforce
and by 2007 employed no more than 4.0% of a substantially larger workforce. Activity
characteristics and business model considerations help to explain why finance makes
CRESC Working papers
- 14 -
such a muted contribution to employment creation. The activity in the wholesale
market is such that one employee can lift a lot of money; while the business model in
retail mass marketing requires cost control in the branches and back offices which is
partly achieved by head count reduction.
Fig. 1: Finance sector's share of UK employment, gross value added and operating surplus
0
2
4
6
8
10
12
14
2001 2002 2003 2004 2005 2006
(%)
Share of employment Share of gross value added (GVA) Share of gross operating surplus (GOS)
Notes: The employment data excludes Northern Ireland and the self-employed.
Source: Nomis and United Kingdom Input-Output Analyses, various years, Office for
National Statistics, London.
If finance was never a leading sector which could carry the national economy forwards,
finance has been the great unleveller in the UK economy because it promotes a
distribution of incomes which has increased social inequality from top to bottom and a
distribution of jobs which has increased regional inequality. Vertically and horizontally,
socially and spatially, the finance sector concentrates prosperity within the UK. There
is already an established literature which sets post-1979 income distribution trends in
a longer-term historical perspective. Atkinson et al. (2000) on the UK and Piketty et al.
(2003) on the USA have shown that in both countries the trend is to increasing income
inequality which, in historical terms, has returned the UK to Edwardian levels of
inequality. This trend is associated with the rise of a new group of “working rich”
centred on finance where bonuses tap a huge turnover base. If that social story is
already familiar, the spatial, regional dimensions of the new inequality have been
neglected because recent developments in regional inequality have not been set in a
longer historical perspective. If we go back before the 1970s, British manufacturing
was criticised for failing to diffuse prosperity spatially and the political classes

Undisclosed and unsustainable: problems of the UK national business model
- 15 -
addressed that problem by symbolically sending car assemblers to the North West and
Scotland. By the 2000s, finance is actively concentrating prosperity spatially in a way
which undermines most kinds of regional policy and the problem is barely registered in
political discourse.
Table 2: Financial services employment split by government office regions
Employees Share of total finance
employment
1998 2007 1998 2007
No. No. % %
North East 20,915 28,388 2.0 2.7
North West 92,358 103,648 9.0 9.8
Yorks and Humber 76,524 88,286 7.4 8.4
East Midlands 40,952 43,776 4.0 4.2
West Midlands 71,351 66,869 6.9 6.3
East 86,080 72,006 8.3 6.8
London 313,620 325,813 30.4 30.9
South East 141,795 124,423 13.7 11.8
South West 79,918 78,358 7.7 7.4
Scotland 82,895 91,560 8.0 8.7
Wales 25,187 30,957 2.4 2.9
Total 1,031,595 1,054,084 100.0 100.0
London and
South East 455,415 450,236 44.1 42.7
Notes: The data excludes Northern Ireland and the self-employed. The finance
category summates employees in the banking, intermediation, leasing insurance and
pension sectors. The 2007 totals reflect a change in the data collection timing from
December to September.
Source: Nomis, Office for National Statistics, London.
Horizontally the old regional problem of the 1960s was reinscribed more deeply in the
new tertiary economy because north and south were on different trajectories of
income growth, with more divergence of trajectory under New Labour after 1997 than
under previous Tory governments. Under New Labour, from 1997-2007, using Gross
Value Added (GVA) output measures, London and South East have annual real output
growth rates of 6.4% and 4.7% respectively as against output growth of 3.5% in the
North East and 3.1% in West Midlands (ONS, 2009). These growth trajectories are
explained by broad patterns of regional specialisation which combine centralisation of
most high income and growth activities in and around London and laggard growth of

CRESC Working papers
- 16 -
the old industrial areas of the North and the Midlands. One aspect of this
centralisation is the massive concentration of finance employment in London and the
South East. As table 2 demonstrates, in both 1998 and 2007, London alone accounts
for just over 30% of British employment in finance; while London and the South East
region together consistently account for 43-44% or the better part of half of all British
employment in financial services. By almost any measure, thanks to the City of London,
finance is much more centralised than the economy as a whole. London has a growing
weight in the national economy but in 2007 accounted for 16% of employment, while
on the GVA measure, London accounted for only 18% of UK gross value added. It
should be noted that regional GVA is based on an income measure and allocated on a
residence basis which leads to understatement because the income of commuters is
allocated to the surrounding region. Even so, the message is that finance feeds
inequality.
3. STATE AND PARA-STATE: THE UNDISCLOSED BUSINESS MODEL
This section develops our argument that the UK’s undisclosed business model of the
1990s and 200s was the expansion of state and para-state employment to cover an
anaemic and financialized private sector whose apparent success in creating general
“business service” jobs is as much about the expansion of para-state employment as
about the revitalisation of autonomous private enterprise. This argument can only be
sustained after analysis and measurement of the numbers officially recorded as
publicly employed workers in the state sector and the undisclosed number of private
employees in publicly supported jobs in the para-state sector.
This is an important issue for two reasons; first, large and increasing numbers are
recorded as publicly employed in a state sector which on the official count grew to
employ 5.8 million or 22% of the total workforce of 26 million in 2007 (Quarterly Public
Sector Employee Survey); second, on our calculations below, there are an additional
1.7 million employed in 2007 as private employees in the para-state sector which is
dependent on public support. If these estimates are credible, in terms of sectoral size,
the para-state alone employs more than finance plus para-finance; and in terms of job
creation, the state plus para-state together directly account for 57% all new jobs
created in the past fifteen years. The expansion of para-state employment is then a
major driver behind what appears in the official statistics as a growth of private
employment in general business services; and, we will argue, also a major influence on
regional policy. The implications for our view of what Thatcher achieved, and New

Undisclosed and unsustainable: problems of the UK national business model
- 17 -
Labour has been doing, are so radical that we must begin by explaining the nature of
the statistical problem and the new estimation methods we have used to impute para-
state employment.
Since 1979 the expanding private sector is increasingly state sponsored and supported
as successive Tory and Labour governments have promoted privatisation, PFI,
subcontracting and outsourcing while in many different ways subventing private
business. Consequently, the boundaries between public and private employment are
blurred and old categories and measures become irrelevant. Official statistics have
traditionally demarcated a state sector of public employees who are defined by the
status of the employer; those, like doctors in general practice who contract with the
NHS, are not included in the count. Such statistics do not measure and register the rise
of a para-state sector of private employees whose jobs in a variety of ways depend on
state sponsorship. Public funding and other support methods maintain old jobs like
rubbish collecting which are contracted out, create new jobs in nursery education
whose expansion is effectively state funded and sustain competing jobs in private
schools and hospitals whose business models are underwritten by the state. In this
case, a focus on the state sector and public employment understates the influence of
the state in sustaining and creating jobs because the para-state is invisible. The trend
of state sector employment totals is no guide to the trend of para-state totals because
the totals could be negatively correlated by transfer if the outsourcing of activities like
cleaning or IT involves many workers.
The Office for National Statistics (ONS), which collects official statistics, does recognise
there is a discrepancy between old statistical categories and new economic structures
when the state has many private clients. ONS also recognises the limits of household
survey data about public employment because, for example, some Labour Force
Survey (LFS) respondents misinterpret the survey which inquires about their employer
not the premises on which they work. In late 2004, the ONS introduced a new
Quarterly Public Sector Employees Survey (QPSES) which focused on employers and
has obtained at least 90% returns from all organisations classified within the public
sector. This new survey broadened the official definition of the public sector to also
include public employees in trading activities that sell their output into the market
economy, public corporations (such as Royal Mail) and quasi-corporations under local
government ownership that receive more than half their income from the market
place (http://www.statistics.gov.uk/downloads/theme_labour/PSEmethodology.PDF).
These private employees are now consolidated into the public sector just as the profits
CRESC Working papers
- 18 -
of majority owned subsidiaries of a major corporation are consolidated in corporate
accounting. While the new ONS survey is valuable and the adjustment is sensible, it is
also relatively crude because, for example, if a diversified business services
conglomerate is 45% dependent on state revenue, none of its employment is allocated
to the public sector. And the Quarterly Public Sector Employment Survey (QPSES)
series only covers the period since third quarter 2004.
Hence our interest in developing a new and different method for estimating the state
sector more broadly defined by adding a measure of para-state employment. Our
procedure was to rework the official SIC 4-digit activity group employment totals in the
ONS’s Annual Business Inquiry (ABI), which has been published every year since 1998.
The ABI includes employment information from more than 75,000 enterprises of all
kinds in the public and private sectors with an 85% response rate because the survey is
compulsory. The ABI survey only covers employees and excludes the self-employed
but, from other statistical sources we know the size of this self-employed group is not
increasing rapidly [3.4 million in 1998 and 3.9 million in 2007 on Labour Force Survey
data from ONS].
From the ABI survey, the ONS calculates employment totals by activity using a 4-digit
classification which at this level, for example, discriminates between employment in
different kinds of primary, secondary and higher education. We then adjusted the ONS
activity employment totals for each 4-digit group to obtain a publicly supported
employment total (state plus para-state) by applying a divisor of between 1.0 and 0.25
to the ONS activity total in both 1998 and 2007. The divisor was varied according to
our views of the weight of public sector expenditure or other support in sustaining
employment in specific activity groups. In hospitals, for example, we identify all the
employment as publicly funded; whereas in dentistry or dispensing chemists we
identify half the employment as publicly funded. Appendix A lists the sectors and the
weightings used on the 2007 ABI data. The virtue of this estimation procedure is that
it provides a simple, intelligible and robust way of estimating publicly funded
employment that discloses an extra 1.7 million publicly funded employees in the para-
state sector.
The adjustment procedure is robust because most of this increase comes from
rounding up and counting all employment as publicly supported in a few activities
which sustain large-scale employment. Various kinds of health care, education, social
Undisclosed and unsustainable: problems of the UK national business model
- 19 -
work and social control activity together account for more than 80% of the total 7.4
million employed in state plus para-state sectors in 2007; and the two activities of
hospitals and primary education together account for 2.5 million employees. In the
cases of health, education and social control, we count all employment in the activity
group as publicly supported. This is justifiable because in these cases, small scale
private provision is embedded in, and could not exist without, a public sector that
provides many kinds of support: 93% of children are educated in state funded schools
and 88% of the UK population has no private health insurance to sustain private
treatment (Guardian Society, 29 October 2009). Independent schools and private
hospitals all have enterprise business models which are dependent on fiscal favours
from the state, do not pay for socially funded training and infrastructure and also
derive some of their revenue from the state. In such cases, the client private sector is
completely state dependent and would have to dramatically downsize its activity and
workforce if state support were withdrawn and the private fee for service was raised.
We would not argue that our estimate of state plus para-state employment is a precise
measure of the extent of state supported employment. Indeed, we believe one precise
measure is impossible because dependence on state funding and other supports
tapers away in a gradient and interacts in a variable way with enterprise business
models in different sectors. Practically, therefore, all decisions about the boundaries of
state employment are conventional choices. But we would prefer, for reasons
explained above, our conventions and our state plus para-state totals since 1998,
rather than the available official series which either give unadjusted totals of public
sector employees or give post-2004 adjusted totals by adding organisations which
draw most of their revenues from the state. These official measures in our view
understate the role of the state by not recognising or underestimating the size of the
para-state sector. The practical question then becomes: what do we see differently
when we change the lens and adopt our ABI based estimates of state and para-state
employment. In reply, we can summarise three key points about what state and para-
state (S&PS) employment contributes nationally, regionally and in terms of gender.
Nationally, state and para-state employment (S&PS) makes a major contribution to job
creation. As table 3 shows, between 1998 and 2007, S&PS employment increased by
nearly 1.3 million from 6.2 to 7.5 million between 1998 and 2007. This accounted for
no less than 57% of the total increase of 2.24 million in the number of employees from
24.4 million to 26.6 million on the ABI measure. The pattern from 1998 to 2007 is one
of sustained increase on a large base with a 21% increase in S&PS employment over

CRESC Working papers
- 20 -
the decade after 1998 so that S&PS together employ near 7.5 million or 28% of the
workforce by 2007. The weight and force of S&PS employment creation, as well as the
huge base, is such that, if the UK has a “leading sector”, it is the state. And this
requires us to revalue what Mrs Thatcher did and whether the 1980s represent a
break. In our view, the employment outcome of the 1990s and 2000s is inline with pre-
1979 trends. The difference is that authors like Bacon and Eltis (1976) could then argue
that the expansion of state employment was “crowding out” but it now looks more like
filling in.
Table 3: A comparison of private and public sector employment in 1998 and 2007
1998 2007
Private
sector
State and
Para-State
sector
Total Private
sector
State and
Para-State
sector
Total
No. No. No. No. No. No.
North East 671,212 274,500 945,712 689,256 340,453 1,029,709
North West 2,059,073 729,479 2,788,552 2,166,422 871,655 3,038,077
Yorks and
Humber 1,517,580 532,167 2,049,747 1,578,401 661,829 2,240,230
East Midlands 1,316,506 435,892 1,752,398 1,388,915 524,330 1,913,245
West Midlands 1,747,825 542,916 2,290,741 1,711,305 647,688 2,358,993
East 1,659,112 528,725 2,187,837 1,737,994 639,562 2,377,556
London 2,945,471 818,628 3,764,099 3,139,941 938,788 4,078,729
South East 2,566,735 858,361 3,425,096 2,737,724 994,049 3,731,773
South West 1,412,208 538,650 1,950,858 1,573,320 663,278 2,236,598
Wales 712,501 325,590 1,038,091 779,107 407,525 1,186,632
Scotland 1,558,134 603,773 2,161,907 1,635,614 772,048 2,407,662
Total 18,166,357 6,188,681 24,355,038 19,137,998 7,461,206 26,599,204
Notes: State and Para-State sector refers to traditional public sector activities plus
activities classified where the State provides a share of the income. The underlying
data reflect SIC classifications at the time of collection and excludes Northern Ireland
and the self-employed.
Source: Nomis, Office for National Statistics, London.
In terms of gender and contribution to the creation of female employment, S&PS
made a much larger contribution. Employment is heavily gendered because rank and
file workers in health and education are disproportionately female. In both 1998 and
2007, just over 69% of the S&Ps workforce is female and this female S&PS workforce
always splits more or less equally into half full-time and half part-time female workers
whereas only 21% of male S&PS workers are part-time. The end result is that the S&PS

Undisclosed and unsustainable: problems of the UK national business model
- 21 -
sector is dominant in the creation of new full-time and part-time jobs for women. As
figure 2 shows over the period 1998-2007, S&PS accounts for an extra 904,000 female
jobs which split 60-40 between full-time and part-time; and these 904,000 new jobs
account for no less than 81% of the total 1.1 million increase in female employment
over these years. If high income capitalist countries are changing because wage
earning households are increasingly dependent on two wage earners, in the UK case,
the S&PS sector more than any other puts the second wage earner into the average
household.
Fig 2: Change in UK female employment between 1998 and 2007
split by private and state and para-state sectors
State and
para-State
903,767
employees
(81%)
Private
sector
211,538
employees
(19%)
Notes: The data excludes Northern Ireland and the self-employed.
Source: Nomis, Office for National Statistics, London.
Along another dimension of inequality, the regional contribution of S&PS is equally
marked, especially if we consider its contribution to the employment bases in the ex-
industrial regions of the North and West. The ex-industrialised regions, especially the
North East and West Midlands, have no other visible means of support except S&PS
because, after losing an old industrial base, they are being partially compensated by
the creation of new S&PS jobs in education and health plus pensions for surplus
workers through the provision of long-term invalidity benefit. Figure 3 presents the
basic data on the two Britains. In London and the South, S&PS accounts for no more
than 38-44% of employment growth between 1998 and 2007; while in the Midlands,
North, Wales and Scotland S&PS accounts for between 55% and 73% of the

CRESC Working papers
- 22 -
employment growth over the same period. In smaller sub regions, S&PS makes an
even larger contribution because in the North East and West Midlands, S&PS accounts
for 79% and 153% of job increase 1998-2007. In these blighted ex-industrial regions
S&PS is the only initiator of job creation. While private employment declined in the
West Midlands, as table 3 shows, elsewhere the pattern is of modest increases in
private sector employment of 5-11% on 1998 totals. But, as figure 3 shows, in all of the
UK outside London and the South, 55-73% of new job creation is in S&PS job creation
so that most of the remaining private sector job creation in outer Britain will be
induced by the expenditure of S&PS workers. By implication, in a decade long boom
after 1998, there was, at best modest autonomous private sector job creation, and at
worst no autonomous private sector job creation outside London and the South,
despite the post-Thatcherite conditions of flexible labour markets and lower rates of
personal and corporate taxation.
Fig. 3: Share of new job creation in the UK between 1998 and 2007 split by private and
state and para-state sectors
38%
73%
64%
44%
55%
68%
62%
27%
36%
56%
45%
32%
0%
10%
20%
30%
40%
50%
60%
70%
80%
London Midlands North South Wales Scotland
State and para-State sector Private sector
Notes: The data excludes Northern Ireland and the self-employed. The Midlands group
contains the government office regions (GOR) of East of England, East Midlands and
West Midlands. The North group contains the GOR of the North East, North West and
Yorkshire and Humber. The South contains the GOR of the South East and South West.
Source: Nomis, Office for National Statistics, London.
These striking figures make the case that the UK had an undisclosed business model of
reliance on S&PS employment. This finding raises the historical question of what was
new about New Labour’s fiscal behaviour and the performative question about the
relation between knowing, saying and doing in New Labour’s economic policy.

Undisclosed and unsustainable: problems of the UK national business model
- 23 -
As figure 4 shows, in the long term over the past four decades, real government
expenditure has increased broadly in line with real GDP; and over shorter periods
expenditure has increased most strongly in recession (1973-76, 1980-84 and 1989-93)
when social security claims increase in a semi automatic way. The pattern under New
Labour from 2000-7 is quite different because real expenditure increases sharply from
£411 billion to £606 billion in a period of prosperity; and the largest increases in
expenditure were discretionary increases in spending on health and education which
together accounted for some £80 billion of the total near £200 billion increase in
public expenditure.
Fig. 4: UK public expenditure and share of GDP
(Money values in 2007 prices)
0
100
200
300
400
500
600
700
19
67
-68
19
69
-70
19
71
-72
19
73
-74
19
75
-76
19
77
-78
19
79
-80
19
81
-82
19
83
-84
19
85
-86
19
87
-88
19
89
-90
19
91
-92
19
93
-94
19
95
-96
19
97
-98
19
99
-00
20
01
-02
20
03
-04
20
05
-06
20
07
-08
20
09
-10
£b
ill.
20
07
pri
ces
0%
10%
20%
30%
40%
50%
60%
% o
f GD
P
Total Managed Expenditure (TME) £bil. Total Managed Expenditure (TME) as a % of GDP
Source: Public Expenditure Statistical Analyses 2009, HM Treasury.
Notes: 2009-10 data reflects HM Treasury estimates. Total Managed Expenditure
(TME) is the consolidated sum of current and capital expenditure of central and local
government, and public corporations.
There is already a debate about the Clift and Tomlinson (2007) claim that New Labour
engaged in “macro economic coarse tuning inspired by Keynesian thinking”. And the
question of how New Labour understood what it was doing can only be properly
answered by historians after the archives are open. But the evidence so far does not
suggest that Brown and Blair were clever enough to do one thing and say another in
the tradition of business leaders like Jack Welch at GE. Their undisclosed business
model was probably the unintended economic consequence of a crude political
calculation. Health and education became social priorities as part of a Labour political
CRESC Working papers
- 24 -
strategy for holding (mainly Southern English) swing voters who had supported
Thatcher. But such expenditure could not be targeted on marginal constituencies and
the unintended economic consequence was job creation across the country which was
especially valuable for women and for the ex-industrial regions of the North, Midlands
and the North West. This worked for a while because of favourable conjunctural
circumstance as Labour accidentally benefited from a kind of super cycle with a long
sustained 15-year upswing in GDP from the early 90s which increased the personal and
corporate tax base.
The Blair Brown business model was less novel than might be supposed from the
rhetoric about New Labour and the Third Way. Right wing Labour leaders like Ramsay
Macdonald and Philip Snowden had always dreamed of using taxation and
redistribution of the fruits of prosperity to build socialism (Skidelsky, 1988). Blair and
Brown simply applied this model to making capitalism work. Nobody (except perhaps
Vince Cable, the Liberal Democrat MP,) focused on unsustainability until the bubble
burst. Afterwards, the political classes (including Cable) panicked about the symptoms
of public and private debt without coming to terms with the fundamental problem of
the private sector’s anaemia in the 2000s which persists despite shock treatment by
the Iron Lady in the 1980s.
4. NEW POLICY DIRECTIONS
How does our numbers and narrative analysis change things? If we put together the
political arithmetic and visions, the results are both alarming and liberating. It is
alarming because the political arithmetic about business model reliance on state and
para-state employment challenges the generally accepted narrative about Mrs
Thatcher’s achievement and Britain’s recent economic transformation. It is liberating
because the dystopian vision about the problem of global warming in a nation with a
feeble private sector licenses new kinds of state sponsorship which would both require
deliver a different kind of finance. At least that could be so if our empirics do not
license more fundamentalism from the Right about rolling back the state which is
irrelevant if we have tried the market which has failed to change our established
national trajectory or to forestall global warming. And, equally, that could be so if our
empirics do not license complacency on the Left which is not so much historically
vindicated as more than ever in need of relevant narrative and policies.
Undisclosed and unsustainable: problems of the UK national business model
- 25 -
On the assumption that the productive economy was enfeebled by organised labour,
state monopolies and high taxes, the Tories in the 1980s pursued aggressive state
policies of crushing the miners, deregulating the labour market, privatising utilities,
lowering income tax and corporation rates. New Labour never doubted the
cause/effect connection between this enterprise agenda and economic transformation
because in government (as in opposition) New Labour was confused by cyclical good
fortune and unsustainable boom which was presented as the “strong economy” and
the end of boom and bust, for which New Labour took some of the policy credit by
giving the Bank of England independence in monetary policy and introducing a new
system of light touch regulation which included the Financial Services Authority (FSA).
More generally, the relation between Tory and New Labour policy levers and economic
outcomes had always been obscured by political sleight of hand about public finance
which papered over the cracks in the neo liberal imaginary. Mrs Thatcher was not a
radical cutter of public expenditure because she paid the dole to cover the economic
management mistakes which brought a high pound and high interest and at the same
time arranged tax cuts for some in higher income groups by presiding over a regressive
shift from income to consumption taxes; after Blair and Brown had abandoned Tory
spending limits they spent the tax revenues of the boom to create a new kind of state
led neo-liberalism and forestall national debate about what would otherwise have
been jobless growth.
This perspective opens up a revisionist view of the recent past which now includes
Blair and Brown’s quiet struggle to keep things going by covering contradiction before
2007 as well as Thatcher’s violent revolution for quixotic objectives after 1979. New
Labour has been propping up a feeble and untransformed private sector whose
problems are now horridly aggravated by bank failure and market crisis which was
caused by the financial sector and has massive repercussions for the public sector. The
outcomes are disappointing and paradoxical. Disappointing because the national
economic miracle was announced prematurely when, unlike the man with palsy in
Mark 2. 1-12, the British economy had not picked up its bed and walked. Paradoxical
because removing obstacles and adding incentives produced not productive enterprise
but financial engineering led by intermediaries like the bankers and private equity
partners whose fees and charges diverted income to them.
The national business model may have been undisclosed but New Labour’s politically
motivated boosting of public social expenditure (which incidentally benefited the
Midlands and the North) was more effective than any known regional policy
CRESC Working papers
- 26 -
alternative. The old 1960s regional policies of redirecting activities to peripheral
regions are structurally irrelevant. Policies of dispersal from the centre (by stick or
carrot) lack credibility. Much of the new activity cannot be dispersed and sent north as
manufacturing was in the 1960s while the City of London capably organises its own
offshore dispersal to low wage Asia. Equally, much of the surplus ex-industrial
population does not have the necessary competences for the new service economy; so
closing down Liverpool is a think tank fantasy not a workable strategy for shifting the
employable. The new 1990s policies of adding infrastructure and training to make
locations more attractive are ineffectual because competitiveness demands
improvements to sustain the City of London’s position in a national economy with a
persistent mismatch between workforce and economic requirements. The government
faces imperative demands for infrastructure investment in London including Crossrail,
Heathrow Terminal 5 and a third runway etc. Northern disadvantage remains because
it is then hard to make a business case for infrastructure improvements like high-speed
rail links. Training and up-skilling is largely dependent on government funding as
employers have abdicated and workers increasingly gain qualifications they cannot
use.
The problem was that New Labour’s regional policy through expansion of national
government spending was unsustainable. Under European Union (EU) rules and
prevailing UK political conditions, the pre-crisis fiscal limits had been reached by 2007
when the government deficit reached 3% of GDP. All that changed after the crisis when
the UK deficit was projected to increase towards 13% after the government went for
extreme intervention to prevent bank failure and market seizure turning into a second
great depression. The government was now willing to countenance much larger
deficits after cutting interest rates towards zero and printing money under quantitative
easing. The effects were uncertain because such stimulus was either inadequate in a
deleveraging economy or inappropriate because it stoked the next asset price bubble.
More fundamentally, extreme intervention to prop up the financial system is not an
employment policy like increasing the precent of GDP spent on health services or
raising the percent of the cohort in further education. On the IMF’s estimates (Horton
et al. (2009), £289 billion has already been spent in the UK on covering problems of
solvency in banks and liquidity in financial markets (without creating a single job). The
near inevitable medium term consequence will be political pressures for public
expenditure cuts to reduce the deficit and incidentally reduce state and para-state
employment without any discrimination about disadvantaged regions.

Undisclosed and unsustainable: problems of the UK national business model
- 27 -
If all this is alarming, it is also liberating. If we put political arithmetic and vision
together, the question is whether public policy on the state’s role and size could now
be deliberately adjusted after an explicit debate about the limited capabilities of the
private sector, the dysfunctional behaviours of major actors and the role that the state
quite properly should play in covering deficiencies in private sector calculation and
performance. We do not want to go back to the pre-1979 practices which have been
caricatured as weak corporatism, nationalisation and picking winners; nor is it a
question of continuing with post-1979 supply side reforms like low taxes and
incentives for enterprise. Instead we can use business model analysis and think in new
ways about the field of public private relations as one where we can break old
connections and establish new ones that produce different outcomes which are
relevant to our national dilemma. The political arithmetic about job creation over the
past decade indicates a UK problem about where do the jobs come from, especially for
women and in the deindustrialised regions. The dystopian vision about climate change
mandates action for a low carbon economy because of the asymmetries between the
costs of getting it wrong and the benefits of getting it right should impel action.
The great national question of our time is whether we can find new ways of
simultaneously solving both problems and create jobs by investing in green production
and maintenance technologies and comprehensive renewal of the built infrastructure
to reduce our carbon footprint. From this point of view, in the Bischoff Report (2009),
banking and finance present themselves as here to help with meeting “social need”.
But the one certainty is that finance and banking, as we know them, are part of the
problem.
Finance is irrelevant because it is focused not on physical projects but on coupons and
portfolio allocation: intermediaries each year allocate a sum roughly equal to gross
fixed capital formation mainly into issued coupons on the secondary market in shares
and bonds. Banking is part of the problem because its lending is primarily focused on
financing asset purchase: in the pre-2007 period, two-thirds of bank lending in the UK
was on commercial and residential property and much of the rest went in lending to
financial companies which were increasingly leveraged. We need to establish a much
stronger, direct link between savings and physical investment in appropriately green
infrastructure Thirty years after Thatcher won her first victory in 1979 we are at
another historical turning point and, just as before, the key to seizing the opportunity
is to have a new story about the means of wealth creation and distribution. This would
revise Thatcher’s first principle that the private sector create wealth and the public

CRESC Working papers
- 28 -
sector consumes wealth, which is only true if the measure of wealth creation is private
marketability and cost recovery with a surplus. If the measure is more social, as with
the objective of limiting temperature rise from greenhouse gases, the issue is how
public and private can be interconnected in innovative ways to deliver socially
beneficial results including the jobs which are central to the distribution of welfare.

Undisclosed and unsustainable: problems of the UK national business model
- 29 -
APPENDIX A: Standard Industrial Classification (SIC) 4-Digit activities classified as
State and Para-State with employment weightings
Activity
weighting
Standard Industrial Classification
1.00 0100: DEFRA/Scottish Executive Agricultural Data
0.05 3720: Recycling of non-metal waste and scrap
0.50 4523: Construction of highways, roads, airfields and sports facilities
0.50 5231: Dispensing chemists
0.50 5232: Retail sale of medical and orthopaedic goods
0.50 6220: Non-scheduled air transport
1.00 6230: Space transport
1.00 6411: National post activities
1.00 6511: Central banking
0.75 6711: Administration of financial markets
0.25 7310: Research and experimental development on natural sciences and engineering
0.80 7320: Research and experimental development on social sciences and humanities
1.00 7511: General (overall) public service activities
1.00 7512: Regulation of the activities of agencies that provide health care, education, cultural services and other social services excluding social security
1.00 7513: Regulation of and contribution to more efficient operation of business
1.00 7514: Supporting service activities for the government as a whole
1.00 7521: Foreign affairs
1.00 7522: Defence activities
1.00 7523: Justice and judicial activities
1.00 7524: Public security, law and order activities
1.00 7525: Fire service activities
1.00 7530: Compulsory social security activities
1.00 8010: Primary education
1.00 8021: General secondary education
1.00 8022: Technical and vocational secondary education
1.00 8030: Higher education
1.00 8042: Adult and other education not elsewhere classified
1.00 8511: Hospital activities
1.00 8512: Medical practice activities
0.50 8513: Dental practice activities
0.25 8514: Other human health activities
0.20 8520: Veterinary activities
1.00 8531: Social work activities with accommodation
1.00 8532: Social work activities without accommodation
0.50 9232: Operation of arts facilities
1.00 9251: Library and archive activities
1.00 9252: Museum activities and preservation of historical sites and buildings
1.00 9253: Botanical and zoological gardens and nature reserve activities
1.00 9900: Extra-territorial organisations and bodies
Source: Nomis, Office for National Statistics, London.

CRESC Working papers
- 30 -
REFERENCES
Eds. Atkinson, A. and Bourguignon, F. (2000) Handbook of Income Inequality, North-
Holland, Amsterdam.
Atkinson, D. and Elliott, L. (2007) Fantasy Island, Constable, London.
Bacon, R. and Eltis, W. (1976) Britain's Economic Problem: Too Few Producers,
Macmillan, London.
Bischoff, W. and Darling A. (2009) UK international financial services –the future: A
report from UK based financial services leaders to the Government [The Bischoff
Report], HM Treasury, London.
Bivens, J. (2003) Updated Employment Multipliers for the U.S. Economy, Economic
Policy Institute, Washington DC.
Clift, B. and Tomlinson, J. (2007) Credible Keynesianism? New Labour macroeconomic
policy and the political economy of coarse policy tuning, British Journal of Political
Science, 37, pp.47-69.
CRESC Report (2009) An alternative report on UK banking reform, a public interest
report by the Centre for Research on Socio Cultural Change, University of
Manchester.
Eltis, W. (2000) Britain, Europe and the EMU, St Martin’s Press, New York.
Froud, J., Johal, S., Leaver, A. and Williams, K. (2006) Financialization and Strategy:
narrative and numbers, Routledge, London.
Froud, J., Johal, S., Montgomerie, J. and Williams, K. (forthcoming) Escaping the
tyranny of earned income? The failure of finance as social innovation, New Political
Economy.
Hayes, R. and Abernathy, W. (1980) Managing our way to industrial decline, Harvard
Business Review, July-August.
Horton, M., Kumar, M. and Mauro, P. (2009), ‘The State of Public Finances: A Cross-
Country Fiscal Monitor’, IMF staff position note, IMF.
Leaver, A. et al. (2009) Stressed by Choice: A Business Model Analysis of the BBC,
British Journal of Management, 20(2), pp.252-264.
Lovering, J. (1999) Celebrating Globalisation and Misreading the Welsh Economy: ‘The
New Regionalism’ in Wales, Contemporary Wales, 11, pp.12-60.
Martin, R. (2001) Geography and public policy: the case of the missing agenda,
Progress in Human Geography, 25(2), pp. 189-210.
Meadows, D., Meadows, D. Randers, J, and Behrens III, W. (1972) The Limits to Growth,
Universe Books, New York.
NESTA (2006) Investing in the Creative Industries, National Endowment for Science
Technology and the Arts, London.
Office for National Statistics (2009) United Kingdom National Accounts, The Blue Book,
Palgrave Macmillan, London.
Piketty, T. and Saez, E. (2003) Income inequality in the United States, 1913-1998,
Quarterly Journal of Economics, 118(1).

Undisclosed and unsustainable: problems of the UK national business model
- 31 -
Piore, M. and Sabel, C. (1984) The Second Industrial Divide: Possibilities for Prosperity,
Basic Books, New York.
Reich, R. (1991) The Work of Nations, Vintage Books, New York.
Singh, A. (1977) UK industry and the world economy: a case of deindustrialisation,
Cambridge Journal of Economics, 1(2):113–136.
Skidelsky, R. (1988) Thatcherism, Chatto & Windus, London.
Stern, N. (2006) Stern Review on the Economics of Climate Change, Cambridge
University Press, Cambridge.
Stiglitz, J. (2002) Globalization and its discontents, Allen Lane, London
Watson, I., Buchanan, J., Campbell, I. and Briggs, C. (2003) Fragmented Futures: New
Challenges in Working Life, Federation Press, Sydney.
Wigley, B. (2008) London: winning in a changing world [The Wigley report], Merrill
Lynch Europe Limited.
Williams, K., Williams, J. and Thomas, D. (1983) Why are the British Bad at
Manufacturing, Routledge & Kegan Paul, London.
Womack, J., Jones, D. and Roos, D. (1990) The Machine that Changed the World,
Rawson Associates, New York.


![OVERTURE TO CANDIDE...4 1st Alto Sax. cresc. poco a ~oco sernpre cresc. pi6 mosso A- cresc. cresc moltocfesc .]'%if]](https://img.pdfslide.net/doc/110x75/614946f3080bfa62601481b9/overture-to-candide-4-1st-alto-sax-cresc-poco-a-oco-sernpre-cresc-pi6-mosso.jpg)