Embed Size (px)
Citation preview

CREW Discussion Paper
Pooja Pokhrel
Nathan India (Pvt.) Ltd.
14 March 2013, Jaipur
CREW PAC Meeting
2
Purpose of Paper
• Literature review to survey methodologies used to assess impact of competition reform
• Recommend a methodology for CREW• Develop a rationale for selecting 4 countries
and 2 common sectors for CREW• Recommend 4 countries and 2 sectors
Presentation Overview
• Part I: Literature Review―Commonly Used Methodologies―Pros/Cons of each―Suggested methodology for CREW
• Part II: Country/Sector Selection―Country Selection Approach―Recommendations for CREW countries―Sector Selection Approach―Recommendations for CREW sectors
3

4
Part I: Survey of Methodologies
Commonly Used Methodologies
• Time Series Variation Comparing outcomes before and after reform
• Spatial Variation Comparing outcomes between regulated and unregulated markets
• Structural estimation/Simulation model Shocking an economic model with reform variables to investigate
the effect on other structural variables
• Cost Benefit Analysis Comparing monetized costs and benefits of reform
• Surveys Targeting agents and beneficiaries specific to the particular case,
industry or market under investigation
5
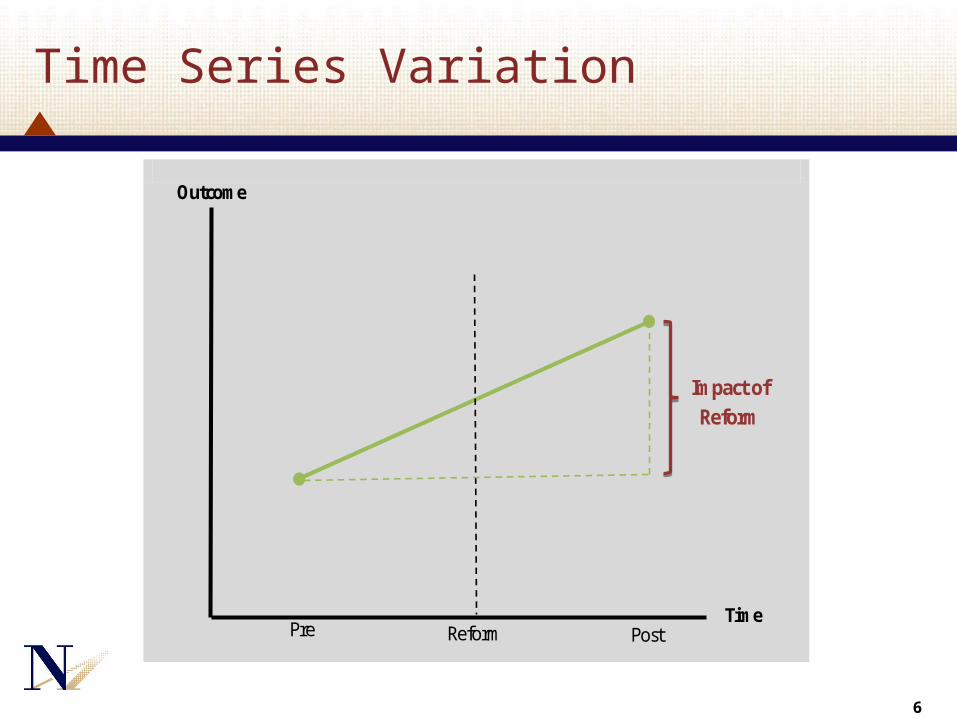
Time Series Variation
6
Outcome
Time Pre Reform Post
Impact of Reform
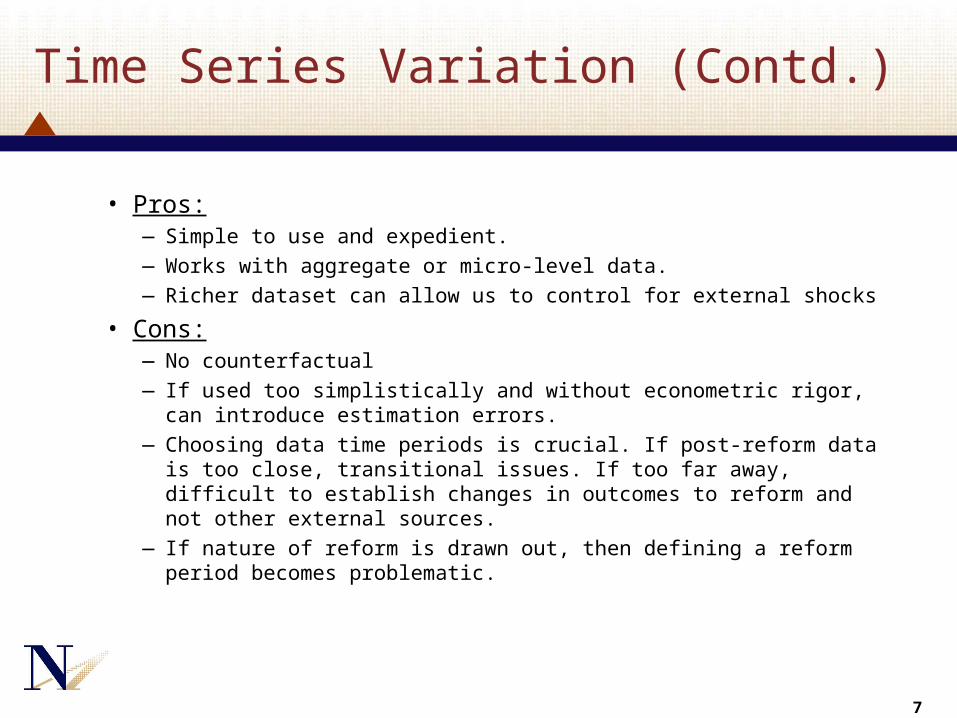
Time Series Variation (Contd.)
• Pros:―Simple to use and expedient. ―Works with aggregate or micro-level data.―Richer dataset can allow us to control for external shocks
• Cons:―No counterfactual― If used too simplistically and without econometric rigor, can
introduce estimation errors.―Choosing data time periods is crucial. If post-reform data is too
close, transitional issues. If too far away, difficult to establish changes in outcomes to reform and not other external sources.
― If nature of reform is drawn out, then defining a reform period becomes problematic.
7
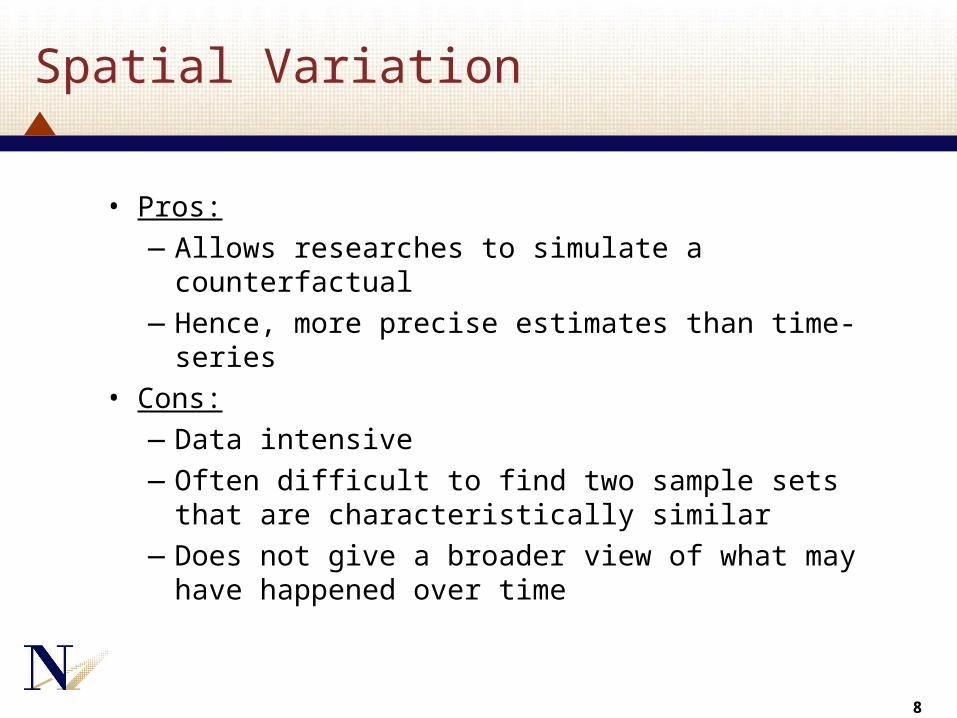
Spatial Variation
• Pros:―Allows researches to simulate a counterfactual―Hence, more precise estimates than time-series
• Cons:―Data intensive―Often difficult to find two sample sets that are
characteristically similar―Does not give a broader view of what may have
happened over time
8
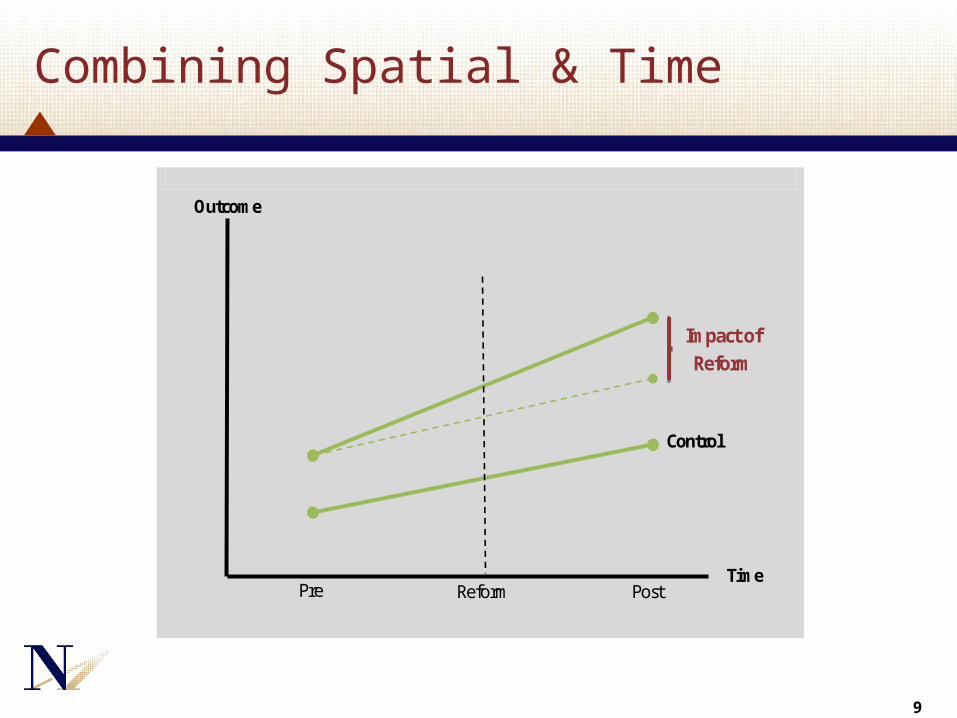
Combining Spatial & Time
9
Outcome
Time Pre Reform Post
Impact of Reform
Control

Structural estimation/Simulation model
• Pros:―Builds on a strong background in modern
economic theory―Effects of reform can be explained by
interactions of several economic variables―Accuracy of the underlying model can be
tested through calibration with real market data
10
Structural estimation/Simulation model (Contd.)
• Cons:―Often referred to as “black boxes”
because of intricacies of inherent economic equations
―High cost of entry for new modelers―Data demands not insignificant
11
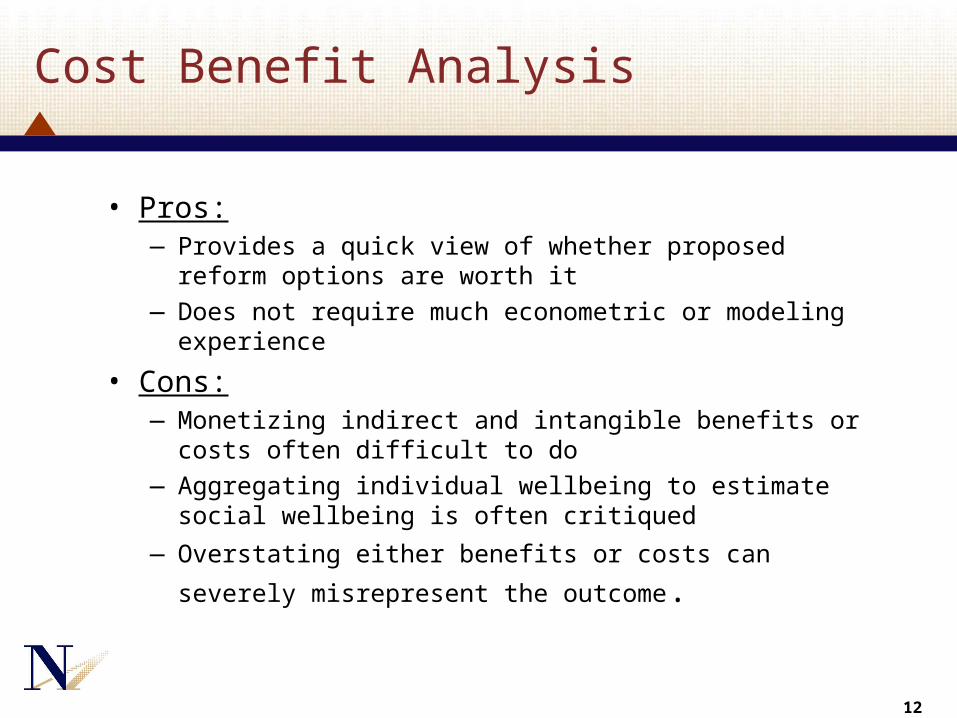
Cost Benefit Analysis
• Pros:―Provides a quick view of whether proposed reform options
are worth it
―Does not require much econometric or modeling experience
• Cons:―Monetizing indirect and intangible benefits or costs often
difficult to do
―Aggregating individual wellbeing to estimate social wellbeing is often critiqued
―Overstating either benefits or costs can severely
misrepresent the outcome.
12
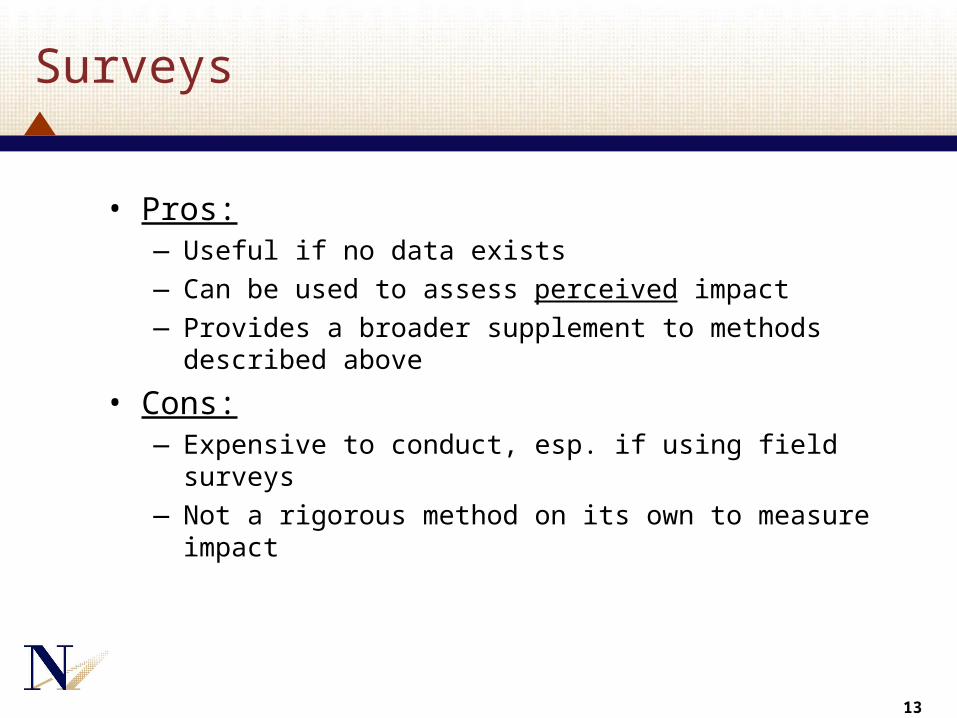
Surveys
• Pros:―Useful if no data exists―Can be used to assess perceived impact―Provides a broader supplement to methods described
above
• Cons:―Expensive to conduct, esp. if using field surveys―Not a rigorous method on its own to measure impact
13

What does this mean for CREW?
• “Methodologies have methodological flaws”
• Data will always be a problem• A fixed rigid approach will not work,
esp. when dealing with multiple countries & multiple sectors
• Methodologies will need to be tailored, yet be consistent across the board
14
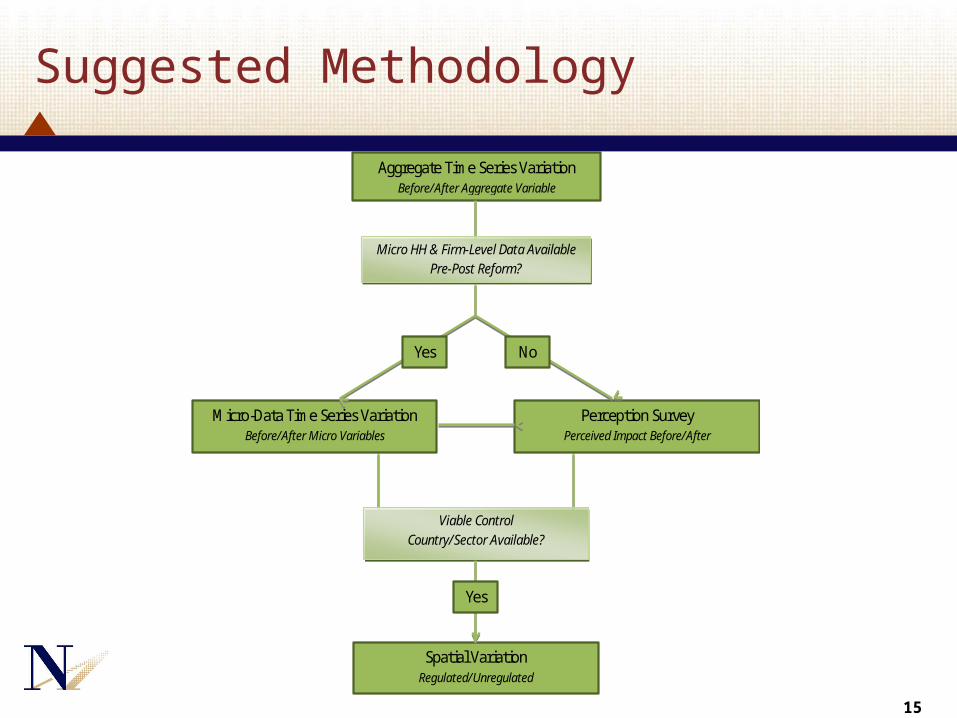
Suggested Methodology
15
Aggregate Time Series Variation
Before/After Aggregate Variable
Micro HH & Firm-Level Data Available Pre-Post Reform?
Micro-Data Time Series Variation Before/After Micro Variables
Perception Survey Perceived Impact Before/After
Viable Control Country/Sector Available?
Yes No
Spatial Variation Regulated/Unregulated
Yes
16
Part II: Country/Sector Selection
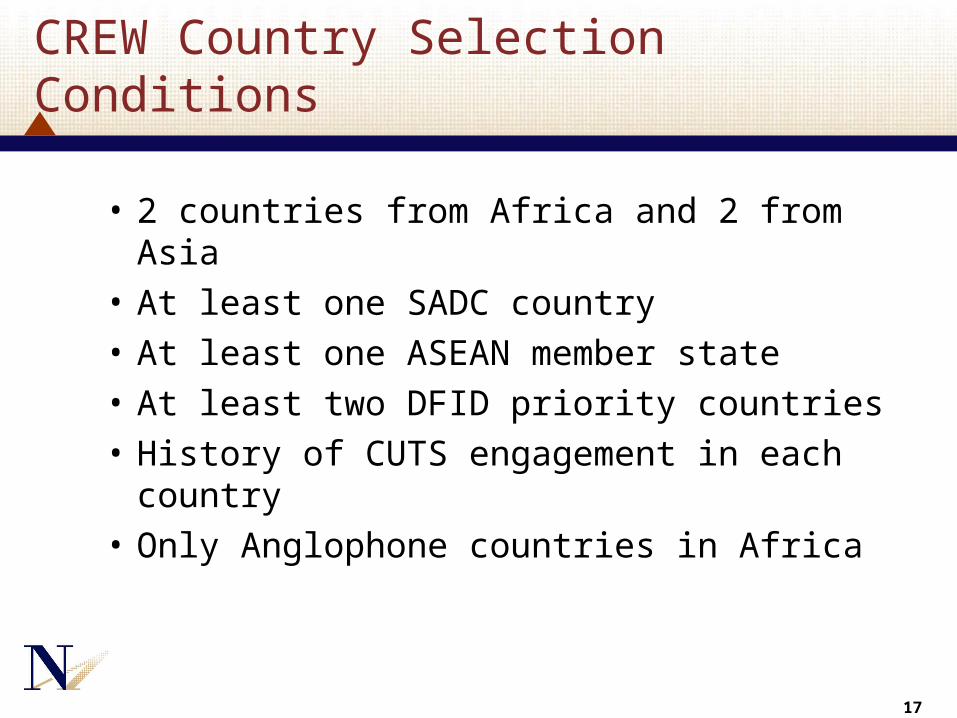
CREW Country Selection Conditions
• 2 countries from Africa and 2 from Asia
• At least one SADC country
• At least one ASEAN member state
• At least two DFID priority countries
• History of CUTS engagement in each country
• Only Anglophone countries in Africa
17
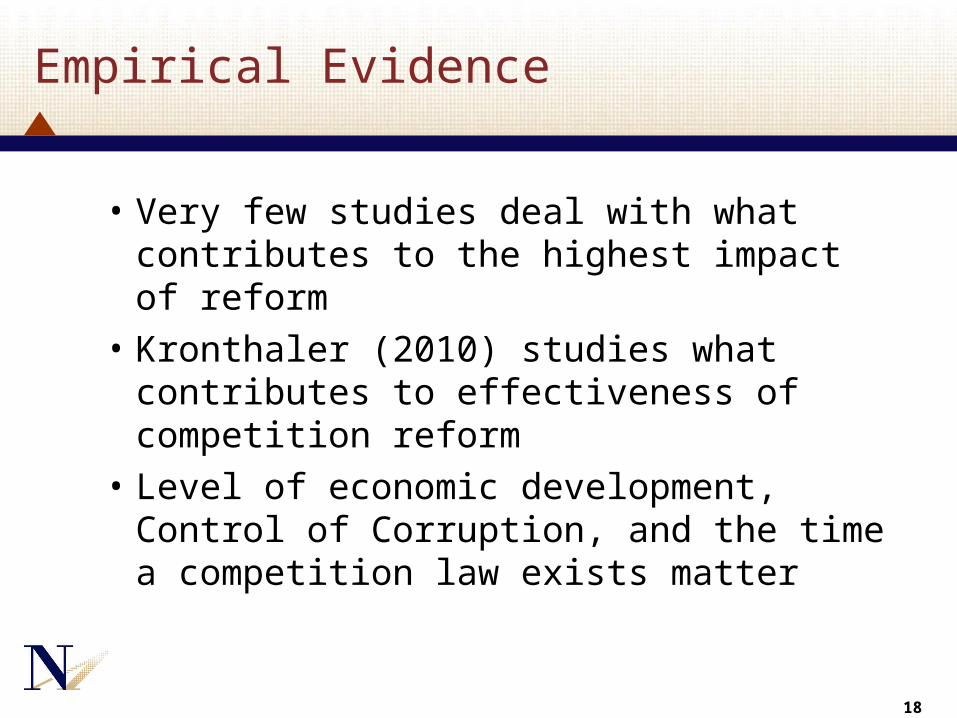
Empirical Evidence
• Very few studies deal with what contributes to the highest impact of reform
• Kronthaler (2010) studies what contributes to effectiveness of competition reform
• Level of economic development, Control of Corruption, and the time a competition law exists matter
18
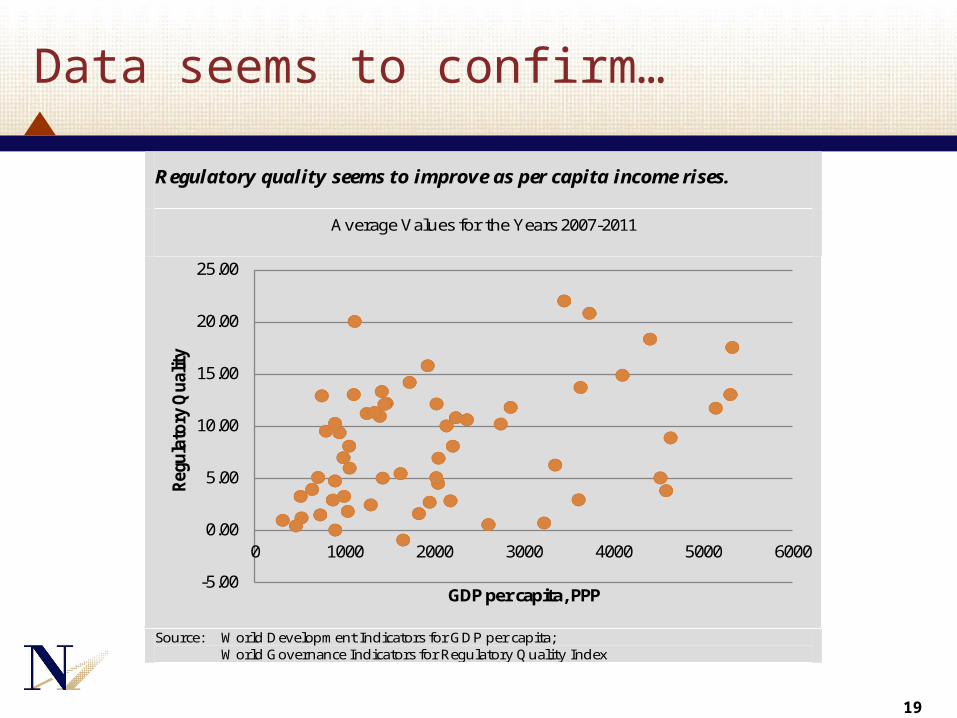
Data seems to confirm…
19
Regulatory quality seems to improve as per capita income rises.
Average Values for the Years 2007-2011
Source: World Development Indicators for GDP per capita;
World Governance Indicators for Regulatory Quality Index
-5.00
0.00
5.00
10.00
15.00
20.00
25.00
0 1000 2000 3000 4000 5000 6000
Reg
ulat
ory
Qua
lity
GDP per capita, PPP
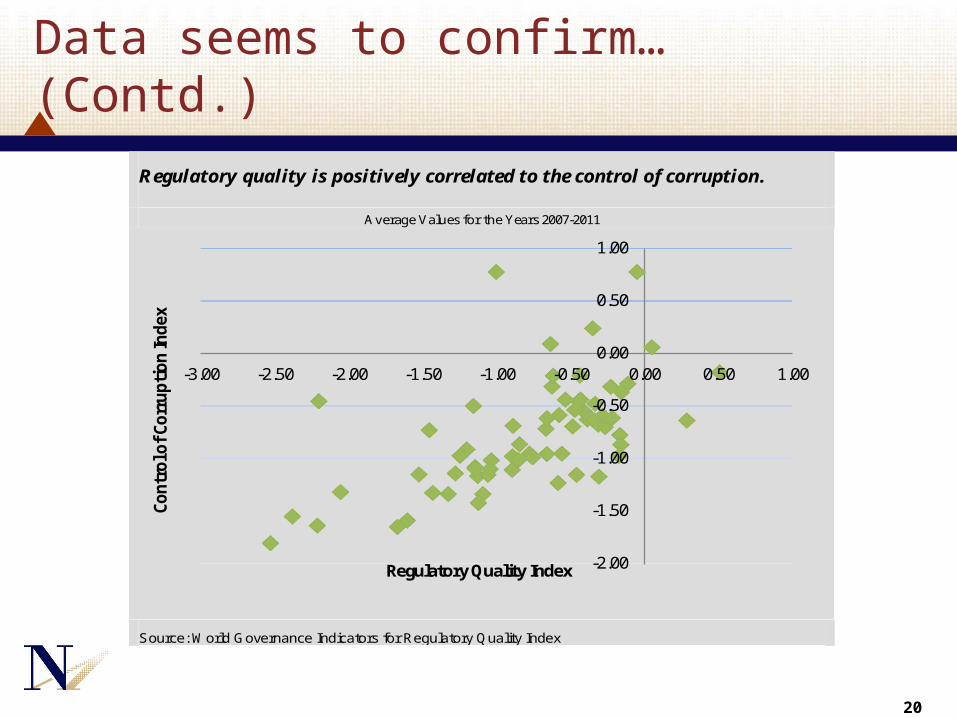
Data seems to confirm… (Contd.)
20
Regulatory quality is positively correlated to the control of corruption.
Average Values for the Years 2007-2011
Source: World Governance Indicators for Regulatory Quality Index
-2.00
-1.50
-1.00
-0.50
0.00
0.50
1.00
-3.00 -2.50 -2.00 -1.50 -1.00 -0.50 0.00 0.50 1.00
Cont
rol o
f Cor
rupti
on In
dex
Regulatory Quality Index
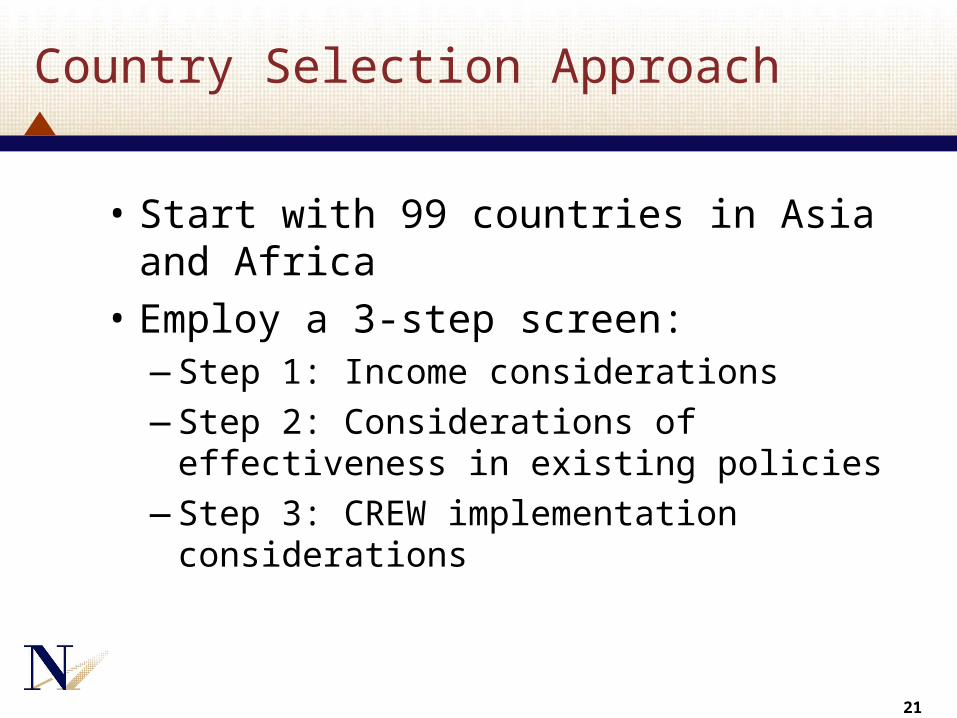
Country Selection Approach
• Start with 99 countries in Asia and Africa
• Employ a 3-step screen:―Step 1: Income considerations―Step 2: Considerations of effectiveness in
existing policies―Step 3: CREW implementation
considerations
21
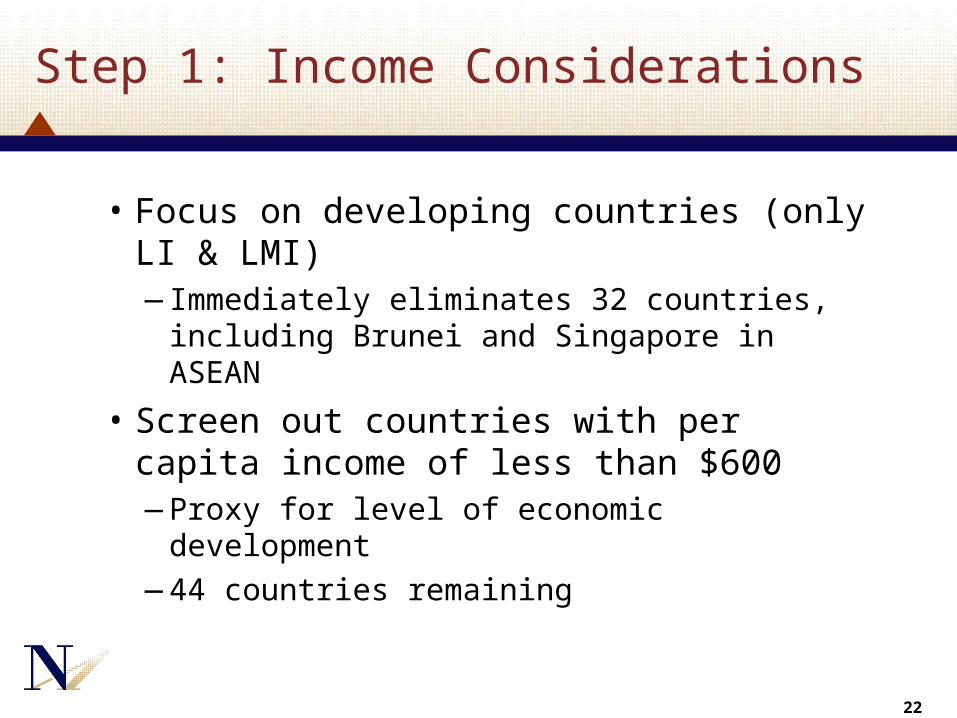
Step 1: Income Considerations
• Focus on developing countries (only LI & LMI)―Immediately eliminates 32 countries,
including Brunei and Singapore in ASEAN
• Screen out countries with per capita income of less than $600―Proxy for level of economic development―44 countries remaining
22
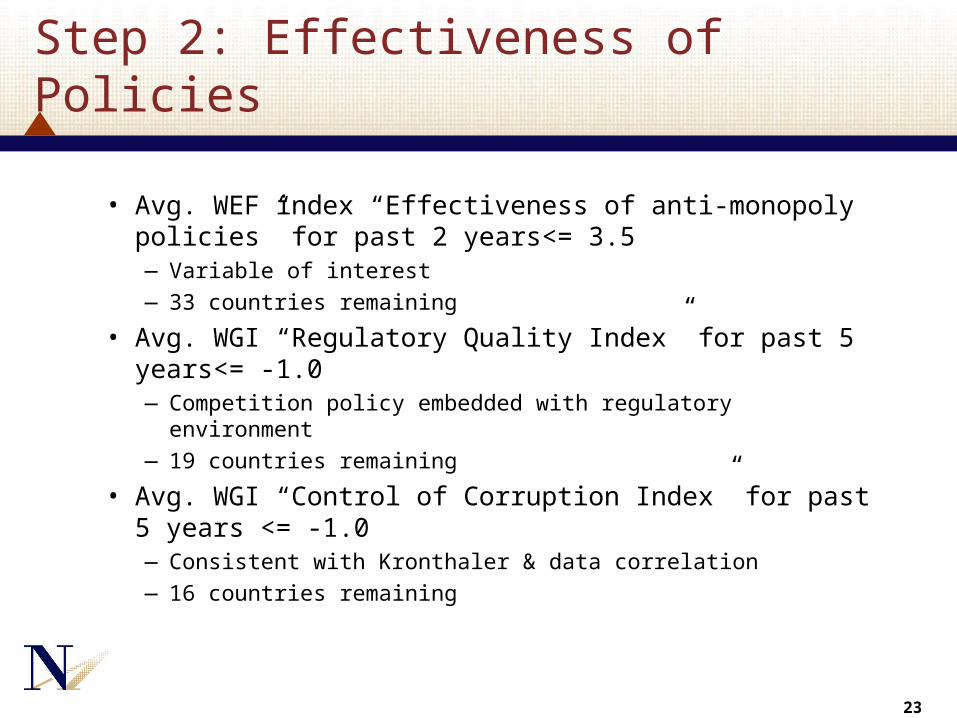
Step 2: Effectiveness of Policies
• Avg. WEF index “Effectiveness of anti-monopoly policies” for past 2 years<= 3.5―Variable of interest
―33 countries remaining
• Avg. WGI “Regulatory Quality Index” for past 5 years<= -1.0―Competition policy embedded with regulatory environment
―19 countries remaining
• Avg. WGI “Control of Corruption Index” for past 5 years <= -1.0―Consistent with Kronthaler & data correlation
―16 countries remaining
23
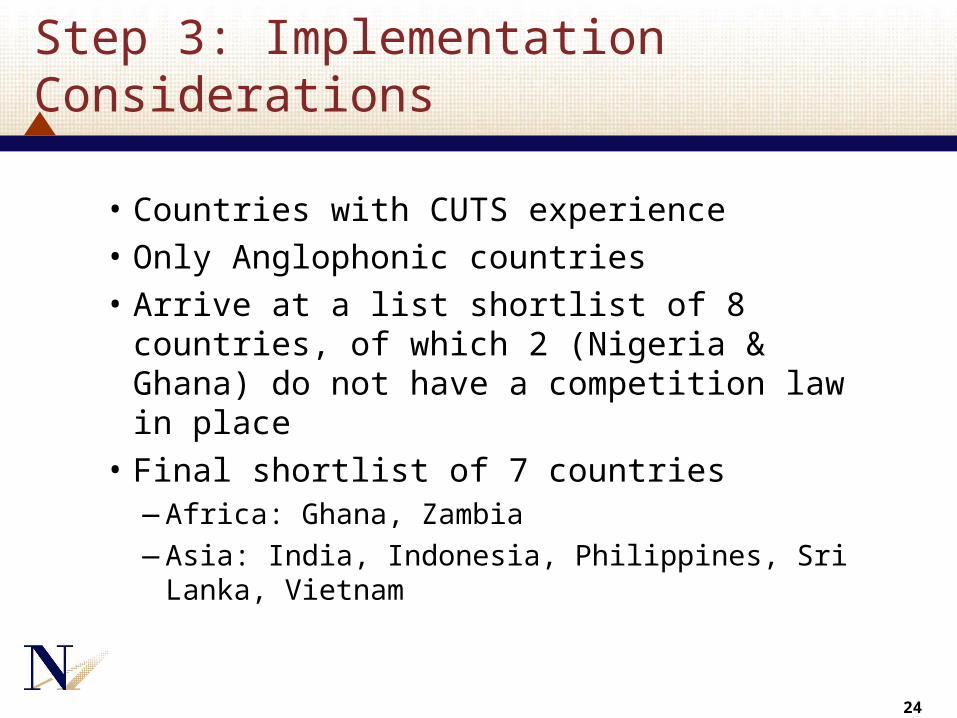
Step 3: Implementation Considerations
• Countries with CUTS experience
• Only Anglophonic countries
• Arrive at a list shortlist of 8 countries, of which 2 (Nigeria & Ghana) do not have a competition law in place
• Final shortlist of 7 countries―Africa: Ghana, Zambia―Asia: India, Indonesia, Philippines, Sri Lanka,
Vietnam
24
Sector Selection Approach
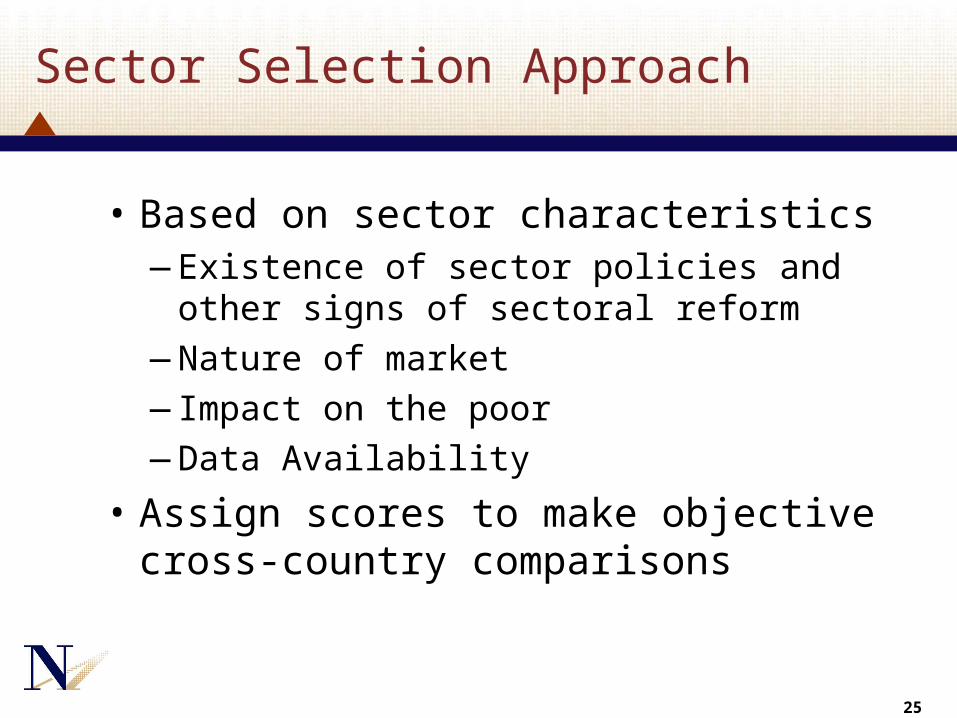
• Based on sector characteristics―Existence of sector policies and other
signs of sectoral reform―Nature of market―Impact on the poor―Data Availability
• Assign scores to make objective cross-country comparisons
25
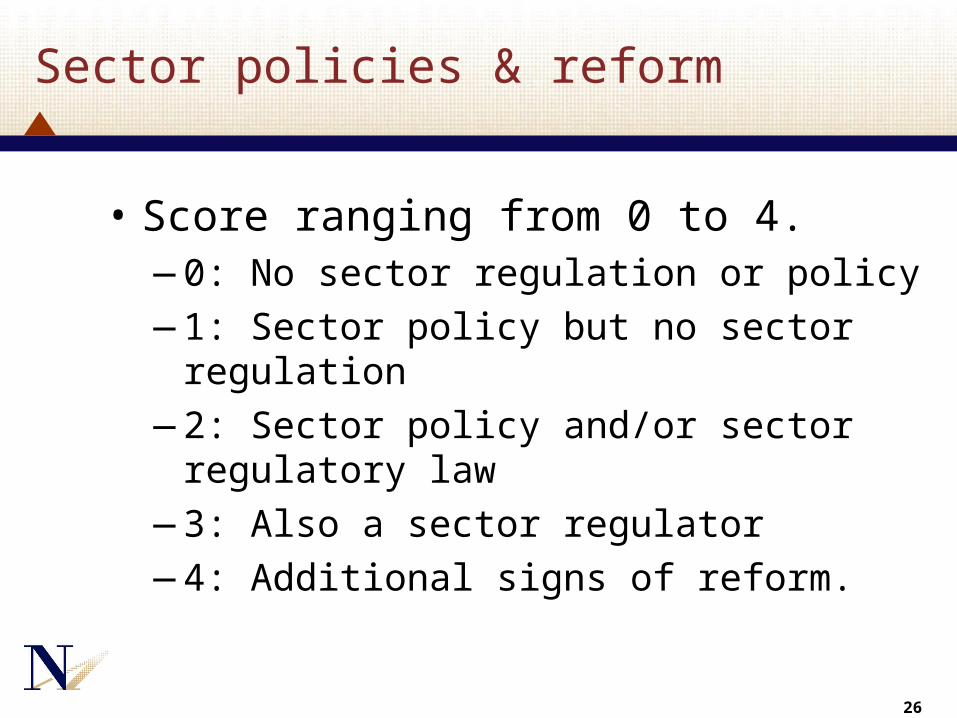
Sector policies & reform
• Score ranging from 0 to 4. ―0: No sector regulation or policy―1: Sector policy but no sector regulation―2: Sector policy and/or sector regulatory law―3: Also a sector regulator―4: Additional signs of reform.
26

Nature of Market
• Review number of market players, market shares, influence of SOEs
• Score ranges from 1 to 3―1: Primarily a monopoly or if there are no
organized market players―2: Has one or a few large players with some
other smaller participants―3: Seems to have multiple market players
and competition.
27
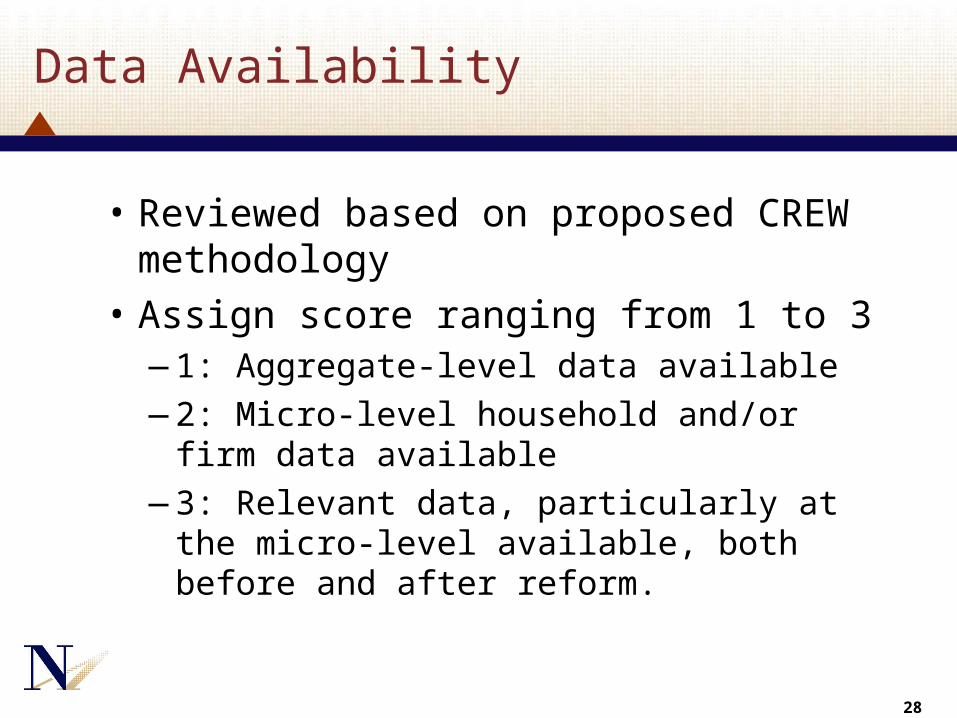
Data Availability
• Reviewed based on proposed CREW methodology
• Assign score ranging from 1 to 3―1: Aggregate-level data available―2: Micro-level household and/or firm data
available―3: Relevant data, particularly at the micro-
level available, both before and after reform.
28
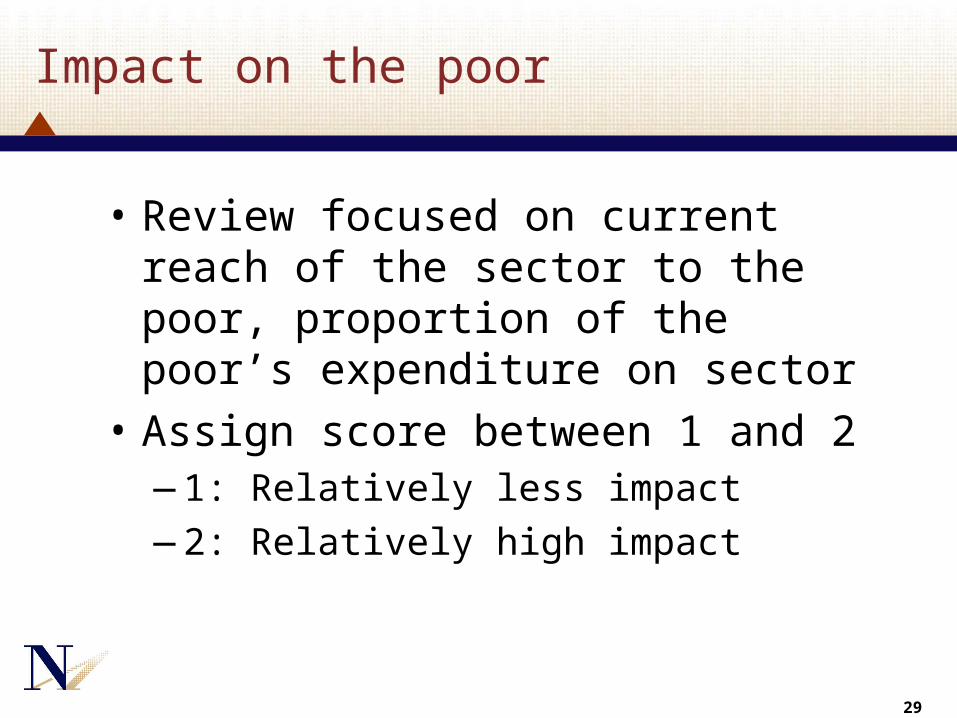
Impact on the poor
• Review focused on current reach of the sector to the poor, proportion of the poor’s expenditure on sector
• Assign score between 1 and 2―1: Relatively less impact―2: Relatively high impact
29
Sector Selection
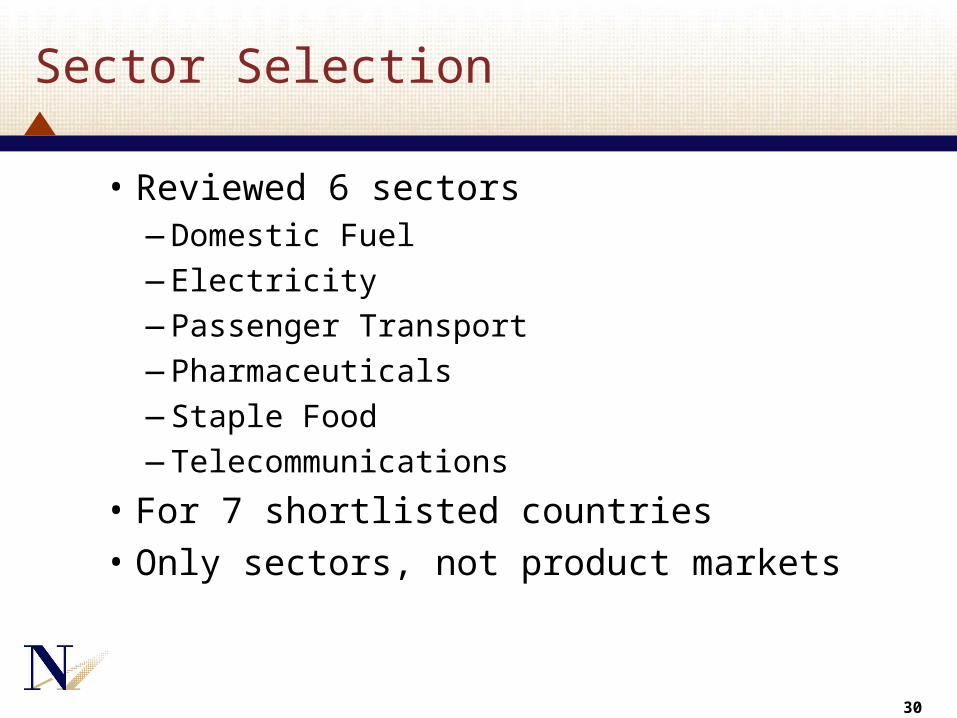
• Reviewed 6 sectors ―Domestic Fuel―Electricity―Passenger Transport―Pharmaceuticals―Staple Food―Telecommunications
• For 7 shortlisted countries
• Only sectors, not product markets
30
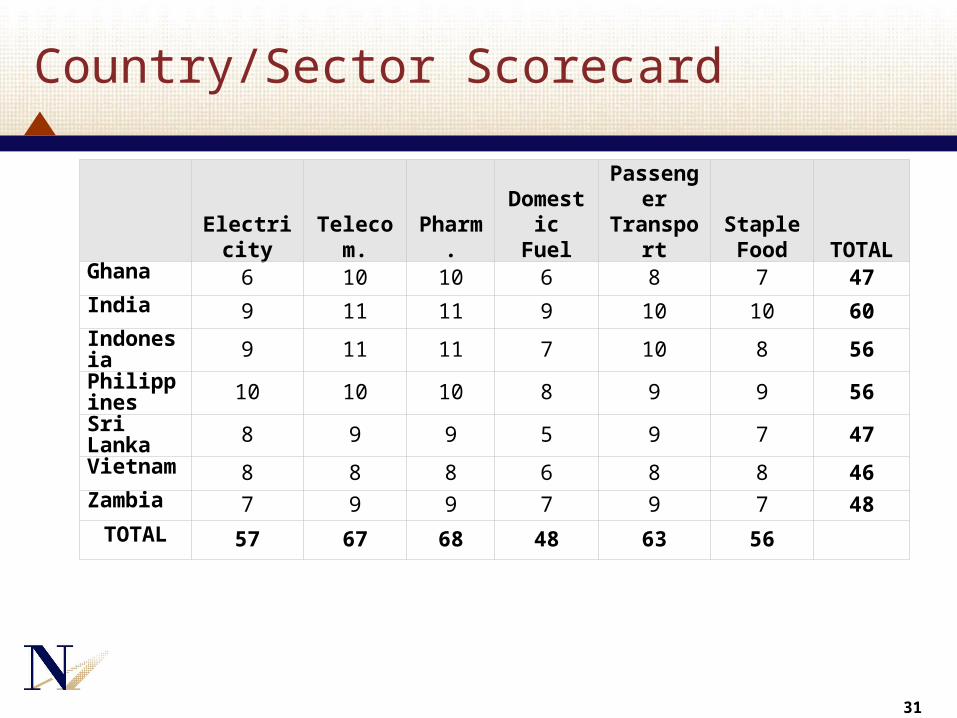
Country/Sector Scorecard
31
Electricity Telecom. Pharm.Domestic
FuelPassenger Transport
Staple Food TOTAL
Ghana 6 10 10 6 8 7 47India 9 11 11 9 10 10 60Indonesia 9 11 11 7 10 8 56Philippines 10 10 10 8 9 9 56Sri Lanka 8 9 9 5 9 7 47Vietnam 8 8 8 6 8 8 46Zambia 7 9 9 7 9 7 48
TOTAL 57 67 68 48 63 56
Proposed Countries & Sectors
• Sectors―Pharmaceuticals, Telecommunications,
Passenger Transport (in that order)
• Countries―Ghana, India, Indonesia, and Zambia
32

33
Thank you!


![Untitled-1 [] · 2019-01-06 · One day Utsava Pooja Utsava Bali Dhwaja Pooja Usha Pooja Madhyana Pooja Athazha Pooja Chathursuddhi Kalasabhishekam Dhara Kalasabhishekam Nava Panchagavya](https://img.pdfslide.net/doc/110x75/5e63ce9e8a58660cb97c6753/untitled-1-2019-01-06-one-day-utsava-pooja-utsava-bali-dhwaja-pooja-usha-pooja.jpg)