Embed Size (px)
Citation preview
IZA DP No. 2009
Youth Unemployment and Crime in France
Denis FougèreFrancis KramarzJulien Pouget
DI
SC
US
SI
ON
PA
PE
R S
ER
IE
S
Forschungsinstitutzur Zukunft der ArbeitInstitute for the Studyof Labor
March 2006
Youth Unemployment and Crime in France
Denis Fougère CNRS, CREST-INSEE, CEPR
and IZA Bonn
Francis Kramarz
CREST-INSEE, CEPR and IZA Bonn
Julien Pouget
CREST-INSEE and IZA Bonn
Discussion Paper No. 2009 March 2006
IZA
P.O. Box 7240 53072 Bonn
Germany
Phone: +49-228-3894-0 Fax: +49-228-3894-180
Email: [email protected]
Any opinions expressed here are those of the author(s) and not those of the institute. Research disseminated by IZA may include views on policy, but the institute itself takes no institutional policy positions. The Institute for the Study of Labor (IZA) in Bonn is a local and virtual international research center and a place of communication between science, politics and business. IZA is an independent nonprofit company supported by Deutsche Post World Net. The center is associated with the University of Bonn and offers a stimulating research environment through its research networks, research support, and visitors and doctoral programs. IZA engages in (i) original and internationally competitive research in all fields of labor economics, (ii) development of policy concepts, and (iii) dissemination of research results and concepts to the interested public. IZA Discussion Papers often represent preliminary work and are circulated to encourage discussion. Citation of such a paper should account for its provisional character. A revised version may be available directly from the author.

IZA Discussion Paper No. 2009 March 2006
ABSTRACT
Youth Unemployment and Crime in France*
In this paper we examine the influence of unemployment on property crimes and on violent crimes in France for the period 1990 to 2000. This analysis is the first extensive study for this country. We construct a regional-level data set (for the 95 départements of metropolitan France) with measures of crimes as reported to the Ministry of Interior. To assess social conditions prevailing in the département in that year, we construct measures of the unemployment rate as well as other social, economic and demographic variables using multiple waves of the French Labor Survey. We estimate a classic Becker type model in which unemployment is a measure of how potential criminals fare in the legitimate job market. First, our estimates show that in the cross-section dimension, crime and unemployment are positively associated. Second, we find that increases in youth unemployment induce increases in crime. Using the predicted industrial structure to instrument unemployment, we show that this effect is causal for burglaries, thefts, and drug offences. To combat crime, it appears thus that all strategies designed to combat youth unemployment should be examined. JEL Classification: J19, K42, J64, J65 Keywords: crime, youth unemployment Corresponding author: Denis Fougère CREST-INSEE 15, Boulevard Gabriel Péri 92245 Malakoff Cedex France Email: [email protected]
* We would like to thank Pierre Alquier (CREST-INSEE), Sylvie Dumartin (INSEE), François Poinat (INSEE), and Dominique Quarré (INSEE) for their help in the construction of the data used in this analysis. We would also like to thank Eric Gould for his constructive comments as well as seminar participants at CREST, the NBER summer institute, the 18th annual EEA congress, the CEPR-IZA summer institute for helpful comments.
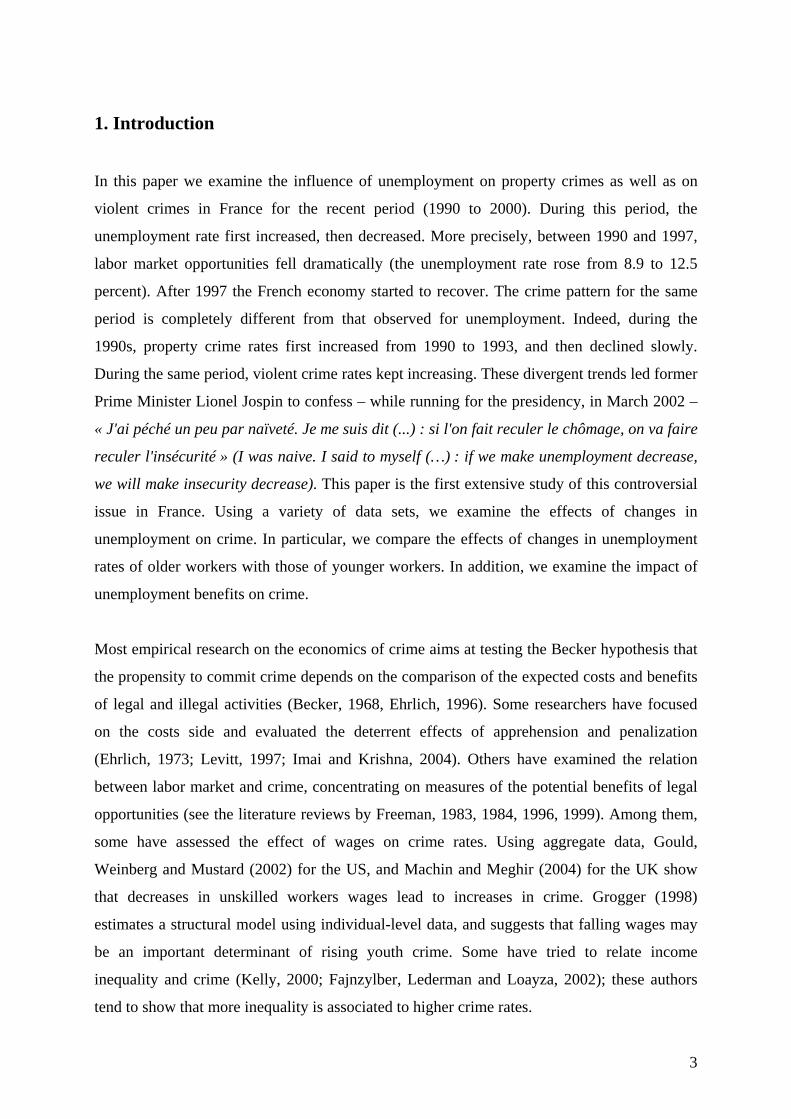
1. Introduction
In this paper we examine the influence of unemployment on property crimes as well as on
violent crimes in France for the recent period (1990 to 2000). During this period, the
unemployment rate first increased, then decreased. More precisely, between 1990 and 1997,
labor market opportunities fell dramatically (the unemployment rate rose from 8.9 to 12.5
percent). After 1997 the French economy started to recover. The crime pattern for the same
period is completely different from that observed for unemployment. Indeed, during the
1990s, property crime rates first increased from 1990 to 1993, and then declined slowly.
During the same period, violent crime rates kept increasing. These divergent trends led former
Prime Minister Lionel Jospin to confess – while running for the presidency, in March 2002 –
« J'ai péché un peu par naïveté. Je me suis dit (...) : si l'on fait reculer le chômage, on va faire
reculer l'insécurité » (I was naive. I said to myself (…) : if we make unemployment decrease,
we will make insecurity decrease). This paper is the first extensive study of this controversial
issue in France. Using a variety of data sets, we examine the effects of changes in
unemployment on crime. In particular, we compare the effects of changes in unemployment
rates of older workers with those of younger workers. In addition, we examine the impact of
unemployment benefits on crime.
Most empirical research on the economics of crime aims at testing the Becker hypothesis that
the propensity to commit crime depends on the comparison of the expected costs and benefits
of legal and illegal activities (Becker, 1968, Ehrlich, 1996). Some researchers have focused
on the costs side and evaluated the deterrent effects of apprehension and penalization
(Ehrlich, 1973; Levitt, 1997; Imai and Krishna, 2004). Others have examined the relation
between labor market and crime, concentrating on measures of the potential benefits of legal
opportunities (see the literature reviews by Freeman, 1983, 1984, 1996, 1999). Among them,
some have assessed the effect of wages on crime rates. Using aggregate data, Gould,
Weinberg and Mustard (2002) for the US, and Machin and Meghir (2004) for the UK show
that decreases in unskilled workers wages lead to increases in crime. Grogger (1998)
estimates a structural model using individual-level data, and suggests that falling wages may
be an important determinant of rising youth crime. Some have tried to relate income
inequality and crime (Kelly, 2000; Fajnzylber, Lederman and Loayza, 2002); these authors
tend to show that more inequality is associated to higher crime rates.
3
On the contrary, the literature examining the links between crime and unemployment fails to
reach any consensus. Most studies assume that unemployment is a measure of how potential
criminals fare in the legitimate job market. From the theoretical point of view this hypothesis
seems, at first glance, reasonable. Indeed, according to Becker’s economic theory of crime,
unemployed people are deprived of legal income resources (except for unemployment
benefits), and, thus, are more likely to derive some income from illegal activities. But
empirical findings based on aggregate data suggest that this relationship is not particularly
strong. According to Chiricos’ review (1987), most studies of this type find a positive
relationship between unemployment and crime, but this effect is not always significant, and
some even find a negative association. For example, using panel data for Germany, Entorf
and Spengler (2000) confirm the ambiguous result for total unemployment, even if they
suggest that youth unemployment is associated with a higher probability of committing
crimes. Studies based on individual-level data (such as Witte and Tauchen, 1994, who use
data from a cohort sample of young men) provide more convincing evidence that crime is
linked to unemployment. Thornberry and Christenson (1984) investigate the causal structure
between unemployment and crime. According to their results, unemployment has significant
instantaneous effects on crime and crime has significant but lagged effects on unemployment.
Cantor and Land (1985) try to identify two distinct (and potentially counterbalancing)
mechanisms, criminal opportunity and criminal motivation, through which unemployment
may affect crime rates in the aggregate.
In this article, we estimate a classic Becker-type model and suggest some arguments
explaining why most studies were not able to find a strong relation between crime and
unemployment. To accomplish this task, we add several elements to the existing literature.
First, this paper is the first econometric analysis for France of this precise question (see
however Roché, 2001, for an extensive descriptive study of young criminals). We use both
aggregate and individual-level data sets. We construct a unique Département-level data set
(there are 95 départements in France, approximately an American county) measuring crimes
as reported to the Interior Ministry for the years 1990-2000. 17 crime categories are available:
this allows us to separate property crimes (which are more likely to fit the Becker’s model of
the rational offender) and violent crimes, and to study precisely the temporal and geographic
correlations between these categories.
4
Second, we are able to measure extremely precisely the social environment prevailing in
départements.We construct a wealth of social, economic and demographic variables at the
department level. In particular, we use multiple waves of the French Labor Survey and, more
interestingly, various administrative data sets such as national Censuses, administrative and
fiscal sources. Then, these measures are matched to our crime statistics. For instance, we
believe that our very precise measures of urbanization (such as city size or population
density), of social interaction (such as the part of people living in single-parent families), or of
département income structure are relevant controls in order to study criminal behavior: for the
United States, Glaeser and Scheinkman (1996), and Glaeser and Sacerdote (1999) found that
social interactions mattered in their analysis of criminal behavior.
Third, as the effect of unemployment is often ambiguous, we divide the unemployed into
various categories that should have different propensities to commit crime. We directly
measure youth unemployment as well as unemployment of older workers. We also measure
the fraction of unemployed who do not receive unemployment benefits and unemployment
duration. Of course, because today’s crime may well generate tomorrow’s unemployment – if
companies move away from crime-prone zones – unemployment is likely to be endogenous in
our crime regressions. Therefore, we use the predicted rather than the observed industrial
structure to instrument unemployment, an apparently consensual strategy (see Blanchard and
Katz, 1992) if such a thing was ever possible for any set of instruments. And, indeed, our
results suggest that increases in youth unemployment may well cause increases in crime,
because education or work does not pay enough, in particular for the unskilled or low-
educated youth.1
The paper is organized as follows. Section 2 describes the general trends in crime rates and
unemployment in France. Section 3 presents a simple choice model of crime activity wth two
types (age groups) of individuals: potential offenders vs. potential victims. In Section 4, we
introduce the data, the basic model, and estimation methods. Results are reported and
discussed in Section 5. Section 6 concludes.
1 In a recent paper, Bowles and Jayadev (2005) put emphasis on the labor disciplining effect of unemployment, but they recognize that the consequences of unemployment extend well beyond this disciplining effect, especially because the unemployment rate influences directly social phenomena such as property crime.
5
2. Trends in Crime Rates and Unemployment
The aggregate crime data used in this study are collected annually at the département level by
the local Police and Gendarmerie authorities. There are 95 départements in France. Each has
approximately the same size but different populations. They roughly correspond to an
American county. For historical reasons, the body in charge of ensuring security differs
between urban areas, which are “police zones”, and rural areas, which are “gendarmerie
zones”. Policemen’ status is civilian but gendarmerie is a military corps. Both gendarmes and
policemen have to record the number of reported crimes in their respective zones. Then, the
Ministry of Interior collects the data in each zone for each département and publishes the total
number of offences at the département level. So these data cover all the French population.
We restrict attention to the so-called “départements de France métropolitaine”, excluding
overseas territories, but including Corsica. Data are available for the years 1990-2000. Using
département-level population data obtained from the French statistical institute (INSEE), we
calculated crime rates, measured as offences per 100,000 people.
For a crime to be included in these administrative data, it must be first reported to the police
or the gendarmerie, who must then file an official report of the event. Offences are reported
for property crimes (armed or violent robberies, burglaries, car or motorbike thefts, thefts of
objects from cars, shoplifting, pick-pocketing, receiving stolen goods), for violent crimes
(homicides, voluntary wounds, blackmails, threats, sex offences, family offences) and some
other crimes (drug offences, damage to vehicle, illegal weapon ownership, violence against
police). In the case of violent crimes, one crime is counted for each victim, while for property
crimes one crime is reported for each event regardless of the number of victims (except for
pick-pocketing and shoplifting for which one crime is recorded for each victim). For the types
of crimes we study, the classification remained unchanged since 1990.
Table 1 shows the levels and the geographical variability of crimes rates for each available
type of offence in 1990 and 2000. Property crimes are the most numerous and vary a lot
across départments (especially pick-pocketing and violent robberies). On the contrary violent
crimes such as sex offences or family offences show little spatial variability.
6
Figures 1, 2 and 3 depict the trends in these crimes rates for the period 1990-2000. The
differences between these trends justify our choice to break up crime into precise categories
instead of studying one aggregate index. Property crimes such as car thefts, thefts of objects
from cars, shoplifting or burglaries first increased from 1990 to 1993, and then declined
slowly, in contrast to what is often written in the French press. For example, burglaries
declined by 8% between 1990 and 2000. Only armed or violent robberies increased
dramatically (by 74%) during the same period. They follow the same pattern as violent
crimes: except for homicides, all types of violent crimes (including damages to vehicles,
illegal weapon ownership and violence against police) increased during the last decade.
Blackmails and threats tripled and the rate of voluntary wounds doubled. Even if they account
for little in the total reported crimes, these violent crimes are the most likely to influence the
feeling of insecurity, as discussed in the media.
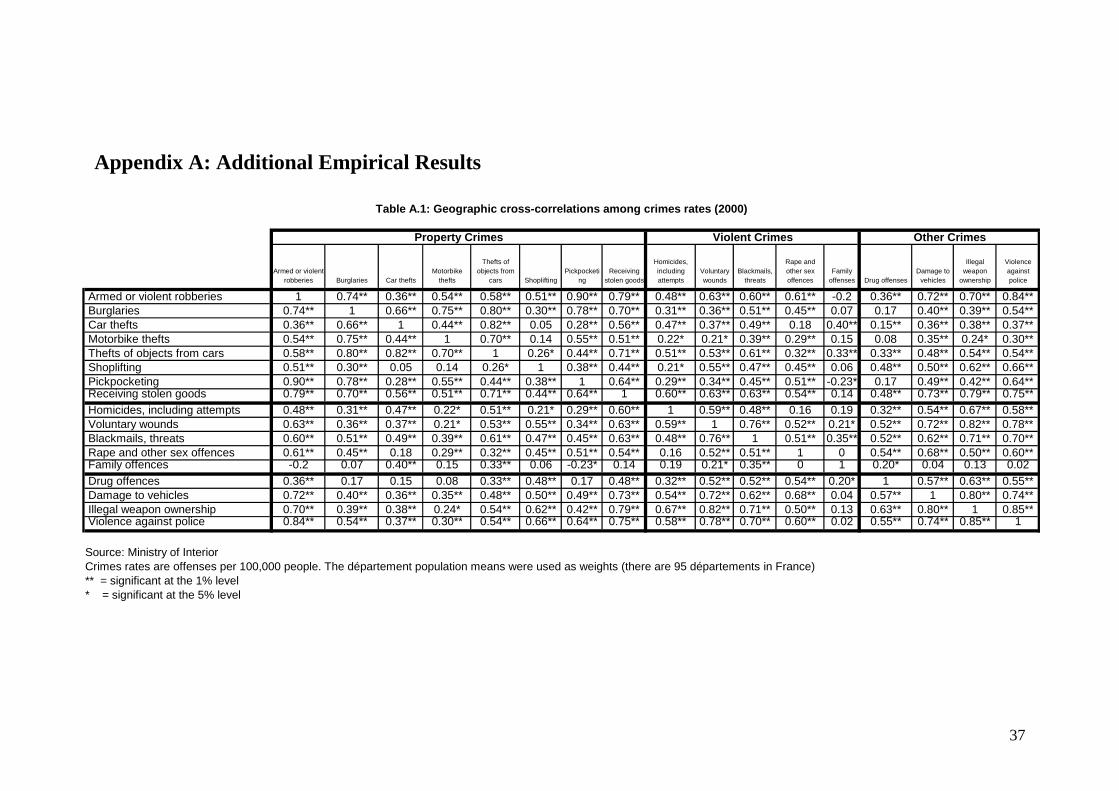
Little has been said about the spatial correlations of crimes rates. Table A.1 in Appendix A
examines these correlations for 2000. All categories of crime are highly correlated.
Départements where property crime rates are high also have very high violent crime rates.
This suggests that our crime categories have some common determinants, as shown in section
4. Most correlations between growth rates for the period 1990-2000 are positive but some are
not significant or even negative (Table A.2); a pattern potentially due to substitution between
crimes (see Koskela and Virén, 1997, for an occupational choice model of crime switching,
and some empirical evidence).
These data are the most frequently cited measures of the extent of crime in France. They are
also the most frequently criticized by the media as being contaminated by multiple biases.
Indeed, their capacity to reflect real trends in crime rates depends on the reporting behavior of
victims and the recording behavior of policemen and gendarmes.
Indeed, not all crimes are reported to the police and, unfortunately, administrative data only
take into account reported crimes. Victimization surveys provide a better measure of the
“true” number of crimes (reported or not to the police). Indeed, some studies show that
different sources may exhibit different trends: for the US, Bogess and Bound (1993) found
that administrative data from the Uniform Crime Report (UCR) suggested a mild increase in
crime during the 1980s, while the National Crime Survey depicted lower criminal activity
over this period. Therefore, we also use such a survey, conducted by the French Statistical
7
Institute (INSEE). We use this survey for the years 1996 to 2002. Roughly 6,000 households
and 11,000 individuals are interviewed every year. For each household, we have information
on burglaries and car thefts. For each individual, the survey records information on thefts,
personal attacks, as well as the feeling of insecurity. This survey also gives information on
reporting of each incident to the police or the gendarmerie, and, if not reported, the reason for
non-reporting the event.
By construction, crime rates measured with victimization surveys are significantly higher than
their counterpart in administrative data. Over the period 1996-2002, 3.0 percent of French
households were victims of a burglary; 13.5 percent had their car or something in their car
stolen. During the years 1997-2002, 8.5 percent of individuals (more than 15 years old) were
wounded, insulted or threatened whereas 4.8 percent were affected by pick pocketing.
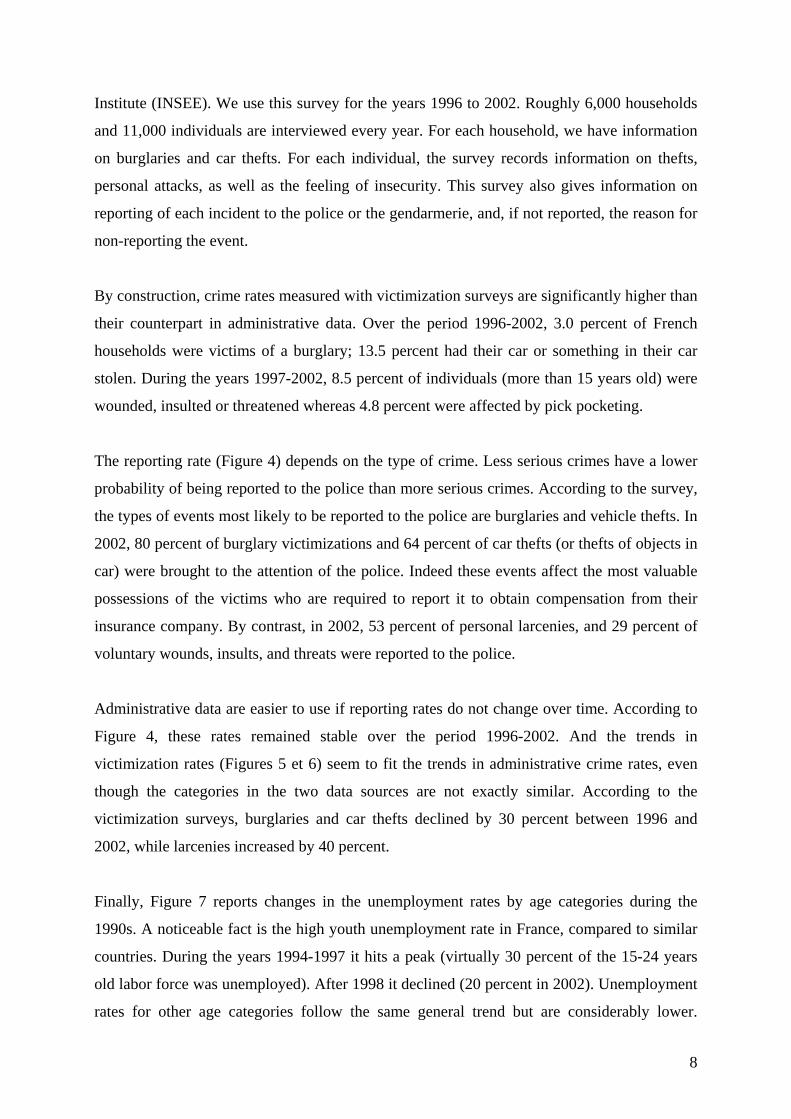
The reporting rate (Figure 4) depends on the type of crime. Less serious crimes have a lower
probability of being reported to the police than more serious crimes. According to the survey,
the types of events most likely to be reported to the police are burglaries and vehicle thefts. In
2002, 80 percent of burglary victimizations and 64 percent of car thefts (or thefts of objects in
car) were brought to the attention of the police. Indeed these events affect the most valuable
possessions of the victims who are required to report it to obtain compensation from their
insurance company. By contrast, in 2002, 53 percent of personal larcenies, and 29 percent of
voluntary wounds, insults, and threats were reported to the police.
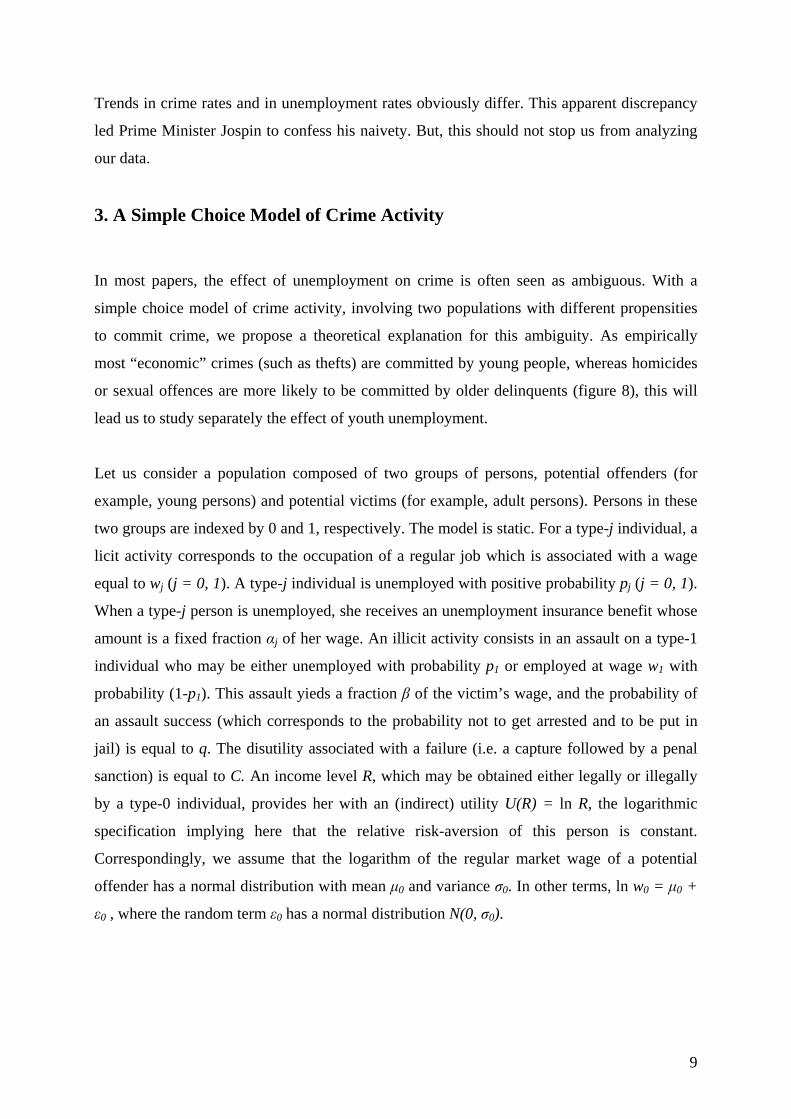
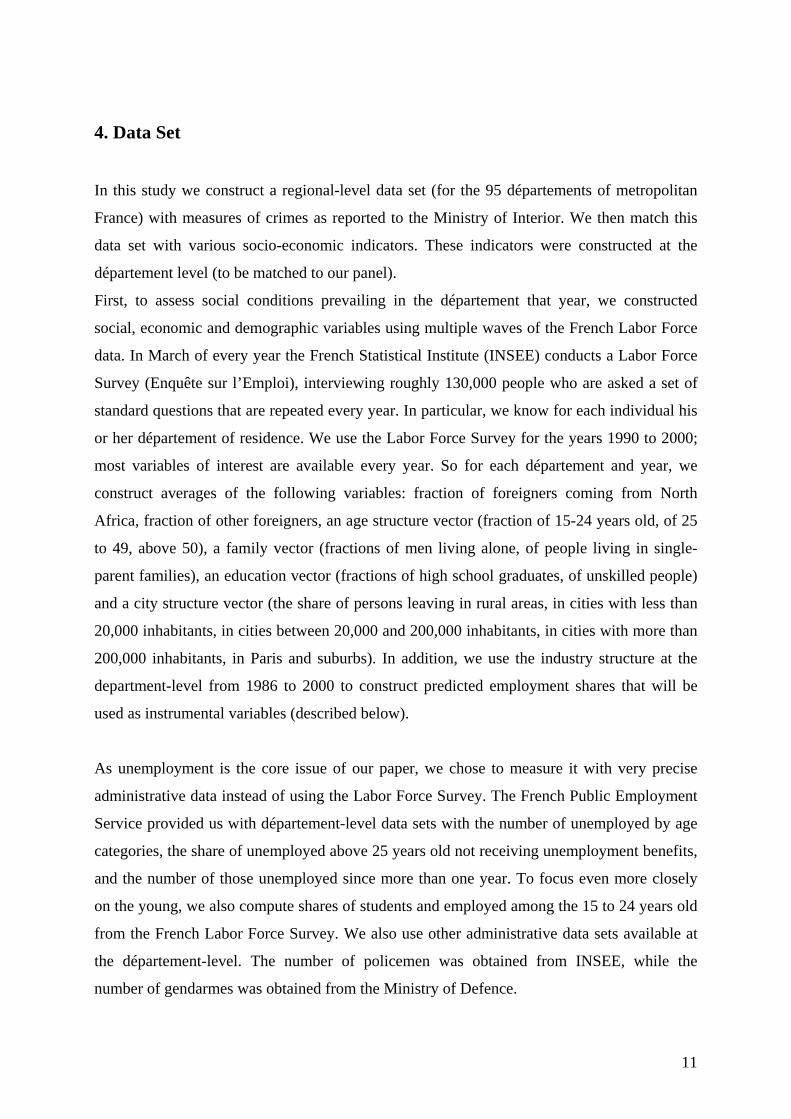
Administrative data are easier to use if reporting rates do not change over time. According to
Figure 4, these rates remained stable over the period 1996-2002. And the trends in
victimization rates (Figures 5 et 6) seem to fit the trends in administrative crime rates, even
though the categories in the two data sources are not exactly similar. According to the
victimization surveys, burglaries and car thefts declined by 30 percent between 1996 and
2002, while larcenies increased by 40 percent.
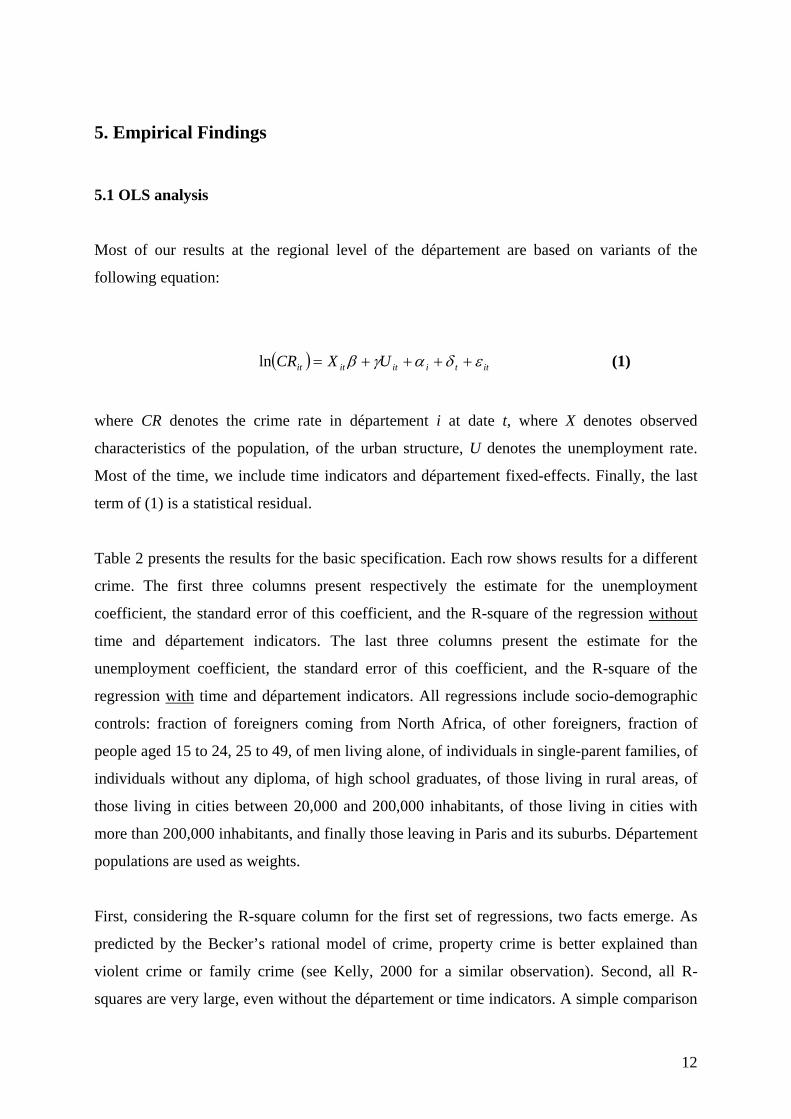
Finally, Figure 7 reports changes in the unemployment rates by age categories during the
1990s. A noticeable fact is the high youth unemployment rate in France, compared to similar
countries. During the years 1994-1997 it hits a peak (virtually 30 percent of the 15-24 years
old labor force was unemployed). After 1998 it declined (20 percent in 2002). Unemployment
rates for other age categories follow the same general trend but are considerably lower.
8
Trends in crime rates and in unemployment rates obviously differ. This apparent discrepancy
led Prime Minister Jospin to confess his naivety. But, this should not stop us from analyzing
our data.
3. A Simple Choice Model of Crime Activity
In most papers, the effect of unemployment on crime is often seen as ambiguous. With a
simple choice model of crime activity, involving two populations with different propensities
to commit crime, we propose a theoretical explanation for this ambiguity. As empirically
most “economic” crimes (such as thefts) are committed by young people, whereas homicides
or sexual offences are more likely to be committed by older delinquents (figure 8), this will
lead us to study separately the effect of youth unemployment.
Let us consider a population composed of two groups of persons, potential offenders (for
example, young persons) and potential victims (for example, adult persons). Persons in these
two groups are indexed by 0 and 1, respectively. The model is static. For a type-j individual, a
licit activity corresponds to the occupation of a regular job which is associated with a wage
equal to wj (j = 0, 1). A type-j individual is unemployed with positive probability pj (j = 0, 1).
When a type-j person is unemployed, she receives an unemployment insurance benefit whose
amount is a fixed fraction αj of her wage. An illicit activity consists in an assault on a type-1
individual who may be either unemployed with probability p1 or employed at wage w1 with
probability (1-p1). This assault yieds a fraction β of the victim’s wage, and the probability of
an assault success (which corresponds to the probability not to get arrested and to be put in
jail) is equal to q. The disutility associated with a failure (i.e. a capture followed by a penal
sanction) is equal to C. An income level R, which may be obtained either legally or illegally
by a type-0 individual, provides her with an (indirect) utility U(R) = ln R, the logarithmic
specification implying here that the relative risk-aversion of this person is constant.
Correspondingly, we assume that the logarithm of the regular market wage of a potential
offender has a normal distribution with mean μ0 and variance σ0. In other terms, ln w0 = μ0 +
ε0 , where the random term ε0 has a normal distribution N(0, σ0).
9

The expected utility associated with a licit activity for a type-0 individual is :
E0 = p0 U(α0 w0) + (1 - p0) U(w0) = ln w0 + p0 ln α0 = μ0 + ε0 + p0 ln α0 .
For the same person, the expected utility associated with an illicit activity is :
E1 = - qC + (1-q) [p1 U(β α1 w1) + (1 – p1) U(β w1)] = - qC + (1-q) [ln β + ln w1 + p1 ln α1].
A type-0 individual chooses an illicit activity if E1 > E0. The probability of this event is :
Pr[E1 > E0] = PI = Pr {ε0 < (1-q) [ln β + ln w1 + p1 ln α1] - μ0 - p0 ln α0 - qC }
= ⎟⎟⎠
⎞⎜⎜⎝
⎛ − − + + Φ
0
000111 ln - ]lnln[ln q)-(1σ
αμαβ qCppw
With this last formula, it is easy to check that :
a) 0ln - ]lnln[ln q)-(1ln
0
000111
0
0
0
>⎟⎟⎠
⎞⎜⎜⎝
⎛ − − + + −=
∂∂
σαμαβ
ϕσ
α qCppwpPI ,
b) 0ln - ]lnln[ln q)-(11
0
000111
00
<⎟⎟⎠
⎞⎜⎜⎝
⎛ − − + + −=
∂∂
σαμαβ
ϕσμ
qCppwPI ,
c) ,0ln - ]lnln[ln q)-(1ln)1(
0
000111
0
1
1
<⎟⎟⎠
⎞⎜⎜⎝
⎛ − − + + −=
∂∂
σαμαβ
ϕσ
α qCppwqpPI
d) ( ) 0ln - ]lnln[ln q)-(11
0
000111
011
>⎟⎟⎠
⎞⎜⎜⎝
⎛ − − + + −=
∂∂
σαμαβ
ϕσ
qCppww
qwPI .
In other terms, the probability for a type-0 individual (say, a young person) to choose an illicit
activity is, other things being equal, increasing with the youth unemployment rate and with
the wage level of type-1 individuals (say, adults). It decreases with the mean wage level
offered to young workers and with the unemployment rate of adult workers.
10
4. Data Set
In this study we construct a regional-level data set (for the 95 départements of metropolitan
France) with measures of crimes as reported to the Ministry of Interior. We then match this
data set with various socio-economic indicators. These indicators were constructed at the
département level (to be matched to our panel).
First, to assess social conditions prevailing in the département that year, we constructed
social, economic and demographic variables using multiple waves of the French Labor Force
data. In March of every year the French Statistical Institute (INSEE) conducts a Labor Force
Survey (Enquête sur l’Emploi), interviewing roughly 130,000 people who are asked a set of
standard questions that are repeated every year. In particular, we know for each individual his
or her département of residence. We use the Labor Force Survey for the years 1990 to 2000;
most variables of interest are available every year. So for each département and year, we
construct averages of the following variables: fraction of foreigners coming from North
Africa, fraction of other foreigners, an age structure vector (fraction of 15-24 years old, of 25
to 49, above 50), a family vector (fractions of men living alone, of people living in single-
parent families), an education vector (fractions of high school graduates, of unskilled people)
and a city structure vector (the share of persons leaving in rural areas, in cities with less than
20,000 inhabitants, in cities between 20,000 and 200,000 inhabitants, in cities with more than
200,000 inhabitants, in Paris and suburbs). In addition, we use the industry structure at the
department-level from 1986 to 2000 to construct predicted employment shares that will be
used as instrumental variables (described below).
As unemployment is the core issue of our paper, we chose to measure it with very precise
administrative data instead of using the Labor Force Survey. The French Public Employment
Service provided us with département-level data sets with the number of unemployed by age
categories, the share of unemployed above 25 years old not receiving unemployment benefits,
and the number of those unemployed since more than one year. To focus even more closely
on the young, we also compute shares of students and employed among the 15 to 24 years old
from the French Labor Force Survey. We also use other administrative data sets available at
the département-level. The number of policemen was obtained from INSEE, while the
number of gendarmes was obtained from the Ministry of Defence.
11
5. Empirical Findings
5.1 OLS analysis
Most of our results at the regional level of the département are based on variants of the
following equation:
( ) ittiititit UXCR εδαγβ ++++=ln (1)
where CR denotes the crime rate in département i at date t, where X denotes observed
characteristics of the population, of the urban structure, U denotes the unemployment rate.
Most of the time, we include time indicators and département fixed-effects. Finally, the last
term of (1) is a statistical residual.
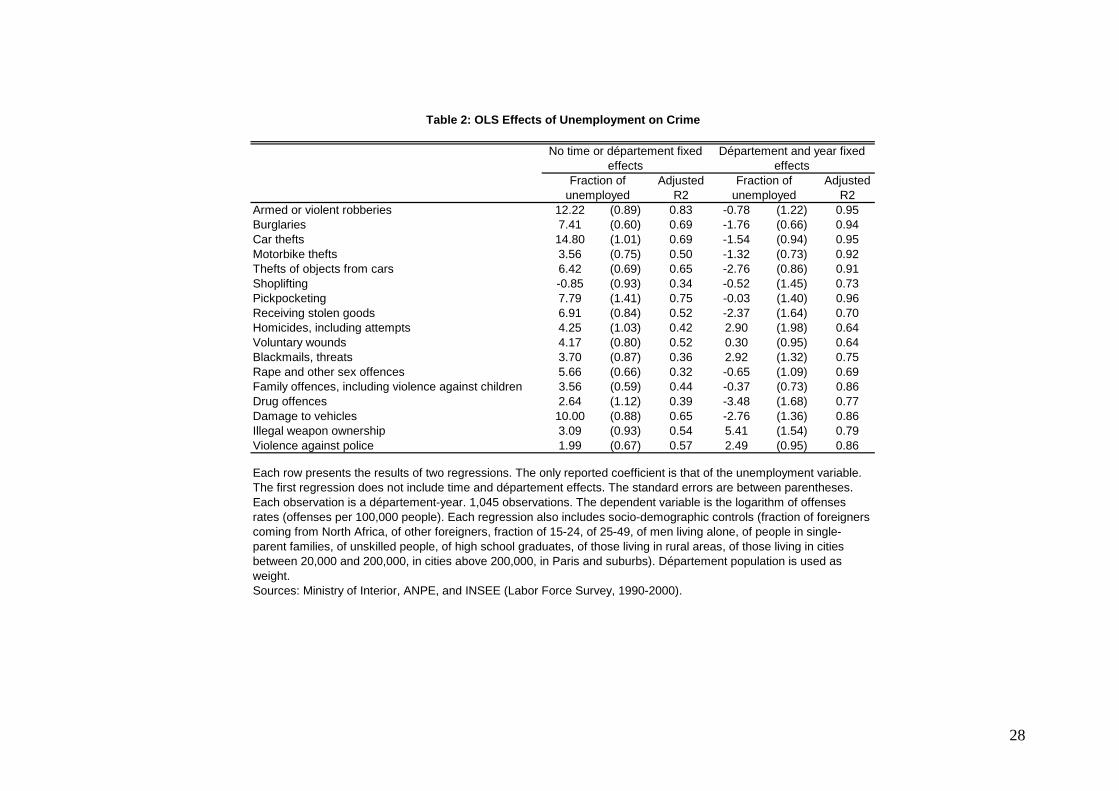
Table 2 presents the results for the basic specification. Each row shows results for a different
crime. The first three columns present respectively the estimate for the unemployment
coefficient, the standard error of this coefficient, and the R-square of the regression without
time and département indicators. The last three columns present the estimate for the
unemployment coefficient, the standard error of this coefficient, and the R-square of the
regression with time and département indicators. All regressions include socio-demographic
controls: fraction of foreigners coming from North Africa, of other foreigners, fraction of
people aged 15 to 24, 25 to 49, of men living alone, of individuals in single-parent families, of
individuals without any diploma, of high school graduates, of those living in rural areas, of
those living in cities between 20,000 and 200,000 inhabitants, of those living in cities with
more than 200,000 inhabitants, and finally those leaving in Paris and its suburbs. Département
populations are used as weights.
First, considering the R-square column for the first set of regressions, two facts emerge. As
predicted by the Becker’s rational model of crime, property crime is better explained than
violent crime or family crime (see Kelly, 2000 for a similar observation). Second, all R-
squares are very large, even without the département or time indicators. A simple comparison
12
with wage regressions, where R-squares are lower than 0.3 in the cross-section and, therefore,
observed characteristics appear to be less important than unobserved ones in wage analysis,
shows that observable characteristics of the regions matter for crime. Third, in the cross-
section, unemployment is positively associated to crime. A deeper statistical examination of
these results (not reported, but available from the authors) in association with the impact of
other variables on crime demonstrates that these cross-section results are entirely governed
by the opposition between rural and urban départements. Fourth, and in contrast to the third
point, unemployment is, in general, negatively associated to crime in the panel dimension.
This is most often true for property or, more generally, economic crimes (burglaries, most
thefts, or drug offences). Fifth, violent crimes (homicides, threats, violence against police
forces) appear to be positively associated to unemployment. Hence, if they are the driving
force of the insecurity feeling, Jospin was not totally wrong after all.
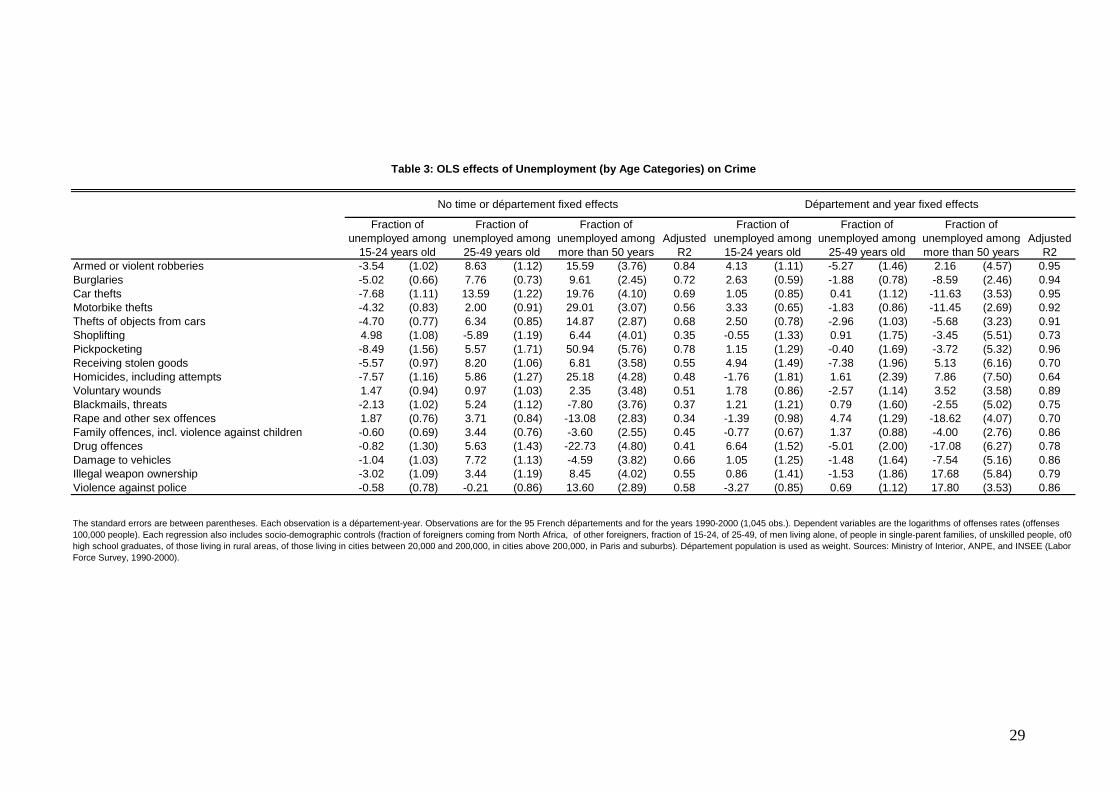
The following Tables are mere variations on this theme. Table 3 has the same structure as
Table 2 but contrasts unemployment by age categories. Focusing on the estimates with region
fixed effects, we see that youth unemployment has a positive impact on most crimes whereas
unemployment for the two other age categories have a negative impact on most crimes. This
set of results is much more in agreement with the popular view of crime, but also with a
simple choice model of crime activity (see Appendix B). Indeed, those categories of crime for
which the coefficient on youth unemployment is negative or not significantly different from
zero – car thefts, homicides, pick-pocketing, shoplifting, blackmail, rapes, family offences –
are clearly not youth-specific in contrast to, say, drug offences, motorbikes thefts, or
burglaries.
Table 4 goes a step further and tries to identify the effects of unemployment benefits on
crime. The structure of the Table is the following. Each row presents the results of two
regressions. First, to the unemployment structure by age, we add the fraction of workers
above 25 who are unemployed and do not receive unemployment benefits (specification (1)).
Second, to the unemployment structure by age, we add the fraction of workers above 25 who
are long-term unemployed (specification (2)). For this second regression, we only report the
coefficient on the long-term unemployed variable since all other coefficients are virtually
identical to those reported for specification (1). Results show that, indeed, not receiving UI
benefits appear to be positively associated to almost all economic crimes. These results stand
13
in stark contrast to those of specification (2) since there is no association between crime and
long-term unemployment.
Some institutional details are in order. First, most young workers are not eligible to
unemployment benefits. Second, a non-negligible fraction of workers above 25 are not
eligible to unemployment benefits, for instance because they did not work enough hours in
the preceding year or because they were previously self-employed. Third, a large fraction of
long-term unemployed receive UI benefits. In conclusion, the positive coefficients on youth
unemployment and on non-reception of benefits for workers above 25 are the two faces of the
same coin. Reception of benefits appears to decrease the incentives to commit economic
crimes, conditional of course on unemployment.
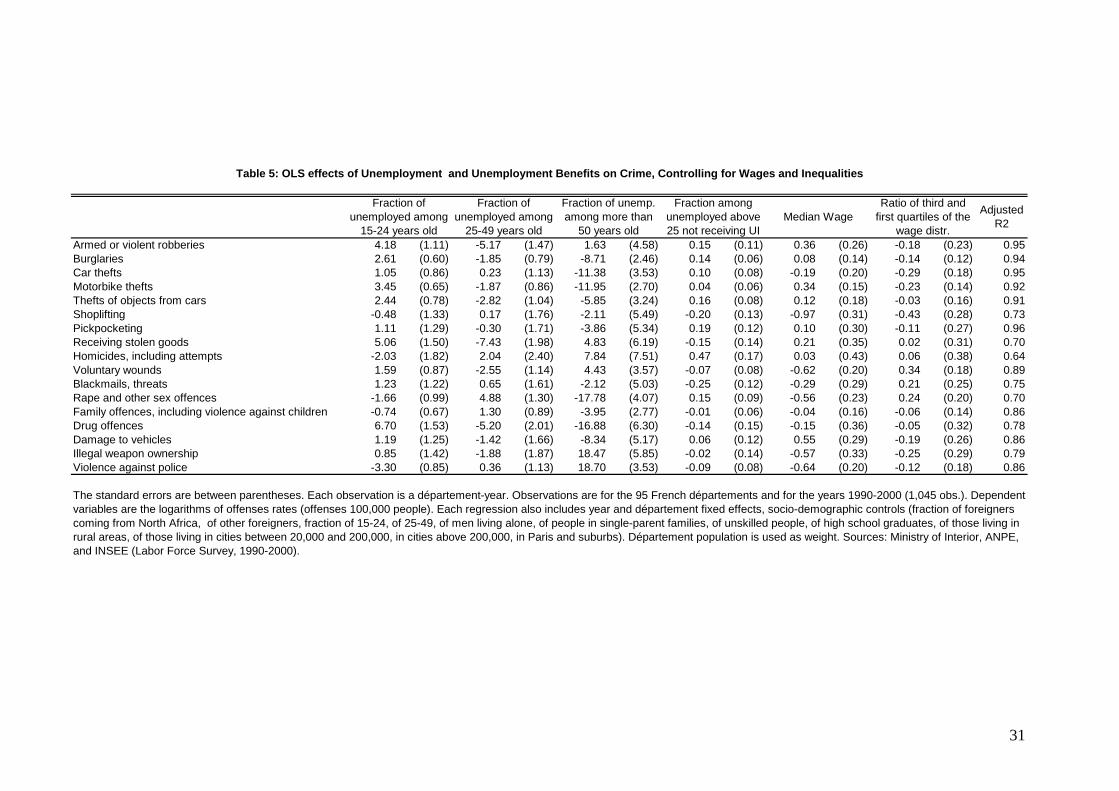
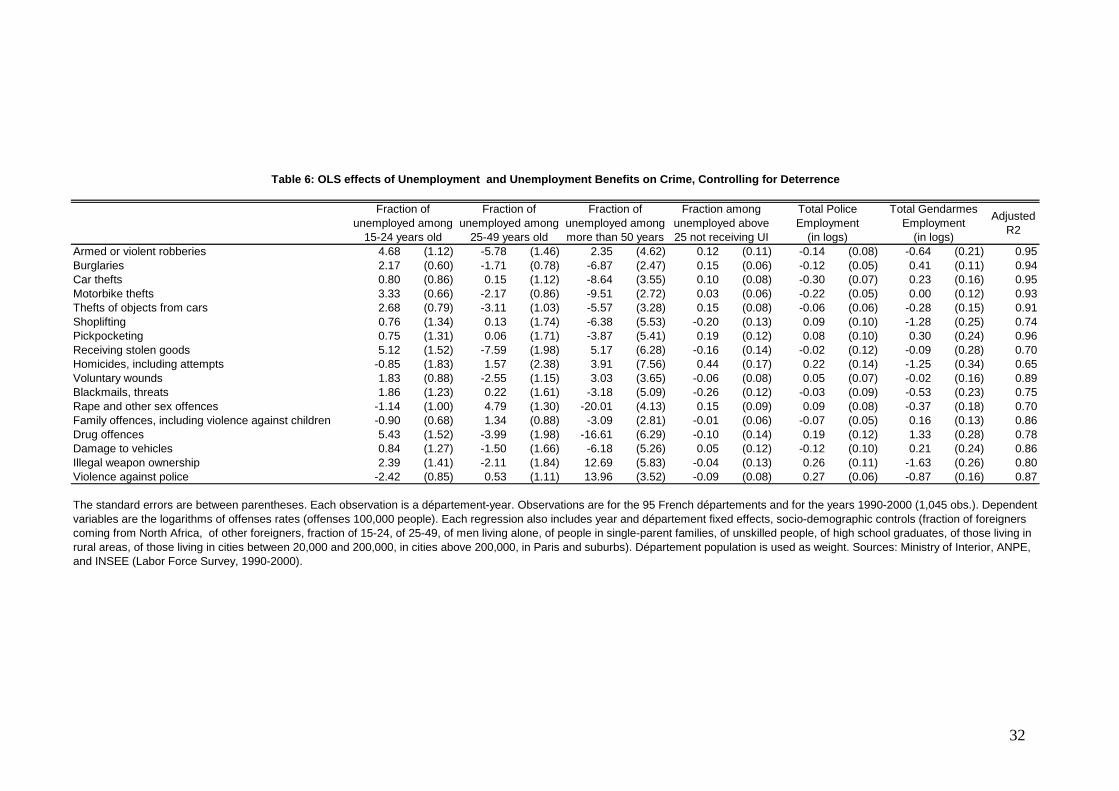
Tables 5 and 6 test the robustness of these results by including a measure of the median wage
and a measure of inequality (Q3/Q1 of the wage distribution) in the département (Table 5)
and the number of policemen and of gendarmes (same role as police, mostly in rural areas, the
gendarmes belong to the army in contrast to the police who is part of the Ministry of Interior).
In addition to confirming the robustness of our previous results, estimates presented in Table
5 show that there is no relation between wages and economic crime (even though there are
some evidence that sex offences tend to happen in poorer areas). Furthermore, there is no
relation between wage inequality and economic crime.2
Results shown in Table 6 are once again similar to those presented in the previous Tables.
The presence of police is negatively associated to robberies, burglaries, and thefts. By
contrast, the effect of gendarmes is less clear-cut; a potential reflection of the rural nature of
their tasks3.
2 In unreported results, inspired by Gould et al. (2002), we estimated similar regressions with the fraction of low-wage workers (among the young and the unskilled) as explanatory variables. None of these variables proved significantly different from zero. 3 We were able to check some of these results at the city-level and the individual level. The French Ministry of Defence provided us with an aggregate crime rate (restricted to burglaries, robberies, larcenies, and thefts) at the city-level (covering 90 percent of the 36,000 French cities, belonging mostly to rural and semi-urban areas, where gendarmes are in charge of security). We matched this data set with various socio-economic indicators. Most of these results have the same flavor as those shown previously for the département-level analysis, in the cross-section dimension. In particular, when looking at the unemployment variables, youth unemployment seems to have a negative impact on crime. These results in fact contrast small rural communes with larger semi-urban cities. We also performed a similar analysis -with similar results- at the individual level, using our victimization survey matched with various socio-economic indicators.
14

5.2 Correlations across crimes
A potential issue in our strategy is the following. We have examined crimes separately, one
by one. Obviously, some crimes are related. For instance, in a violent burglary, wounds can
also be inflicted to the victims. In addition, reporting strategies may vary. For instance, in
quiet areas, shoplifting will be systematically reported to the police and registered whereas in
more troubled places either shoplifting will not be systematically reported because it is too
frequent, or even when the victim tries to report it to the authorities, the police might not have
time to register the act. A first strategy to examine these problems is presented now. We
compute the correlations between our various measures of crime across regions. This
correlation Table, as well as those that follow, are given in the Appendix A. Results of Tables
A.1 and A.2 show that economic crimes are very highly correlated across the French
departments. Just note though that shoplifting is much less correlated to the rest of economic
crimes. Furthermore, family offences seem also to behave differently, a result that is not
surprising given that factors that affect this type of crime are obviously not governed by
Becker’s model of rational crime. An examination of Table A.3 that presents correlations
across growth rates for these same crimes confirms that economic crimes are very different
from the rest. A relatively large fraction of these correlations are positive and significant in
stark contrast with correlations between growth rates of other types of crimes. To understand
the nature of the links between these various crimes, we decomposed each crime as described
in equation (1). Then, we recuperate and estimate of iα for each crime. First, we correlate
these fixed effects across regions. Results are given in Table A.4. Most correlations are huge
(and positive). Once again, shoplifting, family offences and sex offences stand in sharp
contrast. Hence, the same unobserved fixed components explain the various crimes. The next
stage is to understand the nature of these fixed components. Do they mostly pertain to
observable characteristics of the département or to unobservables ? To examine this question,
we first estimate the following equation:
iii x υδα +=ˆ
where the fixed effect for each crime is regressed on the same set of time-invariant variables
(basically, the average of our variables from equation (1)). We do not report the R-square of
these regressions but they are very large, between 0.6 and 0.9. Hence, observed factors
explain a large fraction of the fixed effects. Then, we take the estimated iυ ’s and correlate
them across crimes. The results are given in Table A.5. Once again, correlations are virtually
15

all significant, positive, and very large. Structural factors, some being associated to
oppositions such as rural versus urban environments, explain the level of crime, irrespective
of its type and nature.
5.3 A causal approach
Up to this point, we adopted a descriptive viewpoint. But, we obviously need to use a more
causal approach. The basic problem is the following. Unemployment can be endogenous in a
crime regression. Gould et al. (2002) presents the reason very clearly. If crime in a region
induces firms to stop investing or even to start relocating their activities in less crime-prone
regions, then unemployment and crime will be positively correlated because crime causes
unemployment and not the reverse. The strategy that is usually applied, instrumental variables
techniques, will also be applied in the following paragraphs.
Our set of instruments is directly inspired by Gould et al. (2002).4 In their paper, these authors
used the predicted industrial structure to instrument unemployment since those predictions,
made at the beginning of the period, were obviously based on purely economic reasons with
no room for crime considerations. Following them, we use as instrumental variables the
components of the (predicted) change in demographic group g’s share of employment
between date 0 and date t (t = 1, …,T) in département d. We consider three demographic
groups (g = 1, 2, 3) based on age (15-24, 25-49 and more than 50 years old). The change in
demographic group g’s share of employment between date 0 and date t in département d can
be decomposed as follows:
( ) ( )idgdtigi dtididtii idgdgdtg ffffffff 0000 −+−=− ∑∑ (2)
where:
• fg| dti (respectively, fg| d0i ) denotes the demographic group g’s share of the employment
in industry i at time t (respectively, at time 0) in département d,
• fg| dt (respectively, fg| d0 ) denotes the demographic group g’s share of the employment
at time t (respectively, at time 0) in département d,
4 See also Blanchard and Katz (1992).
16

• fi| dt (respectively, fi| d0 ) denotes industry i’s share of the employment at time t
(respectively, at time 0) in département d.
The first term on the r.h.s. of equation (2), called GROWg, represents the effects of industry
growth rates, while the second term, called TECHg, reflects changes in each group’s share of
employment within industries. Following Gould et al. (2002), in estimating each term, we
replace the département-specific employment shares fg| dti and fg| d0i with national employment
shares fg| ti and fg| 0i. We also replace the actual end of period shares fi| dt with estimates dtif̂
defined as:
0
ˆi
tidoidti f
fff =
Our set of instruments includes the predicted effects of industry growth rates GROWg and
their squares, for g = 1, 2 (it is easy to verify that Sg GROWg = 0, which implies that one
element in the vector of instruments GROWg has to be excluded from the list of regressors in
the instrumental regression). Values of theses 4 instruments are obtained from the French
annual Labor Force Surveys collected by INSEE (Paris) between 1989 (t = 0) and 2000 (t =
T).
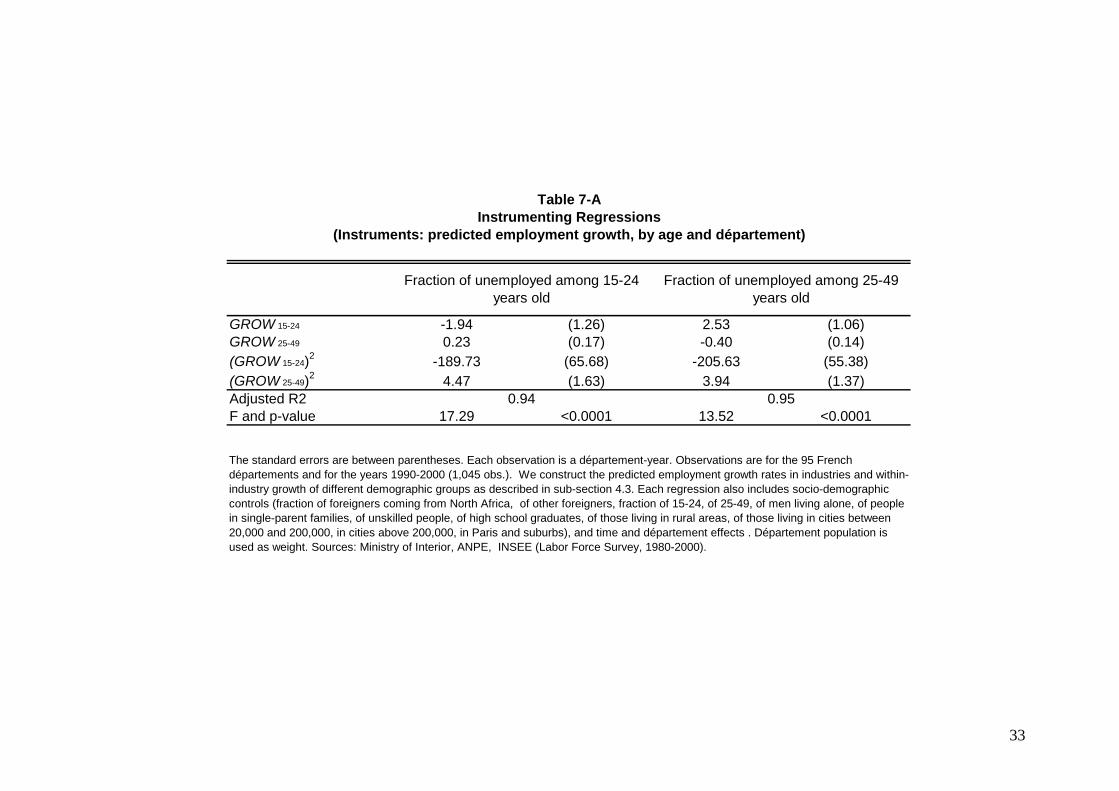
Results of these instrumenting regressions for two sets of instruments are presented in Tables
7A and 7B. All our measures of unemployment are well correlated to the instruments (see the
F-statistics). Gould et al. (2002) justify their instruments, in particular the within-industry
growth rates of employment shares in the 4 demographic groups, by appealing to biased
technical change. However, unreported results (available from the authors) show that the
within industry growth rates (the TECH variables) do not seem to have a good predictive
power, in contrast to the between-industry growth rates (the GROW variables). This is
reminiscent of previous results on France showing that biased technical change appears less
biased in France than in the United States (see Goux and Maurin, 2000 and Card, Kramarz,
and Lemieux, 1999). To summarize, our first-stage results are quite satisfactory for our main
variables of interest, the unemployment rates, when using predicted industry growth, by
demographic or education group (with slightly larger F-statistics for instruments based on
age).
17
Tables 8A to 8B presents the IV results for our two sets of instruments. These Tables have the
same format as those previously discussed. Sargan’s tests of the validity of the instruments
are reported in the last two columns. Most test statistics support their (statistical) quality, in
particular the instruments are deemed satisfactory in all crimes but four: motorbike thefts,
homicides for both instruments, voluntary wounds, violence against police, blackmails, and
illegal weapon ownership for one of the two. Hence, for only two crimes our IV estimates are
not statistically reliable. These IV results confirm previous estimates. Youth unemployment
has a clear (positive) effect on most economic crimes: robberies, burglaries, car thefts, thefts
from cars, pick-pocketing, drug offences, damage to vehicles. The effects are often extremely
large and significant. In addition, in unreported results (available again from the authors), it is
only youth unemployment that positively affects crime; the fraction of students or the fraction
of employed among the 15-24 years old has a statistically insignificant effect on crime (most
often with negative signs, as expected). Therefore, the culprit is indeed youth unemployment
which causes economic crimes. Finally, results in Table 8B (less so in Table 8A) show that
the fraction of unemployed workers among the 25 to 49 years old has a strong negative, most
often statistically significant, impact on crime (this variable is also instrumented, see Tables
7A and 7B). If criminals are mostly found among the young, their targets appear to be the
employed individuals. Hence, an increase in unemployment among the targets may cause a
decrease in opportunities of profitable crime.
To summarize these last results, youth unemployment has a positive and robust causal effect
on most property crimes – robberies, burglaries, car thefts,… – and on drug offences when
other types of violent crimes, such as rapes or homicides, appear to be unrelated to labor
market conditions, in agreement with the Becker model of crime.
6. Conclusion
Our results demonstrate that most of the variation in criminality is between regions. They also
show that the main reason for this is the opposition between mostly rural regions and mostly
urban départements. Are such results a sound basis for a public policy trying to reduce
crime ? One possibility is to follow Alphonse Allais who suggested 100 years ago to relocate
cities in the countryside (“mettre les villes à la campagne”). Fortunately, there is also
18
variation within departments. In particular, our IV results suggest potential public policies
against crime. Fighting youth unemployment should indeed help decreasing property crimes
and drug offences. However, some other economic or violent crimes appear to be unrelated to
labor market conditions as measured by unemployment. We have also reported evidence that
it is indeed unemployment among the young, and not the young per se, that causes crime. To
attract the young away from crime, there are multiple potential routes. Education is an
obvious one. More specifically, education has to pay, either directly or indirectly. For the
direct component, two ideas can be mentioned. First, apprentices receive – by law – miserable
pay when doing their apprenticeship, which may explain that they are often used as cheap
labor by firms without being effectively trained (see Fougère and Schwerdt, 2002). Second,
experiments in Israel show that large bonuses targeted to the poor that are paid when the child
succeeds at school seem to work (see for instance Angrist and Lavy, 2001). The indirect route
is obviously longer investments in schooling with deferred compensations large enough to
make the investment valuable. This is not an easy route in France where returns to a
university education have decreased in the last 10 years (see Kramarz, Lemieux, Margolis,
2002).
19

References Angrist, Joshua D. and Victor Lavy (2001), “Does Teacher Training Affect Pupil Learning? Evidence from Matched Comparisons in Jerusalem Public Schools”, Journal Of Labor Economics, Vol. 19, pp. 343-369 Becker, Gary S. (1968), “Crime and Punishment: An Economic Approach”, Journal of Political Economy, Vol. 76, pp. 169-217. Blanchard, Olivier and Larry Katz (1992), “Regional Evolutions,” Brookings Papers on Economic Activity, 1, pp. 1-75. Bogess, Scott and John Bound (1993), “Did Criminal Activity Increase During the 1980s? Comparisons Across Data Sources”, National Bureau of Economic Research Working Paper no. 4431, Cambridge MA. Bowles, Samuel and Arjun Jayadev (2005), “Guard Labor”, Santa Fe Institute Working Paper, forthcoming in Journal of Development Economics. Cantor, David and Kenneth C. Land (1985), “Unemployment and Crime Rates in the post-World-War II United States: A Theoretical and Empirical Analysis”, American Sociological Review, Vol. 50, pp. 317-323. Card, David, Francis Kramarz and Thomas Lemieux (1999), “Changes in the Relative Structure of Wages and Employment: A Comparison of the United States, Canada and France,” Canadian Journal of Economics, Vol. 32(4), pp. 843-877. Chiricos, Theodore (1987), “Rates of Crime and Unemployment: An analysis of Aggregate Research Evidence”, Social Problems, Vol. 34, pp. 187-211. Entorf, Horst and Hannes Spengler (2000), “Socio-economic and Demographic Factors of Crime in Germany: Evidence from Panel Data of the German States”, International Review of Law and Economics, Vol. 20, pp. 75-106. Entorf, Horst and Hannes Spengler (2002), Crime in Europe: Causes and Consequences, Springer, Berlin. Ehrlich, Issac (1973), “Participation in Illegitimate Activities: A Theoretical and Empirical Investigation”, Journal of Political Economy, Vol. 81(3), pp. 521-65. Ehrlich, Issac (1996), “Crime, Punishment, and the Market for Offences”, Journal of Economic Perspectives, Vol. 10(1), pp. 43-67. Fajnzylber, Pablo, Lederman, Daniel and Norman Loayza (2002), “What Causes Violent Crime?”, European Economic Review, Vol. 46, pp. 1323-1357. Fougère, Denis and Wolfgang Schwerdt (2002), “Are Apprentices Productive?”, Konjonkturpolitik-Applied Economics Quarterly, Vol. 48, pp. 317-346.
20
Freeman, Richard B. (1983), “Crime and Unemployment”, in: James Q. Wilson, ed., Crime and Public Policy, Institute for Contemporary Studies Press, San Francisco, CA. Freeman, Richard B. (1994), “Crime and the Labor Market”, in: James Q. Wilson and Joan Petersilia, ed., Crime, Institute for Contemporary Studies Press, San Francisco, CA. Freeman, Richard B. (1996), “Why Do So Many Young American Men Commit Crimes and What Might We Do About It?”, Journal of Economic Perspectives, Vol 10(1), pp. 25-42. Freeman, Richard B. (1999), “The Economics of Crime”, in: Orley Ashenfelter and David Card, eds., Handbook of Labor Economics, Vol. 3C, chapter 52, North Holland Publishers, Amsterdam. Glaeser, Edward L., Sacerdote, Bruce and José A. Sheinkman (1996), “Crime and Social Interactions”, Quarterly Journal of Economics, Vol. 111, pp. 507-548. Glaeser, Edward L. and Bruce Sacerdote (1999), “Why Is There More Crime in Cities?”, Journal of Political Economy, Vol. 107, pp. S225-S258. Gould, Eric, Bruce Weinberg and David B. Mustard (2002), “Crime Rates and Local Labor Market Opportunities in the United States: 1977-1997,” Review of Economics and Statistics, Vol. 84(1), pp. 45-61 Goux, Dominique and Eric Maurin (2000), “The Decline in Demand for Unskilled Labour: An Empirical Method and its Application to France”, The Review of Economics and Statistics, Vol. 82(4), pp. 596-607. Grogger, Jeffrey (1992), “Arrests, Persistent Youth Joblessness, and Black-White Employment Differentials”, Review of Economics and Statistics, Vol. 74, pp. 100-106. Grogger, Jeffrey (1998), “Market Wages and Youth Crime”, Journal of Labor Economics, Vol. 16(4), pp. 756-791. Imai, Susumu and Kala Krihna (2004), “Employment, Dynamic Deterrence and Crime”, International Economic Review, Vol. 45(3), pp. 845-872. Kelly, Morgan (2000), “Inequality and Crime”, The Review of Economics and Statistics, Vol. 82(4), pp. 530-539. Kostela, Erkki and Matti Virén (1997), “An Occupational Choice Model of Crime Switching”, Applied Economics, Vol. 29, pp. 655-660. Kramarz, Francis, Thomas Lemieux and David N. Margolis (2002), “Returns to education in France and in the US”, mimeo. Levitt, Steven D. (1997), “Using Electoral Cycles in Police Hiring to Estimate the Effect of Police on Crime”, American Economic Review, Vol. 87(3), pp. 270-90. Levitt, Steven D. (1999), “The Changing Relationship between Income and Crime Victimization”, Federal Reserve Bank of New York Policy Review, Vol. 5(3), pp. 87-98.
21

Levitt, Steven D. and Lance Lochner (2001), “The Determinants of Juvenile Crime”, in: Jonathan Gruber, ed., NBER volume on Risky Behavior by Youths: An Economic Analysis, The University of Chicago Press, Chicago, pp. 327-373. Machin, Stephen and Costas Meghir (2004), “Crime and Economic Incentives”, Journal of Human Resources, Vol. 39(4), pp. 958-979. Imrohoroglu, Ayse, Antonio Merlo and Peter Rupert (2000), “On the Political Economy of Redistribution and Crime”, International Economic Review, Vol. 41, pp. 1-25. Papps, Kerry and Rainer Winkelmann (2000), “Unemployment and Crime: New Answers to an Old Question”, New Zealand Economic Papers, Vol. 34(2), pp. 53-72. Myers, Samuel L. (1983), “Estimating the Economic Model of Crime : Employment versus Punishment Effects”, The Quarterly Journal of Economics, Vol. 98(1), pp. 157-166. Witte, Ann. D. (1980) “Estimating the Economic Model of Crime with Individual Data”, The Quarterly Journal of Economics, Vol. 94(1), pp. 57-84. Witte, Ann. D and Helen Tauchen (1994) “ Work and Crime: An Exploration Using Panel Data”, Public Finance, Vol. 49, pp. 155-167. Raphael, Stephen and Rudolf Winter-Ebmer (2001), “Identifying the Effect of Unemployment on Crime”, Journal of Law and Economics, Vol. 44, pp. 259-283. Roché, Sebastian (2001), La Délinquance des jeunes : Les 13-19 ans racontent leurs délits, Le Seuil, Paris. Thornberry, Terence, and R.L. Christenson. (1984), “Unemployment and Criminal Involvement: An investigation of Reciprocal Causal Structures”, American Sociological Review, Vol. 56, pp.609-627.
22

Figures
Figure 1: Property Crimes Rates 1990-2000 (reference 1990 = 100)
60
80
100
120
140
160
180
1990 1992 1994 1996 1998 2000
Armed or violent robberies
Burglaries
Car thefts
Motorbike thefts
Thefts of objects from cars
Shoplifting
Pickpocketing
Receiving stolen goods
Source: Ministry of Interior
Figure 2: Violent Crimes Rates 1990-2000 (reference 1990 = 100)
50
100
150
200
250
300
1990 1992 1994 1996 1998 2000
Homicides, including attempts
Voluntary w ounds
Blackmails, threats
Rape and other sex offences
Family offences, includingviolence against children
Source: Ministry of Interior
23
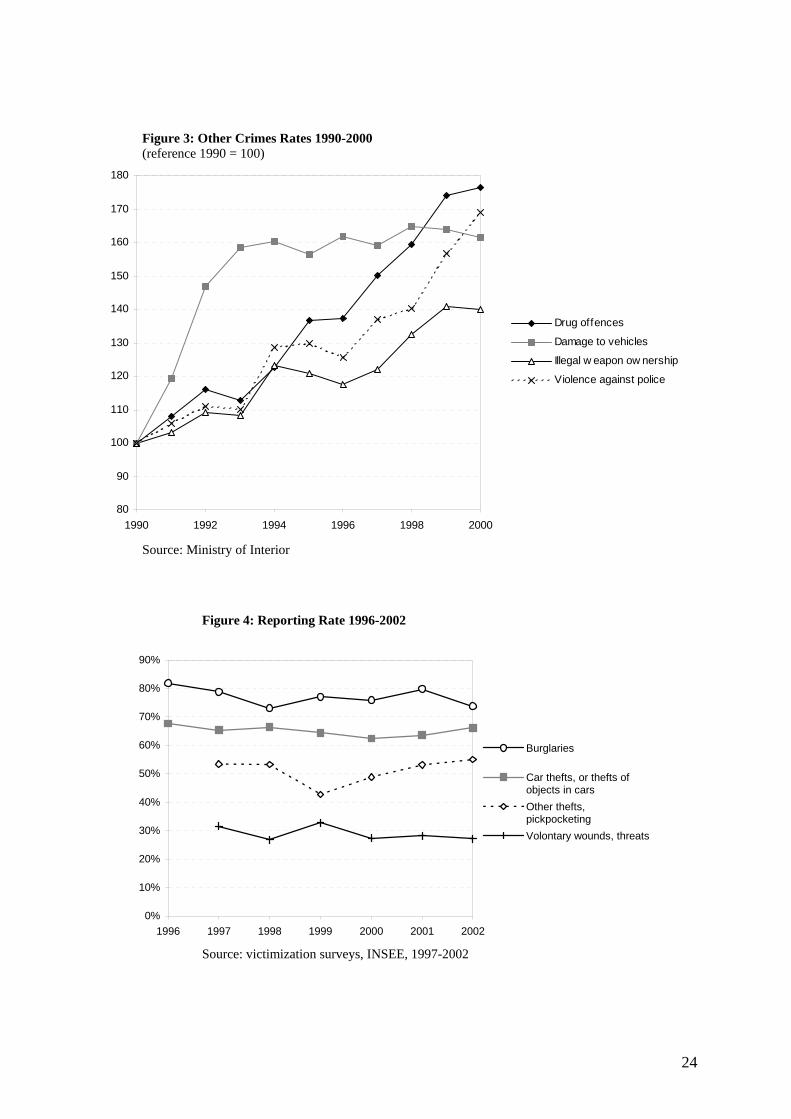
Figure 3: Other Crimes Rates 1990-2000 (reference 1990 = 100)
80
90
100
110
120
130
140
150
160
170
180
1990 1992 1994 1996 1998 2000
Drug offences
Damage to vehicles
Illegal w eapon ow nership
Violence against police
Source: Ministry of Interior
Figure 4: Reporting Rate 1996-2002
0%
10%
20%
30%
40%
50%
60%
70%
80%
90%
1996 1997 1998 1999 2000 2001 2002
Burglaries
Car thefts, or thefts ofobjects in carsOther thefts,pickpocketingVolontary wounds, threats
Source: victimization surveys, INSEE, 1997-2002
24

Figure 5: Victimization Rate 1996-2002 (household level; reference 1996 = 100)
50
60
70
80
90
100
110
1996 1998 2000 2002
Burglaries
Car thefts, or thefts of objects incars
Source: victimization surveys, INSEE, 1996-2002
Figure 6: Victimization Rate 1997-2002 (individual level, reference 1997 = 100)
50
60
70
80
90
100
110
120
130
140
150
1997 1999 2001
Other thefts, pickpocketingVolontary wounds, threatsFeeling insecure at home
Source: victimization surveys, INSEE, 1997-2002
25
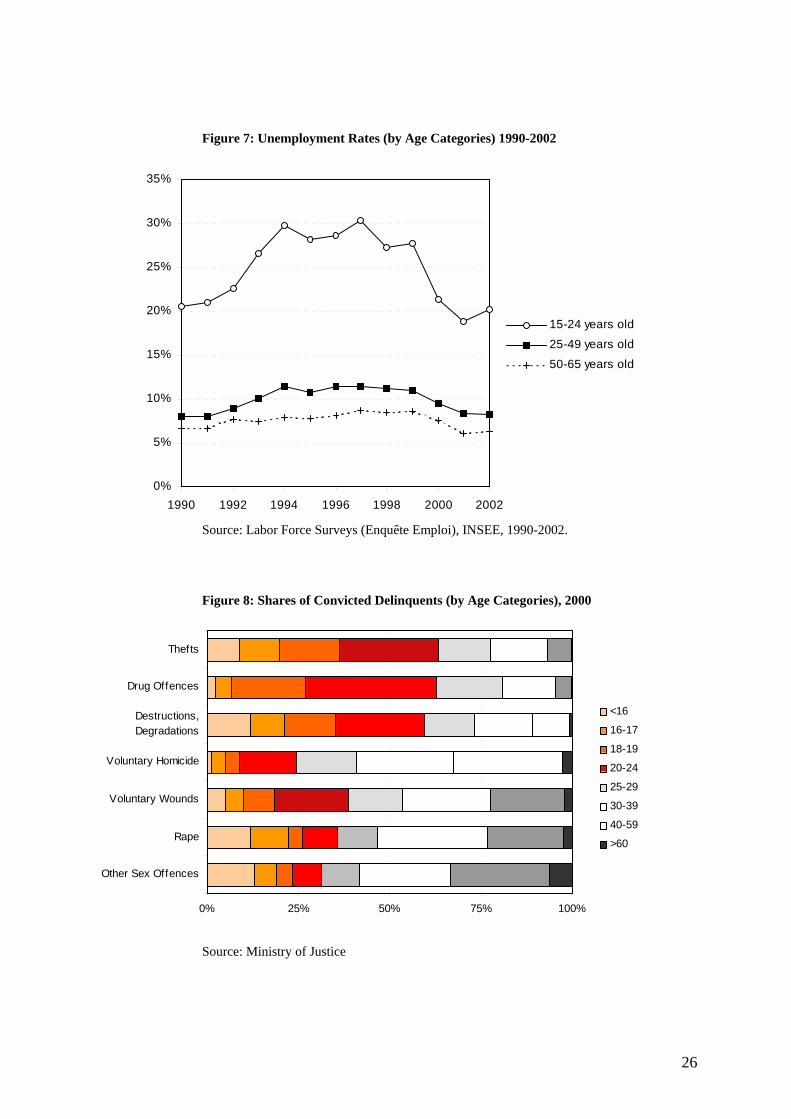
Figure 7: Unemployment Rates (by Age Categories) 1990-2002
0%
5%
10%
15%
20%
25%
30%
35%
1990 1992 1994 1996 1998 2000 2002
15-24 years old
25-49 years old
50-65 years old
Source: Labor Force Surveys (Enquête Emploi), INSEE, 1990-2002.
Figure 8: Shares of Convicted Delinquents (by Age Categories), 2000
0% 25% 50% 75% 100%
Other Sex Offences
Rape
Voluntary Wounds
Voluntary Homicide
Destructions,Degradations
Drug Offences
Thefts
<16
16-17
18-19
20-24
25-29
30-39
40-59
>60
Source: Ministry of Justice
26

Tables
Crime Rate Coeff. Coeff. of Variation of Variation
Property CrimesArmed or violent robberies 107.5 100.4 0.93 186.8 193,0 1.03Burglaries 712.5 384.9 0.54 656.5 232.6 0.35Car thefts 519.9 343.7 0.66 515.1 290.0 0.56Motorbike thefts 246.6 132.2 0.54 167.5 76.3 0.46Thefts of objects from cars 1355.1 658.5 0.49 1140.7 450.1 0.39Shoplifting 112.9 58.5 0.52 97.7 37.7 0.39Pickpocketing 193.6 334.6 1.73 171.4 270.3 1.58Receiving stolen goods 54.5 27.1 0.50 55.3 26.8 0.48Violent CrimesHomicides, including attempts 4.5 2.4 0.54 3.7 2.0 0.54Voluntary wounds 90.3 55.3 0.61 181.2 65.2 0.36Blackmails, threats 55.2 16.4 0.30 82.7 35.1 0.42Rape and other sex offences 39.3 16.8 0.43 57.0 12.5 0.22Family offences, incl. violence against children 52.0 14.6 0.28 72.0 18.6 0.26Other CrimesDrug offences 99.9 76.7 0.77 176.2 64.1 0.36Damage to vehicles 296.8 164.0 0.55 479.0 212.4 0.44Illegal weapon ownership 26.6 14.8 0.55 37.3 24.1 0.65Violence against police 39.4 12.7 0.32 66.6 33.8 0.51
Source: Ministry of Interior. Crimes rates are offences per 100,000 people.The département population means were used as weights (there are 95 départements in France)
1990 2000
Table 1: Development of Selected Offences in France (1990-2000)
Mean Std-error Mean Std-error
27
Armed or violent robberies 12.22 (0.89) 0.83 -0.78 (1.22) 0.95Burglaries 7.41 (0.60) 0.69 -1.76 (0.66) 0.94Car thefts 14.80 (1.01) 0.69 -1.54 (0.94) 0.95Motorbike thefts 3.56 (0.75) 0.50 -1.32 (0.73) 0.92Thefts of objects from cars 6.42 (0.69) 0.65 -2.76 (0.86) 0.91Shoplifting -0.85 (0.93) 0.34 -0.52 (1.45) 0.73Pickpocketing 7.79 (1.41) 0.75 -0.03 (1.40) 0.96Receiving stolen goods 6.91 (0.84) 0.52 -2.37 (1.64) 0.70Homicides, including attempts 4.25 (1.03) 0.42 2.90 (1.98) 0.64Voluntary wounds 4.17 (0.80) 0.52 0.30 (0.95) 0.64Blackmails, threats 3.70 (0.87) 0.36 2.92 (1.32) 0.75Rape and other sex offences 5.66 (0.66) 0.32 -0.65 (1.09) 0.69Family offences, including violence against children 3.56 (0.59) 0.44 -0.37 (0.73) 0.86Drug offences 2.64 (1.12) 0.39 -3.48 (1.68) 0.77Damage to vehicles 10.00 (0.88) 0.65 -2.76 (1.36) 0.86Illegal weapon ownership 3.09 (0.93) 0.54 5.41 (1.54) 0.79Violence against police 1.99 (0.67) 0.57 2.49 (0.95) 0.86
Table 2: OLS Effects of Unemployment on Crime
No time or département fixed effects
Département and year fixed effects
Fraction of unemployed
Adjusted R2
Fraction of unemployed
Adjusted R2
Each row presents the results of two regressions. The only reported coefficient is that of the unemployment variable. The first regression does not include time and département effects. The standard errors are between parentheses. Each observation is a département-year. 1,045 observations. The dependent variable is the logarithm of offenses rates (offenses per 100,000 people). Each regression also includes socio-demographic controls (fraction of foreigners coming from North Africa, of other foreigners, fraction of 15-24, of 25-49, of men living alone, of people in single-parent families, of unskilled people, of high school graduates, of those living in rural areas, of those living in cities between 20,000 and 200,000, in cities above 200,000, in Paris and suburbs). Département population is used as weight. Sources: Ministry of Interior, ANPE, and INSEE (Labor Force Survey, 1990-2000).
28
Armed or violent robberies -3.54 (1.02) 8.63 (1.12) 15.59 (3.76) 0.84 4.13 (1.11) -5.27 (1.46) 2.16 (4.57) 0.95Burglaries -5.02 (0.66) 7.76 (0.73) 9.61 (2.45) 0.72 2.63 (0.59) -1.88 (0.78) -8.59 (2.46) 0.94Car thefts -7.68 (1.11) 13.59 (1.22) 19.76 (4.10) 0.69 1.05 (0.85) 0.41 (1.12) -11.63 (3.53) 0.95Motorbike thefts -4.32 (0.83) 2.00 (0.91) 29.01 (3.07) 0.56 3.33 (0.65) -1.83 (0.86) -11.45 (2.69) 0.92Thefts of objects from cars -4.70 (0.77) 6.34 (0.85) 14.87 (2.87) 0.68 2.50 (0.78) -2.96 (1.03) -5.68 (3.23) 0.91Shoplifting 4.98 (1.08) -5.89 (1.19) 6.44 (4.01) 0.35 -0.55 (1.33) 0.91 (1.75) -3.45 (5.51) 0.73Pickpocketing -8.49 (1.56) 5.57 (1.71) 50.94 (5.76) 0.78 1.15 (1.29) -0.40 (1.69) -3.72 (5.32) 0.96Receiving stolen goods -5.57 (0.97) 8.20 (1.06) 6.81 (3.58) 0.55 4.94 (1.49) -7.38 (1.96) 5.13 (6.16) 0.70Homicides, including attempts -7.57 (1.16) 5.86 (1.27) 25.18 (4.28) 0.48 -1.76 (1.81) 1.61 (2.39) 7.86 (7.50) 0.64Voluntary wounds 1.47 (0.94) 0.97 (1.03) 2.35 (3.48) 0.51 1.78 (0.86) -2.57 (1.14) 3.52 (3.58) 0.89Blackmails, threats -2.13 (1.02) 5.24 (1.12) -7.80 (3.76) 0.37 1.21 (1.21) 0.79 (1.60) -2.55 (5.02) 0.75Rape and other sex offences 1.87 (0.76) 3.71 (0.84) -13.08 (2.83) 0.34 -1.39 (0.98) 4.74 (1.29) -18.62 (4.07) 0.70Family offences, incl. violence against children -0.60 (0.69) 3.44 (0.76) -3.60 (2.55) 0.45 -0.77 (0.67) 1.37 (0.88) -4.00 (2.76) 0.86Drug offences -0.82 (1.30) 5.63 (1.43) -22.73 (4.80) 0.41 6.64 (1.52) -5.01 (2.00) -17.08 (6.27) 0.78Damage to vehicles -1.04 (1.03) 7.72 (1.13) -4.59 (3.82) 0.66 1.05 (1.25) -1.48 (1.64) -7.54 (5.16) 0.86Illegal weapon ownership -3.02 (1.09) 3.44 (1.19) 8.45 (4.02) 0.55 0.86 (1.41) -1.53 (1.86) 17.68 (5.84) 0.79Violence against police -0.58 (0.78) -0.21 (0.86) 13.60 (2.89) 0.58 -3.27 (0.85) 0.69 (1.12) 17.80 (3.53) 0.86
Table 3: OLS effects of Unemployment (by Age Categories) on Crime
Adjusted R2
The standard errors are between parentheses. Each observation is a département-year. Observations are for the 95 French départements and for the years 1990-2000 (1,045 obs.). Dependent variables are the logarithms of offenses rates (offenses 100,000 people). Each regression also includes socio-demographic controls (fraction of foreigners coming from North Africa, of other foreigners, fraction of 15-24, of 25-49, of men living alone, of people in single-parent families, of unskilled people, of0high school graduates, of those living in rural areas, of those living in cities between 20,000 and 200,000, in cities above 200,000, in Paris and suburbs). Département population is used as weight. Sources: Ministry of Interior, ANPE, and INSEE (Labor Force Survey, 1990-2000).
No time or département fixed effects Département and year fixed effects
Fraction of unemployed among
15-24 years old
Fraction of unemployed among
25-49 years old
Fraction of unemployed among more than 50 years
Adjusted R2
Fraction of unemployed among
15-24 years old
Fraction of unemployed among
25-49 years old
Fraction of unemployed among more than 50 years
29

Armed or violent robberies 4.05 (1.11) -5.16 (1.46) 2.16 (4.57) 0.14 (0.11) 0.07 (0.10)Burglaries 2.55 (0.59) -1.77 (0.78) -8.59 (2.45) 0.14 (0.06) -0.14 (0.05)Car thefts 0.99 (0.85) 0.49 (1.12) -11.63 (3.53) 0.10 (0.08) -0.15 (0.08)Motorbike thefts 3.31 (0.65) -1.81 (0.86) -11.45 (2.69) 0.03 (0.06) -0.12 (0.06)Thefts of objects from cars 2.41 (0.78) -2.83 (1.03) -5.68 (3.23) 0.16 (0.08) -0.20 (0.07)Shoplifting -0.45 (1.33) 0.77 (1.76) -3.46 (5.51) -0.17 (0.13) 0.11 (0.12)Pickpocketing 1.05 (1.29) -0.25 (1.69) -3.71 (5.31) 0.18 (0.12) -0.02 (0.11)Receiving stolen goods 5.03 (1.49) -7.50 (1.97) 5.12 (6.16) -0.16 (0.14) 0.18 (0.13)Homicides, including attempts -2.02 (1.81) 1.99 (2.38) 7.88 (7.48) 0.47 (0.17) 0.30 (0.16)Voluntary wounds 1.81 (0.87) -2.62 (1.14) 3.51 (3.58) -0.06 (0.08) 0.10 (0.08)Blackmails, threats 1.35 (1.21) 0.59 (1.60) -2.56 (5.01) -0.25 (0.12) 0.10 (0.11)Rape and other sex offences -1.48 (0.98) 4.87 (1.30) -18.61 (4.06) 0.16 (0.09) -0.13 (0.09)Family offences, incl. violence against children -0.76 (0.67) 1.36 (0.88) -4.00 (2.76) -0.01 (0.06) -0.04 (0.06)Drug offences 6.71 (1.52) -5.12 (2.00) -17.09 (6.27) -0.13 (0.15) -0.21 (0.13)Damage to vehicles 1.03 (1.25) -1.44 (1.65) -7.54 (5.16) 0.05 (0.12) 0.03 (0.11)Illegal weapon ownership 0.87 (1.41) -1.53 (1.86) 17.68 (5.84) -0.01 (0.14) -0.04 (0.13)Violence against police -3.22 (0.86) 0.63 (1.13) 17.80 (3.53) -0.08 (0.08) 0.20 (0.08)
Table 4: OLS effects of Unemployment and Unemployment Benefits on Crime
Fraction among unemp. above 25 with duration >1 yr
The standard errors are between parentheses. Each observation is a département-year. Observations are for the 95 French départements and for the years 1990-2000 (1,045 obs.). Dependent variables are the logarithms of offenses rates (offenses 100,000 people). Each regression also includes year and département fixed effects, socio-demographic controls (fraction of foreigners coming from North Africa, of other foreigners, fraction of 15-24, of 25-49, of men living alone, of people in single-parent families, of unskilled people, of high school graduates, of those living in rural areas, of those living in cities between 20,000 and 200,000, in cities above 200,000, in Paris and suburbs). Département population is used as weight. Specification (1) includes the first four variables for each regression. Specification (2) is the same as (1) but replaces the fraction among unemployed above 25 not receiving UI with the fraction of those with unemployment duration greater than 1 year. Sources: Ministry of Interior, ANPE, and INSEE (Labor Force Survey, 1990-2000).
Fraction of unemployed among
15-24 years old
Fraction of unemployed among
25-49 years old
Fraction of unemp. among more than
50 years old
Fraction among unemployed above 25 not receiving UI
Specification (1) Specification (2)
30
Armed or violent robberies 4.18 (1.11) -5.17 (1.47) 1.63 (4.58) 0.15 (0.11) 0.36 (0.26) -0.18 (0.23) 0.95Burglaries 2.61 (0.60) -1.85 (0.79) -8.71 (2.46) 0.14 (0.06) 0.08 (0.14) -0.14 (0.12) 0.94Car thefts 1.05 (0.86) 0.23 (1.13) -11.38 (3.53) 0.10 (0.08) -0.19 (0.20) -0.29 (0.18) 0.95Motorbike thefts 3.45 (0.65) -1.87 (0.86) -11.95 (2.70) 0.04 (0.06) 0.34 (0.15) -0.23 (0.14) 0.92Thefts of objects from cars 2.44 (0.78) -2.82 (1.04) -5.85 (3.24) 0.16 (0.08) 0.12 (0.18) -0.03 (0.16) 0.91Shoplifting -0.48 (1.33) 0.17 (1.76) -2.11 (5.49) -0.20 (0.13) -0.97 (0.31) -0.43 (0.28) 0.73Pickpocketing 1.11 (1.29) -0.30 (1.71) -3.86 (5.34) 0.19 (0.12) 0.10 (0.30) -0.11 (0.27) 0.96Receiving stolen goods 5.06 (1.50) -7.43 (1.98) 4.83 (6.19) -0.15 (0.14) 0.21 (0.35) 0.02 (0.31) 0.70Homicides, including attempts -2.03 (1.82) 2.04 (2.40) 7.84 (7.51) 0.47 (0.17) 0.03 (0.43) 0.06 (0.38) 0.64Voluntary wounds 1.59 (0.87) -2.55 (1.14) 4.43 (3.57) -0.07 (0.08) -0.62 (0.20) 0.34 (0.18) 0.89Blackmails, threats 1.23 (1.22) 0.65 (1.61) -2.12 (5.03) -0.25 (0.12) -0.29 (0.29) 0.21 (0.25) 0.75Rape and other sex offences -1.66 (0.99) 4.88 (1.30) -17.78 (4.07) 0.15 (0.09) -0.56 (0.23) 0.24 (0.20) 0.70Family offences, including violence against children -0.74 (0.67) 1.30 (0.89) -3.95 (2.77) -0.01 (0.06) -0.04 (0.16) -0.06 (0.14) 0.86Drug offences 6.70 (1.53) -5.20 (2.01) -16.88 (6.30) -0.14 (0.15) -0.15 (0.36) -0.05 (0.32) 0.78Damage to vehicles 1.19 (1.25) -1.42 (1.66) -8.34 (5.17) 0.06 (0.12) 0.55 (0.29) -0.19 (0.26) 0.86Illegal weapon ownership 0.85 (1.42) -1.88 (1.87) 18.47 (5.85) -0.02 (0.14) -0.57 (0.33) -0.25 (0.29) 0.79Violence against police -3.30 (0.85) 0.36 (1.13) 18.70 (3.53) -0.09 (0.08) -0.64 (0.20) -0.12 (0.18) 0.86
Table 5: OLS effects of Unemployment and Unemployment Benefits on Crime, Controlling for Wages and Inequalities
Ratio of third and first quartiles of the
wage distr.
Adjusted R2
The standard errors are between parentheses. Each observation is a département-year. Observations are for the 95 French départements and for the years 1990-2000 (1,045 obs.). Dependent variables are the logarithms of offenses rates (offenses 100,000 people). Each regression also includes year and département fixed effects, socio-demographic controls (fraction of foreigners coming from North Africa, of other foreigners, fraction of 15-24, of 25-49, of men living alone, of people in single-parent families, of unskilled people, of high school graduates, of those living in rural areas, of those living in cities between 20,000 and 200,000, in cities above 200,000, in Paris and suburbs). Département population is used as weight. Sources: Ministry of Interior, ANPE, and INSEE (Labor Force Survey, 1990-2000).
Fraction of unemployed among
15-24 years old
Fraction of unemployed among
25-49 years old
Fraction of unemp. among more than
50 years old
Fraction among unemployed above 25 not receiving UI
Median Wage
31
Armed or violent robberies 4.68 (1.12) -5.78 (1.46) 2.35 (4.62) 0.12 (0.11) -0.14 (0.08) -0.64 (0.21) 0.95Burglaries 2.17 (0.60) -1.71 (0.78) -6.87 (2.47) 0.15 (0.06) -0.12 (0.05) 0.41 (0.11) 0.94Car thefts 0.80 (0.86) 0.15 (1.12) -8.64 (3.55) 0.10 (0.08) -0.30 (0.07) 0.23 (0.16) 0.95Motorbike thefts 3.33 (0.66) -2.17 (0.86) -9.51 (2.72) 0.03 (0.06) -0.22 (0.05) 0.00 (0.12) 0.93Thefts of objects from cars 2.68 (0.79) -3.11 (1.03) -5.57 (3.28) 0.15 (0.08) -0.06 (0.06) -0.28 (0.15) 0.91Shoplifting 0.76 (1.34) 0.13 (1.74) -6.38 (5.53) -0.20 (0.13) 0.09 (0.10) -1.28 (0.25) 0.74Pickpocketing 0.75 (1.31) 0.06 (1.71) -3.87 (5.41) 0.19 (0.12) 0.08 (0.10) 0.30 (0.24) 0.96Receiving stolen goods 5.12 (1.52) -7.59 (1.98) 5.17 (6.28) -0.16 (0.14) -0.02 (0.12) -0.09 (0.28) 0.70Homicides, including attempts -0.85 (1.83) 1.57 (2.38) 3.91 (7.56) 0.44 (0.17) 0.22 (0.14) -1.25 (0.34) 0.65Voluntary wounds 1.83 (0.88) -2.55 (1.15) 3.03 (3.65) -0.06 (0.08) 0.05 (0.07) -0.02 (0.16) 0.89Blackmails, threats 1.86 (1.23) 0.22 (1.61) -3.18 (5.09) -0.26 (0.12) -0.03 (0.09) -0.53 (0.23) 0.75Rape and other sex offences -1.14 (1.00) 4.79 (1.30) -20.01 (4.13) 0.15 (0.09) 0.09 (0.08) -0.37 (0.18) 0.70Family offences, including violence against children -0.90 (0.68) 1.34 (0.88) -3.09 (2.81) -0.01 (0.06) -0.07 (0.05) 0.16 (0.13) 0.86Drug offences 5.43 (1.52) -3.99 (1.98) -16.61 (6.29) -0.10 (0.14) 0.19 (0.12) 1.33 (0.28) 0.78Damage to vehicles 0.84 (1.27) -1.50 (1.66) -6.18 (5.26) 0.05 (0.12) -0.12 (0.10) 0.21 (0.24) 0.86Illegal weapon ownership 2.39 (1.41) -2.11 (1.84) 12.69 (5.83) -0.04 (0.13) 0.26 (0.11) -1.63 (0.26) 0.80Violence against police -2.42 (0.85) 0.53 (1.11) 13.96 (3.52) -0.09 (0.08) 0.27 (0.06) -0.87 (0.16) 0.87
The standard errors are between parentheses. Each observation is a département-year. Observations are for the 95 French départements and for the years 1990-2000 (1,045 obs.). Dependent variables are the logarithms of offenses rates (offenses 100,000 people). Each regression also includes year and département fixed effects, socio-demographic controls (fraction of foreigners coming from North Africa, of other foreigners, fraction of 15-24, of 25-49, of men living alone, of people in single-parent families, of unskilled people, of high school graduates, of those living in rural areas, of those living in cities between 20,000 and 200,000, in cities above 200,000, in Paris and suburbs). Département population is used as weight. Sources: Ministry of Interior, ANPE, and INSEE (Labor Force Survey, 1990-2000).
Table 6: OLS effects of Unemployment and Unemployment Benefits on Crime, Controlling for Deterrence
Fraction of unemployed among
15-24 years old
Fraction of unemployed among
25-49 years old
Fraction of unemployed among more than 50 years
Fraction among unemployed above 25 not receiving UI
Total Police Employment
(in logs)
Total Gendarmes Employment
(in logs)
Adjusted R2
32
GROW 15-24 -1.94 (1.26) 2.53 (1.06)GROW 25-49 0.23 (0.17) -0.40 (0.14)(GROW 15-24)2 -189.73 (65.68) -205.63 (55.38)(GROW 25-49)2 4.47 (1.63) 3.94 (1.37)Adjusted R2F and p-value 17.29 <0.0001 13.52 <0.0001
(Instruments: predicted employment growth, by age and département)
0.94 0.95
The standard errors are between parentheses. Each observation is a département-year. Observations are for the 95 French départements and for the years 1990-2000 (1,045 obs.). We construct the predicted employment growth rates in industries and within-industry growth of different demographic groups as described in sub-section 4.3. Each regression also includes socio-demographic controls (fraction of foreigners coming from North Africa, of other foreigners, fraction of 15-24, of 25-49, of men living alone, of people in single-parent families, of unskilled people, of high school graduates, of those living in rural areas, of those living in cities between 20,000 and 200,000, in cities above 200,000, in Paris and suburbs), and time and département effects . Département population is used as weight. Sources: Ministry of Interior, ANPE, INSEE (Labor Force Survey, 1980-2000).
Table 7-AInstrumenting Regressions
Fraction of unemployed among 15-24 years old
Fraction of unemployed among 25-49 years old
33

GROW low-education males -0.18 (0.13) -0.22 (0.11)GROW low-education females 0.15 (0.23) -0.03 (0.19)(GROW low-education males)2 1.45 (0.53) -1.71 (0.44)(GROW low-education females)2 -6.00 (1.23) 1.99 (1.02)Adjusted R2F and p-value 9.27 <0.0001 15.02 <0.0001
The standard errors are between parentheses. Each observation is a département-year. Observations are for the 95 French départements and for the years 1990-2000 (1,045 obs.). We construct the predicted employment growth rates in industries and within-industry growth of different demographic groups as described in sub-section 4.3. Each regression also includes socio-demographic controls (fraction of foreigners coming from North Africa, of other foreigners, fraction of 15-24, of 25-49, of men living alone, of people in single-parent families, of unskilled people, of high school graduates, of those living in rural areas, of those living in cities between 20,000 and 200,000, in cities above 200,000, in Paris and suburbs), and time and département effects . Département population is used as weight. Sources: Ministry of Interior, ANPE, INSEE (Labor Force Survey, 1980-2000).
(Instruments: predicted employment growth, by education, sex and département)Instrumenting Regressions
Fraction of unemployed among 15-24 years old
Fraction of unemployed among 25-49 years old
0.94 0.95
Table 7-B
34

Armed or violent robberies 19.71 (6.60) -19.63 (8.85) 5.75 0.056Burglaries 16.22 (4.85) 1.94 (6.51) 0.63 0.731Car thefts 22.60 (6.74) 1.84 (9.04) 3.66 0.161Motorbike thefts 21.76 (4.98) -19.77 (6.68) 12.02 0.002Thefts of objects from cars 16.26 (5.64) 3.57 (7.57) 2.72 0.257Shoplifting -0.66 (7.11) 5.83 (9.54) 5.02 0.081Pickpocketing 20.29 (7.65) -15.47 (10.26) 0.10 0.949Receiving stolen goods 8.65 (8.01) -5.61 (10.74) 0.52 0.770Homicides, including attempts -9.62 (9.94) 17.42 (13.33) 8.15 0.017Voluntary wounds 1.82 (6.34) 24.01 (8.51) 8.57 0.014Blackmails, threats 14.69 (7.06) -16.03 (9.47) 4.91 0.086Rape and other sex offences 6.12 (5.48) 1.12 (7.35) 5.54 0.063Family offences, incl. violence against children 2.55 (3.99) -11.09 (5.35) 0.42 0.811Drug offences 75.65 (14.83) -41.77 (19.89) 4.60 0.100Damage to vehicles 6.60 (6.90) 1.70 (9.26) 4.60 0.100Illegal weapon ownership 16.05 (7.90) -4.95 (10.59) 2.51 0.285Violence against police -25.90 (6.25) 20.44 (8.39) 10.76 0.005
Table 8-A: IV Effects of Unemployment on Crime(Instruments: predicted employment growth, by age and département)
Fraction of unemployed among 15-24 years old
Fraction of unemployed among 25-49 years old
Sargan Statistics p-value
The standard errors are between parentheses. Each observation is a département-year. Observations are for the 95 French départements and for the years 1990-2000 (1,045 obs.). Dependent variables are the logarithms of offenses rates (offenses per 100,000 inhabitants). Instrumented variables are fraction of unemployed among 15-24, or 25-49. Each regression also includes socio-demographic controls (fraction of foreigners coming from North Africa, of other foreigners, fraction of 15-24, of 25-49, of unemployed among the 50 and above, of men living alone, of people in single-parent families, of unskilled people, of high school graduates, of those living in rural areas, of those living in cities between 20,000 and 200,000, in cities above 200,000, in Paris and suburbs), and time and département effects . Département population is used as weight. Sources: Ministry of Interior, ANPE, INSEE (Labor Force Survey, 1990-2000). Instruments: predicted employment growth, by age and département, based on initial industry structure and aggregate industry growth (see Blanchard and Katz, 1992).
35

Armed or violent robberies 16.72 (5.54) -4.92 (5.26) 1.36 0.507Burglaries 35.04 (5.75) -19.28 (5.47) 2.40 0.301Car thefts 35.32 (6.65) -14.30 (6.32) 0.21 0.901Motorbike thefts 18.72 (3.90) -13.73 (3.71) 13.90 0.001Thefts of objects from cars 33.35 (6.08) -13.68 (5.78) 2.30 0.317Shoplifting 3.77 (6.08) -5.22 (5.78) 2.30 0.317Pickpocketing 27.74 (7.07) -19.72 (6.72) 2.61 0.271Receiving stolen goods 18.58 (7.10) -12.66 (6.74) 1.88 0.390Homicides, including attempts 3.86 (8.34) 6.28 (7.93) 22.36 0.000Voluntary wounds 7.27 (4.32) 6.94 (4.11) 0.31 0.855Blackmails, threats -19.19 (6.45) 23.68 (6.13) 6.17 0.046Rape and other sex offences 2.44 (4.54) 1.27 (4.31) 1.78 0.411Family offences, incl. violence against children -10.51 (3.40) 4.23 (3.23) 4.08 0.130Drug offences 73.48 (12.27) -48.73 (11.66) 3.34 0.188Damage to vehicles 20.67 (6.48) -20.03 (6.16) 1.36 0.507Illegal weapon ownership -14.06 (7.08) 25.25 (6.73) 12.85 0.002Violence against police -38.53 (7.10) 41.81 (6.75) 1.36 0.507
The standard errors are between parentheses. Each observation is a département-year. Observations are for the 95 French départements and for the years 1990-2000 (1,045 obs.). Dependent variables are the logarithms of offenses rates (offenses 100,000 people). Instrumented variables are fraction of unemployed among 15-24, or 25-49. Each regression also includes socio-demographic controls (fraction of foreigners coming from North Africa, of other foreigners, fraction of 15-24, of 25-49, of unemployed among the 50 and above, of men living alone, of people in single-parent families, of unskilled people, of high school graduates, of those living in rural areas, of those living in cities between 20,000 and 200,000, in cities above 200,000, in Paris and suburbs), and time and département effects . Département population is used as weight. Sources: Ministry of Interior, ANPE, INSEE (Labor Force Survey, 1990-2000). Instruments: predicted employment growth, by education, sex and département, based on initial industry structure and aggregate industry growth (see Blanchard and Katz, 1992).
Table 8-B: IV Effects of Unemployment on Crime(Instruments: predicted employment growth, by education, sex and département)
Fraction of unemployed among 15-24 years old
Fraction of unemployed among 25-49 years old
Sargan Statistics p-value
36
Appendix A: Additional Empirical Results
Armed or violent robberies Burglaries Car thefts
Motorbike thefts
Thefts of objects from
cars ShopliftingPickpocketi
ngReceiving
stolen goods
Homicides, including attempts
Voluntary wounds
Blackmails, threats
Rape and other sex offences
Family offenses Drug offenses
Damage to vehicles
Illegal weapon
ownership
Violence against police
Armed or violent robberies 1 0.74** 0.36** 0.54** 0.58** 0.51** 0.90** 0.79** 0.48** 0.63** 0.60** 0.61** -0.2 0.36** 0.72** 0.70** 0.84** Burglaries 0.74** 1 0.66** 0.75** 0.80** 0.30** 0.78** 0.70** 0.31** 0.36** 0.51** 0.45** 0.07 0.17 0.40** 0.39** 0.54** Car thefts 0.36** 0.66** 1 0.44** 0.82** 0.05 0.28** 0.56** 0.47** 0.37** 0.49** 0.18 0.40** 0.15** 0.36** 0.38** 0.37** Motorbike thefts 0.54** 0.75** 0.44** 1 0.70** 0.14 0.55** 0.51** 0.22* 0.21* 0.39** 0.29** 0.15 0.08 0.35** 0.24* 0.30** Thefts of objects from cars 0.58** 0.80** 0.82** 0.70** 1 0.26* 0.44** 0.71** 0.51** 0.53** 0.61** 0.32** 0.33** 0.33** 0.48** 0.54** 0.54** Shoplifting 0.51** 0.30** 0.05 0.14 0.26* 1 0.38** 0.44** 0.21* 0.55** 0.47** 0.45** 0.06 0.48** 0.50** 0.62** 0.66** Pickpocketing 0.90** 0.78** 0.28** 0.55** 0.44** 0.38** 1 0.64** 0.29** 0.34** 0.45** 0.51** -0.23* 0.17 0.49** 0.42** 0.64** Receiving stolen goods 0.79** 0.70** 0.56** 0.51** 0.71** 0.44** 0.64** 1 0.60** 0.63** 0.63** 0.54** 0.14 0.48** 0.73** 0.79** 0.75** Homicides, including attempts 0.48** 0.31** 0.47** 0.22* 0.51** 0.21* 0.29** 0.60** 1 0.59** 0.48** 0.16 0.19 0.32** 0.54** 0.67** 0.58** Voluntary wounds 0.63** 0.36** 0.37** 0.21* 0.53** 0.55** 0.34** 0.63** 0.59** 1 0.76** 0.52** 0.21* 0.52** 0.72** 0.82** 0.78** Blackmails, threats 0.60** 0.51** 0.49** 0.39** 0.61** 0.47** 0.45** 0.63** 0.48** 0.76** 1 0.51** 0.35** 0.52** 0.62** 0.71** 0.70** Rape and other sex offences 0.61** 0.45** 0.18 0.29** 0.32** 0.45** 0.51** 0.54** 0.16 0.52** 0.51** 1 0 0.54** 0.68** 0.50** 0.60** Family offences -0.2 0.07 0.40** 0.15 0.33** 0.06 -0.23* 0.14 0.19 0.21* 0.35** 0 1 0.20* 0.04 0.13 0.02 Drug offences 0.36** 0.17 0.15 0.08 0.33** 0.48** 0.17 0.48** 0.32** 0.52** 0.52** 0.54** 0.20* 1 0.57** 0.63** 0.55** Damage to vehicles 0.72** 0.40** 0.36** 0.35** 0.48** 0.50** 0.49** 0.73** 0.54** 0.72** 0.62** 0.68** 0.04 0.57** 1 0.80** 0.74** Illegal weapon ownership 0.70** 0.39** 0.38** 0.24* 0.54** 0.62** 0.42** 0.79** 0.67** 0.82** 0.71** 0.50** 0.13 0.63** 0.80** 1 0.85** Violence against police 0.84** 0.54** 0.37** 0.30** 0.54** 0.66** 0.64** 0.75** 0.58** 0.78** 0.70** 0.60** 0.02 0.55** 0.74** 0.85** 1
Source: Ministry of InteriorCrimes rates are offenses per 100,000 people. The département population means were used as weights (there are 95 départements in France)** = significant at the 1% level* = significant at the 5% level
Table A.1: Geographic cross-correlations among crimes rates (2000)
Property Crimes Violent Crimes Other Crimes
37
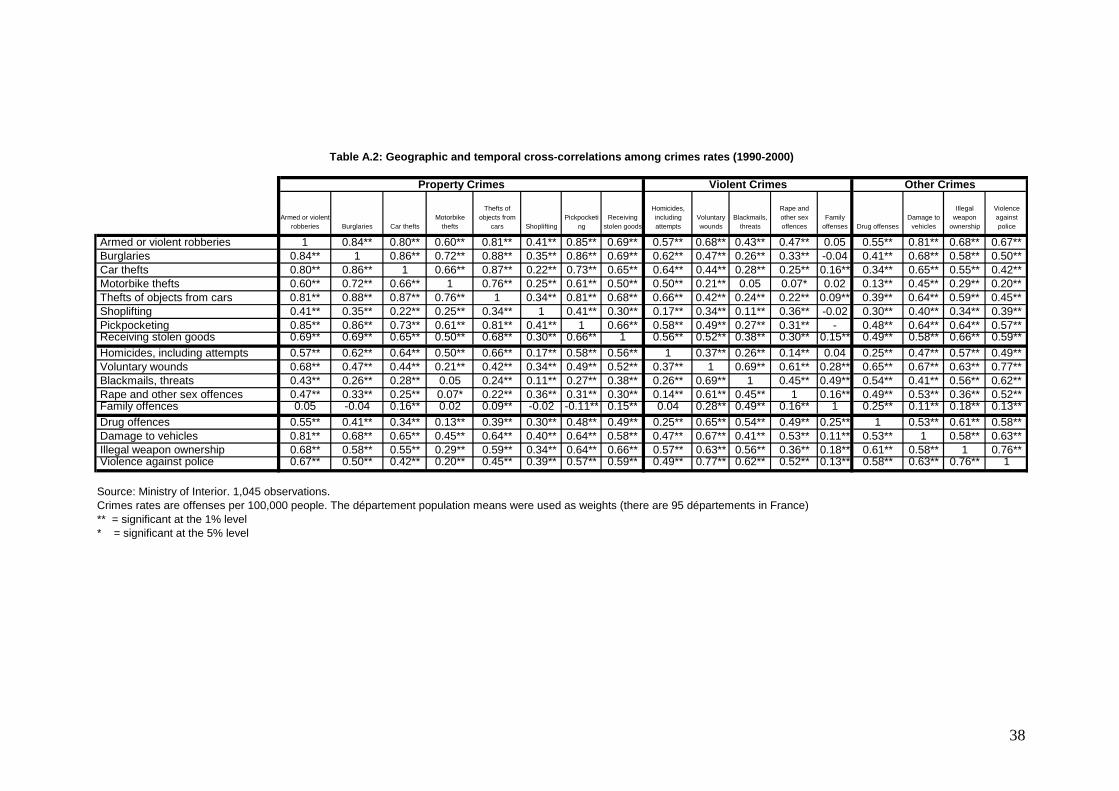
Armed or violent robberies Burglaries Car thefts
Motorbike thefts
Thefts of objects from
cars ShopliftingPickpocketi
ngReceiving
stolen goods
Homicides, including attempts
Voluntary wounds
Blackmails, threats
Rape and other sex offences
Family offenses Drug offenses
Damage to vehicles
Illegal weapon
ownership
Violence against police
Armed or violent robberies 1 0.84** 0.80** 0.60** 0.81** 0.41** 0.85** 0.69** 0.57** 0.68** 0.43** 0.47** 0.05 0.55** 0.81** 0.68** 0.67** Burglaries 0.84** 1 0.86** 0.72** 0.88** 0.35** 0.86** 0.69** 0.62** 0.47** 0.26** 0.33** -0.04 0.41** 0.68** 0.58** 0.50** Car thefts 0.80** 0.86** 1 0.66** 0.87** 0.22** 0.73** 0.65** 0.64** 0.44** 0.28** 0.25** 0.16** 0.34** 0.65** 0.55** 0.42** Motorbike thefts 0.60** 0.72** 0.66** 1 0.76** 0.25** 0.61** 0.50** 0.50** 0.21** 0.05 0.07* 0.02 0.13** 0.45** 0.29** 0.20** Thefts of objects from cars 0.81** 0.88** 0.87** 0.76** 1 0.34** 0.81** 0.68** 0.66** 0.42** 0.24** 0.22** 0.09** 0.39** 0.64** 0.59** 0.45** Shoplifting 0.41** 0.35** 0.22** 0.25** 0.34** 1 0.41** 0.30** 0.17** 0.34** 0.11** 0.36** -0.02 0.30** 0.40** 0.34** 0.39** Pickpocketing 0.85** 0.86** 0.73** 0.61** 0.81** 0.41** 1 0.66** 0.58** 0.49** 0.27** 0.31** - 0.48** 0.64** 0.64** 0.57** Receiving stolen goods 0.69** 0.69** 0.65** 0.50** 0.68** 0.30** 0.66** 1 0.56** 0.52** 0.38** 0.30** 0.15** 0.49** 0.58** 0.66** 0.59** Homicides, including attempts 0.57** 0.62** 0.64** 0.50** 0.66** 0.17** 0.58** 0.56** 1 0.37** 0.26** 0.14** 0.04 0.25** 0.47** 0.57** 0.49** Voluntary wounds 0.68** 0.47** 0.44** 0.21** 0.42** 0.34** 0.49** 0.52** 0.37** 1 0.69** 0.61** 0.28** 0.65** 0.67** 0.63** 0.77** Blackmails, threats 0.43** 0.26** 0.28** 0.05 0.24** 0.11** 0.27** 0.38** 0.26** 0.69** 1 0.45** 0.49** 0.54** 0.41** 0.56** 0.62** Rape and other sex offences 0.47** 0.33** 0.25** 0.07* 0.22** 0.36** 0.31** 0.30** 0.14** 0.61** 0.45** 1 0.16** 0.49** 0.53** 0.36** 0.52** Family offences 0.05 -0.04 0.16** 0.02 0.09** -0.02 -0.11** 0.15** 0.04 0.28** 0.49** 0.16** 1 0.25** 0.11** 0.18** 0.13** Drug offences 0.55** 0.41** 0.34** 0.13** 0.39** 0.30** 0.48** 0.49** 0.25** 0.65** 0.54** 0.49** 0.25** 1 0.53** 0.61** 0.58** Damage to vehicles 0.81** 0.68** 0.65** 0.45** 0.64** 0.40** 0.64** 0.58** 0.47** 0.67** 0.41** 0.53** 0.11** 0.53** 1 0.58** 0.63** Illegal weapon ownership 0.68** 0.58** 0.55** 0.29** 0.59** 0.34** 0.64** 0.66** 0.57** 0.63** 0.56** 0.36** 0.18** 0.61** 0.58** 1 0.76** Violence against police 0.67** 0.50** 0.42** 0.20** 0.45** 0.39** 0.57** 0.59** 0.49** 0.77** 0.62** 0.52** 0.13** 0.58** 0.63** 0.76** 1
Source: Ministry of Interior. 1,045 observations.Crimes rates are offenses per 100,000 people. The département population means were used as weights (there are 95 départements in France)** = significant at the 1% level* = significant at the 5% level
Table A.2: Geographic and temporal cross-correlations among crimes rates (1990-2000)
Property Crimes Violent Crimes Other Crimes
38

Armed or violent robberies Burglaries Car thefts
Motorbike thefts
Thefts of objects from
cars ShopliftingPickpocketi
ngReceiving
stolen goods
Homicides, including attempts
Voluntary wounds
Blackmails, threats
Rape and other sex offences
Family offenses Drug offenses
Damage to vehicles
Illegal weapon
ownership
Violence against police
Armed or violent robberies 1 0.17 0.26* 0.19* 0.40** 0.08 0.19 0.20* 0.2 0.21* 0.08 -0.08 0.03 -0.07 0.22* 0.32** 0.15 Burglaries 0.17 1 0.60** 0.52** 0.68** 0.03 0.37** 0 0.17 0.01 -0.31** 0.1 -0.17 0.23* 0.42** -0.28** -0.53** Car thefts 0.26* 0.60** 1 0.26* 0.68** 0.17 0.37** 0.15 0.12 0.19 -0.21* 0.05 -0.1 0.17 0.24* 0.02 -0.26* Motorbike thefts 0.19 0.52** 0.26* 1 0.35** -0.18 0.14 -0.05 0.03 -0.17 -0.20* -0.1 -0.12 0.01 0.19 -0.29** -0.31** Thefts of objects from cars 0.40** 0.68** 0.68** 0.35** 1 0.17 0.39** 0.09 0.30** 0.16 -0.16 0.13 -0.15 0.26 0.33 0.04 -0.23* Shoplifting 0.08 0.03 0.17 -0.18 0.17 1 0.06 0.25* 0.13 0.12 0.06 0.04 0.16 0.1 -0.11 0.30** 0.25 Pickpocketing 0.19 0.37** 0.37** 0.14 0.39** 0.06 1 0.12 0.12 0.04 -0.15 0.06 0.05 0.17 0.11 0.02 -0.13 Receiving stolen goods 0.20* 0 0.15 -0.05 0.09 0.25* 0.12 1 0.03 0.08 0.09 -0.04 0.2 0.03 -0.02 0.19 0.19 Homicides, including attempts 0.2 0.17 0.12 0.03 0.30** 0.13 0.12 0.03 1 0.04 -0.05 0.17 -0.02 0 0.02 0.2 0.09 Voluntary wounds 0.21* 0.01 0.19 -0.17 0.16 0.12 0.04 0.08 0.04 1 0.25* 0.13 0.27* 0.10* 0.1 0.24* 0.16 Blackmails, threats 0.08 -0.31** -0.21* -0.20* -0.16 0.06 -0.15 0.09 -0.05 0.25* 1 -0.08 0.2 -0.21** -0.01 0.50** 0.54** Rape and other sex offences -0.08 0.1 0.05 -0.1 0.13 0.04 0.06 -0.04 0.17 0.13 -0.08 1 0.09 0.34 0.01 0.07 0 Family offences 0.03 -0.17 -0.1 -0.12 -0.15 0.16 0.05 0.2 -0.02 0.27** 0.2 0.09 1 -0.04 -0.14 0.02 0.26** Drug offences -0.07 0.23* 0.17 0.01 0.26** 0.1 0.17 0.03 0 0.1 -0.21* 0.34** -0.04 1 0.01 -0.07 -0.26** Damage to vehicles 0.22* 0.42** 0.24* 0.19 0.33** -0.11 0.11 -0.02 0.02 0.1 -0.01 0.01 -0.14 0.01 1 -0.1 -0.23* Illegal weapon ownership 0.32** -0.28** 0.02 -0.29** 0.04 0.30** 0.02 0.19 0.2 0.24* 0.50** 0.07 0.02 -0.07 -0.1 1 0.58** Violence against police 0.15 -0.53** -0.26* -0.31** -0.23* 0.25* -0.13 0.19 0.09 0.16 0.54** 0 0.26** -0.26** -0.23** 0.58** 1
Source: Ministry of Interior. 1045 observations.Crimes rates are offenses per 100,000 people. The département population means were used as weights (there are 95 départements in France)** = significant at the 1% level* = significant at the 5% level
Table A.3: Geographic cross-correlations among growth rates of crime rates (1990-2000)
Property Crimes Violent Crimes Other Crimes
39

Armed or violent robberies Burglaries Car thefts
Motorbike thefts
Thefts of objects from
cars ShopliftingPickpocketi
ngReceiving
stolen goods
Homicides, including attempts
Voluntary wounds
Blackmails, threats
Rape and other sex offences
Family offenses Drug offenses
Damage to vehicles
Illegal weapon
ownership
Violence against police
Armed or violent robberies 1 0.93** 0.89** 0.88** 0.88** -0.36** 0.91** 0.85** 0.54** 0.38** -0.41** 0.04 - 0.22* 0.20* -0.03 0.1 Burglaries 0.93** 1 0.90** 0.90** 0.91** -0.32** 0.92** 0.88* 0.58** 0.31** -0.32** 0.05 - 0.26** 0.27** 0.04 0.11 Car thefts 0.89** 0.90** 1 0.80** 0.89** -0.37** 0.80** 0.83** 0.70** 0.38** -0.27** 0.02 - 0.19 0.29** 0.04 0.09 Motorbike thefts 0.88** 0.90** 0.80** 1 0.85** -0.37** 0.81** 0.83** 0.51** 0.31** -0.32** -0.04 - 0.18 0.23* -0.09 0 Thefts of objects from cars 0.88** 0.91** 0.89** 0.85** 1 -0.17 0.85** 0.89** 0.70** 0.39** -0.13 0.02 - 0.27** 0.45** 0.26* 0.29** Shoplifting -0.36** -0.32** -0.37** -0.37** -0.17 1 -0.32** -0.24* -0.05 0.23* 0.67** 0.50** 0.72** 0.26* 0.56** 0.65** 0.59** Pickpocketing 0.91** 0.92** 0.80** 0.81** 0.85** -0.32** 1 0.82** 0.49** 0.26* -0.39** -0.04 - 0.26* 0.14 0.03 0.11 Receiving stolen goods 0.85** 0.88** 0.83** 0.83** 0.89** -0.24* 0.82** 1 0.72** 0.45** -0.12 0.03 - 0.40** 0.36** 0.23* 0.28** Homicides, including attempts 0.54** 0.58** 0.70** 0.51** 0.70** -0.05 0.49** 0.72** 1 0.58** 0.30** 0.09 0.1 0.36** 0.54** 0.48** 0.45** Voluntary wounds 0.38** 0.31** 0.38** 0.31** 0.39** 0.23* 0.26* 0.45** 0.58** 1 0.39** 0.50** 0.18 0.49** 0.44** 0.40** 0.57** Blackmails, threats -0.41** -0.32** -0.27** -0.32** -0.13 0.67** -0.39** -0.12 0.30** 0.39** 1 0.26** 0.85** 0.37** 0.52** 0.72** 0.60** Rape and other sex offences 0.04 0.05 0.02 -0.04 0.02 0.50** -0.04 0.03 0.09* 0.50** 0.26** 1 0.30** 0.40** 0.44** 0.25* 0.40** Family offences -0.57** -0.51** -0.39** -0.49** -0.27** 0.72** -0.61** -0.33** 0.1 0.18 0.85** 0.30** 1 0.2 0.53** 0.62** 0.44** Drug offences 0.22* 0.26* 0.19 0.18 0.27** 0.26* 0.26* 0.40** 0.36** 0.49** 0.37** 0.40** 0.2 1 0.36** 0.46** 0.32** Damage to vehicles 0.20* 0.27** 0.29** 0.23* 0.45** 0.56** 0.14 0.36** 0.54** 0.44** 0.52** 0.44** 0.53** 0.36** 1 0.66** 0.61** Illegal weapon ownership -0.03 0.04 0.04 -0.09 0.26* 0.65** 0.03 0.23* 0.48** 0.40** 0.72** 0.25* 0.62** 0.46** 0.66** 1 0.78** Violence against police 0.1 0.11 0.09 0 0.29** 0.59** 0.11 0.28* 0.45** 0.57** 0.60** 0.40** 0.44** 0.32** 0.61** 0.78** 1
Source: Ministry of InteriorCrimes rates are offenses per 100,000 people. The département population means were used as weights (there are 95 départements in France)** = significant at the 1% level* = significant at the 5% levelDépartement fixed effects were obtained as follows. We regressed logarithms of offences rates (offences 100,000 people) on year and département fixed effects, socio-demographic controls (fraction of foreigners coming from North Africa, of other foreigners, fraction of 15-24, of 25-49, of unemployed among 15-24 yrs old, of unemployed among 25-49 yrs old, of unemployed among more than 50 yrs old, of unemployed not receiving UI among unemployed above 25, of men living alone, of people in single-parent families, of unskilled people, of high school graduates, of those living in rural areas, of those living in cities between 20,000 and 200,000, in cities above 200,000, in Paris and suburbs.
Table A.4: Geographic cross-correlations among fixed effects
Property Crimes Violent Crimes Other Crimes
40
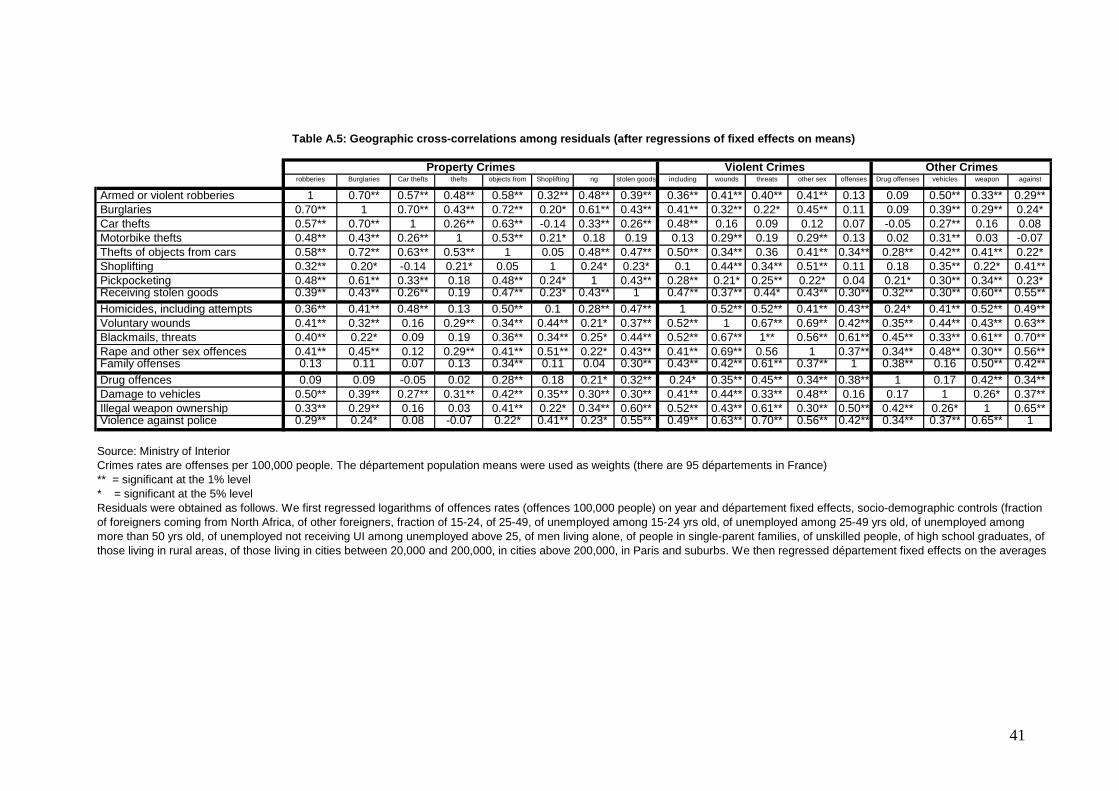
robberies Burglaries Car thefts thefts objects from Shoplifting ng stolen goods including wounds threats other sex offenses Drug offenses vehicles weapon against
Armed or violent robberies 1 0.70** 0.57** 0.48** 0.58** 0.32** 0.48** 0.39** 0.36** 0.41** 0.40** 0.41** 0.13 0.09 0.50** 0.33** 0.29** Burglaries 0.70** 1 0.70** 0.43** 0.72** 0.20* 0.61** 0.43** 0.41** 0.32** 0.22* 0.45** 0.11 0.09 0.39** 0.29** 0.24* Car thefts 0.57** 0.70** 1 0.26** 0.63** -0.14 0.33** 0.26** 0.48** 0.16 0.09 0.12 0.07 -0.05 0.27** 0.16 0.08 Motorbike thefts 0.48** 0.43** 0.26** 1 0.53** 0.21* 0.18 0.19 0.13 0.29** 0.19 0.29** 0.13 0.02 0.31** 0.03 -0.07 Thefts of objects from cars 0.58** 0.72** 0.63** 0.53** 1 0.05 0.48** 0.47** 0.50** 0.34** 0.36 0.41** 0.34** 0.28** 0.42** 0.41** 0.22* Shoplifting 0.32** 0.20* -0.14 0.21* 0.05 1 0.24* 0.23* 0.1 0.44** 0.34** 0.51** 0.11 0.18 0.35** 0.22* 0.41** Pickpocketing 0.48** 0.61** 0.33** 0.18 0.48** 0.24* 1 0.43** 0.28** 0.21* 0.25** 0.22* 0.04 0.21* 0.30** 0.34** 0.23* Receiving stolen goods 0.39** 0.43** 0.26** 0.19 0.47** 0.23* 0.43** 1 0.47** 0.37** 0.44* 0.43** 0.30** 0.32** 0.30** 0.60** 0.55** Homicides, including attempts 0.36** 0.41** 0.48** 0.13 0.50** 0.1 0.28** 0.47** 1 0.52** 0.52** 0.41** 0.43** 0.24* 0.41** 0.52** 0.49** Voluntary wounds 0.41** 0.32** 0.16 0.29** 0.34** 0.44** 0.21* 0.37** 0.52** 1 0.67** 0.69** 0.42** 0.35** 0.44** 0.43** 0.63** Blackmails, threats 0.40** 0.22* 0.09 0.19 0.36** 0.34** 0.25* 0.44** 0.52** 0.67** 1** 0.56** 0.61** 0.45** 0.33** 0.61** 0.70** Rape and other sex offences 0.41** 0.45** 0.12 0.29** 0.41** 0.51** 0.22* 0.43** 0.41** 0.69** 0.56 1 0.37** 0.34** 0.48** 0.30** 0.56** Family offenses 0.13 0.11 0.07 0.13 0.34** 0.11 0.04 0.30** 0.43** 0.42** 0.61** 0.37** 1 0.38** 0.16 0.50** 0.42** Drug offences 0.09 0.09 -0.05 0.02 0.28** 0.18 0.21* 0.32** 0.24* 0.35** 0.45** 0.34** 0.38** 1 0.17 0.42** 0.34** Damage to vehicles 0.50** 0.39** 0.27** 0.31** 0.42** 0.35** 0.30** 0.30** 0.41** 0.44** 0.33** 0.48** 0.16 0.17 1 0.26* 0.37** Illegal weapon ownership 0.33** 0.29** 0.16 0.03 0.41** 0.22* 0.34** 0.60** 0.52** 0.43** 0.61** 0.30** 0.50** 0.42** 0.26* 1 0.65** Violence against police 0.29** 0.24* 0.08 -0.07 0.22* 0.41** 0.23* 0.55** 0.49** 0.63** 0.70** 0.56** 0.42** 0.34** 0.37** 0.65** 1
Source: Ministry of InteriorCrimes rates are offenses per 100,000 people. The département population means were used as weights (there are 95 départements in France)** = significant at the 1% level* = significant at the 5% levelResiduals were obtained as follows. We first regressed logarithms of offences rates (offences 100,000 people) on year and département fixed effects, socio-demographic controls (fraction of foreigners coming from North Africa, of other foreigners, fraction of 15-24, of 25-49, of unemployed among 15-24 yrs old, of unemployed among 25-49 yrs old, of unemployed among more than 50 yrs old, of unemployed not receiving UI among unemployed above 25, of men living alone, of people in single-parent families, of unskilled people, of high school graduates, of those living in rural areas, of those living in cities between 20,000 and 200,000, in cities above 200,000, in Paris and suburbs. We then regressed département fixed effects on the averages
Property Crimes Violent Crimes Other Crimes
Table A.5: Geographic cross-correlations among residuals (after regressions of fixed effects on means)
41