Embed Size (px)
Citation preview

Edmund G. Brown Jr., Attorney GeneralCalifornia Department of JusticeDivision of California Justice Information ServicesBureau of Criminal Information and AnalysisCRIMINAL JUSTICE STATISTICS CENTER
CRIMEIN
CALIfoRNIA
2007

Crime
Published Annually by the California Department of Justice
Division of California Justice Information ServicesBureau of Criminal Information and AnalysisCRIMINAL JUSTICE STATISTICS CENTER
Released December 2008
An electronic version of this report and other reports are available on the California Attorney General’s website: http://ag.ca.gov
in California
2007

ii CRIME IN CALIFORNIA, 2007
California DeParTmenT of JUSTiCeEdmund G. Brown Jr., Attorney General
DiViSion of California JUSTiCe informaTion SerViCeSGary Cooper, Director
BUreaU of Criminal informaTion anD analYSiSJulie Basco, Bureau ChiefMarilyn Yankee, Assistant Bureau Chief
Crime in California, 2007Marie Herbert, Principal Analyst
The role of the Criminal Justice Statistics Center is to:
Collect, analyze, and report statistical data which provide valid measures of crime and the criminal justice process.
Examine these data on an ongoing basis to better describe crime and the criminal justice system.
Promote the responsible presentation and use of crime statistics.

eXeCUTiVe SUmmarY .............................................................. ivaT a GlanCe .............................................................................. vi
CrimeS ........................................................................................ 1 Crime Trends, 1983–2007 ........................................................... 3 Violent and Property Crimes ........................................................ 4 Violent Crimes .......................................................................... 5 Property Crimes .......................................................................11 Larceny-Theft ............................................................................. 16 Value of Stolen and Recovered Property ................................ 18 Arson .......................................................................................... 20 Clearances ................................................................................. 22
arreSTS ................................................................................... 25 Arrest Trends, 1966–2007 ......................................................... 27 Total Arrests ............................................................................... 28 Felony Arrests ......................................................................... 31 Arrests for Violent Offenses ................................................. 33 Arrests for Property Offenses .............................................. 40 Arrests for Drug Offenses .................................................... 47 Misdemeanor Arrests .............................................................. 53 Personal Characteristics of Felony and Misdemeanor Arrestees .......................................................... 60
aDUlT felonY arreST DiSPoSiTionS ............................ 65 Adult Felony Arrest Dispositions ................................................ 68 Adult Felony Arrestees Convicted .............................................. 70 Adult Felony Arrestees Convicted of Violent Offenses ........... 71 Adult Felony Arrestees Convicted of Property Offenses ......... 72 Adult Felony Arrestees Convicted of Drug Offenses .............. 73 Dispositions for Adult Felony Arrests ......................................... 74
aDUlT CorreCTionS ............................................................ 77 Adults Under State and Local Supervision ................................ 79 Adults Under State Supervision .............................................. 80 Adults Under Local Supervision .............................................. 81 Adults on Active Probation................................................... 82 Adults Placed on Probation ................................................. 83 Adults Removed From Probation ........................................ 84 Adults Committed to State Institutions .................................... 85
Criminal JUSTiCe eXPenDiTUreS anD PerSonnel .. 87 Expenditures .............................................................................. 89 Personnel ................................................................................... 92
oTHer DaTaBaSeS ................................................................ 95 Citizens’ComplaintsAgainstPeaceOfficers ............................. 96 Domestic Violence-Related Calls for Assistance ....................... 97
DaTa TaBleS ........................................................................... 99
aPPenDiCeS ........................................................................... 1691 Data Characteristics and Known Limitations ........................... 1702 Computational Formulas ......................................................... 1723 Arrest Offense Codes .............................................................. 1744 Criminal Justice Glossary ........................................................ 1765 Notes ..................................................................................... 180
CONTENTS iii
CONTENTS
iv CRIME IN CALIFORNIA, 2007
CRIME IN CALIFORNIA, 2007
executive SummaryThe California Department of Justice (DOJ) is responsible for collecting and reporting statistics on crime in California. This report, Crime in California, 2007, provides statistics on criminal events and processes within the California criminal justice system. As a comprehensive source of statistics, this report is of value to anyone needing information on crime and the administration of criminal justice in California.
Crime in California, 2007, provides data as reported in 2007, as well as statistical comparisons to prior years. The Crimes section provides data on criminal events reported to law enforcement, and the Arrests section reports data on arrests made by lawenforcementpersonnel.TheDispositionssectionreportsstatisticsonfinaladultlevel dispositions, or legal action outcomes, of felony arrests. Adult Corrections provides statistics on the number of adults under supervision during 2007. The Expenditures & Personnel Section reports on the costs and manpower associated with the California criminal justice system. The Other Databases Section includes statistics on Citizens’ ComplaintsAgainstPeaceOfficersandDomesticViolence-RelatedCallsforAssistance.Lastly, the Data Tables Section of the report is comprised of statistical data for current and prior years.
The Crimes section (pages 4-25) provides data on criminal events reported to law enforcement.
In 2007, the violent crime rate decreased 2.2 percent from 518.4 to 507.0, reaching its lowest level since 1970 (470.8).
The decline in the violent crime rate was driven by the decreases in all four violent offense categories.
In 2007, the property crime rate decreased 4.6 percent, driven by a 10.1 percent decrease in the motor vehicle theft rate.
❒
❒
❒
The Arrests section (pages 26-63) provides data on arrests made by law enforcement personnel.
The 2007 total arrest rate of 5,250.3 per 100,000 population at risk is just slightly lower than the 2006 arrest rate of 5,265.1.
In 2007, the total felony arrest rate decreased for the second consecutive year. Conversely, the total misdemeanor arrest rate increased for a second consecutive year.
❒
❒
Crimes
arrests
DATA TABLES CONTENTS v
EXECUTIVE SUMMARY
In 2007, the total violent offense arrest rate increased 1.3 percent, while the total property and drug offense arrest rates decreased 3.0 and 8.0 percent, respectively.
From 2006 to 2007, the marijuana arrest rate increased 17.7 percent, while the arrest rates for narcotics, dangerous drugs, and “other” drugs decreased 2.9, 15.6, and 8.0 percent respectively.
❒
❒
The Dispositions section (pages 64-73) describes the processing of adults (and in some cases,juveniles)arrestedinCaliforniaforfelonyoffensesfromarrestthroughfinaldisposition at the adult level.
In 2007, 69.4 percent of adult felony arrests resulted in conviction.
Probation with jail continues to be the most frequent sentence given for adult felony arrest convictions.
Individuals convicted of property offenses have a slightly higher chance of being sentenced to a state institution than those convicted of violent offenses.
❒
❒
❒
The Adult Corrections section (pages 74-81) provides statistics on the number of adults under supervision during 2007.
From 2006 to 2007, there was a 0.7 percent increase in the rate of adults under state supervision and virtually no change in the rate of adults under local supervision.
Since 2002, the rate of adults under state supervision decreased 0.8 percent and the rate of adults under local supervision decreased 3.7 percent.
❒
❒
The Department of Justice is mandated by the Legislature to meet the July 1 annual submission of the Crime in California report. It is of the utmost importance for law enforcement agencies to submit complete and timely statistical data to the Department of Justice to ensure this mandate is met. As such, appreciation is extended to all law enforcement agencies that have met their reporting requirements.
Dispositions
adult Corrections
acknowledgment
arrests (cont.)

Crime in California, 2007at a Glance
figure 1
arrests
1,551,900100.0%
adultfelony arrests457,08529.5%
Juvenilemisdemeanor
arrests134,629
8.7%
Status offenses
36,0362.3%
adultmisdemeanor
arrests857,95955.3%
Juvenilefelony arrests66,1914.3%
Source: Tables 2, 16, 23, 24, 28, 29, and 38.Note: Percentages may not add to subtotals or 100.0 because of rounding.
Turned over toother agency
9,3330.6%
released41,9402.7%
Complaint Sought806,68652.0%
Turned over toother agency
5,7980.4%
released23,3271.5%
Complaint Sought427,96027.6%
Turned over toother agency
5910.0%
Handled Within Department
5,7170.4%
Juvenile Court/Probation Dept.
59,8833.9%
Turned over toother agency
2,1140.1%
Handled Within Department
38,7032.5%
Juvenile Court/Probation Dept.
129,8488.4%
Homicide2,2580.3%
arson11,4001.3%
larceny-Theftover $400
223,35025.3%
motor VehicleTheft
220,12624.9%
Burglary237,75926.9%
aggravated assault109,48612.4%
robbery70,7028.0%
forcible rape9,0471.0%
reported Crimes
884,128100.0%
CRIME IN CALIFORNIA, 2007
vi CRIME IN CALIFORNIA, 2007

adult felony arrest
Dispositions
100.0%
law enforcement
releases3.1%
Complaintsfiled84.1%
ComplaintsDenied12.8%
Convicted69.4%
not Convicted
14.6%
State institutions12.9%
Probation/Jail40.1%
Jail3.0%
Probation10.4%
fine/other3.0%
Court Dismissals
14.4%
acquittals0.2%
The criminal justice system has been described as a sequence of events starting with entry into the system, then proceeding to prosecution and pretrial services, adjudication, sentencing and sanctions, and ending with corrections. Crime in California, 2007 provides insight to this sequence of events by providing information on the number of reported crimes, arrests, dispositions, adult corrections and other relevant information.
Figure 1 provides an overview of this process by showing the number of reported crimes, arrests, and adult felony dispositions reported in 2007. Each measures the end of a stage: crimes are reported after they occur, arrests
AT A GLANCE
AT A GLANCE vii
are conducted immediately following an observation byanofficerorat theconclusionofan investigation,anddispositionsarethefinalstageoftheadjudicationprocess. The time between each stage, the reporting parties, and the reporting procedures for each data collection system vary.
While the reader is encouraged to recognize the relationship between crime, arrest and disposition data, the reader is cautioned not to make comparisons. See Appendix 1 for a complete list of data characteristics and known limitations.

Crimes
2 CRIME IN CALIFORNIA, 2007
Section 15 of the California Penal Code defines acrime as “an act specifically prohibited by law or,failure to perform an act specifically required by lawfor which punishment is prescribed."
In addition to preparing statistical reports such as Crime in California, the DOJ compiles and reports data to the Federal Bureau of Investigation (FBI) on crime inCaliforniatofulfillthedatareportingrequirementsofthe national Uniform Crime Reporting (UCR) program. The UCR program standardizes crime reporting across all states to eliminate differences in Penal Code definitions.
States are required to report statistics on the following eight offenses known as Part 1 crimes: homicide, forcible rape, robbery, aggravated assault, burglary, larceny-theft, motor vehicle theft, and arson. The FBI selected these eight crimes for the UCR because of the seriousness of the offenses, the frequency of occurrence, and the likelihood of their being reported to law enforcement. Other than larceny-theft, the UCR does not count misdemeanors or infractions.
At the DOJ, Part 1 crimes are further categorized as follows: Violent crimes include homicide, forcible rape, robbery, and aggravated assault. Property crimes include burglary, motor vehicle theft, and larceny-theft over $400.
Some crimes, even Part 1 crimes, are undetected by law enforcement and/or not reported by the public. Undetected and unreported crimes are one reason that crimes in California produce an unknown amount of under-reporting to the DOJ. A second reason for under-reporting is a result of the ‘hierarchy rule’. The hierarchy rule is a method used in reporting crime statistics under UCR guidelines whereby only the most serious offense is reported. This is an issue only when multiple offenses occur at the same time, during the same criminal event. For example, if a victim was murdered during a robbery, under the UCR guidelines, only the murder would be reported. There is one exception to the hierarchy rule. Since arson frequently occurs at the same time as other crimes, arson is counted in addition to the most serious offense.
CRIME IN CALIFORNIA, 2007

0.0
500.0
1,000.0
1,500.0
2,000.0
2,500.0
3,000.0
3,500.0
07060504030201009998979695949392919089888786858483
YEAR
RA
TE
PROPERTY CRIMES
VIOLENT CRIMES
CRIMES 3
Figure 2Crime in California, 1983–2007
By CategoryRate per 100,000 Population
Source: Table 1.
The above chart displays violent and property crime rates since 1983.
Comparing 1983 to 2007:
The violent crime rate decreased 34.6 percent (from 775.6 to 507.0).
The violent crime rate increased through the 1980s to a peak in 1992 of almost 1,104 for every 100,000 persons in California. It has since decreased each year, with the exception of a slight increase in 2006, resulting in the current rate of 507 violent crimes for every 100,000 Californians. The rate for 2007 is 54 percent lower than the peak in 1992.
The property crime rate decreased 43.0 percent (from 3,166.1 to 1,803.6).
The property crime rate in California has fluctuatedgreatly. Since peaking in 1989 at 3,332 crimes for every 100,000 Californians, the rate declined steadily overall through the 1990s before increasing each year from 2000 through 2005. More recently, California’s property crime rate has decreased for each of the last two years.
It should be noted that over the last 25 years, California has experienced changes in laws as well, as data reporting and collection procedures. Such changes can have an effect of increasing or decreasing the number of reported crimes, and therefore, crime rates. In 1986 for example, law enforcement agencies were compelled to report domestic violence as criminal events. The reporting of domestic violence crimes contributed to a 35 percent increase in aggravated assault from 1985 to 1986. Such changes in reporting should be considered when comparing data from year to year.
CRIME TRENDS, 1983–2007

CRIME IN CALIFORNIA, 2007
4 CRIME IN CALIFORNIA, 2007
Violent and Property Crimes
Figure 3CRIME IN CALIFORNIA, 2002–2007Violent and Property Crimes By Number
Source: Table 2.
in 2007:
There were 191,493 violent crimes reported.
There were 681,235 property crimes reported.
from 2006 to 2007:
Violent crimes decreased 1.4 percent in number.
Property crimes decreased 3.7 percent in number.
Comparing 2002 to 2007:
Violent crimes decreased 7.9 percent in number.
Property crimes increased 2.0 percent in number.
0
200,000
400,000
600,000
800,000
200720062005200420032002
NU
MB
ER
PROPERTY CRIME
VIOLENT CRIME
For the first time since 1999, the number of violent and property crimes both decreased (see Table 1).
CRIMES
CRIMES 5
Violent Crimes
Figure 5VIOLENT CRIMES, 2002–2007Rate per 100,000 Population
Source: Table 2.
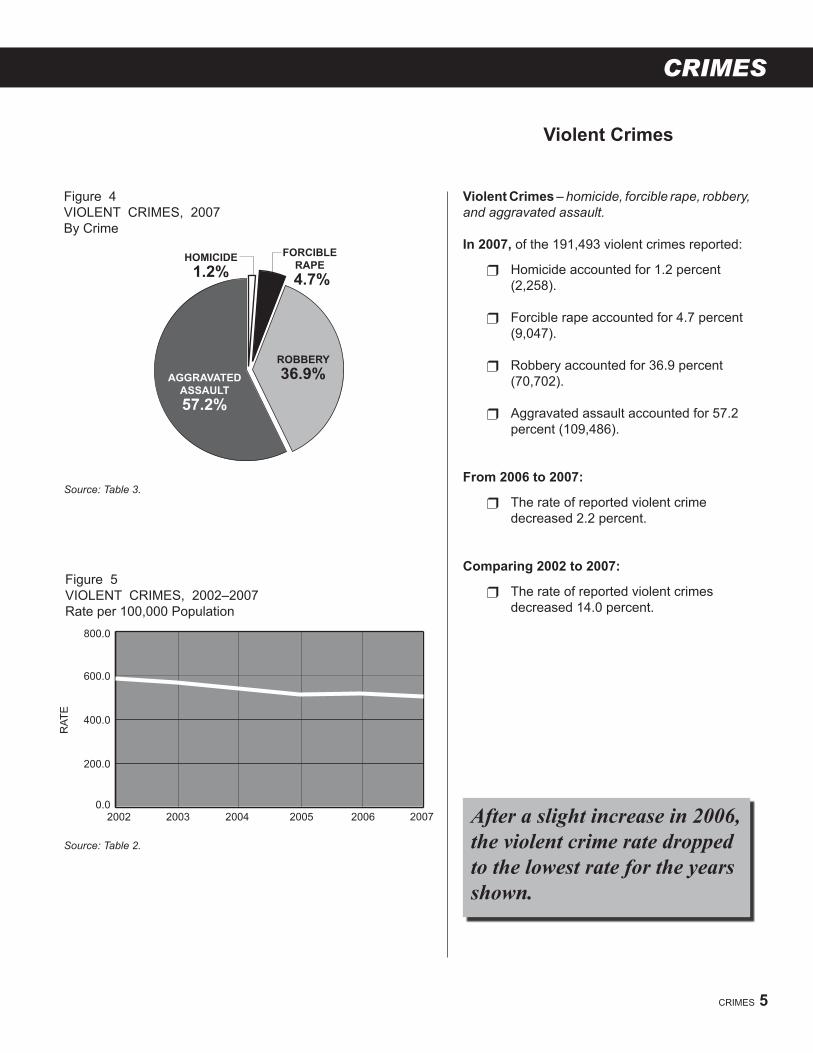
Violent Crimes – homicide, forcible rape, robbery, and aggravated assault.
in 2007, of the 191,493 violent crimes reported:
Homicide accounted for 1.2 percent (2,258).
Forcible rape accounted for 4.7 percent (9,047).
Robbery accounted for 36.9 percent (70,702).
Aggravated assault accounted for 57.2 percent (109,486).
from 2006 to 2007:
The rate of reported violent crime decreased 2.2 percent.
Comparing 2002 to 2007:
The rate of reported violent crimes decreased 14.0 percent.
After a slight increase in 2006, the violent crime rate dropped to the lowest rate for the years shown.
0.0
200.0
400.0
600.0
800.0
200720062005200420032002
RA
TE
Source: Table 3.
Figure 4VIOLENT CRIMES, 2007By Crime
ROBBERY
36.9%AGGRAVATEDASSAULT
57.2%
FORCIBLERAPE
4.7%
HOMICIDE
1.2%

CRIME IN CALIFORNIA, 2007
0.0
2.0
4.0
6.0
8.0
200720062005200420032002
RAT
E
6 CRIME IN CALIFORNIA, 2007
Figure 7HOMICIDE CRIMES, 2002–2007Rate per 100,000 Population
Homicide – The willful (nonnegligent) killing of one human being by another. Murder and nonnegligent manslaughter comprise this category.
in 2007, of the 2,258 homicides reported, the type of weapon was known in 2,224 cases (98.5 percent). Of these:
Firearms accounted for 72.4 percent (1,611).
Knives or cutting instruments accounted for 13.4 percent (298).
Blunt objects (clubs, etc.) accounted for 4.2 percent (94).
Personal weapons (hands, feet, etc.) accounted for 5.3 percent (118).
Other weapons accounted for 4.6 percent (103).
from 2006 to 2007:
The rate of reported homicides decreased 9.1 percent.
Comparing 2002 to 2007:
The rate of reported homicides decreased 11.8 percent.
Source: Table 2.
FIREARM
72.4%KNIFE
OR CUTTINGINSTRUMENT
13.4%
PERSONALWEAPON
5.3%BLUNT
OBJECT
4.2%
OTHER
4.6%
Source: Table 4.Note: Percentages do not add to 100.0 because of rounding.
Figure 6HOMICIDE CRIMES, 2007By Type of Weapon Used
Homicide
The 2007 homicide rate of 6.0 per 100,000 is the lowest since 2000 (see Table 1).
CRIMES
0.0
25.0
50.0
75.0
200720062005200420032002
RA
TE
TOTAL POPULATION
FEMALE POPULATION
CRIMES 7
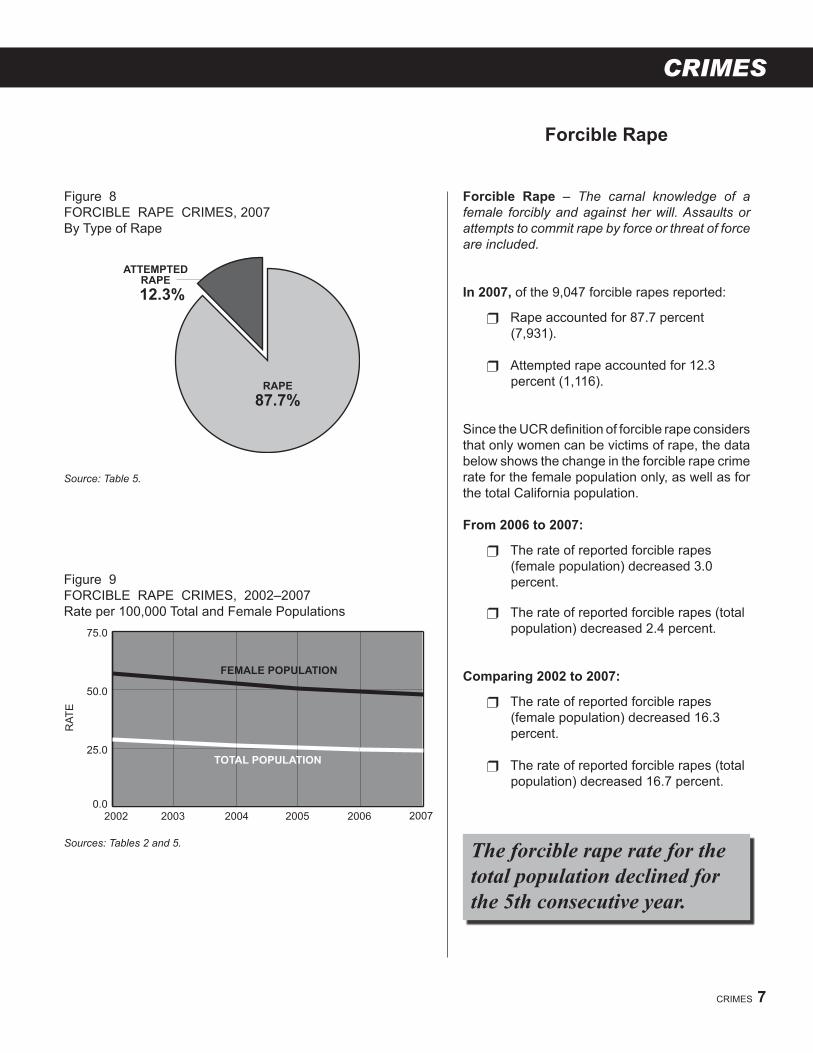
forcible rape
Figure 9FORCIBLE RAPE CRIMES, 2002–2007Rate per 100,000 Total and Female Populations
Sources: Tables 2 and 5.
RAPE
87.7%
ATTEMPTEDRAPE
12.3%
Figure 8FORCIBLE RAPE CRIMES, 2007By Type of Rape
Source: Table 5.
forcible rape – The carnal knowledge of a female forcibly and against her will. Assaults or attempts to commit rape by force or threat of force are included.
in 2007, of the 9,047 forcible rapes reported:
Rape accounted for 87.7 percent (7,931).
Attempted rape accounted for 12.3 percent (1,116).
SincetheUCRdefinitionofforciblerapeconsidersthat only women can be victims of rape, the data below shows the change in the forcible rape crime rate for the female population only, as well as for the total California population.
from 2006 to 2007:
The rate of reported forcible rapes (female population) decreased 3.0 percent.
The rate of reported forcible rapes (total population) decreased 2.4 percent.
Comparing 2002 to 2007:
The rate of reported forcible rapes (female population) decreased 16.3 percent.
The rate of reported forcible rapes (total population) decreased 16.7 percent.
The forcible rape rate for the total population declined for the 5th consecutive year.

CRIME IN CALIFORNIA, 2007
HIGHWAY
49.3%
COMMERCIAL
21.1%
BANK
1.7%
RESIDENTIAL
8.0%
OTHER
19.9%
8 CRIME IN CALIFORNIA, 2007
robbery
robbery – The taking or attempting to take anything of value from the care, custody, or control of a person or persons by force or threat of force or violence and/or by putting the victim in fear.
in 2007, of the 70,702 robberies reported:
Highway robbery (streets, parks, parking lots, etc.) accounted for 49.3 percent (34,880).
Commercial robbery accounted for 21.1 percent (14,922).
Residential robbery accounted for 8.0 percent (5,674).
Bank robbery accounted for 1.7 percent (1,178).
Robberies that occurred in other locations (churches, schools, trains, etc.) accounted for 19.9 percent (14,048).
Figure 10ROBBERY CRIMES, 2007By Location
Source: Table 6.

CRIMES
0.0
50.0
100.0
150.0
200.0
200720062005200420032002
RAT
E
Figure 12ROBBERY CRIMES, 2002–2007Rate per 100,000 Population
Source: Table 2.
ARMED
52.0%STRONG-ARM
48.0%
0
64.0% 18.0%
FIREARM
KNIFE OR CUTTING INSTRUMENT
OTHER DANGEROUS WEAPON
17.9%
CRIMES 9
robbery (cont.)
Figure 11ROBBERY CRIMES, 2007By Type of Robbery and Type of Weapon, if Armed
in 2007, of all robberies reported:
Armed robbery accounted for 52.0 percent (36,744).
Strong-arm robbery accounted for 48.0 percent (33,958).
Of the 36,744 armed robberies reported:
Firearms were involved in 64.0 percent (23,519).
Knives or cutting instruments were involved in 18.0 percent (6,632).
Other dangerous weapons were involved in 17.9 percent (6,593).
from 2006 to 2007:
The rate of reported robberies decreased 1.2 percent.
Comparing 2002 to 2007:
The rate of reported robberies increased 2.0 percent.
Source: Table 6.Note: Percentages do not add to 100.0 because of rounding.
After increasing for two years, the robbery rate decreased 1.2 percent.
CRIME IN CALIFORNIA, 2007
KNIFEOR CUTTINGINSTRUMENT
15.9%OTHERDANGEROUS
WEAPON
36.5%
FIREARM
19.8%PERSONALWEAPON
27.7%1
0.0
100.0
200.0
300.0
400.0
200720062005200420032002
RA
TE
10 CRIME IN CALIFORNIA, 2007
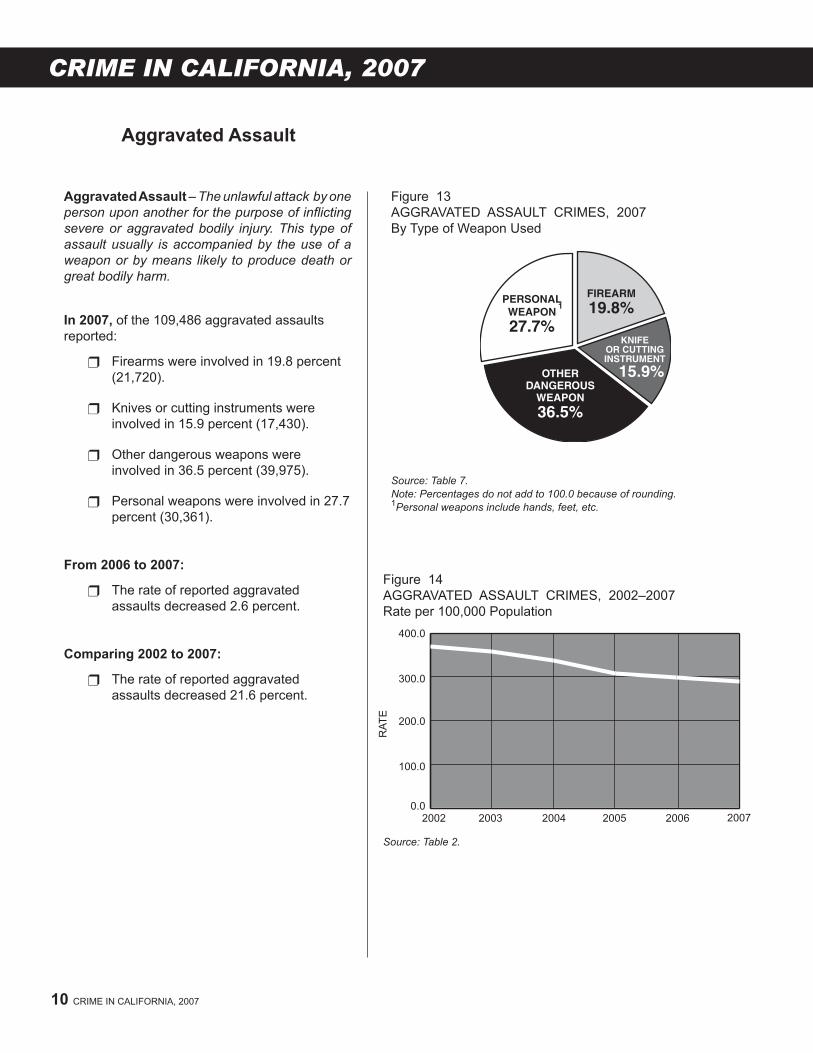
aggravated assault
Figure 14AGGRAVATED ASSAULT CRIMES, 2002–2007Rate per 100,000 Population
aggravated assault – The unlawful attack by one person upon another for the purpose of inflicting severe or aggravated bodily injury. This type of assault usually is accompanied by the use of a weapon or by means likely to produce death or great bodily harm.
in 2007, of the 109,486 aggravated assaults reported:
Firearms were involved in 19.8 percent (21,720).
Knives or cutting instruments were involved in 15.9 percent (17,430).
Other dangerous weapons were involved in 36.5 percent (39,975).
Personal weapons were involved in 27.7 percent (30,361).
from 2006 to 2007:
The rate of reported aggravated assaults decreased 2.6 percent.
Comparing 2002 to 2007:
The rate of reported aggravated assaults decreased 21.6 percent.
Figure 13AGGRAVATED ASSAULT CRIMES, 2007By Type of Weapon Used
Source: Table 2.
Source: Table 7.Note: Percentages do not add to 100.0 because of rounding. 1Personal weapons include hands, feet, etc.
CRIMES
BURGLARY
34.9%
MOTORVEHICLE THEFT
32.3%
LARCENY-THEFT
OVER $400
32.8%
0.0
500.0
1,000.0
1,500.0
2,000.0
200720062005200420032002
RA
TE
CRIMES 11
Property Crimes
Figure 16PROPERTY CRIMES, 2002–2007Rate per 100,000 Population
Figure 15PROPERTY CRIMES, 2007By Crime
Source: Table 2.
Source: Table 3.
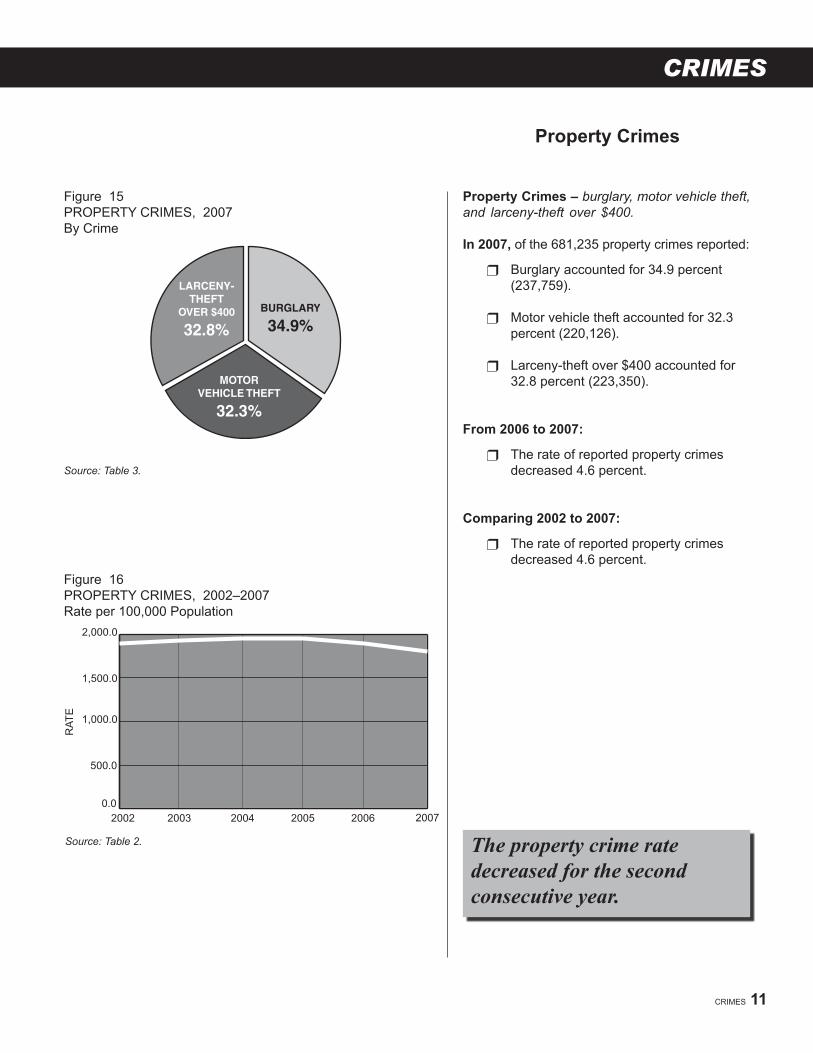
Property Crimes – burglary, motor vehicle theft, and larceny-theft over $400.
in 2007, of the 681,235 property crimes reported:
Burglary accounted for 34.9 percent (237,759).
Motor vehicle theft accounted for 32.3 percent (220,126).
Larceny-theft over $400 accounted for 32.8 percent (223,350).
from 2006 to 2007:
The rate of reported property crimes decreased 4.6 percent.
Comparing 2002 to 2007:
The rate of reported property crimes decreased 4.6 percent.
The property crime rate decreased for the second consecutive year.

CRIME IN CALIFORNIA, 2007
ATTEMPTEDBURGLARY
6.1%
BURGLARY
93.9%
59.5% 40.5%
FORCE NO FORCE
0.0
200.0
400.0
600.0
800.0
200720062005200420032002
RA
TE
Burglary
Figure 18BURGLARY CRIMES, 2002–2007Rate per 100,000 Population
Burglary – The unlawful entry of a structure to commit a felony or a theft. Attempted burglary is included.
in 2007, of the 237,759 burglaries and attempted burglaries reported:
Burglary accounted for 93.9 percent (223,232).
Attempted burglary accounted for 6.1 percent (14,527).
Of the 223,232 burglaries that occurred:
Structures entered by force accounted for 59.5 percent (132,877).
Structures entered without force accounted for 40.5 percent (90,355).
from 2006 to 2007:
The rate of reported burglaries decreased 4.4 percent.
Comparing 2002 to 2007:
The rate of reported burglaries decreased 6.4 percent.
Source: Table 2.
12 CRIME IN CALIFORNIA, 2007
Source: Table 8.
Figure 17BURGLARY CRIMES, 2007By Type of Burglary and Type of Entry

CRIMES
NIGHTTIME
26.9%
UNKNOWN
32.0% DAYTIME
41.1%
NONRESIDENTIAL
40.0%RESIDENTIAL
60.0%
CRIMES 13
Burglary (cont.)
Figure 19BURGLARY CRIMES, 2007By Location
Source: Table 8.
Source: Table 8.
in 2007, of all burglaries reported:
Residential burglary accounted for 60.0 percent (142,749).
Nonresidential burglary accounted for 40.0 percent (95,010). Included in this category are commercial establishments, public buildings, etc.
Daytime burglary accounted for 41.1 percent (97,737).
Nighttime burglary accounted for 26.9 percent (63,910).
Burglaries that occurred during an unknown hour accounted for 32.0 percent (76,112).
Figure 20BURGLARY CRIMES, 2007By Time of Day
CRIME IN CALIFORNIA, 2007
14 CRIME IN CALIFORNIA, 2007
motor Vehicle Theft
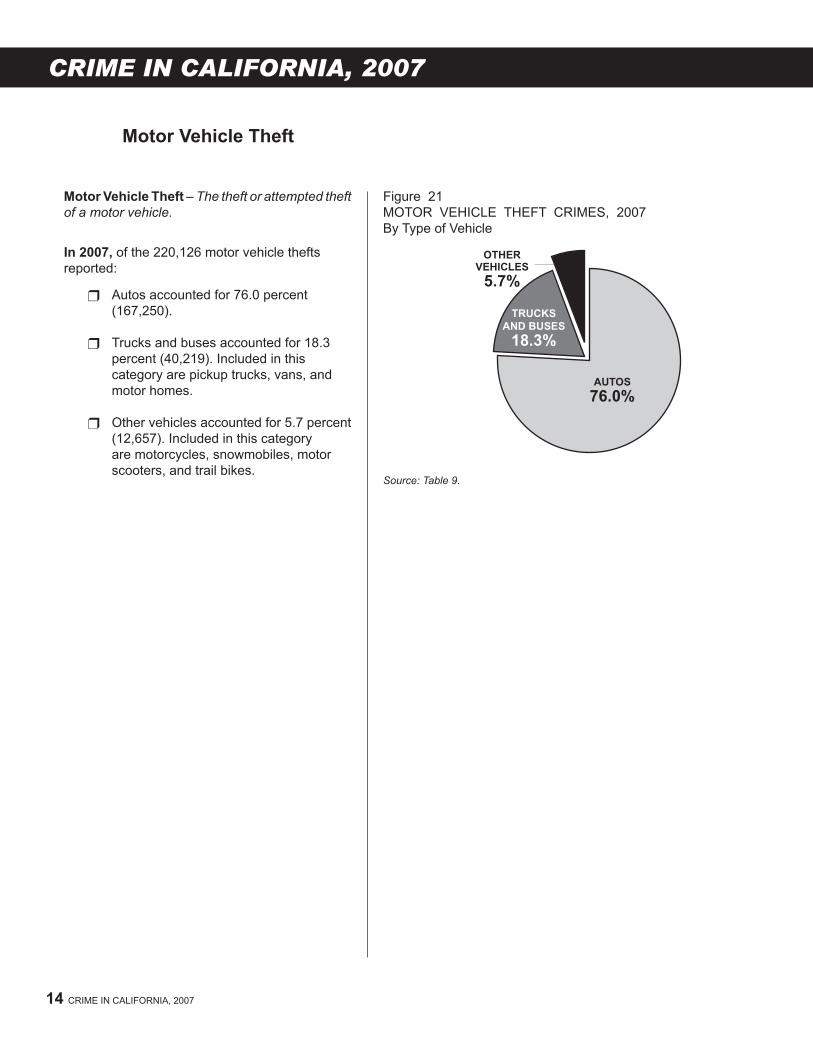
motor Vehicle Theft – The theft or attempted theft of a motor vehicle.
OTHERVEHICLES
5.7%
TRUCKSAND BUSES
18.3%
AUTOS
76.0%
Figure 21MOTOR VEHICLE THEFT CRIMES, 2007By Type of Vehicle
in 2007, of the 220,126 motor vehicle thefts reported:
Autos accounted for 76.0 percent (167,250).
Trucks and buses accounted for 18.3 percent (40,219). Included in this category are pickup trucks, vans, and motor homes.
Other vehicles accounted for 5.7 percent (12,657). Included in this category are motorcycles, snowmobiles, motor scooters, and trail bikes.
Source: Table 9.

CRIMES
0.0
200.0
400.0
600.0
800.0
200720062005200420032002
RAT
E
Figure 22MOTOR VEHICLE THEFT CRIMES, 2002–2007Rate per 100,000 Population
Source: Table 2.
CRIMES 15
motor Vehicle Theft (cont.)
from 2006 to 2007:
The rate of reported motor vehicle thefts decreased 10.1 percent.
Comparing 2002 to 2007:
The rate of reported motor vehicle thefts decreased 7.2 percent.
The motor vehicle theft rate decreased for the second consecutive year.

CRIME IN CALIFORNIA, 2007
$50-$199
18.2%$200-$400
15.6%
UNDER $50
32.1%OVER $400
34.1%
16 CRIME IN CALIFORNIA, 2007
larceny-Theft
larceny-Theft – The unlawful taking, carrying, leading, or riding away of property from the pos-session or constructive possession of another (except embezzlement, fraud, forgery, and worth-less checks).
in 2007, of the 654,481 larceny-thefts reported:
Thefts under $50 in value accounted for 32.1 percent (210,131).
Thefts $50 to $199 in value accounted for 18.2 percent (118,991).
Thefts $200 to $400 in value accounted for 15.6 percent (102,009).
Thefts over $400 in value accounted for 34.1 percent (223,350).
And,
Thefts from motor vehicles accounted for 39.2 percent (256,636).
Shoplifting accounted for 13.5 percent (88,412).
Thefts from buildings accounted for 13.0 percent (85,268).
Thefts of motor vehicle accessories accounted for 8.8 percent (57,762).
Thefts of bicycles accounted for 3.1 percent (20,074).
All other types of larceny-thefts accounted for 22.4 percent (146,329).
Figure 23LARCENY-THEFT CRIMES, 2007By Value Category of Loss
Source: Table 11.
Figure 24LARCENY-THEFT CRIMES, 2007By Type of Larceny-Theft
Source: Table 11.
In 2007, almost half of all larceny-theft crimes involved theft from motor vehicles and theft of motor vehicle accessories.
SHOP-LIFTING
13.5%
MOTORVEHICLE
ACCESSORIES
8.8%
ALLOTHER
22.4% FROM MOTOR
VEHICLES39.2%
FROMBUILDINGS
13.0%
BICYCLES
3.1%

CRIMES
Total larceny-thefts decreased in rate for the 4th consecutive year.
0.0
1,000.0
2,000.0
3,000.0
200720062005200420032002
RA
TE
Figure 25LARCENY-THEFT CRIMES, 2002–2007Rate per 100,000 Population
Source: Table 2.
CRIMES 17
larceny-Theft (cont.)
from 2006 to 2007:
The rate of total reported larceny-thefts decreased 2.7 percent.
Comparing 2002 to 2007:
The rate of total reported larceny-thefts decreased 14.1 percent.

CRIME IN CALIFORNIA, 2007
MOTORVEHICLES
$1,339,162,000
47.6%
ALLOTHER
$1,473,745,000
52.4%
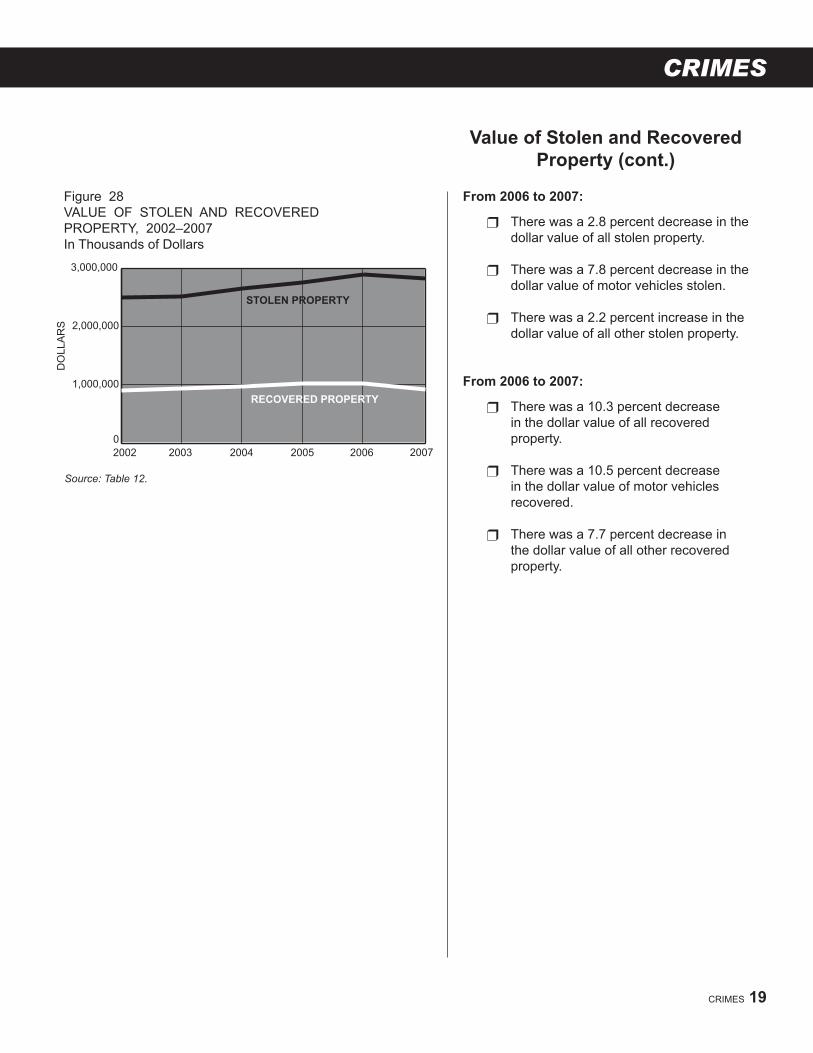
Value of Stolen andrecovered Property
Figure 26VALUE OF STOLEN PROPERTY, 2007By Type
As part of the UCR Program, law enforcement agencies report monthly on the estimated dollar value of property stolen and property recovered. While the type of property is categorized in a uniform manner for the reports, agencies do not report the data consistently and vary in their methods of estimating the dollar value of stolen property. Further, property stolen and property recovered in any given time period are not necessarily the same property. For these reasons, dollar values of such property must be viewed as rough estimates.
in 2007, of the total dollar value ($2,812,907,000) of all property reported stolen:
Motor vehicles accounted for $1,339,162,000 (47.6 percent).
All other property accounted for $1,473,745,000 (52.4 percent).
in 2007, of the total dollar value ($911,963,000) of property reported recovered:
Motor vehicles accounted for $838,472,000 (91.9 percent).
All other property accounted for $73,491,000 (8.1 percent).
Source: Table 12.Note: Dollar values are rounded to the nearest thousand.
18 CRIME IN CALIFORNIA, 2007
MOTOR VEHICLES$838,472,000
91.9%
ALL OTHER$73,491,000
8.1%
Source: Table 12.Note: Dollar values are rounded to the nearest thousand.
Figure 27VALUE OF RECOVERED PROPERTY, 2007By Type
In 2007, the value of stolen motor vehicles made up almost half of the total value of all stolen property in California.
CRIMES
0
1,000,000
2,000,000
3,000,000
200720062005200420032002
DO
LLA
RS
STOLEN PROPERTY
RECOVERED PROPERTY
CRIMES 19
Value of Stolen and recoveredProperty (cont.)
from 2006 to 2007:
There was a 2.8 percent decrease in the dollar value of all stolen property.
There was a 7.8 percent decrease in the dollar value of motor vehicles stolen.
There was a 2.2 percent increase in the dollar value of all other stolen property.
from 2006 to 2007:
There was a 10.3 percent decrease in the dollar value of all recovered property.
There was a 10.5 percent decrease in the dollar value of motor vehicles recovered.
There was a 7.7 percent decrease in the dollar value of all other recovered property.
Source: Table 12.
Figure 28VALUE OF STOLEN AND RECOVERED PROPERTY, 2002–2007In Thousands of Dollars

CRIME IN CALIFORNIA, 2007
20 CRIME IN CALIFORNIA, 2007
arson
arson – Any willful or malicious burning or attempt to burn, with or without intent to defraud, a dwelling house, public building, motor vehicle or aircraft, or the personal property of another, etc.
in 2007, of the 11,400 arsons reported:
Structural properties were targeted in 30.2 percent (3,438) of the offenses.
Mobile properties were targeted in 35.2 percent (4,011) of the offenses.
Other properties were targeted in 34.7 percent (3,951) of the offenses. Included in this category are crops, timber, fences, signs, etc.
in 2007, the total estimated value of all property damaged was $223,145,000. The value of damage resulting from arsons directed at:
Structural properties accounted for $136,763,000 (61.3 percent).
Mobile properties accounted for $45,506,000 (20.4 percent).
Other properties accounted for $40,876,000 (18.3 percent).
MOBILE
35.2%
OTHER
34.7%STRUCTURAL
30.2%
Figure 29ARSON CRIMES, 2007By Type of Property Targeted
Source: Table 14.Notes: Property type is determined by the point of origin of a fire. Percentages do not add to 100.0 because of rounding.
Figure 30ARSON CRIMES, 2007By Value of Property Damage
Source: Table 14.Notes: Property type is determined by the point of origin of a fire. Dollar values are rounded to the nearest thousand.
STRUCTURAL$136,763,000
61.3%
MOBILE$45,506,000
20.4%
OTHER$40,876,000
18.3%

CRIMES
0.0
20.0
40.0
60.0
200720062005200420032002
RA
TE
Figure 31ARSON CRIMES, 2002–2007Rate per 100,000 Population
Source: Table 2.
CRIMES 21
arson (cont.)
from 2006 to 2007:
The rate of reported arsons decreased 10.9 percent.
Comparing 2002 to 2007:
The rate of reported arsons decreased 23.9 percent.
After a slight increase in 2006, the arson rate decreased 10.9 percent in 2007.

CRIME IN CALIFORNIA, 2007
22 CRIME IN CALIFORNIA, 2007
Clearances
Crimes can be cleared by arrests or "exceptional means." An offense is cleared or "solved" for crime reporting purposes when at least one person is arrested, charged with the commission of the crime, and turned over to the court for prosecution or referred to juvenile authorities. In certain situations a clearance may be counted by "exceptional means" when the police definitelyknow the identity of the offender, have enough information to support an arrest, and know the location of the offender but for some reason cannot take the offender into custody.
A clearance rate is the percentage obtained when the number of clearances reported are divided by the number of crimes reported.
in 2007,
Homicide had the highest clearance rate (53.5 percent).
Motor vehicle theft had the lowest clearance rate (8.4 percent).
Figure 32CRIME IN CALIFORNIA, 2007Clearance Rate by Crime
Source: Table 15.
ARSON
TOTAL LARCENY-THEFT
MOTORVEHICLE THEFT
BURGLARY
AGGRAVATEDASSAULT
ROBBERY
FORCIBLE RAPE
HOMICIDE 53.5%
26.3%
8.4%
51.7%
13.0%
43.4%
12.5%
15.1%

CRIMES
0.0
20.0
40.0
60.0
200720062005200420032002
CLE
AR
AN
CE
RA
TE
VIOLENT CRIMES
Figure 33CRIME IN CALIFORNIA, 2002–2007Clearance Rate by Crime Category
Source: Table 15.Note: Since clearance data are not collected for larceny-theft over $400, total
property crime clearances and clearance rates are unavailable. See "Data Characteristics and Known Limitations" in Appendix 1.
CRIMES 23
Clearances (cont.)
from 2006 to 2007:
The violent crime clearance rate increased from 40.7 to 42.0 percent.
Comparing 2002 to 2007:
The violent crime clearance rate decreased from 46.1 to 42.0 percent.
After declining for three consecutive years, the violent crime clearance rate increased 3.2 percent in 2007 .

Arrests
CRIME IN CALIFORNIA, 2007
WHaT iS an arreST?
Arrests occur when persons are taken into custody because they are believed to have violated the law. Not all arrests result in persons being placed in jail. Arrestees may be released by the arresting agency, post bail, or released on their own recognizance to appear in court at a later date. Some persons are simply issued citations which direct them to appear in court.
Arrests are divided into two major groups: felony arrests and misdemeanor arrests. An arrest for a felony-level offense can result in a sentence to state prison if the offender is convicted as an adult. An arrest for a misdemeanor-level offense can result in a sentence of up to one year in a county jail, a fine, probation,restitution, or any combination of the four.
Juveniles may also be arrested for truancy, incorrigibility, running away, and curfew violations. These are commonly referred to as status offenses since agency intervention is based solely on the juvenile's status as a minor. Status offenses are acts that would not be "crimes" if committed by adults.
HoW are arreSTS rePorTeD?
Unlike crimes, which are classified by nationwide Uniform Crime Reporting (UCR) standards, arrests arereported by the California statute definition of the
26 CRIME IN CALIFORNIA, 2007
particular offense. This may cause some differences inthedefinitionsofcertaincrimesandthereportingofthe arrests for those crimes. For instance, theft from a locked automobile is a burglary by California Penal Code definition, but according to the UCR definition,the crimewouldbeclassifiedand reportedasa theft.The arrest statistics in this section are consistent with the definitions provided by the respective Californiastatute, as shown in Appendix 3.
California law enforcement agencies report arrest and citation information to the DOJ on the Monthly Arrest and Citation Register, which lists each arrestee; includes information on age, gender, race/ethnicity; and specifies the "most serious" arrest offense and lawenforcement disposition.
WHaT iS an aT-riSK arreST raTe?
An arrest rate describes the number of arrests made by law enforcement agencies per 100,000 total population or per 100,000 population considered to be at risk for arrest. The following section includes three at-risk comparison populations: total (10–69 years of age), adult (18–69 years of age), and juvenile (10–17 years of age). The formula used to calculate at-risk rates can be found in Appendix 2.
ARREST TRENDS 1966–2007
0
2,500
5,000
7,500
070500 95 90 85 80 75 70 66
AT-
RIS
K R
AT
E
YEAR
FELONY
MISDEMEANOR
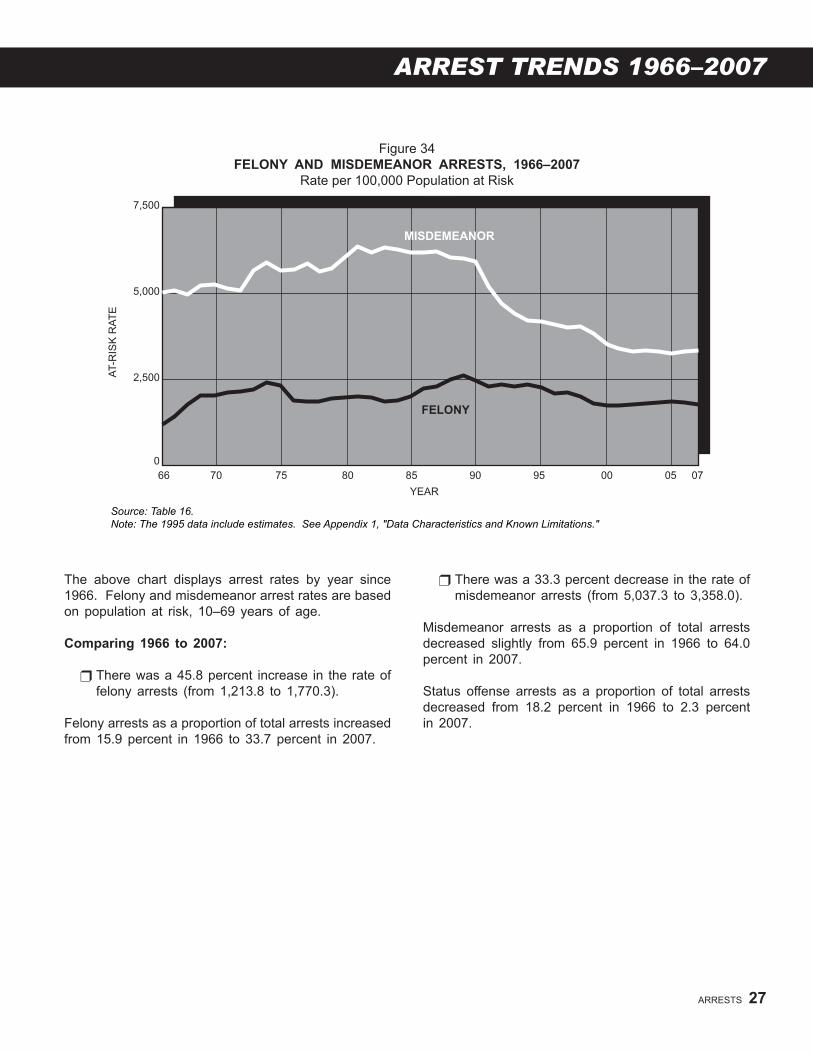
Figure 34felonY anD miSDemeanor arreSTS, 1966–2007
Rate per 100,000 Population at Risk
The above chart displays arrest rates by year since 1966. Felony and misdemeanor arrest rates are based on population at risk, 10–69 years of age.
Comparing 1966 to 2007:
There was a 45.8 percent increase in the rate of felony arrests (from 1,213.8 to 1,770.3).
Felony arrests as a proportion of total arrests increased from 15.9 percent in 1966 to 33.7 percent in 2007.
Source: Table 16.Note: The 1995 data include estimates. See Appendix 1, "Data Characteristics and Known Limitations."
ARRESTS 27
There was a 33.3 percent decrease in the rate of misdemeanor arrests (from 5,037.3 to 3,358.0).
Misdemeanor arrests as a proportion of total arrests decreased slightly from 65.9 percent in 1966 to 64.0 percent in 2007.
Status offense arrests as a proportion of total arrests decreased from 18.2 percent in 1966 to 2.3 percent in 2007.

CRIME IN CALIFORNIA, 2007
28 CRIME IN CALIFORNIA, 2007
Total arrests
MISDEMEANOR
STATUSOFFENSES
2.3%
FELONY
33.7%
1
64.0%
ADULT
84.7%
JUVENILE
15.3%
Source: Table 18.1 Status offenses include truancy, incorrigibility, running away, and curfew violations.
Figure 35TOTAL ARRESTS, 2007By Adult and Juvenile
Source: Table 18.
Figure 36TOTAL ARRESTS, 2007By Level of Offense
in 2007, of the 1,551,900 arrests reported:
Adult arrests accounted for 84.7 percent (1,315,044).
Juvenile arrests accounted for 15.3 percent (236,856).
And,
Felony arrests accounted for 33.7 percent (523,276).
Misdemeanor arrests accounted for 64.0 percent (992,588).
Status offense arrests accounted for 2.3 percent (36,036).

ARRESTS
4,500.0
5,000.0
5,500.0
200720062005200420032002
AT-
RIS
K R
AT
E
ADULT
TOTAL
JUVENILE
0
Source: Table 17.
Figure 37TOTAL ARRESTS, 2002–2007Rate per 100,000 Population at Risk
from 2006 to 2007: There was a 0.3 percent decrease in
the rate of total arrests.
There was virtually no change in the rate of adult arrests and a 1.6 percent decrease in the rate of juvenile arrests.
Comparing 2002 to 2007: There was a 0.5 percent increase in
the rate of total arrests.
There was a 1.2 percent increase in the rate of adult arrests and a 3.1 percent decrease in the rate of juvenile arrests.
Total arrests (cont.)
ARRESTS 29

CRIME IN CALIFORNIA, 2007
0.0
1,000.0
2,000.0
3,000.0
4,000.0
200720062005200420032002
AT-
RIS
K R
AT
EFELONY
STATUS OFFENSES
MISDEMEANOR
1
Figure 38TOTAL ARRESTS, 2002–2007By Level of OffenseRate per 100,000 Population at Risk
from 2006 to 2007: There was a 3.2 percent decrease in
the rate of felony arrests.
There was a 1.4 percent increase in the rate of misdemeanor arrests.
There was a 4.5 percent decrease in the rate of arrests for status offenses.
Comparing 2002 to 2007: There was a 0.8 percent decrease in
the rate of felony arrests.
There was a 1.5 percent increase in the rate of misdemeanor arrests.
There was a 4.9 percent decrease in the rate of status offense arrests.
30 CRIME IN CALIFORNIA, 2007
Source: Table 17.1 Status offenses include truancy, incorrigibility, running away, and curfew violations.
After increasing for five years, the felony arrest rate decreased for a second straight year (see Table 16).
Total arrests (cont.)

ARRESTS
ARRESTS 31
felony arrests
in 2007, of the 523,276 felony arrests reported:
Violent offenses accounted for 24.7 percent (129,433).
Property offenses accounted for 27.1 percent (142,006).
Drug offenses accounted for 27.5 percent (143,692).
All other offenses accounted for 20.7 percent (108,145).
And,
Adult arrests accounted for 87.4 percent (457,085).
Juvenile arrests accounted for 12.6 percent (66,191).
0 20 40 60 80 100
ALL OTHER
DRUG
PROPERTY
VIOLENT
TOTAL
OFFENSES
PERCENT
87.4% 12.6%
86.1% 13.9%
81.9% 18.1%
96.2% 3.8%
84.3% 15.7%
ADULT
JUVENILE
OFFENSES
OFFENSES
DRUGOFFENSES
27.5%
ALLOTHER
20.7%VIOLENT
OFFENSES
24.7%
PROPERTYOFFENSES
27.1%
Figure 40FELONY ARRESTS, 2007Category by Adult and Juvenile Arrests
Figure 39FELONY ARRESTS, 2007By Category
Source: Table 21.
Source: Table 19.

CRIME IN CALIFORNIA, 2007
32 CRIME IN CALIFORNIA, 2007
felony arrests (cont.)
from 2006 to 2007: There was a 3.3 percent decrease in
the rate of adult felony arrests and a 1.7 percent decrease in the rate of juvenile felony arrests.
Comparing 2002 to 2007: There was a 1.2 percent decrease in
the rate of adult felony arrests and a 1.1 percent increase in the rate of juvenile felony arrests.
0
1,500.0
2,000.0
2,500.0
200720062005200420032002
AT-
RIS
K R
AT
E ADULT
TOTAL
JUVENILE
Figure 41ADULT AND JUVENILEFELONY ARRESTS, 2002–2007Rate per 100,000 Population at Risk
Source: Table 17.

ARRESTS
ARRESTS 33
arrests for Violent offenses
Violent offense arrests – felony arrests for homicide, forcible rape, robbery, assault, and kidnapping.
in 2007, of the 129,433 felony arrests for violent offenses:
Homicide accounted for 1.6 percent (2,017).
Forcible rape accounted for 1.7 percent (2,164).
Robbery accounted for 16.7 percent (21,614).
Assault accounted for 78.7 percent (101,838).
Kidnapping accounted for 1.4 percent (1,800).
And,
Adult arrests accounted for 86.1 percent (111,383).
Juvenile arrests accounted for 13.9 percent (18,050).
0 20 40 60 80 100
KIDNAPPING
ASSAULT
ROBBERY
FORCIBLE RAPE
HOMICIDE
TOTAL 86.1% 13.9%
88.3% 11.7%
PERCENT
88.9% 11.1%
68.2% 31.8%
89.6% 10.4%
95.2% 4.8%
ADULT
JUVENILE
ROBBERY
16.7%
ASSAULT
78.7%
HOMICIDE1.6%
KIDNAPPING1.4%
FORCIBLE RAPE1.7%
Figure 42FELONY ARRESTS FOR VIOLENT OFFENSES, 2007By Offense
Source: Table 20.Note: Percentages do not add to 100.0 because of rounding.
Figure 43FELONY ARRESTS FOR VIOLENT OFFENSES, 2007Offense by Adult and Juvenile Arrests
Source: Table 21.

CRIME IN CALIFORNIA, 2007
34 CRIME IN CALIFORNIA, 2007
arrests for Violent offenses(cont.)
from 2006 to 2007: There was a 1.3 percent increase
in the rate of total arrests for violent offenses.
There was a 1.2 percent increase in the rate of adult arrests and a 2.3 percent increase in the rate of juvenile arrests.
Comparing 2002 to 2007: There was a 9.5 percent decrease
in the rate of total arrests for violent offenses.
There was an 11.7 percent decrease in the rate of adult arrests and a 6.9 percent increase in the rate of juvenile arrests.
0.0
300.0
400.0
500.0
600.0
200720062005200420032002
AT-R
ISK
RAT
E
ADULT
TOTAL
JUVENILE
Figure 44FELONY ARRESTS FORVIOLENT OFFENSES, 2002–2007Rate per 100,000 Population at Risk
Source: Table 22.
ARRESTS
0.0
2.0
4.0
6.0
8.0
10.0
200720062005200420032002
AT-
RIS
K R
AT
E
ADULT
TOTAL
JUVENILE
ARRESTS 35
Homicide arrests
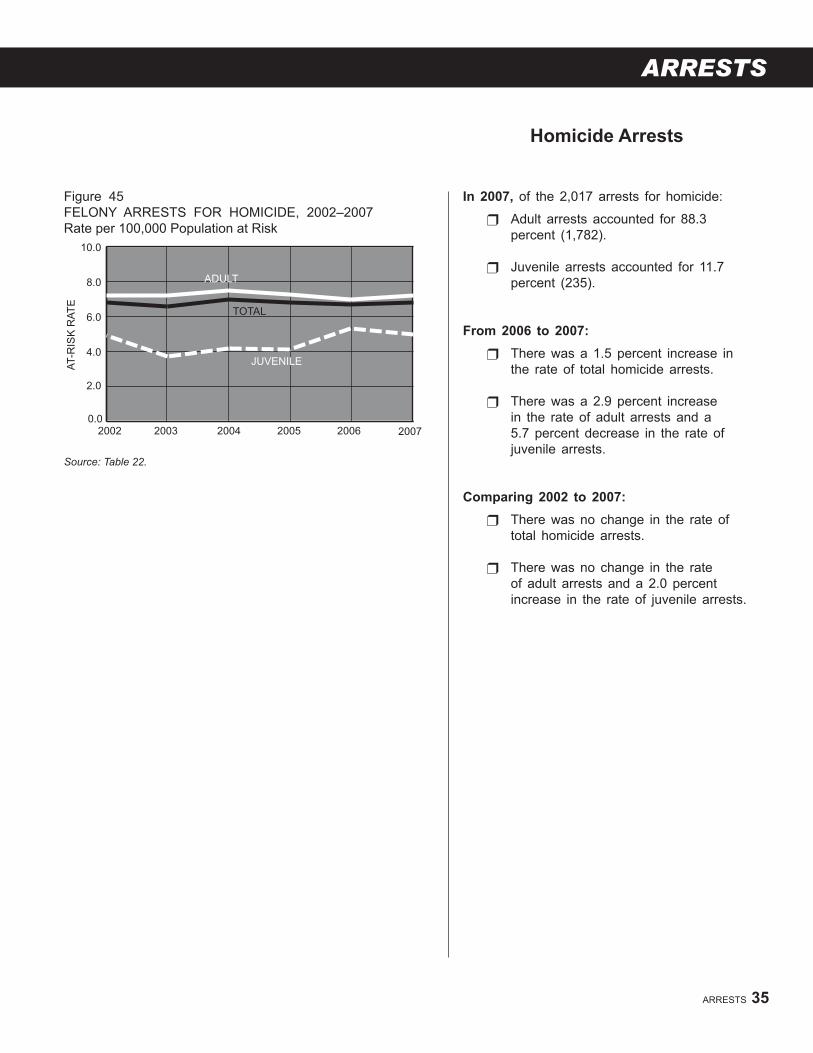
in 2007, of the 2,017 arrests for homicide:
Adult arrests accounted for 88.3 percent (1,782).
Juvenile arrests accounted for 11.7 percent (235).
from 2006 to 2007: There was a 1.5 percent increase in
the rate of total homicide arrests.
There was a 2.9 percent increase in the rate of adult arrests and a 5.7 percent decrease in the rate of juvenile arrests.
Comparing 2002 to 2007: There was no change in the rate of
total homicide arrests.
There was no change in the rate of adult arrests and a 2.0 percent increase in the rate of juvenile arrests.
Figure 45FELONY ARRESTS FOR HOMICIDE, 2002–2007Rate per 100,000 Population at Risk
Source: Table 22.
CRIME IN CALIFORNIA, 2007
0.0
2.0
4.0
6.0
8.0
10.0
200720062005200420032002
AT-
RIS
K R
AT
E
ADULT
TOTAL
JUVENILE
36 CRIME IN CALIFORNIA, 2007
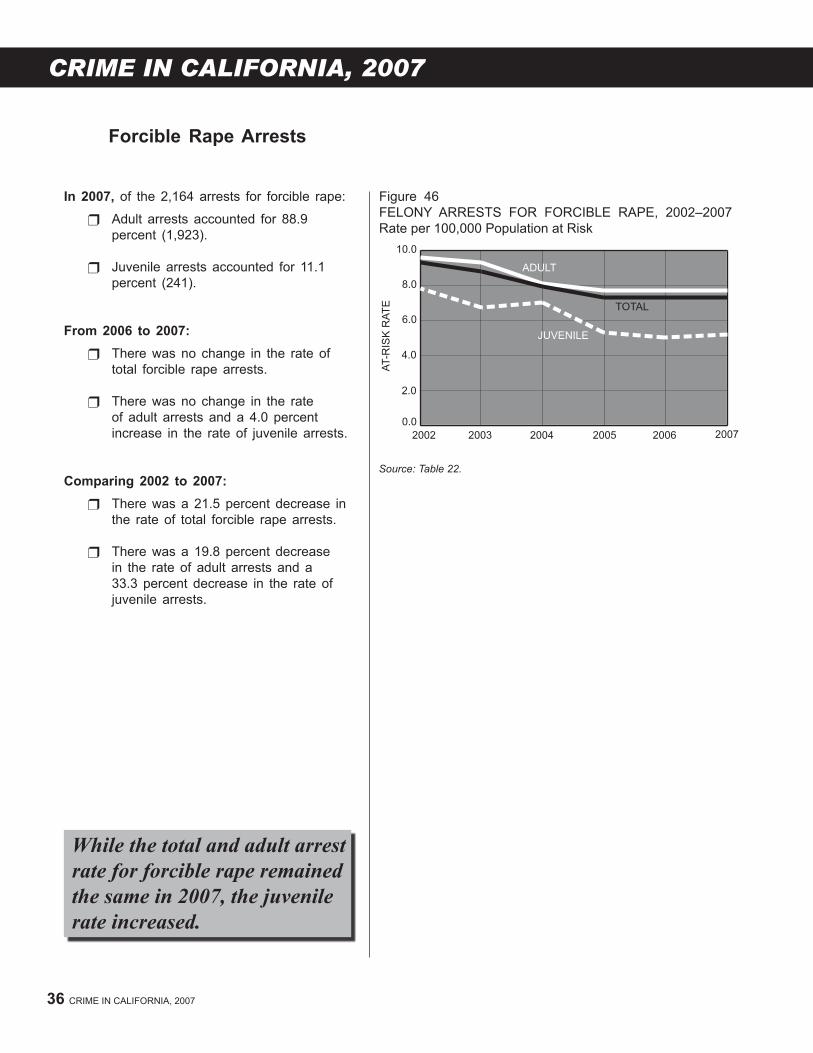
forcible rape arrests
in 2007, of the 2,164 arrests for forcible rape:
Adult arrests accounted for 88.9 percent (1,923).
Juvenile arrests accounted for 11.1 percent (241).
from 2006 to 2007: There was no change in the rate of
total forcible rape arrests.
There was no change in the rate of adult arrests and a 4.0 percent increase in the rate of juvenile arrests.
Comparing 2002 to 2007: There was a 21.5 percent decrease in
the rate of total forcible rape arrests.
There was a 19.8 percent decrease in the rate of adult arrests and a 33.3 percent decrease in the rate of juvenile arrests.
Figure 46FELONY ARRESTS FOR FORCIBLE RAPE, 2002–2007Rate per 100,000 Population at Risk
Source: Table 22.
While the total and adult arrest rate for forcible rape remained the same in 2007, the juvenile rate increased.
ARRESTS
0.0
50.0
100.0
150.0
200.0
200720062005200420032002
AT-
RIS
K R
AT
E
ADULT
JUVENILE
TOTAL
ARRESTS 37
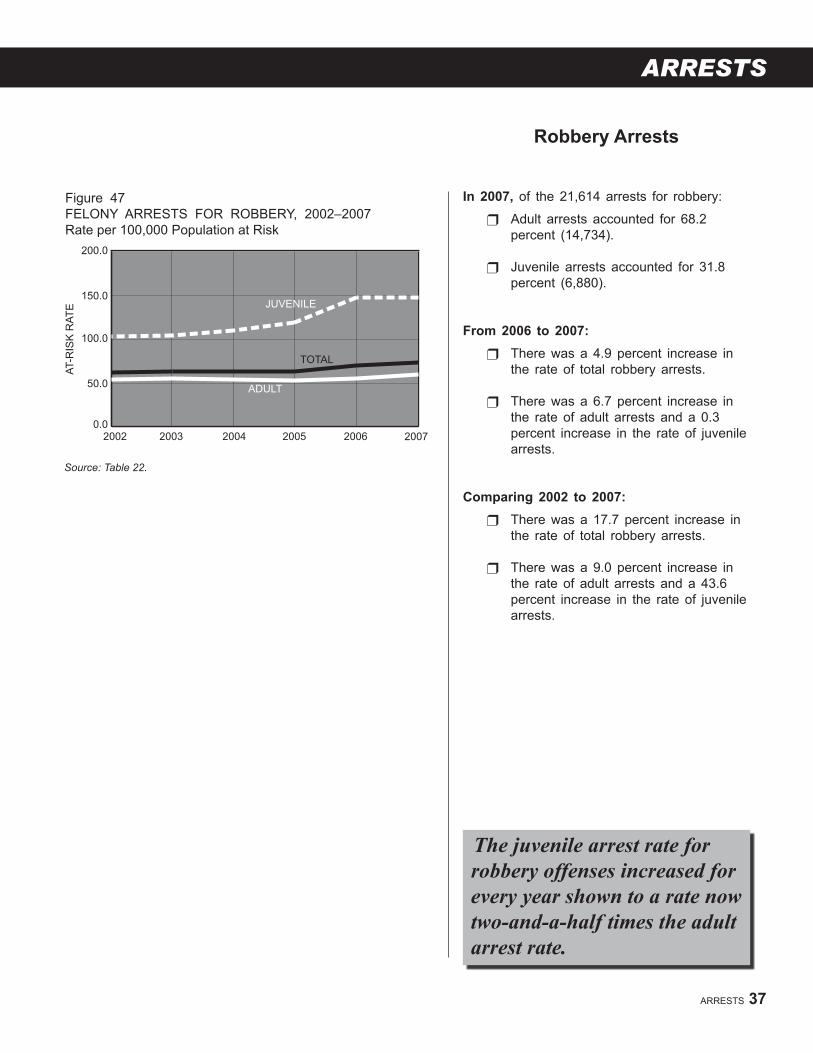
robbery arrests
in 2007, of the 21,614 arrests for robbery:
Adult arrests accounted for 68.2 percent (14,734).
Juvenile arrests accounted for 31.8 percent (6,880).
from 2006 to 2007: There was a 4.9 percent increase in
the rate of total robbery arrests.
There was a 6.7 percent increase in the rate of adult arrests and a 0.3 percent increase in the rate of juvenile arrests.
Comparing 2002 to 2007: There was a 17.7 percent increase in
the rate of total robbery arrests.
There was a 9.0 percent increase in the rate of adult arrests and a 43.6 percent increase in the rate of juvenile arrests.
Figure 47FELONY ARRESTS FOR ROBBERY, 2002–2007Rate per 100,000 Population at Risk
Source: Table 22.
The juvenile arrest rate for robbery offenses increased for every year shown to a rate now two-and-a-half times the adult arrest rate.
CRIME IN CALIFORNIA, 2007
38 CRIME IN CALIFORNIA, 2007
assault arrests
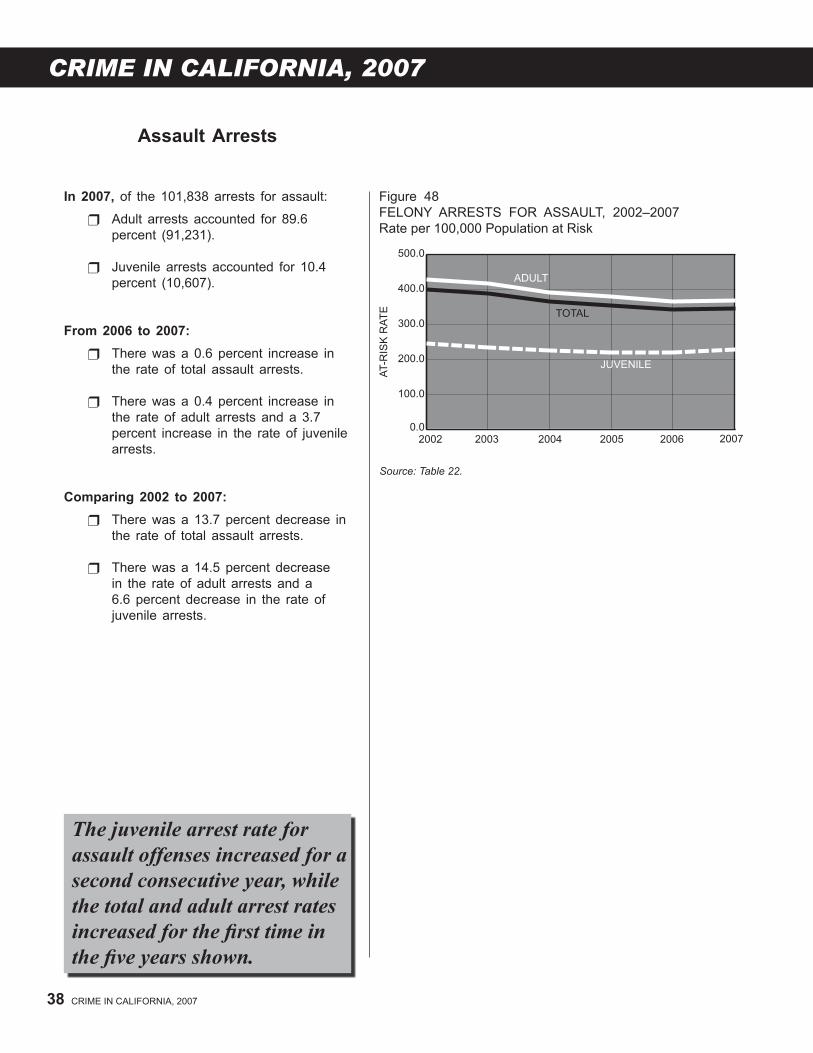
in 2007, of the 101,838 arrests for assault:
Adult arrests accounted for 89.6 percent (91,231).
Juvenile arrests accounted for 10.4 percent (10,607).
from 2006 to 2007: There was a 0.6 percent increase in
the rate of total assault arrests.
There was a 0.4 percent increase in the rate of adult arrests and a 3.7 percent increase in the rate of juvenile arrests.
Comparing 2002 to 2007: There was a 13.7 percent decrease in
the rate of total assault arrests.
There was a 14.5 percent decrease in the rate of adult arrests and a 6.6 percent decrease in the rate of juvenile arrests.
Figure 48FELONY ARRESTS FOR ASSAULT, 2002–2007Rate per 100,000 Population at Risk
Source: Table 22.
The juvenile arrest rate for assault offenses increased for a second consecutive year, while the total and adult arrest rates increased for the first time in the five years shown.
0.0
100.0
200.0
300.0
400.0
500.0
200720062005200420032002
AT-
RIS
K R
AT
E
ADULT
JUVENILE
TOTAL
ARRESTS
0.0
2.0
4.0
6.0
8.0
10.0
200720062005200420032002
AT-R
ISK
RAT
E
ADULT
JUVENILE
TOTAL
ARRESTS 39
Kidnapping arrests
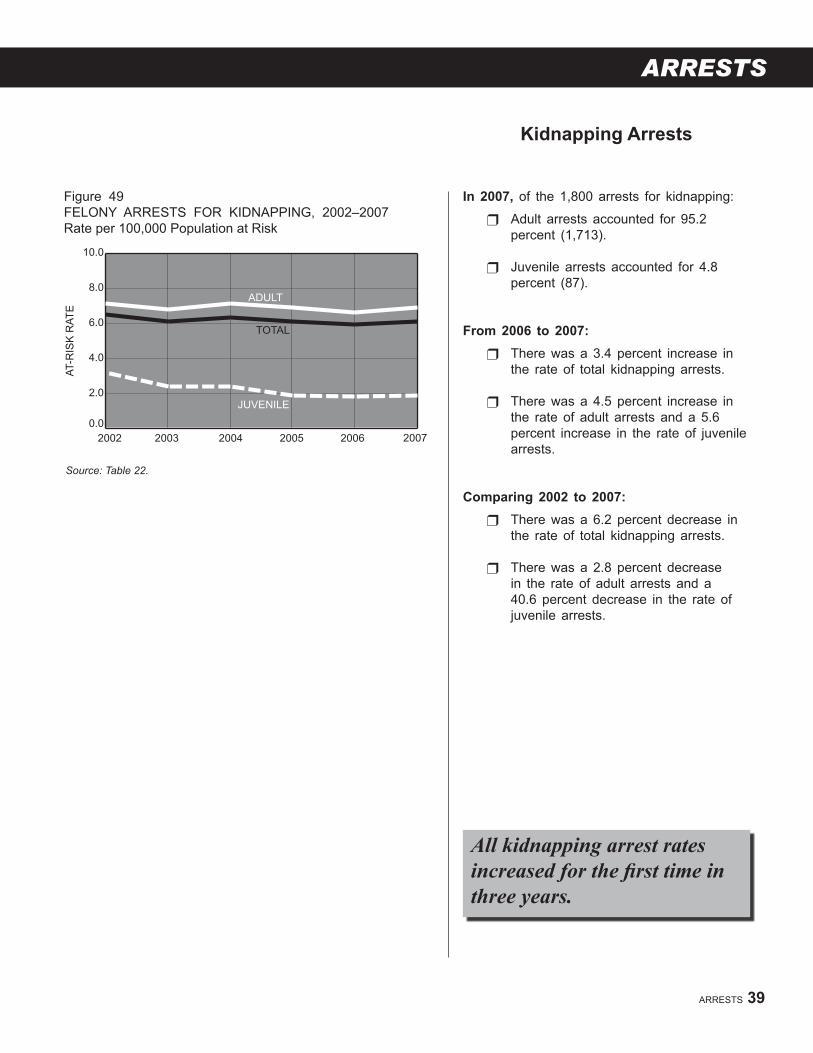
in 2007, of the 1,800 arrests for kidnapping:
Adult arrests accounted for 95.2 percent (1,713).
Juvenile arrests accounted for 4.8 percent (87).
from 2006 to 2007: There was a 3.4 percent increase in
the rate of total kidnapping arrests.
There was a 4.5 percent increase in the rate of adult arrests and a 5.6 percent increase in the rate of juvenile arrests.
Comparing 2002 to 2007: There was a 6.2 percent decrease in
the rate of total kidnapping arrests.
There was a 2.8 percent decrease in the rate of adult arrests and a 40.6 percent decrease in the rate of juvenile arrests.
Figure 49FELONY ARRESTS FOR KIDNAPPING, 2002–2007Rate per 100,000 Population at Risk
Source: Table 22.
All kidnapping arrest rates increased for the first time in three years.

CRIME IN CALIFORNIA, 2007
40 CRIME IN CALIFORNIA, 2007
arrests for Property offenses
Property offense arrests – felony arrests for burglary; theft; motor vehicle theft; forgery, checks, and access card offenses; and arson.
0 20 40 60 80 100
ARSON
FORGERY, CHECKS, ACCESS CARDS
MOTOR VEHICLE THEFT
THEFT
BURGLARY
TOTAL 81.9% 18.1%
74.3% 25.7%
PERCENT
88.2% 11.8%
80.0% 20.0%
96.8% 3.2%
46.9% 53.1%
ADULT
JUVENILE
THEFT
36.8%
MOTORVEHICLE
THEFT
15.9%
FORGERY,CHECKS,ACCESSCARDS
8.0%
ARSON1.0%
BURGLARY
38.2%
in 2007, of the 142,006 felony arrests for property offenses:
Burglary accounted for 38.2 percent (54,316).
Theft accounted for 36.8 percent (52,325).
Motor vehicle theft accounted for 15.9 percent (22,582).
Forgery, checks, and access cards accounted for 8.0 percent (11,405).
Arson accounted for 1.0 percent (1,378).
And,
Adult arrests accounted for 81.9 percent (116,307).
Juvenile arrests accounted for 18.1 percent (25,699).
Figure 51FELONY ARRESTS FORPROPERTY OFFENSES, 2007Offense by Adult and Juvenile Arrests
Figure 50FELONY ARRESTS FORPROPERTY OFFENSES, 2007By Offense
Source: Table 20.Note: Percentages do not add to 100.0 because of rounding.
Source: Table 21.

ARRESTS
0.0
250.0
500.0
750.0
200720062005200420032002
AT-
RIS
K R
AT
E
ADULT
JUVENILETOTAL
from 2006 to 2007: There was a 3.0 percent decrease in
the rate of total arrests for property offenses.
There was a 3.0 percent decrease in the rate of adult arrests and a 3.2 percent decrease in the rate of juvenile arrests.
Comparing 2002 to 2007: There was a 5.1 percent decrease in
the rate of total arrests for property offenses.
There was a 2.3 percent decrease in the rate of adult arrests and a 15.2 percent decrease in the rate of juvenile arrests.
Figure 52FELONY ARRESTS FOR PROPERTY OFFENSES, 2002–2007Rate per 100,000 Population at Risk
Source: Table 22.
ARRESTS 41
arrests for Property offenses(cont.)

CRIME IN CALIFORNIA, 2007
0.0
100.0
200.0
300.0
400.0
200720062005200420032002
AT-
RIS
K R
AT
E
ADULT
JUVENILE
TOTAL
42 CRIME IN CALIFORNIA, 2007
Burglary arrests
Figure 53FELONY ARRESTS FOR BURGLARY, 2002–2007Rate per 100,000 Population at Risk
Source: Table 22.
in 2007, of the 54,316 arrests for burglary:
Adult arrests accounted for 74.3 percent (40,376).
Juvenile arrests accounted for 25.7 percent (13,940).
from 2006 to 2007: There was a 4.1 percent increase in
the rate of total burglary arrests.
There was a 4.3 percent increase in the rate of adult arrests and a 2.3 percent increase in the rate of juvenile arrests.
Comparing 2002 to 2007: There was a 3.8 percent increase in
the rate of total burglary arrests.
There was an 8.7 percent increase in the rate of adult arrests and a 7.3 percent decrease in the rate of juvenile arrests.

ARRESTS
0.0
50.0
100.0
150.0
200.0
250.0
200720062005200420032002
AT-
RIS
K R
AT
E
ADULT
TOTAL
JUVENILE
ARRESTS 43
Theft arrests
Figure 54FELONY ARRESTS FOR THEFT, 2002–2007Rate per 100,000 Population at Risk
Source: Table 22.
in 2007, of the 52,325 arrests for theft:
Adult arrests accounted for 88.2 percent (46,174).
Juvenile arrests accounted for 11.8 percent (6,151).
from 2006 to 2007: There was a 1.2 percent decrease in
the rate of total theft arrests.
There was a 1.1 percent decrease in the rate of adult arrests and a 0.8 percent decrease in the rate of juvenile arrests.
Comparing 2002 to 2007: There was a 3.4 percent increase in
the rate of total theft arrests.
There was a 5.0 percent increase in the rate of adult arrests and a 7.7 percent decrease in the rate of juvenile arrests.

CRIME IN CALIFORNIA, 2007
0.0
50.0
100.0
150.0
200.0
200720062005200420032002
AT-
RIS
K R
AT
E
ADULT
JUVENILE
TOTAL
44 CRIME IN CALIFORNIA, 2007
motor Vehicle Theft arrests
in 2007, of the 22,582 arrests for motor vehicle theft:
Adult arrests accounted for 80.0 percent (18,069).
Juvenile arrests accounted for 20.0 percent (4,513).
from 2006 to 2007: There was a 20.0 percent decrease
in the rate of total motor vehicle theft arrests.
There was a 20.2 percent decrease in the rate of adult arrests and a 19.5 percent decrease in the rate of juvenile arrests.
Comparing 2002 to 2007: There was a 23.0 percent decrease
in the rate of total motor vehicle theft arrests.
There was an 18.9 percent decrease in the rate of adult arrests and a 35.4 percent decrease in the rate of juvenile arrests.
Figure 55FELONY ARRESTS FORMOTOR VEHICLE THEFT, 2002–2007Rate per 100,000 Population at Risk
Source: Table 22.
The motor vehicle theft arrest rate declined 20.0 percent in the last year.

ARRESTS
0.0
20.0
40.0
60.0
80.0
200720062005200420032002
AT-
RIS
K R
AT
E
ADULT
JUVENILE
TOTAL
ARRESTS 45
forgery, Check, and access Card arrests
in 2007, of the 11,405 arrests for forgery, check, and access card offenses:
Adult arrests accounted for 96.8 percent (11,042).
Juvenile arrests accounted for 3.2 percent (363).
from 2006 to 2007: There was a 1.5 percent decrease in
the rate of total forgery, check, and access card offense arrests.
There was a 1.1 percent decrease in the rate of adult arrests and an 11.4 percent decrease in the rate of juvenile arrests.
Comparing 2002 to 2007: There was a 26.9 percent decrease
in the rate of total forgery, check, and access card offense arrests.
There was a 26.2 percent decrease in the rate of adult arrests and a 48.0 percent decrease in the rate of juvenile arrests.
Figure 56FELONY ARRESTS FOR FORGERY, CHECK,AND ACCESS CARD OFFENSES, 2002–2007Rate per 100,000 Population at Risk
Source: Table 22.
In 2007, the rate of adult felony arrests for forgery, check, and access card offenses was more than five times that of juveniles.
CRIME IN CALIFORNIA, 2007
0.0
5.0
10.0
15.0
20.0
25.0
200720062005200420032002
AT-
RIS
K R
AT
E
ADULT
JUVENILE
TOTAL
46 CRIME IN CALIFORNIA, 2007
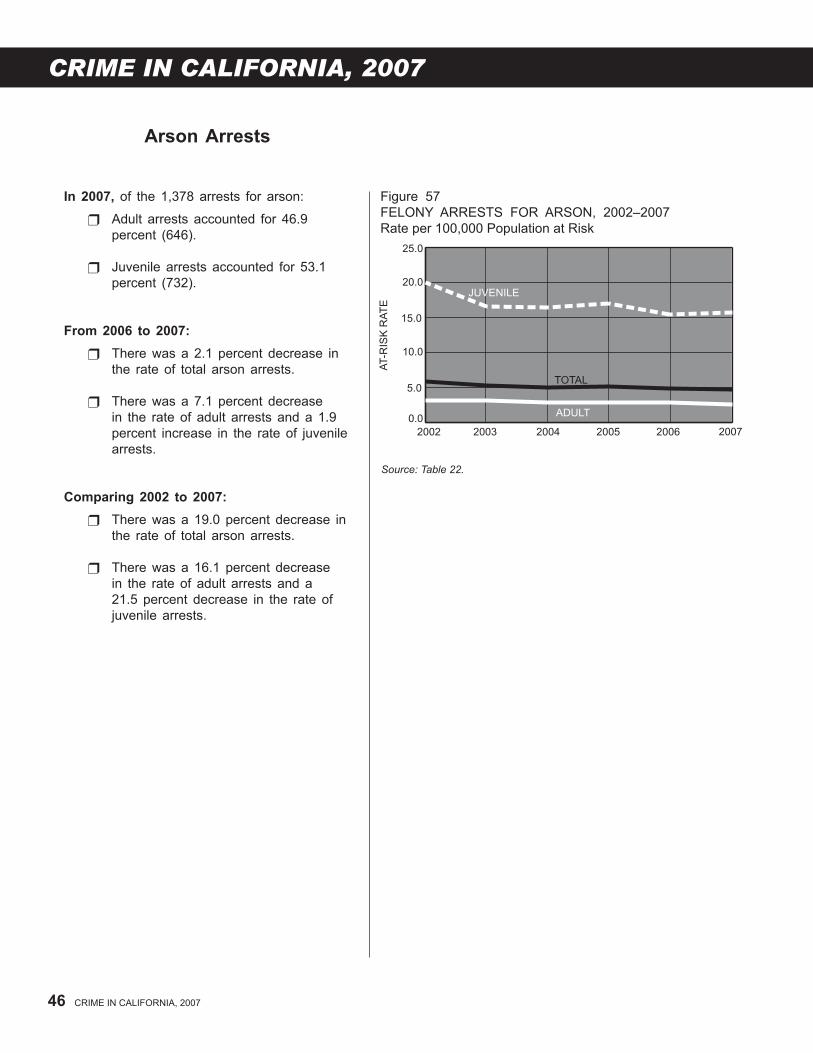
arson arrests
in 2007, of the 1,378 arrests for arson:
Adult arrests accounted for 46.9 percent (646).
Juvenile arrests accounted for 53.1 percent (732).
from 2006 to 2007: There was a 2.1 percent decrease in
the rate of total arson arrests.
There was a 7.1 percent decrease in the rate of adult arrests and a 1.9 percent increase in the rate of juvenile arrests.
Comparing 2002 to 2007: There was a 19.0 percent decrease in
the rate of total arson arrests.
There was a 16.1 percent decrease in the rate of adult arrests and a 21.5 percent decrease in the rate of juvenile arrests.
Figure 57FELONY ARRESTS FOR ARSON, 2002–2007Rate per 100,000 Population at Risk
Source: Table 22.

ARRESTS
ARRESTS 47
arrests for Drug offenses
0 20 40 60 80 100
OTHER DRUG
DANGEROUS
MARIJUANA
NARCOTICS
TOTAL 96.2% 3.8%
PERCENT
96.8% 3.2%
87.3% 12.7%
97.7% 2.3%
97.1% 2.9%
ADULT
JUVENILE
NARCOTICS38.3%DANGEROUS
DRUGS
49.5%
OTHERDRUG
OFFENSES
0.9%
MARIJUANA
11.2%
Figure 59FELONY ARRESTS FOR DRUG OFFENSES, 2007Offense by Adult and Juvenile Arrests
Figure 58FELONY ARRESTS FOR DRUG OFFENSES, 2007By Offense
Source: Table 20.Note: Percentages do not add to 100.0 because of rounding.
Source: Table 21.
Drug offense arrests – felony arrests for narcotics, marijuana, dangerous drugs, and other drug offenses.
in 2007, of the 143,692 felony arrests for drug offenses:
Narcotic arrests accounted for 38.3 percent (55,070).
Marijuana arrests accounted for 11.2 percent (16,124).
Dangerous drug arrests accounted for 49.5 percent (71,143).
Other drug offense arrests accounted for 0.9 percent (1,355).
And,
Adult arrests accounted for 96.2 percent (138,193).
Juvenile arrests accounted for 3.8 percent (5,499).

CRIME IN CALIFORNIA, 2007
48 CRIME IN CALIFORNIA, 2007
arrests for Drug offenses (cont.)
from 2006 to 2007: There was an 8.0 percent decrease in
the rate of total drug offense arrests.
There was a 7.7 percent decrease in the rate of adult arrests and a 6.6 percent decrease in the rate of juvenile arrests.
Comparing 2002 to 2007: There was a 1.1 percent increase in
the rate of total drug offense arrests.
There was a 1.4 percent increase in the rate of adult arrests and an 11.9 percent decrease in the rate of juvenile arrests.
0.0
200.0
400.0
600.0
800.0
200720062005200420032002
AT-
RIS
K R
AT
E
ADULT
JUVENILE
TOTAL
Figure 60FELONY ARRESTS FOR DRUG OFFENSES, 2002–2007Rate per 100,000 Population at Risk
Source: Table 22.
The arrest rates for drug offenses declined for the second consecutive year.

ARRESTS
0.0
50.0
100.0
150.0
200.0
250.0
200720062005200420032002
AT-
RIS
K R
AT
E
ADULT
JUVENILE
TOTAL
ARRESTS 49
narcotic arrests
narcotic Category – heroin, cocaine, etc.
in 2007, of the 55,070 arrests for narcoticoffenses:
Adult arrests accounted for 96.8 percent (53,313).
Juvenile arrests accounted for 3.2 percent (1,757).
from 2006 to 2007: There was a 2.9 percent decrease in
the rate of total narcotic arrests.
There was a 2.5 percent decrease in the rate of adult arrests and a 3.3 percent decrease in the rate of juvenile arrests.
Comparing 2002 to 2007: There was a 4.1 percent increase in
the rate of total narcotic arrests.
There was a 4.0 percent increase in the rate of adult arrests and a 3.3 percent decrease in the rate of juvenile arrests.
Figure 61FELONY ARRESTS FOR NARCOTIC OFFENSES, 2002–2007Rate per 100,000 Population at Risk
Source: Table 22.
After a sizeable increase in 2006, the juvenile arrest rate for narcotic offenses decreased 3.3 percent in 2007.

CRIME IN CALIFORNIA, 2007
0.0
15.0
30.0
45.0
60.0
200720062005200420032002
AT-
RIS
K R
AT
E
ADULT
JUVENILE
TOTAL
50 CRIME IN CALIFORNIA, 2007
marijuana arrests
marijuana Category – possession, possession for sale, etc.
in 2007, of the 16,124 arrests for marijuana offenses:
Adult arrests accounted for 87.3 percent (14,080).
Juvenile arrests accounted for 12.7 percent (2,044).
from 2006 to 2007: There was a 17.7 percent increase in
the rate of total marijuana arrests.
There was a 19.5 percent increase in the rate of adult arrests and a 7.1 percent increase in the rate of juvenile arrests.
Comparing 2002 to 2007: There was a 17.2 percent increase in
the rate of total marijuana arrests.
There was a 21.8 percent increase in the rate of adult arrests and a 6.4 percent decrease in the rate of juvenile arrests.
Figure 62FELONY ARRESTS FORMARIJUANA OFFENSES, 2002–2007Rate per 100,000 Population at Risk
Source: Table 22.
In 2007, the marijuana arrest rate was the only drug offense rate that increased (19.5 percent for adults and 7.1 percent for juveniles).
ARRESTS
0.0
100.0
200.0
300.0
400.0
200720062005200420032002
AT-
RIS
K R
AT
E
ADULT
JUVENILE
TOTAL
ARRESTS 51
Dangerous Drug arrests
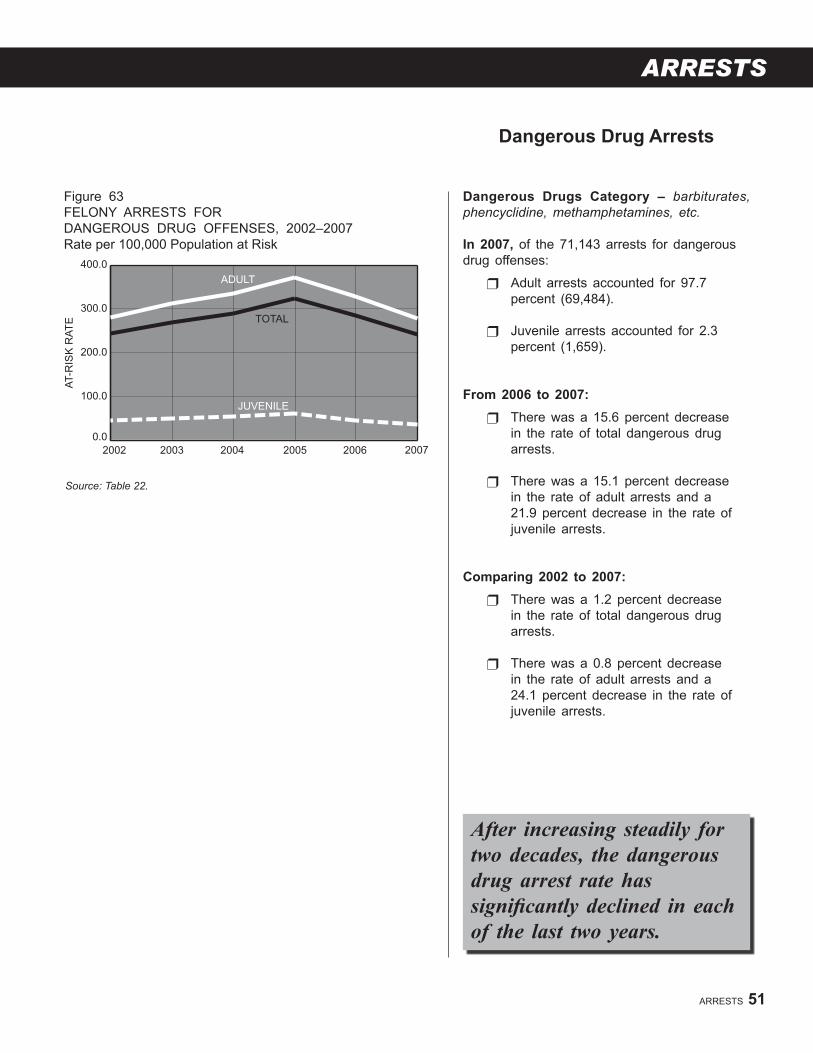
Dangerous Drugs Category – barbiturates, phencyclidine, methamphetamines, etc.
in 2007, of the 71,143 arrests for dangerous drug offenses:
Adult arrests accounted for 97.7 percent (69,484).
Juvenile arrests accounted for 2.3 percent (1,659).
from 2006 to 2007: There was a 15.6 percent decrease
in the rate of total dangerous drug arrests.
There was a 15.1 percent decrease in the rate of adult arrests and a 21.9 percent decrease in the rate of juvenile arrests.
Comparing 2002 to 2007: There was a 1.2 percent decrease
in the rate of total dangerous drug arrests.
There was a 0.8 percent decrease in the rate of adult arrests and a 24.1 percent decrease in the rate of juvenile arrests.
Figure 63FELONY ARRESTS FORDANGEROUS DRUG OFFENSES, 2002–2007Rate per 100,000 Population at Risk
Source: Table 22.
After increasing steadily for two decades, the dangerous drug arrest rate has significantly declined in each of the last two years.
CRIME IN CALIFORNIA, 2007
0.0
5.0
10.0
15.0
200720062005200420032002
AT-
RIS
K R
AT
E
ADULT
JUVENILE
TOTAL
52 CRIME IN CALIFORNIA, 2007
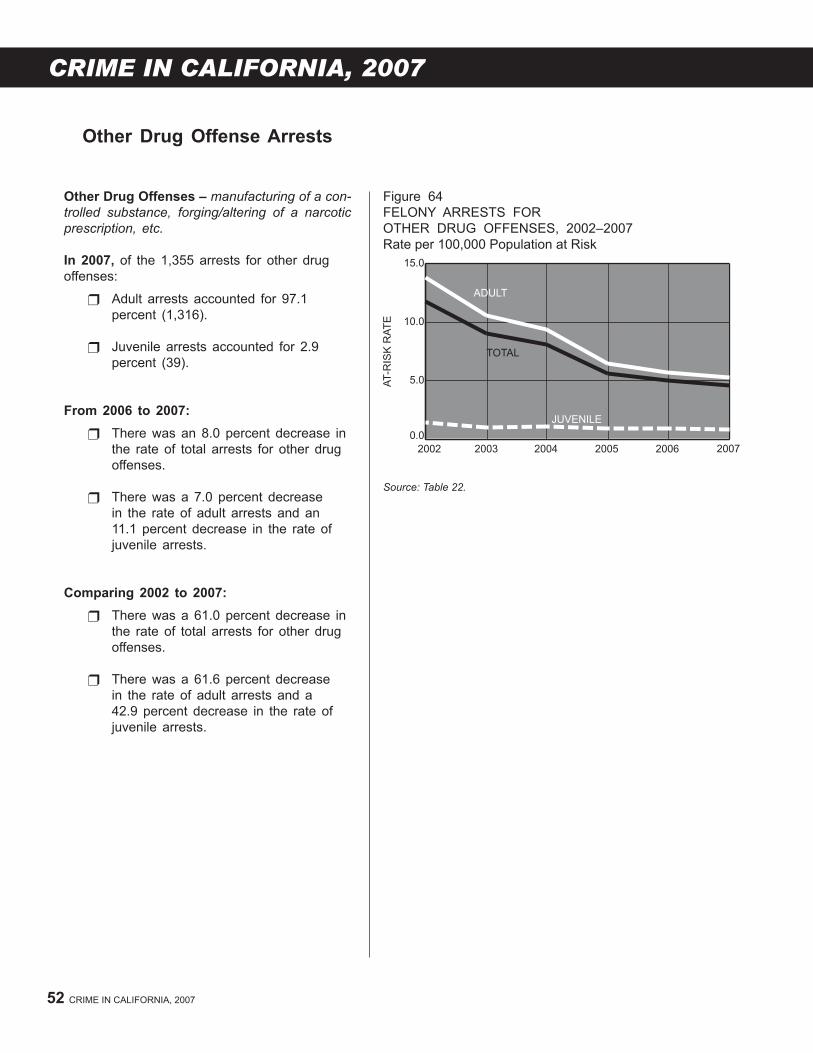
other Drug offenses – manufacturing of a con-trolled substance, forging/altering of a narcotic prescription, etc.
in 2007, of the 1,355 arrests for other drug offenses:
Adult arrests accounted for 97.1 percent (1,316).
Juvenile arrests accounted for 2.9 percent (39).
from 2006 to 2007: There was an 8.0 percent decrease in
the rate of total arrests for other drug offenses.
There was a 7.0 percent decrease in the rate of adult arrests and an 11.1 percent decrease in the rate of juvenile arrests.
Comparing 2002 to 2007: There was a 61.0 percent decrease in
the rate of total arrests for other drug offenses.
There was a 61.6 percent decrease in the rate of adult arrests and a 42.9 percent decrease in the rate of juvenile arrests.
Figure 64FELONY ARRESTS FOROTHER DRUG OFFENSES, 2002–2007Rate per 100,000 Population at Risk
other Drug offense arrests
Source: Table 22.

ARRESTS
ARRESTS 53
misdemeanor arrests
In 2007, 46.8 percent of mis-demeanor arrests were either alcohol- or drug-related.
in 2007, of the 992,588 misdemeanor arrests reported:
Assault and battery accounted for 9.2 percent (91,150).
Petty theft accounted for 6.4 percent (63,134).
Drug offenses accounted for 15.1 percent (149,641).
Drunk offenses accounted for 11.6 percent (115,239).
Drivingunder the influenceaccountedfor 20.1 percent (199,866).
All other offenses accounted for 37.6 percent (373,558).
And,
Adult arrests accounted for 86.4 percent (857,959).
Juvenile arrests accounted for 13.6 percent (134,629).
DRUNK
11.6%
ALL OTHER
37.6%
DRIVINGUNDER THEINFLUENCE
20.1%
PETTYTHEFT
6.4%DRUG
OFFENSES
15.1%
ASSAULT ANDBATTERY
9.2%
0 20 40 60 80 100
ALL OTHER
DRIVINGUNDER THEINFLUENCE
DRUNK
DRUGOFFENSES
PETTY THEFT
ASSAULT ANDBATTERY
TOTAL
PERCENT
86.4% 13.6%
75.5% 24.5%
61.7% 38.3%
88.7% 11.3%
95.9%4.1%
99.2% 0.8%
82.6% 17.4%
ADULT
JUVENILE
Figure 65MISDEMEANOR ARRESTS, 2007By Offense
Figure 66MISDEMEANOR ARRESTS, 2007Offense by Adult and Juvenile Arrests
Source: Table 25.
Source: Table 26.

CRIME IN CALIFORNIA, 2007
54 CRIME IN CALIFORNIA, 2007
misdemeanor arrests(cont.)
0.0
2,500.0
3,000.0
3,500.0
4,000.0
200720062005200420032002
AT-
RIS
K R
AT
E
TOTAL
JUVENILE
ADULT
Figure 67MISDEMEANOR ARRESTS, 2002–2007Rate per 100,000 Population at Risk
Source: Table 27.
from 2006 to 2007: There was a 1.4 percent increase in
the rate of total misdemeanor arrests.
There was a 1.8 percent increase in the rate of adult arrests and a 0.7 percent decrease in the rate of juvenile arrests.
Comparing 2002 to 2007: There was a 1.5 percent increase in
the rate of total misdemeanor arrests.
There was a 2.5 percent increase in the rate of adult arrests and a 4.5 percent decrease in the rate of juvenile arrests.
ARRESTS
0.0
200.0
400.0
600.0
200720062005200420032002
AT-
RIS
K R
AT
E
ADULT
JUVENILE
TOTAL
ARRESTS 55
assault and Battery arrests
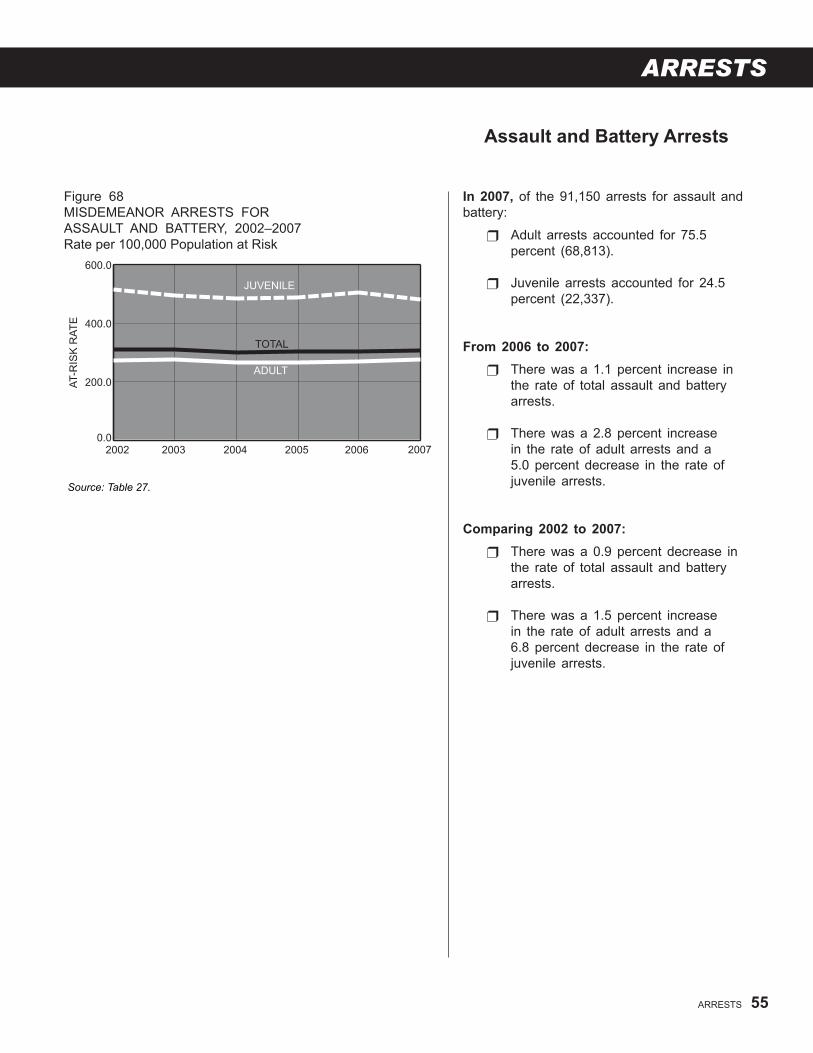
in 2007, of the 91,150 arrests for assault and battery:
Adult arrests accounted for 75.5 percent (68,813).
Juvenile arrests accounted for 24.5 percent (22,337).
from 2006 to 2007: There was a 1.1 percent increase in
the rate of total assault and battery arrests.
There was a 2.8 percent increase in the rate of adult arrests and a 5.0 percent decrease in the rate of juvenile arrests.
Comparing 2002 to 2007: There was a 0.9 percent decrease in
the rate of total assault and battery arrests.
There was a 1.5 percent increase in the rate of adult arrests and a 6.8 percent decrease in the rate of juvenile arrests.
Figure 68MISDEMEANOR ARRESTS FOR ASSAULT AND BATTERY, 2002–2007Rate per 100,000 Population at Risk
Source: Table 27.
CRIME IN CALIFORNIA, 2007
0.0
200.0
400.0
600.0
800.0
200720062005200420032002
AT-
RIS
K R
AT
E
ADULT
JUVENILE
TOTAL
56 CRIME IN CALIFORNIA, 2007
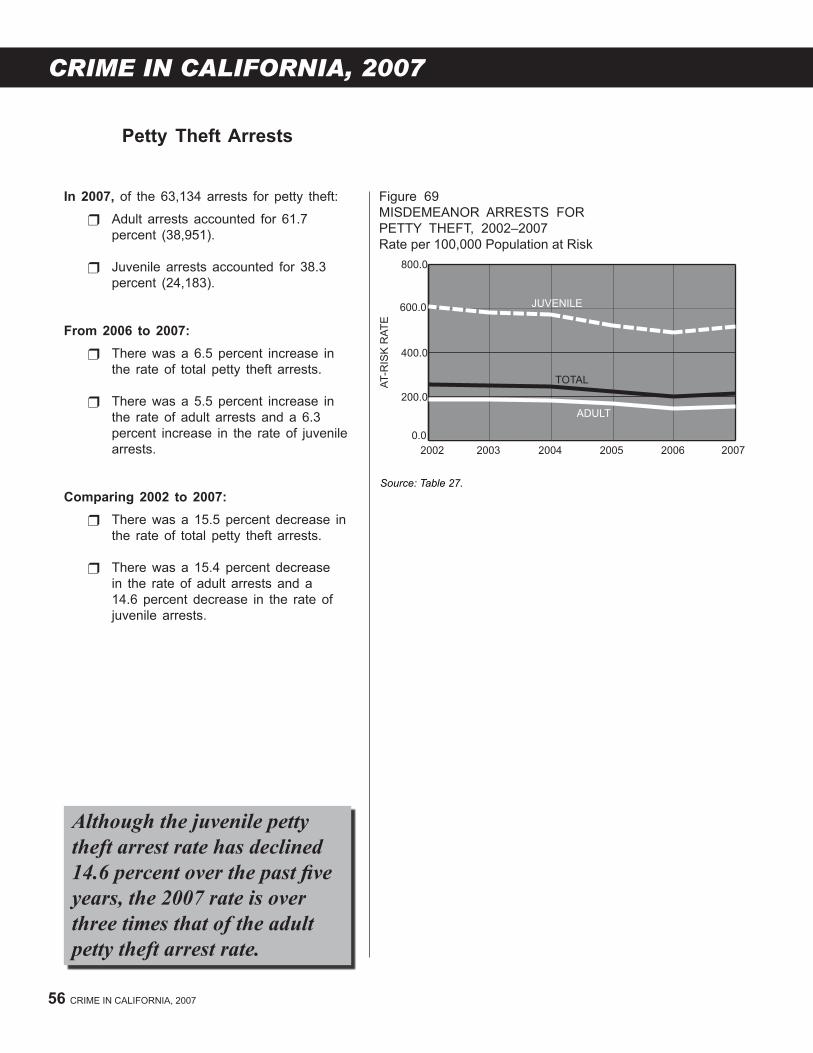
Petty Theft arrests
in 2007, of the 63,134 arrests for petty theft:
Adult arrests accounted for 61.7 percent (38,951).
Juvenile arrests accounted for 38.3 percent (24,183).
from 2006 to 2007: There was a 6.5 percent increase in
the rate of total petty theft arrests.
There was a 5.5 percent increase in the rate of adult arrests and a 6.3 percent increase in the rate of juvenile arrests.
Comparing 2002 to 2007: There was a 15.5 percent decrease in
the rate of total petty theft arrests.
There was a 15.4 percent decrease in the rate of adult arrests and a 14.6 percent decrease in the rate of juvenile arrests.
Figure 69MISDEMEANOR ARRESTS FORPETTY THEFT, 2002–2007Rate per 100,000 Population at Risk
Source: Table 27.
Although the juvenile petty theft arrest rate has declined 14.6 percent over the past five years, the 2007 rate is over three times that of the adult petty theft arrest rate.

ARRESTS
0.0
350.0
400.0
450.0
500.0
550.0
600.0
200720062005200420032002
AT-
RIS
K R
AT
E
ADULT
TOTAL
JUVENILE
ARRESTS 57
Drug offense arrests
misdemeanor Drug offense arrests – under the influence, possession, and paraphernalia.
in 2007, of the 149,641 arrests for drug offenses:
Adult arrests accounted for 88.7 percent (132,782).
Juvenile arrests accounted for 11.3 percent (16,859).
from 2006 to 2007: There was a 0.1 percent increase in
the rate of total drug offense arrests.
There was a 0.2 percent decrease in the rate of adult arrests and a 3.3 percent increase in the rate of juvenile arrests.
Comparing 2002 to 2007: There was a 9.6 percent increase in
the rate of total drug offense arrests.
There was a 12.3 percent increase in the rate of adult arrests and an 8.5 percent decrease in the rate of juvenile arrests.
Figure 70MISDEMEANOR ARRESTS FOR DRUG OFFENSES, 2002–2007Rate per 100,000 Population at Risk
Source: Table 27.

CRIME IN CALIFORNIA, 2007
0.0
100.0
200.0
300.0
400.0
500.0
200720062005200420032002
AT-
RIS
K R
AT
E
ADULT
JUVENILE
TOTAL
58 CRIME IN CALIFORNIA, 2007
Drunk arrests
Figure 71MISDEMEANOR ARRESTS FORDRUNKENNESS, 2002–2007Rate per 100,000 Population at Risk
in 2007, of the 115,239 arrests for drunk offenses:
Adult arrests accounted for 95.9 percent (110,569).
Juvenile arrests accounted for 4.1 percent (4,670).
from 2006 to 2007: There was a 6.5 percent increase in
the rate of total drunk arrests.
There was a 6.8 percent increase in the rate of adult arrests and a 7.6 percent increase in the rate of juvenile arrests.
Comparing 2002 to 2007: There was a 6.4 percent increase in
the rate of total drunk arrests.
There was a 6.0 percent increase in the rate of adult arrests and an 8.7 percent increase in the rate of juvenile arrests.
Source: Table 27.
In 2007, arrest rates for drunk offenses increased for the second consecutive year.

ARRESTS
0.0
200.0
400.0
600.0
800.0
1,000.0
200720062005200420032002
AT-
RIS
K R
AT
E
ADULT
JUVENILE
TOTAL
ARRESTS 59
Driving Under the Influence arrests
Driving Under the Influence – driving under the influence of alcohol, drugs, or the combination of alcohol and drugs without causing injury or death.
in 2007, of the 199,866 arrests for driving under the influenceoffenses:
Adult arrests accounted for 99.2 percent (198,296).
Juvenile arrests accounted for 0.8 percent (1,570).
from 2006 to 2007: There was a 2.5 percent increase in
the rate of total misdemeanor arrests for drivingunder the influence.
There was a 3.0 percent increase in the rate of adult arrests and a 6.4 percent decrease in the rate of juvenile arrests.
Comparing 2002 to 2007: There was a 6.3 percent increase in
the rate of total misdemeanor arrests for drivingunder the influence.
There was a 6.0 percent increase in the rate of adult arrests and a 0.6 percent decrease in the rate of juvenile arrests.
Figure 72MISDEMEANOR ARRESTS FORDRIVING UNDER THE INFLUENCE, 2002–2007Rate per 100,000 Population at Risk
Source: Table 27.
CRIME IN CALIFORNIA, 2007
0 20 40 60 80 100
FEMALE
MALE 34.9% 65.1%
33.2% 66.8%
PERCENT
FELONY
MISDEMEANOR
MALE
78.7%
FEMALE
21.3%
60 CRIME IN CALIFORNIA, 2007
Figure 73FELONY AND MISDEMEANOR ARRESTS, 2007By Gender of Arrestee
Source: Table 30.
Figure 74FELONY AND MISDEMEANOR ARRESTS, 2007Gender of Arrestee by Level of Offense
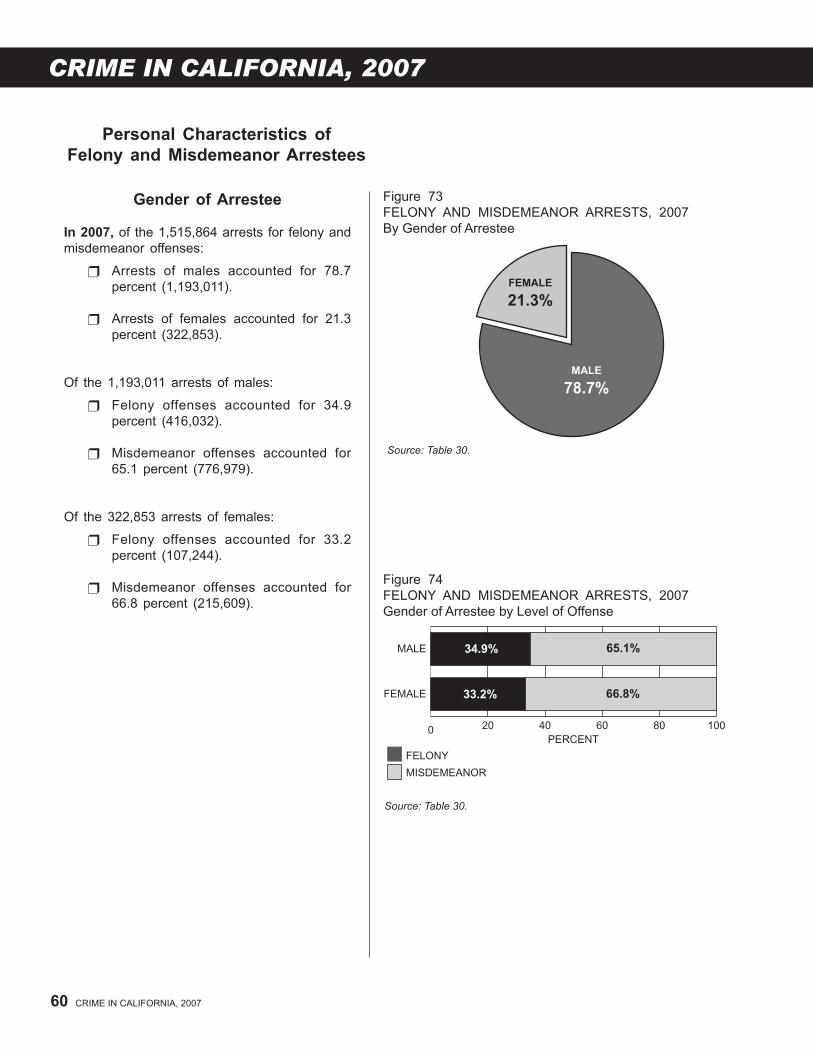
Gender of arrestee
in 2007, of the 1,515,864 arrests for felony and misdemeanor offenses:
Arrests of males accounted for 78.7 percent (1,193,011).
Arrests of females accounted for 21.3 percent (322,853).
Of the 1,193,011 arrests of males:
Felony offenses accounted for 34.9 percent (416,032).
Misdemeanor offenses accounted for 65.1 percent (776,979).
Of the 322,853 arrests of females:
Felony offenses accounted for 33.2 percent (107,244).
Misdemeanor offenses accounted for 66.8 percent (215,609).
Source: Table 30.
Personal Characteristics of felony and misdemeanor arrestees

ARRESTS
0 20 40 60 80 100
30 AND OVER
18-29
UNDER 18
PERCENT
33.0%
35.6%
34.0%
67.0%
64.4%
66.0%
FELONY
MISDEMEANOR
30 AND OVER
45.3%18-29
41.5%
UNDER18
13.2%
ARRESTS 61
Figure 75FELONY AND MISDEMEANOR ARRESTS, 2007By Age of Arrestee
age of arrestee
in 2007, of the 1,515,864 arrests for felony and misdemeanor offenses:
Arrests of persons under 18 years of age accounted for 13.2 percent (200,820).
Arrests of persons 18–29 years of age accounted for 41.5 percent (628,798).
Arrests of persons 30 years of age and over accounted for 45.3 percent (686,246).
Of the 200,820 arrests of persons under 18 years of age:
Felony arrests accounted for 33.0 percent (66,191).
Misdemeanor arrests accounted for 67.0 percent (134,629).
Of the 628,798 arrests of persons 18–29 years of age:
Felony arrests accounted for 35.6 percent (223,674).
Misdemeanor arrests accounted for 64.4 percent (405,124).
And, of the 686,246 arrests of persons 30 years of age and over:
Felony arrests accounted for 34.0 percent (233,411).
Misdemeanor arrests accounted for 66.0 percent (452,835).
Figure 76FELONY AND MISDEMEANOR ARRESTS, 2007Age of Arrestee by Level of Offense
Source: Table 30.
Source: Table 30.
Personal Characteristics of felony and misdemeanor arrestees (cont.)

CRIME IN CALIFORNIA, 2007
HISPANIC
35.8%
OTHER
14.8%
WHITE
43.4%
BLACK
6.0%
HISPANIC
40.8%
OTHER
6.0%
WHITE
36.0%
BLACK
17.2%
62 CRIME IN CALIFORNIA, 2007
race/ethnic Group of arrestee
in 2007, of the 1,515,864 arrests for felony and misdemeanor offenses:
Arrests of whites accounted for 36.0 percent (546,148).
Arrests of Hispanics accounted for 40.8 percent (618,598).
Arrests of blacks accounted for 17.2 percent (259,985).
Arrests of persons of other race/ethnic groups accounted for 6.0 percent (91,133).
Thesubjectivityoftheclassificationandlabelingprocess must be considered in the analysis ofrace/ethnic group data. As commonly used, race refers to large populations which share certain similar physical characteristics such as skin color. Because these physical characteristics can vary greatly within groups as well as between groups, determination of race is frequently, by necessity, subjective. Ethnicity refers to cultural heritage and can cross racial lines. For example, the ethnic designation "Hispanic" includes persons of any race. Most commonly, self-identificationof race/ethnicity isused in theclassificationandlabeling process.
Beginning with the Crime and Delinquency in California, 1991 publication, race/ethnic group designations used for data display purposes are the same as California Department of Finance, Demographic Research Unit, designations.
Figure 77FELONY AND MISDEMEANOR ARRESTS, 2007By Race/Ethnic Group of Arrestee
Source: Table 30.
Figure 78POPULATION IN CALIFORNIA, 2007By Race/Ethnic Group
Source: California Department of Finance, Demographic Research Unit.Note: Beginning in 2004, the "Other" category includes the new race/ethnic group of "Multi-racial."
Personal Characteristics of felony and misdemeanor arrestees (cont.)

ARRESTS
0 20 40 60 80 100
OTHER
BLACK
HISPANIC
WHITE
PERCENT
69.9%30.1%
65.2%34.8%
56.2%43.8%
67.6%32.4%
FELONY
MISDEMEANOR
ARRESTS 63
race/ethnic Group of arrestee (cont.)
Of the 546,148 arrests of whites:
Felony arrests accounted for 30.1 percent (164,274).
Misdemeanor arrests accounted for 69.9 percent (381,874).
Of the 618,598 arrests of Hispanics:
Felony arrests accounted for 34.8 percent (215,541).
Misdemeanor arrests accounted for 65.2 percent (403,057).
Of the 259,985 arrests of blacks:
Felony arrests accounted for 43.8 percent (113,962).
Misdemeanor arrests accounted for 56.2 percent (146,023).
Of the 91,133 arrests of persons of otherrace/ethnic groups:
Felony arrests accounted for 32.4 percent (29,499).
Misdemeanor arrests accounted for 67.6 percent (61,634).
Figure 79FELONY AND MISDEMEANOR ARRESTS, 2007Race/Ethnic Group of Arrestee by Level of Offense
Source: Table 30.
Personal Characteristics of felony and misdemeanor arrestees (cont.)

Dispositions

CRIME IN CALIFORNIA, 2007
WHaT iS THe offenDer-BaSeD TranSaCTion STaTiSTiCS (oBTS) SYSTem?
The Offender-Based Transaction Statistics (OBTS) system describes the processing of adults (and in some cases, juveniles) arrested in California for felony offensesfromarrestthroughfinaldispositionattheadultlevel.Dataontheadjacentflowchartincludeadultlevelfelonyarrests that receivedfinaldispositions in2007and were added to the Automated Criminal History System (ACHS) by the Department of Justice by April 2008.
WHaT iS a final DiSPoSiTion?
IntheOBTSsystem,theterm"finaldisposition"referstoaspecificlegalactionthattakesplacefollowinganadult level felony arrest. Final dispositions can occur at the law enforcement, prosecutor, or adult court level. For example, if an arrestee is released by a law enforcement agency, or the complaint is denied by a prosecutor who has determined that there is not enough evidence to justifythefilingofacomplaint,thereleaseisrecordedasafinaldisposition.Ifanarresteeisreferredtocourtfor adjudication, the outcome (e.g., dismissal, diversion dismissal, acquittal, or conviction) is also recorded as a final disposition. "Intermediate" dispositions (e.g., placements into diversionary programs) are not includedintheOBTSfile.
66 CRIME IN CALIFORNIA, 2007
HoW are oBTS DaTa rePorTeD?
Dispositions of adult felony arrests were reported by approximately 1,200 agencies in 2007. These agencies include law enforcement, prosecutors, and courts in the California criminal justice system.
OBTS data are extracted from the DOJ's Automated Criminal History System (ACHS). The arrest dispositions received illustrate the statewide processing of adult felony arrestees through California's criminal justice system. Fluctuations in the counts from year to year may not necessarily be due to actual occurrences in thecriminaljusticesystembutratherreflectthedegreeto which dispositions are reported and processed. (See Appendix 1, Data Characteristics and Known Limitations.)
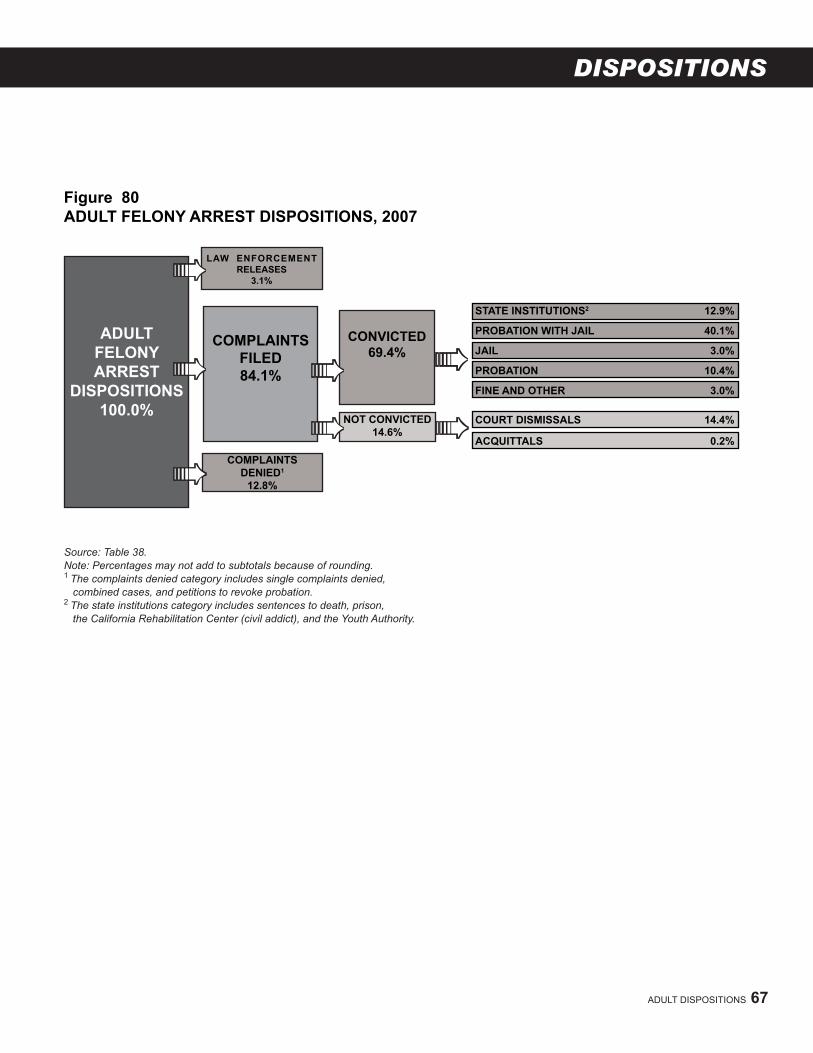
DISPOSITIONS
figure 80aDUlT felonY arreST DiSPoSiTionS, 2007
laW enforCemenT releaSeS
3.1%
ComPlainTSDenieD1
12.8%
ConViCTeD69.4%
aDUlTfelonYarreST
DiSPoSiTionS100.0%
ComPlainTSfileD84.1%
noT ConViCTeD14.6%
Source: Table 38.Note: Percentages may not add to subtotals because of rounding. 1 The complaints denied category includes single complaints denied, combined cases, and petitions to revoke probation.2 The state institutions category includes sentences to death, prison, the California Rehabilitation Center (civil addict), and the Youth Authority.
ADULT DISPOSITIONS 67
STaTe inSTiTUTionS2 12.9%
ProBaTion WiTH Jail 40.1%
Jail 3.0%
ProBaTion 10.4%
fine anD oTHer 3.0%
CoUrT DiSmiSSalS 14.4%
aCQUiTTalS 0.2%

CRIME IN CALIFORNIA, 2007
68 CRIME IN CALIFORNIA, 2007
adult felony arrestDispositions
0 20 40 60 80 100
ALLOTHER
DRUG OFFENSES
PROPERTY OFFENSES
VIOLENT OFFENSES
TOTAL3.1
69.4%
4.0
74.7%
9.5
2.5
69.2%
2.8
2.9
8.8
CONVICTED
DISMISSED, ACQUITTED
COMPLAINTS DENIED
LAW ENFORCEMENT RELEASES
PERCENT
59.5%22.6% 13.8%
14.6%12.8%
11.9%
19.1%
12.8%10.1
75.7%
Figure 81ADULT FELONY ARREST DISPOSITIONS, 2007Arrest Offense Category by Type of Disposition
Source: Table 40.Note: Percentages may not add to 100.0 because of rounding.
in 2007, as a percentage of recorded adult felony arrest dispositions:
Law enforcement releases accounted for 3.1 percent (10,273).
Prosecutor complaints denied accounted for 12.8 percent (42,632).
Dismissals or acquittals accounted for 14.6 percent (48,728).
Convictions accounted for 69.4 percent (231,014).
in 2007, as a percentage of recorded adult felony arrest dispositions for each arrest category:
Prosecutor complaints denied were highest in the violent offense category (22.6 percent).
Dismissals and acquittals were highest in the drug offense category (19.1 percent).
Convictions were highest in the property offense category (75.7 percent).
In 2007, almost seven out of ten adult felony arrest dispositions resulted in a conviction.
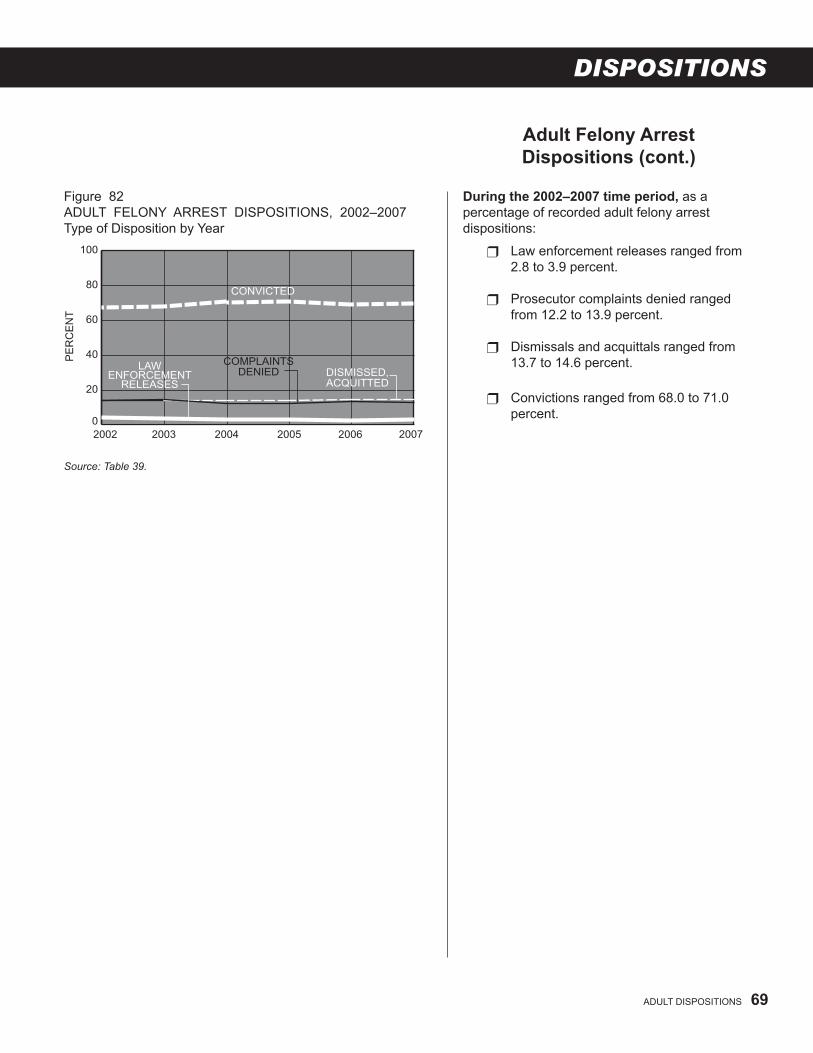
DISPOSITIONS
0
20
40
60
80
100
200720062005200420032002
PE
RC
EN
T
DISMISSED,ACQUITTED
LAWENFORCEMENT
RELEASES
CONVICTED
COMPLAINTSDENIED
During the 2002–2007 time period, as a percentage of recorded adult felony arrest dispositions:
Law enforcement releases ranged from 2.8 to 3.9 percent.
Prosecutor complaints denied ranged from 12.2 to 13.9 percent.
Dismissals and acquittals ranged from 13.7 to 14.6 percent.
Convictions ranged from 68.0 to 71.0 percent.
Figure 82ADULT FELONY ARREST DISPOSITIONS, 2002–2007Type of Disposition by Year
Source: Table 39.
ADULT DISPOSITIONS 69
adult felony arrestDispositions (cont.)

CRIME IN CALIFORNIA, 2007
STATEINSTITUTIONS
18.6%
PROBATIONWITH JAIL
57.8%
JAIL
4.4%
PROBATION
19.3%
0
20
40
60
80
100
200720062005200420032002
PE
RC
EN
T
STATEINSTITUTIONS
JAIL
PROBATION WITH JAIL
PROBATION
70 CRIME IN CALIFORNIA, 2007
adult felony arresteesConvicted
in 2007, adult felony arrestees convicted and sentenced to:
State institutions accounted for 18.6 percent (42,879).
Probation accounted for 19.3 percent (44,485).
Probation with jail accounted for 57.8 percent (133,517).
Jail accounted for 4.4 percent (10,133).
During the 2002–2007 time period, the percentage of adult felony arrestees convicted and sentenced to:
State institutions ranged from 16.7 to 18.8 percent.
Probation ranged from 17.8 to 19.5 percent.
Probation with jail ranged from 57.8 to 61.8 percent.
Jail ranged from 3.6 to 4.4 percent.
Figure 84ADULT FELONY ARRESTEES CONVICTED, 2002–2007Type of Sentence by Year
Figure 83ADULT FELONY ARRESTEES CONVICTED, 2007By Type of Sentence
Source: Table 41.Note: Percentages do not add to 100.0 because of rounding.
Source: Table 41.For the years shown, the most frequent sentence was probation with jail.

DISPOSITIONS
STATEINSTITUTIONS
19.2%
PROBATIONWITH JAIL
65.1%
JAIL
4.2%
PROBATION
11.5%
0
20
40
60
80
100
20072006200520042003
PE
RC
EN
T
STATEINSTITUTIONSJAIL
PROBATION WITH JAIL
PROBATION
2002
ADULT DISPOSITIONS 71
Figure 86ADULT FELONY ARRESTEES CONVICTEDOF VIOLENT OFFENSES, 2002–2007Type of Sentence by Year
Figure 85ADULT FELONY ARRESTEES CONVICTEDOF VIOLENT OFFENSES, 2007By Type of Sentence
Source: Table 41.
Source: Table 41.Note: 2002 data are not available due to a procedural change that allowed a
large percentage of convictions to be incorrectly recorded as "all other offenses." In 2003, a processing modification was made to correct the problem. See Appendix 1, "Data Characteristics and Known Limitations."
adult felony arresteesConvicted of Violent offenses
in 2007, of adult felony arrestees convicted of violent offenses:
Almost two-thirds received sentences of probation with jail (65.1 percent).
During the 2002–2007 time period, the percentage of adult felony arrestees convicted of violent offenses and sentenced to:
State institutions ranged from 17.0 to 19.2 percent.
Probation ranged from 10.4 to 11.5 percent.
Probation with jail ranged from 65.1 to 68.0 percent.
Jail ranged from 3.5 to 4.2 percent.

CRIME IN CALIFORNIA, 2007
0
20
40
60
80
100
20072006200520042003
PE
RC
EN
T
STATEINSTITUTIONS
JAIL
PROBATION WITH JAIL
PROBATION
2002
STATEINSTITUTIONS
21.5%
PROBATIONWITH JAIL
64.8%
JAIL
2.9%
PROBATION
10.7%
72 CRIME IN CALIFORNIA, 2007
adult felony arresteesConvicted of Property offenses
in 2007, of adult felony arrestees convicted of property offenses:
Probation with jail sentences were most frequent (64.8 percent).
"Straight" jail sentences were least frequent (2.9 percent).
During the 2002–2007 time period, the percentage of adult felony arrestees convicted of property offenses and sentenced to:
State institutions ranged from 20.1 to 22.5 percent.
Probation ranged from 9.3 to 10.7 percent.
Probation with jail ranged from 64.8 to 67.3 percent.
Jail ranged from 2.3 to 2.9 percent.
Figure 88ADULT FELONY ARRESTEES CONVICTEDOF PROPERTY OFFENSES, 2002–2007Type of Sentence by Year
Figure 87ADULT FELONY ARRESTEES CONVICTEDOF PROPERTY OFFENSES, 2007By Type of Sentence
Source: Table 41.Note: Percentages do not add to 100.0 because of rounding.
Source: Table 41.Note: 2002 data are not available due to a procedural change that allowed a
large percentage of convictions to be incorrectly recorded as "all other offenses." In 2003, a processing modification was made to correct the problem. See Appendix 1, "Data Characteristics and Known Limitations."

DISPOSITIONS
STATEINSTITUTIONS
19.4%
PROBATIONWITH JAIL
43.4%
JAIL
4.6%
PROBATION
32.6%
ADULT DISPOSITIONS 73
Figure 90ADULT FELONY ARRESTEES CONVICTEDOF DRUG OFFENSES, 2002–2007Type of Sentence by Year
Figure 89ADULT FELONY ARRESTEES CONVICTEDOF DRUG OFFENSES, 2007By Type of Sentence
Source: Table 41.
Source: Table 41.Note: 2002 data are not available due to a procedural change that allowed
a large percentage of convictions to be incorrectly recorded as "all other offenses." In 2003, a processing modification was made to correct the problem. See Appendix 1, Data Characteristics and Known Limitations.
adult felony arresteesConvicted of Drug offenses
in 2007, of adult felony arrestees convicted of drug offenses:
Probation with jail sentences were the most frequent given (43.4 percent).
"Straight" jail sentences were the least frequent given (4.6 percent).
During the 2002–2007 time period, the percentage of adult felony arrestees convicted of drug offenses and sentenced to:
State institutions ranged from 17.8 to 19.6 percent.
Probation ranged from 31.3 to 34.2 percent.
Probation with jail ranged from 42.8 to 46.8 percent.
Jail ranged from 3.8 to 4.6 percent.
0
20
40
60
80
100
20072006200520042003
PE
RC
EN
T
JAIL
PROBATION WITH JAIL
PROBATIONSTATE
INSTITUTIONS
2002

CRIME IN CALIFORNIA, 2007
DISMISSED
14.4%CONVICTED
69.4%
COMPLAINTSDENIED
12.8%
LAWENFORCEMENT
RELEASES
3.1%
ACQUITTED
0.2%
74 CRIME IN CALIFORNIA, 2007
Dispositions for adult felony arrests
Figure 91DISPOSITIONS OF ADULT FELONY ARRESTS, 2007By Type of Disposition
Source: Table 38.Note: Percentages do not add to 100.0 because of rounding.
Disposition outcomes can be calculated using twodifferentmethods.Thefirstisbasedontotaladult felony arrest dispositions and the second isbasedontotalcomplaintsfiled.Eachisvalidand by presenting both, the reader is provided two perspectives from which to evaluate the effectiveness of the criminal justice system.
Disposition outcomes based on total adult felony arrest dispositions describe the overall processing of offenders by the criminal justice system. This method of calculation focuses on the proportion of convictions out of the total number of arrests.
Convicted continues to be the most common type of disposition for adult felony arrests.

DISPOSITIONS
CONVICTED
82.6%
DISMISSED
17.2%
ACQUITTED
0.2%
ADULT DISPOSITIONS 75
Dispositions for Complaints filed
Figure 92DISPOSITIONS OF COMPLAINTS FILEDRESULTING FROM ADULT FELONY ARRESTS, 2007By Type of Disposition
Source: Table 38A.
Disposition outcomes based on total complaints fileddescribetheprocessingofdefendantsinthe courts. This method of calculation focuses onthosearrestsforwhichacomplaintwasfiledby the district attorney.
A majority (82.6 percent) of all complaints result in a conviction.

Adult Corrections

78 CRIME IN CALIFORNIA, 2007
WHaT iS aDUlT CorreCTionS?
Adults convicted in California courts can be placed under the jurisdiction of either the state correctional system or a correctional system operated by local government. The state correctional system provides confinement, rehabilitation, and parole services for adults and juveniles through the California Department of Corrections and Rehabilitation (CDCR). In addition, offenders in California can be placed in facilities operated by the California Department of Mental Health. Local correctional agencies provide confinement, rehabilitation, and probation services forthose sentenced to their care as well as for persons awaiting trial or sentencing.
HoW are aDUlTS UnDer SUPerViSion CoUnTeD?
At the state level, supervision data are obtained annually from the CDCR. Local level supervision data are obtained from the Corrections Standards Authority (a division of the CDCR) and county probation departments.
This section provides data on adult offenders in California who are under state or local supervision in institutions or receiving parole or probation services.
CRIME IN CALIFORNIA, 2007

STATESUPERVISION
40.9%LOCALSUPERVISION
59.1%
0.0
1,000.0
2,000.0
3,000.0
4,000.0
200720062005200420032002
AT-
RIS
K R
AT
E
TOTAL
LOCAL SUPERVISION
STATE SUPERVISION
ADULT CORRECTIONS 79
in 2007, of the 729,928 adults under
supervision:
State supervision accounted for 40.9 percent (298,682).
Local supervision accounted for 59.1 percent (431,246).
from 2006 to 2007: There was a 0.3 percent increase in the
rate of adults under supervision.
There was a 0.7 percent rate increase in adults under state supervision and virtually no change in the rate of adults under local supervision.
Comparing 2002 to 2007: There was a 2.5 percent decrease in the
rate of adults under supervision.
There was a 0.8 percent decrease in the rate of adults under state supervision and a 3.7 percent decrease in the rate of adults under local supervision.
Source: Table 44A.
Source: Table 44.
Figure 94ADULTS UNDER SUPERVISION, 2002–2007Rate per 100,000 Population at Risk
Figure 93ADULTS UNDER STATE ANDLOCAL SUPERVISION, 2007
The rate of adults under state supervision increased for the third consecutive year.
ADULT CORRECTIONS
adults Under State and local Supervision

CRIME IN CALIFORNIA, 2007
0.0
200.0
400.0
600.0
800.0
200720062005200420032002
AT-
RIS
K R
AT
E
PAROLEES/OUTPATIENTS
IN INSTITUTIONS
ININSTITUTIONS
57.5%
PAROLEES/OUTPATIENTS
42.5%
80 CRIME IN CALIFORNIA, 2007
Figure 95ADULTS UNDER STATE SUPERVISION, 2007
adults Under State Supervision
in 2007, of the 298,682 adults under state supervision:
Those in institutions accounted for 57.5 percent (171,751).
Parolees/outpatients accounted for 42.5 percent (126,931).
from 2006 to 2007: There was a 1.3 percent decrease in the
rate of adults in institutions.
There was a 3.5 percent increase in the rate of adult parolees/outpatients.
Comparing 2002 to 2007: There was a 1.1 percent decrease in the
rate of adults in institutions.
There was a 0.4 percent decrease in the rate of adult parolees/outpatients.
Source: Table 44A.
Figure 96ADULTS UNDER STATE SUPERVISION, 2002–2007Rate per 100,000 Population at Risk
Source: Table 44.

ADULT CORRECTIONS
0.0
500.0
1,000.0
1,500.0
2,000.0
200720062005200420032002
AT-
RIS
K R
AT
E
ACTIVE PROBATION
AVERAGE DAILY JAIL POPULATION
AVERAGEDAILY JAIL
POPULATION
19.5%
ON ACTIVEPROBATION
80.5%
ADULT CORRECTIONS 81
adults Under local Supervision
Figure 97ADULTS UNDER LOCAL SUPERVISION, 2007
in 2007, of the 431,246 adults under local supervision:
The average daily jail population accounted for 19.5 percent (84,047). Of these,
There were 26,742 serving sentences.
There were 57,304 awaiting trial or sentencing.
Those on active probation accounted for 80.5 percent (347,199).
from 2006 to 2007: There was a 2.3 percent rate increase in
the average daily jail population.
There was a 0.5 percent decrease in the rate of adults on active probation.
Comparing 2002 to 2007: There was a 2.4 percent rate increase in
the average daily jail population.
There was a 5.1 percent decrease in the rate of adults on active probation.
Figure 98ADULTS UNDER LOCAL SUPERVISION, 2002–2007Rate per 100,000 Population at Risk
Source: Table 44A.
Source: Table 44.

CRIME IN CALIFORNIA, 2007
82 CRIME IN CALIFORNIA, 2007
adults on active Probation
in 2007, of the 347,199 adults on active probation:
Those sentenced for felony-level offenses accounted for 77.6 percent
(269,384).
Those sentenced for misdemeanor-level offenses accounted for 22.4 percent (77,815).
from 2006 to 2007: The total number of adults on active
probation increased 0.2 percent.
Comparing 2002 to 2007: The total number of adults on active
probation increased 3.1 percent.
Figure 99ADULTS ON ACTIVE PROBATION, 2007By Level of Offense
Source: Table 45.
Figure 100ADULTS ON ACTIVE PROBATION, 2002–2007
Source: Table 45.
FELONY
77.6%
MISDEMEANOR
22.4%
0
100,000
200,000
300,000
400,000
200720062005200420032002
NU
MB
ER

ADULT CORRECTIONS
0.0
200.0
400.0
600.0
800.0
1,000.0
200720062005200420032002
AT-R
ISK
RAT
E
TOTAL
MISDEMEANOR
FELONY
FELONY
77.1%
MISDEMEANOR
22.9%
ADULT CORRECTIONS 83
in 2007, of the 195,703 adults placed on probation:
Those placed for felony offenses accounted for 77.1 percent (150,824).
Those placed for misdemeanor offenses accounted for 22.9 percent (44,879).
from 2006 to 2007: There was a 1.8 percent decrease in the
rate of adults placed on probation.
There was a 2.1 percent decrease in the rate of adults placed for felony offenses and a 0.7 percent decrease in the rate of adults placed for misdemeanor offenses.
Comparing 2002 to 2007: There was a 4.9 percent increase in the
rate of adults placed on probation.
There was a 15.1 percent increase in the rate of adults placed for felony offenses and a 19.1 percent decrease in the rate of adults placed for misdemeanor offenses.
adults Placed on Probation
Source: Table 46.
Source: Table 46.
Figure 102ADULTS PLACED ON PROBATION, 2002–2007By Level of OffenseRate per 100,000 Population at Risk
Figure 101ADULTS PLACED ON PROBATION, 2007By Level of Offense

CRIME IN CALIFORNIA, 2007
0.0
300.0
600.0
900.0
200720062005200420032002
AT-
RIS
K R
AT
E
TERMINATED
REVOKED
TOTAL
OTHER
TERMINATED
45.7%REVOKED
41.6%
OTHER
12.8%
Figure 103ADULTS REMOVED FROM PROBATION, 2007By Type of Removal
Source: Table 46.Note: Percentages do not add to 100.0 because of rounding.
adults removed from Probation
in 2007, of the 190,528 adults removed from probation:
Those whose probation was terminated (completed their terms of probation successfully) accounted for 45.7 percent (86,984).
Those whose probation was revoked accounted for 41.6 percent (79,197).
Those removed for other reasons accounted for 12.8 percent (24,347).
from 2006 to 2007: There was a 5.7 percent decrease
in the rate of adults removed from probation.
There was a 3.0 percent decrease in the rate of terminations, a 2.9 percent decrease in the rate of revocations, and a 21.1 percent decrease for those removed for other reasons.
Comparing 2002 to 2007: There was a 6.7 percent increase
in the rate of adults removed from probation.
There was a 7.1 percent increase in the rate of terminations, a 0.3 percent increase in the rate of revocations, and a 31.8 percent increase in those removed for other reasons.
Source: Table 46.
84 CRIME IN CALIFORNIA, 2007
Figure 104ADULTS REMOVED FROM PROBATION, 2002–2007By Type of RemovalRate per 100,000 Population at Risk

ADULT CORRECTIONS
YOUTH AUTHORITY
0.1%
FELON
98.8%
CIVILADDICT
1.1%
100.0
150.0
200.0
250.0
300.0
350.0
FELON
TOTAL
0.0
5.0
10.0
15.0
200720062005200420032002
AT-
RIS
K R
AT
E
CIVIL ADDICT
YOUTH AUTHORITY
adults Committed to Stateinstitutions
in 2007, of the 68,648 adults committed to state institutions:
New commitments accounted for 69.6 percent (47,808).
Parolees/outpatients returned with new commitments accounted for 30.4 percent (20,840).
And,
Felony commitments accounted for 98.8 percent (67,802).
Civil Addict commitments accounted for 1.1 percent (749).
Youth authority commitments accounted for 0.1 percent (97).
from 2006 to 2007: There was a 3.1 percent decrease in
the rate of adults committed to state institutions.
There was a 3.0 percent decrease in the rate of felony commitments.
There was a 16.7 percent decrease in the rate of commitments for Civil Addict and a 33.3 percent increase in the rate of commitments to the youth authority.
Comparing 2002 to 2007: There was a 16.9 percent increase in
the rate of adults committed to state institutions.
There was a 17.9 percent increase in the rate of felony commitments.
There was a 34.8 percent decrease in the rate of commitments for Civil Addict and a 33.3 percent increase in the rate of commitments to the youth authority.
ADULT CORRECTIONS 85
Figure 106ADULTS COMMITTED TO STATE INSTITUTIONS, 2002–2007By Type of InstitutionRate per 100,000 Population at Risk
Figure 105ADULTS COMMITTED TO STATE INSTITUTIONS, 2007By Type of Institution
Source: Table 47.
Source: Table 47.

Expenditures & Personnel

88 CRIME IN CALIFORNIA, 2007
HoW are eXPenDiTUre anD PerSonnel DaTa rePorTeD?
Expenditure data are obtained from the Governor's Budget and theannual report of financial transactionsconcerning cities and counties in California. Both reports are provided by the Controller's office of theState of California.
Included in criminal justice expenditures are salaries andemployeebenefits,services,andsupplies.Capitaloutlay expenditures, such as prison construction, and expenditures by the Department of Justice and regulatory agencies are excluded.
CRIME IN CALIFORNIA, 2007
Personnel data are also obtained from the Governor's Budget,theannualreportoftheAdministrativeOfficeofthe Courts, and personnel surveys distributed by staff of the Department of Justice. Personnel counts for the Department of Justice and other regulatory agencies are not included.
Note: The 2006/07 expenditure data were not available from the Controller of the State of California in time for inclusion in this publication. Therefore, charts and narrative for expenditure data cover the four-year period, 2001/02 to 2005/06, only.

0
10,000,000
20,000,000
30,000,000
06/0705/0604/0503/0402/0301/02
DO
LLA
RS
FISCAL YEAR
CONSTANT-DOLLAREXPENDITURES
CURRENT-DOLLAREXPENDITURES
Source: Table 49.Note: The 2006/07 criminal justice expenditure data were not available in time for inclusion in this publication.
EXPENDITURES 89
expenditures
Constant dollars are adjusted to reduce the effectsofinflation.TheStateandLocalGovern-mentImplicitNationalDeflator,providedbytheCalifornia Department of Finance, is used to make this adjustment. Fiscal year 1996/97 is used as the base year. Prior publications used a base year of 1980/81.
Criminal justice expenditures are shown in both current and constant dollars.
Comparing fiscal year 2001/02 to 2005/06: There was a 29.5 percent increase in
current-dollar expenditures and a 7.2 percent increase in constant-dollar expenditures.
Figure 107CRIMINAL JUSTICE EXPENDITURESFISCAL YEARS 2001/02–2006/07By Type of Agency(Data Shown in Thousands of Dollars)
EXPENDITURES & PERSONNEL
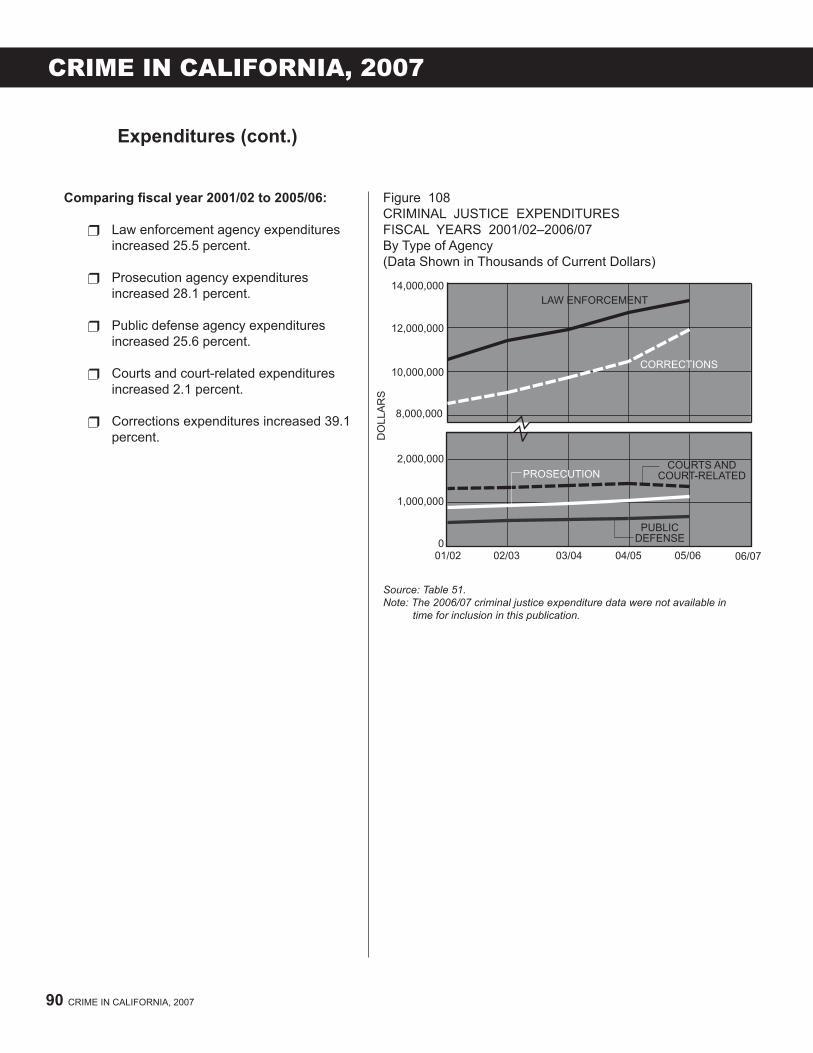
10,000,000
12,000,000
14,000,000
DO
LLA
RS
0
1,000,000
2,000,000
8,000,000
06/0705/0604/0503/0402/0301/02
LAW ENFORCEMENT
CORRECTIONS
PROSECUTION
PUBLICDEFENSE
COURTS ANDCOURT-RELATED
90 CRIME IN CALIFORNIA, 2007
Comparing fiscal year 2001/02 to 2005/06:
Law enforcement agency expenditures increased 25.5 percent.
Prosecution agency expenditures increased 28.1 percent.
Public defense agency expenditures increased 25.6 percent.
Courts and court-related expenditures increased 2.1 percent.
Corrections expenditures increased 39.1 percent.
expenditures (cont.)
Figure 108CRIMINAL JUSTICE EXPENDITURESFISCAL YEARS 2001/02–2006/07By Type of Agency(Data Shown in Thousands of Current Dollars)
Source: Table 51.Note: The 2006/07 criminal justice expenditure data were not available in time for inclusion in this publication.
CRIME IN CALIFORNIA, 2007
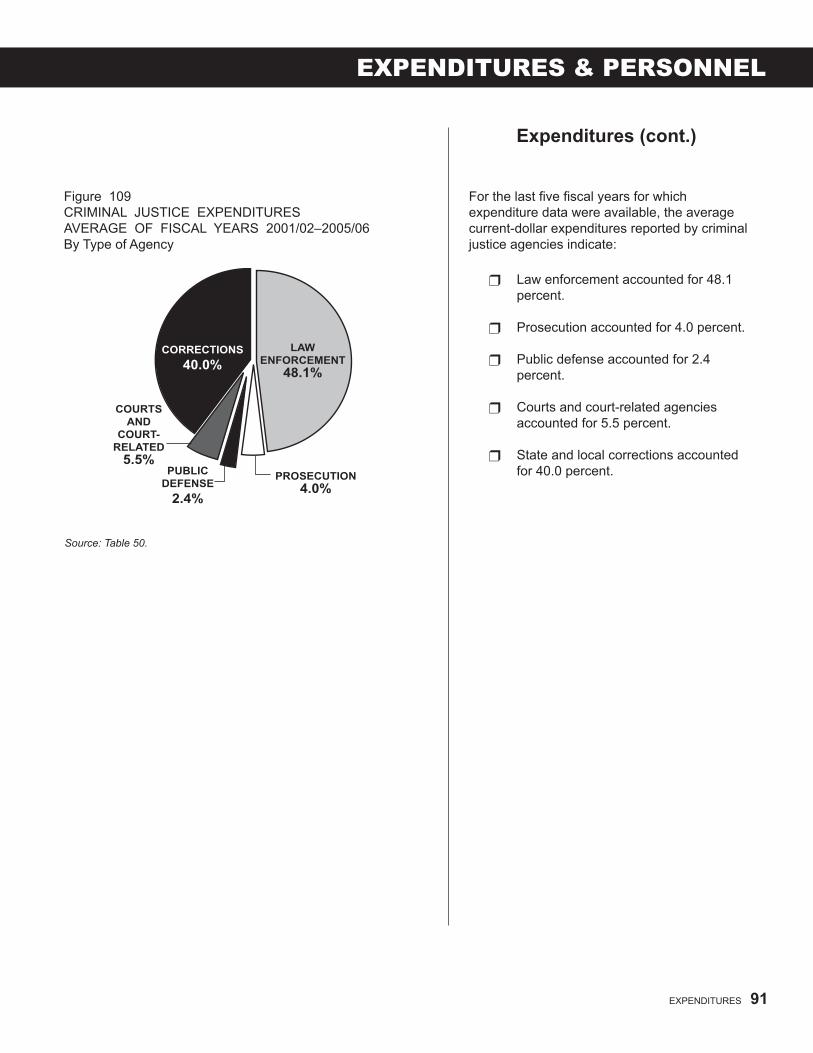
PUBLICDEFENSE
2.4%
CORRECTIONS
40.0%LAW
ENFORCEMENT48.1%
PROSECUTION4.0%
COURTSAND
COURT-RELATED
5.5%
EXPENDITURES 91
expenditures (cont.)
Figure 109CRIMINAL JUSTICE EXPENDITURESAVERAGE OF FISCAL YEARS 2001/02–2005/06By Type of Agency
Source: Table 50.
Forthelastfivefiscalyearsforwhichexpenditure data were available, the average current-dollar expenditures reported by criminal justice agencies indicate:
Law enforcement accounted for 48.1 percent.
Prosecution accounted for 4.0 percent.
Public defense accounted for 2.4 percent.
Courts and court-related agencies accounted for 5.5 percent.
State and local corrections accounted for 40.0 percent.
EXPENDITURES & PERSONNEL

92 CRIME IN CALIFORNIA, 2007
Personnel
CRIME IN CALIFORNIA, 2007
PUBLICDEFENSE
2.0%
CORRECTIONS
34.7%LAW
ENFORCEMENT57.5%
PROSECUTION4.8%
COURTS0.9%
Figure 110CRIMINAL JUSTICEFULL-TIME PERSONNEL, 2007By Type of Agency
in 2007, of the 210,797 reported criminal justice full-time personnel:
Law enforcement personnel accounted for 57.5 percent (121,305).
Prosecution personnel accounted for 4.8 percent (10,179).
Public defense personnel accounted for 2.0 percent (4,137).
Court personnel accounted for 0.9 percent (1,972).
Corrections personnel accounted for 34.7 percent (73,204).
Source: Table 55.Note: Percentages do not add to 100.0 because of rounding.

50,000
75,000
100,000
125,000
NU
MB
ER
0
5,000
10,000
15,000
20,000
200720062005200420032002
LAW ENFORCEMENT
CORRECTIONS
COURT
PROSECUTION
PUBLICDEFENSE
Figure 111CRIMINAL JUSTICEFULL-TIME PERSONNEL, 2002–2007By Type of Agency
Source: Table 53.
from 2006 to 2007: Total reported criminal justice full-time
personnel increased 0.5 percent.
Law enforcement personnel increased 4.5 percent.
Prosecution personnel increased 5.8 percent.
Public defense personnel increased 5.4 percent.
Court personnel increased 2.6 percent.
Corrections personnel decreased 6.4 percent.
Comparing 2002 to 2007: Total reported criminal justice full-time
personnel increased 5.3 percent.
Law enforcement personnel increased 5.0 percent.
Prosecution personnel increased 1.1 percent.
Public defense personnel increased 9.6 percent.
Court personnel increased 3.1 percent.
Corrections personnel increased 6.2 percent.
PERSONNEL 93
Personnel (cont.)
EXPENDITURES & PERSONNEL

Other Databases

Type and level of complaint Reported Sustained
Total calls
Total .............................. 24,358 1,735 Non-criminal .............. 23,460 1,638 Criminal ..................... 898 97
Level of complaint
Criminal ..................... 898 97 Felony.................... 401 27 Misdemeanor......... 497 70
96 CRIME IN CALIFORNIA, 2007
Citizens' Complaints againstPeace Officers
Section 13012 of the California Penal Code states, "The annual report of the department provided for in Section 13010 shall contain statistics showing: . . . (e) The number of citizens complaints received by law enforcement agencies under Section 832.5. These statistics shall indicate the total number of these complaints, the number alleging criminal conduct of either a felony or misdemeanor, and the number sustained in each category. The report shall not contain a reference to any individual agency but shall be by gross numbers only . . . ."
Section 832.5(a) of the Penal Code requires that "Each department or agency in this state that employspeaceofficersshallestablishaprocedureto investigate complaints by members of the public against the personnel of these departments or agencies, and shall make a written description of the procedure available to the public."
While California Penal Code section 832.5 states that law enforcement agencies are required to reportcomplaintsagainstpeaceofficers,itdoesnot provide for standardization of that reporting. Asaresult,thedefinitionsandprocessesusedbyreporting agencies vary widely. The data provided in this publication are subject to those variations. However, this data is considered accurate based on what the reporting agencies considered relevant to report in order to meet the reporting requirements.
CITIZENS' COMPLAINTSAGAINST PEACE OFFICERS, 2007
Source: Table 56.
NU
MB
ER
0
1,000
2,000
3,000
200720062005200420032002
15,000
20,000
25,000
CRIMINAL
NON-CRIMINAL
TOTAL
Figure 112CITIZENS' COMPLAINTSAGAINST PEACE OFFICERS, 2002–2007By Type of Complaint
Source: Table 56.
Based on a survey conducted in 2004, it is estimated that complaints from inmates in prisons and jails may constitute approximately one-third of all complaints reported by law enforcement agencies.
CRIME IN CALIFORNIA, 2007

Type of call and weapon Number Percent
Total calls
Total ............................................ 174,649 100.0 Cases without weapon ............ 105,227 60.3 Cases involving weapon ......... 69,422 39.7
Type of weapon
Cases involving weapon ......... 69,422 100.0 Firearm ................................ 1,027 1.5 Knife or cutting instrument... 3,442 5.0 Other dangerous weapon .... 10,940 15.8 Personal weapon1 .............. 54,013 77.8
Source: Table 57.Note: Percentages do not add to 100.0 because of rounding. 1 Personal weapons include hands, feet, etc.
DOMESTIC VIOLENCE-RELATED CALLSFOR ASSISTANCE, 2007
OTHER DATABASES 97
As required by Penal Code section 13730(a), effective January 1, 1986, law enforcement agencies began reporting data on domestic violence-related calls for assistance, including theidentificationofcasesinvolvingtheuseofaweapon.
Section 13730(b) of the Penal Code instructs the Attorney General to report annually on the number of domestic violence-related calls received statewide, in each county, and by individual law enforcement agencies. Statewide data are reported here. County and agency-level data are published in the Criminal Justice Profile, 2007 publication series.
Domestic violence is defined as ". . . abusecommitted against an adult or a minor who is a spouse, former spouse, cohabitant, former cohabitant, or person with whom the suspect has had a child or is having or has had a dating or engagement relationship." [13700(b) PC]
Withinthisdefinition,abuseisfurtherdefinedas".. . intentionally or recklessly causing or attempting to cause bodily injury, or placing another person in reasonable apprehension of imminent serious bodily injury to himself or herself, or another." [13700(a) PC]
0
50,000
100,000
150,000
200,000
200720062005200420032002
NU
MB
ER
WITHOUT WEAPON
WITH WEAPON
TOTAL CALLS
Figure 113DOMESTIC VIOLENCE-RELATED CALLSFOR ASSISTANCE, 2002–2007By Type of Call
Source: Table 57.
OTHER DATABASES
Domestic Violence-related Calls for assistance
While the number of Domestic Violence-Related Calls for Assistance decreased 11.2 percent from 2002 to 2007, the number of calls involving a weapon decreased 42.1 percent. The drop in calls involving a weapon may be the result of a change in the "personal weapon" definition and not an actual drop in weapon usage.

Data Tables

Table Page
1 CRIMES, 1966–2007 Number and Rate per 100,000 Population .......................102
2 CRIMES, 2002–2007 Number, Rate per 100,000 Population, and Percent Change ...................................................................104
3 CRIMES, 2002–2007 By Category and Crime ......................................................105
4 HOMICIDE CRIMES, 2002–2007 By Type of Weapon Used ..................................................105
5 FORCIBLE RAPE CRIMES, 2002–2007 Number and Rate per 100,000 Female Population .........106
6 ROBBERY CRIMES, 2002–2007 By Location, Type of Robbery, and Type of Weapon Used .......................................................................106
7 ASSAULT CRIMES, 2002–2007 By Type of Assault and Type of Weapon Used .............107
8 BURGLARY CRIMES, 2002–2007 By Location, Time of Day, Type of Burglary, and Type of Entry .......................................................................107
9 MOTOR VEHICLE THEFT CRIMES, 2002–2007 By Type of Vehicle ..............................................................108
10 LARCENY-THEFT CRIMES, 2002–2007 Number, Rate per 100,000 Population, and Percent Change ...................................................................108
11 LARCENY-THEFT CRIMES, 2002–2007 By Type and Value Categories ........................................109
12 VALUE OF STOLEN AND RECOVERED PROPERTY, 2002–2007 By Type and Percent Change ...........................................109
13 VALUE OF STOLEN AND RECOVERED PROPERTY, 2002–2007 By Type of Property ............................................................ 110
13A STOLEN AND RECOVERED PROPERTY, 2002–2007 By Type of Property and Percent Recovered .................. 111
14 ARSON CRIMES, 2002–2007 By Type of Property and Value of Property Damage ................................................................................. 112
15 CRIMES CLEARED, 2002–2007 Number of Crimes, Clearances, and Clearance Rate ... 113
Table Page
16 TOTAL ARRESTS, 1966–2007 Number and Rate per 100,000 Population at Risk ......... 114
17 TOTAL ARRESTS, 2002–2007 Number, Rate per 100,000 Population, and Percent Change ................................................................... 116
18 TOTAL ARRESTS, 2002–2007 By Level of Offense for Adult and Juvenile Arrests ....... 117
19 FELONY ARRESTS, 2002–2007 By Category .......................................................................... 117
20 FELONY ARRESTS, 2002–2007 By Category and Offense ................................................... 118
21 FELONY ARRESTS, 2002–2007 By Category and Offense for Adult and Juvenile Arrests ................................................................................... 119
22 FELONY ARRESTS, 2002–2007 Number, Rate per 100,000 Population at Risk, and Percent Change ...................................................................121
23 ADULT FELONY ARRESTS, 2002–2007 By Category, Offense, and Law Enforcement Disposition .............................................................................124
24 JUVENILE FELONY ARRESTS, 2002–2007 By Category, Offense, and Law Enforcement Disposition .............................................................................125
25 MISDEMEANOR ARRESTS, 2002–2007 By Offense ............................................................................126
26 MISDEMEANOR ARRESTS, 2002–2007 By Offense for Adult and Juvenile Arrests .......................127
27 MISDEMEANOR ARRESTS, 2002–2007 Number, Rate per 100,000 Population at Risk, and Percent Change ...................................................................128
28 ADULT MISDEMEANOR ARRESTS, 2002–2007 By Offense and Law Enforcement Disposition .................129
29 JUVENILE MISDEMEANOR AND STATUS OFFENSE ARRESTS, 2002–2007 By Level of Offense, Offense, and Law Enforcement Disposition .............................................................................130
30 FELONY AND MISDEMEANOR ARRESTS, 2007 Gender, Age, and Race/Ethnic Group of Arrestee ...........131
31 GENDER AND RACE/ETHNIC GROUP OF FELONY ARRESTEES, 2007 By Category and Offense ...................................................132
100 CRIME IN CALIFORNIA, 2007
CrimeS arreSTS
CRIME IN CALIFORNIA, 2007

Table Page
32 AGE OF FELONY ARRESTEES, 2007 Category and Offense .........................................................133
33 GENDER AND RACE/ETHNIC GROUP OF FELONY ARRESTEES, 2007 By Category, Offense, and Age .........................................134
34 GENDER AND RACE/ETHNIC GROUP OF MISDEMEANOR ARRESTEES, 2007 By Offense ............................................................................140
35 AGE OF MISDEMEANOR ARRESTEES, 2007 By Offense ............................................................................141
36 GENDER AND RACE/ETHNIC GROUP OF MISDEMEANOR ARRESTEES, 2007 By Offense and Age ...........................................................142
CrimeS
37 ADULT FELONY ARREST DISPOSITIONS, 1975–2007 By Type of Disposition ........................................................147
38 ADULT FELONY ARREST DISPOSITIONS, 2002–2007 By Type of Disposition and Sentence ...............................148
38A ADULT FELONY ARREST DISPOSITIONS, 2002–2007 By Type of Disposition and Sentence, Percent Distribution of Complaints Filed ..........................................149
39 ADULT FELONY ARREST DISPOSITIONS, 2002–2007 By Type of Disposition ........................................................150
40 ADULT FELONY ARREST DISPOSITIONS, 2007 Arrest Offense Category by Type of Disposition ..............150
41 ADULT FELONY ARRESTEES CONVICTED, 2002–2007 By Convicted Offense Category and Type of Sentence .............................................................................151
42 ADULT FELONY ARRESTEES CONVICTED, 2007 Convicted Offense Category by Type of Sentence ..........152
43 ADULTS UNDER STATE AND LOCAL SUPERVISION, 1966–2007 Number and Rate per 100,000 Population at Risk .........153
44 ADULTS UNDER STATE AND LOCAL SUPERVISION, 2002–2007 By Type of Supervision and Rate per 100,000 Population at Risk ...............................................................154
44A ADULTS UNDER STATE AND LOCAL SUPERVISION, 2002–2007 By Type of Supervision and Percent Distribution ............155
DATA TABLES CONTENTS 101
Table Page
45 ADULTS ON ACTIVE PROBATION AS OF DECEMBER 31, 2002–2007 By Level of Offense ............................................................156
46 ADULTS PLACED ON AND REMOVED FROM PROBATION, 2002–2007 By Level of Offense, Type of Removal, and Rate per 100,000 Population at Risk .........................................157
47 ADULTS COMMITTED TO STATE INSTITUTIONS, 2002–2007 By Type of Commitment, Type of Institution, and Rate per 100,000 Population at Risk ........................158
Criminal JUSTiCe eXPenDiTUreS anD PerSonnel
48 CRIMINAL JUSTICE EXPENDITURES, FISCAL YEARS 1967/68–2006/07 ..................................................................159
49 CRIMINAL JUSTICE EXPENDITURES, FISCAL YEARS 2001/02–2006/07 By Current-Dollar and Constant-Dollar Expenditures ........160
50 CRIMINAL JUSTICE EXPENDITURES, FISCAL YEARS 2001/02–2006/07 By Type of Agency ..............................................................160
51 CRIMINAL JUSTICE EXPENDITURES, FISCAL YEARS 2001/02–2006/07 By Type of Agency ..............................................................161
52 CRIMINAL JUSTICE FULL-TIME PERSONNEL, 1969–2007 By Type of Agency ..............................................................162
53 CRIMINAL JUSTICE FULL-TIME PERSONNEL, 2002–2007 By Type of Agency and Personnel Classification ............163
54 LAW ENFORCEMENT FULL-TIME PERSONNEL, 2002–2007 By Type of Agency ..............................................................164
55 CRIMINAL JUSTICE FULL-TIME PERSONNEL, 2002–2007 By Type of Agency ..............................................................164
56 CITIZENS' COMPLAINTS AGAINST PEACE OFFICERS, 1981–2007 Type of Complaint and Level of Criminal Complaint ......165
57 DOMESTIC VIOLENCE-RELATED CALLS FOR ASSISTANCE, 1986–2007 Type of Call and Weapon ..................................................166
58 POPULATION ESTIMATES, 1966–2007 ............................167
aDUlT arreST felonY DiSPoSiTionS
aDUlT CorreCTionS
Criminal JUSTiCe eXPenDiTUreS anD PerSonnel
oTHer DaTaBaSeS
PoPUlaTion
LIST OF TABLES

102
Table 1CrimeS, 1966-2007
Number and Rate per 100,000 Population
Year(s)Violent crimes Property crimes
Total HomicideForcible
rape RobberyAggravated
assault Total BurglaryMotor
vehicle theftLarceny-theft
over $4001
Number2007............ 191,493 2,258 9,047 70,702 109,486 681,235 237,759 220,126 223,3502006............ 194,128 2,483 9,213 70,961 111,471 707,607 246,449 242,692 218,466
2005a........... 189,593 2,503 9,345 63,424 114,321 722,333 249,563 256,998 215,7722004............ 197,432 2,394 9,598 61,573 123,867 712,193 244,914 251,747 215,5322003............ 204,591 2,402 9,918 63,597 128,674 693,137 240,705 240,798 211,6342002............ 207,988 2,392 10,176 64,805 130,615 667,592 237,445 221,780 208,3672001............ 210,510 2,201 9,882 63,299 135,128 626,033 229,922 201,074 195,037
2000............ 210,492 2,074 9,785 60,243 138,390 578,309 222,247 181,049 175,0131999............ 207,874 2,006 9,443 60,027 136,398 561,542 223,828 168,465 169,2491998............ 229,766 2,170 9,777 68,752 149,067 651,090 268,847 195,402 186,8411997............ 257,409 2,579 10,182 81,413 163,235 730,341 298,882 228,540 202,9191996............ 274,675 2,910 10,238 94,137 167,390 769,883 311,778 242,196 215,909
1995b........... 304,998 3,530 10,550 104,581 186,337 876,468 353,817 280,317 242,3341994............ 318,946 3,699 10,960 112,149 192,138 946,885 384,414 308,303 254,1681993............ 336,100 4,095 11,754 126,347 193,904 986,071 413,671 319,225 253,1751992............ 345,508 3,920 12,751 130,867 197,970 1,004,190 427,305 320,019 256,8661991............ 330,916 3,876 12,942 125,105 188,993 1,006,450 426,066 316,631 263,753
1990............ 311,923 3,562 12,716 112,460 183,185 959,595 402,533 303,209 253,8531989............ 284,015 3,159 11,956 96,424 172,476 958,765 410,148 298,392 250,2251988............ 261,990 2,947 11,771 86,190 161,082 905,813 407,555 265,975 232,2831987............ 254,137 2,929 12,114 83,373 155,721 864,203 420,182 229,695 214,3261986............ 248,352 3,030 12,118 92,513 140,691 869,216 457,743 205,602 205,871
1985............ 202,066 2,781 11,442 86,464 101,379 829,168 449,065 177,330 202,7731984............ 195,650 2,724 11,702 84,015 97,209 789,467 443,624 161,341 184,5021983............ 194,489 2,640 12,092 85,824 93,933 793,923 460,401 158,899 174,6231982............ 201,433 2,778 12,529 91,988 94,138 663,998 499,468 164,530 -1981............ 208,165 3,140 13,545 93,638 97,842 702,076 539,809 162,267 -
1980............ 209,903 3,405 13,661 90,282 102,555 718,394 543,846 174,548 -1979............ 183,704 2,941 12,199 75,649 92,915 661,980 494,736 167,244 -1978............ 164,751 2,601 11,249 67,920 82,981 638,848 485,742 153,106 -1977............ 152,827 2,481 10,715 62,207 77,424 606,750 462,736 144,014 -1976............ 143,507 2,214 9,552 59,132 72,609 603,827 465,758 138,069 -
1975............ 138,400 2,196 8,787 59,747 67,670 601,366 468,433 132,933 -1974............ 127,469 1,970 8,480 52,742 64,277 565,032 431,863 133,169 -1973............ 116,506 1,862 8,349 49,524 56,771 538,598 407,375 131,223 -1972............ 110,680 1,789 8,131 48,834 51,926 537,838 398,465 139,373 -1971............ 104,489 1,633 7,281 47,477 48,098 535,068 391,157 143,911 -
1970............ 94,347 1,355 6,992 41,397 44,603 486,204 348,575 137,629 -1969............ 89,191 1,376 6,958 39,212 41,645 453,215 321,749 131,466 -1968............ 80,382 1,171 5,419 36,858 36,934 418,749 299,589 119,160 -1967............ 67,671 1,051 4,430 28,508 33,682 362,867 265,780 97,087 -1966............ 56,942 897 4,078 22,315 29,652 321,464 234,535 86,929 -
(continued)
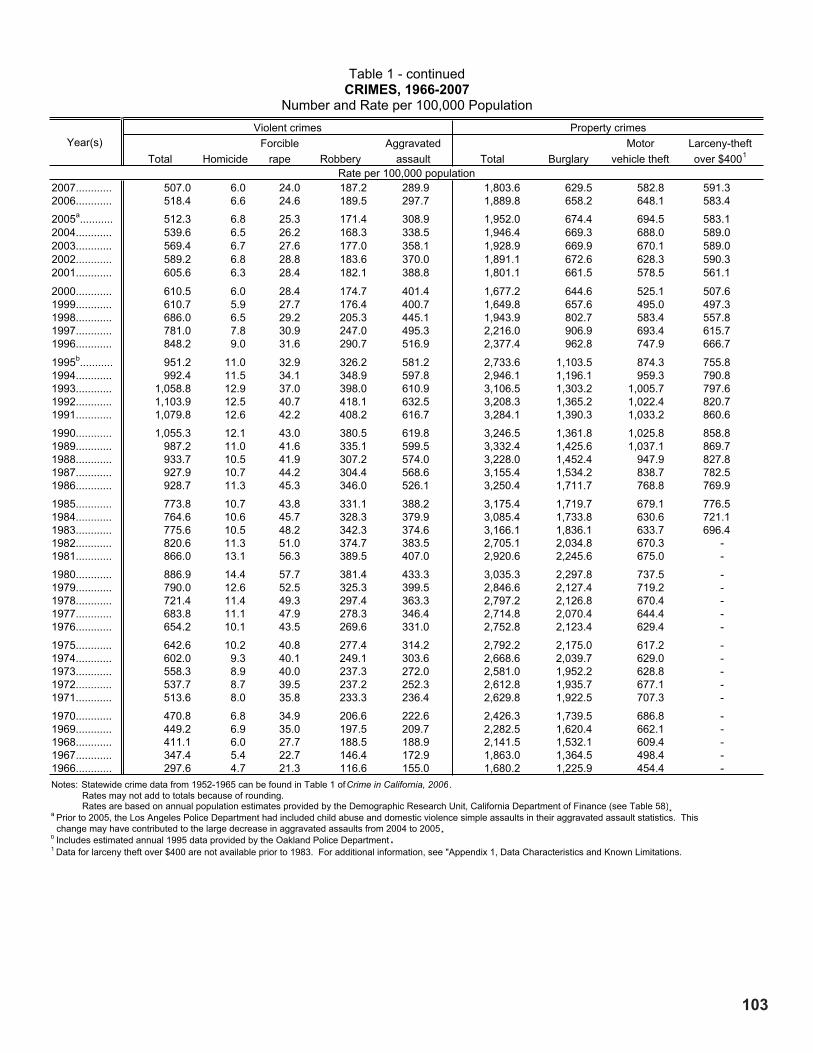
103
Table 1 - continuedCrimeS, 1966-2007
Number and Rate per 100,000 Population
Year(s)Violent crimes Property crimes
Total HomicideForcible
rape RobberyAggravated
assault Total BurglaryMotor
vehicle theftLarceny-theftover $4001
Rate per 100,000 population2007............ 507.0 6.0 24.0 187.2 289.9 1,803.6 629.5 582.8 591.32006............ 518.4 6.6 24.6 189.5 297.7 1,889.8 658.2 648.1 583.4
2005a........... 512.3 6.8 25.3 171.4 308.9 1,952.0 674.4 694.5 583.12004............ 539.6 6.5 26.2 168.3 338.5 1,946.4 669.3 688.0 589.02003............ 569.4 6.7 27.6 177.0 358.1 1,928.9 669.9 670.1 589.02002............ 589.2 6.8 28.8 183.6 370.0 1,891.1 672.6 628.3 590.32001............ 605.6 6.3 28.4 182.1 388.8 1,801.1 661.5 578.5 561.1
2000............ 610.5 6.0 28.4 174.7 401.4 1,677.2 644.6 525.1 507.61999............ 610.7 5.9 27.7 176.4 400.7 1,649.8 657.6 495.0 497.31998............ 686.0 6.5 29.2 205.3 445.1 1,943.9 802.7 583.4 557.81997............ 781.0 7.8 30.9 247.0 495.3 2,216.0 906.9 693.4 615.71996............ 848.2 9.0 31.6 290.7 516.9 2,377.4 962.8 747.9 666.7
1995b........... 951.2 11.0 32.9 326.2 581.2 2,733.6 1,103.5 874.3 755.81994............ 992.4 11.5 34.1 348.9 597.8 2,946.1 1,196.1 959.3 790.81993............ 1,058.8 12.9 37.0 398.0 610.9 3,106.5 1,303.2 1,005.7 797.61992............ 1,103.9 12.5 40.7 418.1 632.5 3,208.3 1,365.2 1,022.4 820.71991............ 1,079.8 12.6 42.2 408.2 616.7 3,284.1 1,390.3 1,033.2 860.6
1990............ 1,055.3 12.1 43.0 380.5 619.8 3,246.5 1,361.8 1,025.8 858.81989............ 987.2 11.0 41.6 335.1 599.5 3,332.4 1,425.6 1,037.1 869.71988............ 933.7 10.5 41.9 307.2 574.0 3,228.0 1,452.4 947.9 827.81987............ 927.9 10.7 44.2 304.4 568.6 3,155.4 1,534.2 838.7 782.51986............ 928.7 11.3 45.3 346.0 526.1 3,250.4 1,711.7 768.8 769.9
1985............ 773.8 10.7 43.8 331.1 388.2 3,175.4 1,719.7 679.1 776.51984............ 764.6 10.6 45.7 328.3 379.9 3,085.4 1,733.8 630.6 721.11983............ 775.6 10.5 48.2 342.3 374.6 3,166.1 1,836.1 633.7 696.41982............ 820.6 11.3 51.0 374.7 383.5 2,705.1 2,034.8 670.3 -1981............ 866.0 13.1 56.3 389.5 407.0 2,920.6 2,245.6 675.0 -
1980............ 886.9 14.4 57.7 381.4 433.3 3,035.3 2,297.8 737.5 -1979............ 790.0 12.6 52.5 325.3 399.5 2,846.6 2,127.4 719.2 -1978............ 721.4 11.4 49.3 297.4 363.3 2,797.2 2,126.8 670.4 -1977............ 683.8 11.1 47.9 278.3 346.4 2,714.8 2,070.4 644.4 -1976............ 654.2 10.1 43.5 269.6 331.0 2,752.8 2,123.4 629.4 -
1975............ 642.6 10.2 40.8 277.4 314.2 2,792.2 2,175.0 617.2 -1974............ 602.0 9.3 40.1 249.1 303.6 2,668.6 2,039.7 629.0 -1973............ 558.3 8.9 40.0 237.3 272.0 2,581.0 1,952.2 628.8 -1972............ 537.7 8.7 39.5 237.2 252.3 2,612.8 1,935.7 677.1 -1971............ 513.6 8.0 35.8 233.3 236.4 2,629.8 1,922.5 707.3 -
1970............ 470.8 6.8 34.9 206.6 222.6 2,426.3 1,739.5 686.8 -1969............ 449.2 6.9 35.0 197.5 209.7 2,282.5 1,620.4 662.1 -1968............ 411.1 6.0 27.7 188.5 188.9 2,141.5 1,532.1 609.4 -1967............ 347.4 5.4 22.7 146.4 172.9 1,863.0 1,364.5 498.4 -1966............ 297.6 4.7 21.3 116.6 155.0 1,680.2 1,225.9 454.4 -Notes: Statewide crime data from 1952-1965 can be found in Table 1 of Crime in California, 2006 . Rates may not add to totals because of rounding. Rates are based on annual population estimates provided by the Demographic Research Unit, California Department of Finance (see Table 58)a Prior to 2005, the Los Angeles Police Department had included child abuse and domestic violence simple assaults in their aggravated assault statistics. This change may have contributed to the large decrease in aggravated assaults from 2004 to 2005b Includes estimated annual 1995 data provided by the Oakland Police Department1 Data for larceny theft over $400 are not available prior to 1983. For additional information, see "Appendix 1, Data Characteristics and Known Limitations.
..
.

104
Table 2CrimeS, 2002-2007
Number, Rate per 100,000 Population, and Percent Change
Year(s)
Violent crimes Property crimes Larceny-theft
Arson
Total HomicideForcible
rape Robbery
Aggra-vated
assault Total Burglary
Motorvehicle
theft
Larceny-theft
over $400 Total Over $400$400 and
underNumber
2007………………2006………………2005a……………2004………………2003………………2002………………
191,493194,128189,593197,432204,591207,988
2,2582,4832,5032,3942,4022,392
9,0479,2139,3459,5989,918
10,176
70,70270,96163,42461,57363,59764,805
109,486111,471114,321123,867128,674130,615
681,235707,607722,333712,193693,137667,592
237,759246,449249,563244,914240,705237,445
220,126242,692256,998251,747240,798221,780
223,350218,466215,772215,532211,634208,367
654,481666,869688,820726,614727,527712,419
223,350218,466215,772215,532211,634208,367
431,131448,403473,048511,082515,893504,052
11,40012,68712,27212,66013,67714,007
Percent change in number2006 to 2007……2005 to 2006……2004 to 2005……2003 to 2004……2002 to 2003……
2002 to 2007……
-1.42.4
-4.0-3.5-1.6
-7.9
-9.1-0.84.6
-0.30.4
-5.6
-1.8-1.4-2.6-3.2-2.5
-11.1
-0.411.93.0
-3.2-1.9
9.1
-1.8-2.5-7.7-3.7-1.5
-16.2
-3.7-2.01.42.73.8
2.0
-3.5-1.21.91.71.4
0.1
-9.3-5.62.14.58.6
-0.7
2.21.20.11.81.6
7.2
-1.9-3.2-5.2-0.12.1
-8.1
2.21.20.11.81.6
7.2
-3.9-5.2-7.4-0.92.3
-14.5
-10.13.4
-3.1-7.4-2.4
-18.6Rate per 100,000 population1
2007………………2006………………2005………………2004………………2003………………2002………………
507.0518.4512.3539.6569.4589.2
6.06.66.86.56.76.8
24.024.625.326.227.628.8
187.2189.5171.4168.3177.0183.6
289.9297.7308.9338.5358.1370.0
1,803.61,889.81,952.01,946.41,928.91,891.1
629.5658.2674.4669.3669.9672.6
582.8648.1694.5688.0670.1628.3
591.3583.4583.1589.0589.0590.3
1,732.71,781.01,861.41,985.82,024.62,018.1
591.3583.4583.1589.0589.0590.3
1,141.41,197.51,278.31,396.71,435.71,427.9
30.233.933.234.638.139.7
Percent change in rate2006 to 2007……2005 to 2006……2004 to 2005……2003 to 2004……2002 to 2003……
2002 to 2007……
-2.21.2
-5.1-5.2-3.4
-14.0
-9.1-2.94.6
-3.0-1.5
-11.8
-2.4-2.8-3.4-5.1-4.2
-16.7
-1.210.61.8
-4.9-3.6
2.0
-2.6-3.6-8.7-5.5-3.2
-21.6
-4.6-3.20.30.92.0
-4.6
-4.4-2.40.8
-0.1-0.4
-6.4
-10.1-6.70.92.76.7
-7.2
1.40.1
-1.00.0
-0.2
0.2
-2.7-4.3-6.3-1.90.3
-14.1
1.40.1
-1.00.0
-0.2
0.2
-4.7-6.3-8.5-2.70.5
-20.1
-10.92.1
-4.0-9.2-4.0
-23.9Note: Rates may not add to totals because of rounding.a Prior to 2005, the Los Angeles Police Department had included child abuse and domestic violence simple assaults in their aggravated assault statistics. This change may have contributed to the large decrease in aggravated assaults from 2004 to 2005.1 Rates are based on annual population estimates provided by the Demographic Research Unit, California Department of Finance (see Table 58).

105
Table 3CrimeS, 2002-2007
By Category and Crime2002 2003 2004 2005a 2006 2007Category and crime
Number Percent Number Percent Number Percent Number Percent Number Percent NumberCrimes within category
Violent crimes.......................... 207,988 100.0 204,591 100.0 197,432 100.0 189,593 100.0 194,128 100.0 191,493
Percent
100.0 Homicide............................... 2,392 1.2 2,402 1.2 2,394 1.2 2,503 1.3 2,483 1.3 2,258 1.2 Forcible rape......................... 10,176 4.9 9,918 4.8 9,598 4.9 9,345 4.9 9,213 4.7 9,047 4.7 Robbery................................ 64,805 31.2 63,597 31.1 61,573 31.2 63,424 33.5 70,961 36.6 70,702 36.9 Aggravated assault............... 130,615 62.8 128,674 62.9 123,867 62.7 114,321 60.3 111,471 57.4 109,486 57.2
Property crimes........................ 667,592 100.0 693,137 100.0 712,193 100.0 722,333 100.0 707,607 100.0 681,235 100.0 Burglary................................. 237,445 35.6 240,705 34.7 244,914 34.4 249,563 34.5 246,449 34.8 237,759 34.9 Motor vehicle theft................. 221,780 33.2 240,798 34.7 251,747 35.3 256,998 35.6 242,692 34.3 220,126 32.3 Larceny-theft over $400........ 208,367 31.2 211,634 30.5 215,532 30.3 215,772 29.9 218,466 30.9 223,350Note: Percentages may not add to 100.0 because of rounding.a Prior to 2005, the Los Angeles Police Department had included child abuse and domestic violence simple assaults in their aggravated assault statistics. This change may have contributed to the large decrease in aggravated assaults from 2004 to 2005.
Table 4HomiCiDe CrimeS, 2002-2007
By Type of Weapon Used
Type Percent change2002 2003 2004 2005 2006 2007
of 2002-weapon used Number Percent Number Percent Number Percent Number Percent Number Percent Number Percent 2007
Total............................................. 2,392 2,402 2,394 2,503 2,483 2,258
32.8
2006-2007
Unknown................................... 28 23 12 22 25 34
Known....................................... 2,364 100.0 2,379 100.0 2,382 100.0 2,481 100.0 2,458 100.0 2,224 100.0 -5.9 -9.5 Firearm.................................. 1,735 73.4 1,733 72.8 1,730 72.6 1,845 74.4 1,821 74.1 1,611 72.4 -7.1 -11.5 Knife or cutting instrument..... 274 11.6 258 10.8 282 11.8 291 11.7 314 12.8 298 13.4 8.8 -5.1 Blunt object1 ........................... 116 4.9 116 4.9 104 4.4 78 3.1 77 3.1 94 4.2 -19.0 22.1 Personal weapon2 .................. 118 5.0 138 5.8 148 6.2 138 5.6 130 5.3 118 5.3 0.0 -9.2 Other...................................... 121 5.1 134Note: Percentages may not add to 100.0 because of rounding.1 Club, etc.2 Hands, feet, etc.
5.6 118 5.0 129 5.2 116 4.7 103 4.6 -14.9 -11.2

106
Table 6roBBerY CrimeS, 2002-2007
By Location, Type of Robbery, and Type of Weapon Used
Location,type of robbery,
and weapon
2002 2003 2004 2005 2006 2007Percent change2002- 2006-2007 2007Number Percent Number Percent Number Percent Number Percent Number Percent Number Percent
TotalTotal................................................. 64,805 100.0 63,597 100.0 61,573 100.0 63,424 100.0 70,961 100.0 70,702 100.0 9.1 -0.4
Location Highway1...................................... Commercial2................................ Residence.................................... Bank............................................ Other3..........................................
29,60315,916
5,4891,502
12,295
45.724.6
8.52.3
19.0
29,51114,854
5,3491,369
12,514
46.423.4
8.42.2
19.7
28,73814,563
5,0461,323
11,903
46.723.7
8.22.1
19.3
30,38114,886
5,1421,233
11,782
47.923.5
8.11.9
18.6
34,68515,858
5,5121,331
13,575
48.922.3
7.81.9
19.1
34,88014,922
5,6741,178
14,048
49.321.1
8.01.7
19.9
17.8-6.23.4
-21.614.3
0.6-5.92.9
-11.53.5
Type of robbery Armed.......................................... Strong-arm4.................................
35,81228,993
55.344.7
34,25229,345
53.946.1
32,24929,324
52.447.6
34,12629,298
53.846.2
37,92533,036
53.446.6
36,74433,958
52.048.0
2.617.1
-3.12.8
Type of weapon used Armed....................................... Firearm.................................. Knife or cutting instrument..... Other dangerous weapon......
35,81223,444
6,5995,769
100.065.518.416.1
34,25222,155
6,4535,644
100.064.718.816.5
32,24920,609
6,1195,521
100.063.919.017.1
34,12621,947
6,2305,949
100.064.318.317.4
37,92524,409
6,8336,683
100.064.418.017.6
36,74423,519
6,6326,593
100.064.018.017.9
2.60.30.5
14.3
-3.1-3.6-2.9-1.3
Note: Percentages may not add to 100.0 because of rounding.1 Streets, parks, parking lots, etc.2 Commercial house, gas or service station, convenience store, etc.3 Churches, schools, government buildings, trains, wooded areas, etc.4 Muggings and similar offenses where no weapon is used, but strong-arm tactics (limited to the use of personal weapons such as hands, arms, feet, fists, teeth, etc.) are employed or their use is threatened.
Table 5forCiBle raPe CrimeS, 2002-2007
Number and Rate per 100,000 Female Population
2002 2003 2004 2005 2006 2007Percent change2002- 2006-2007 2007Number Percent Number Percent Number Percent Number Percent Number Percent Number Percent
.Total..................................... 10,176 100.0 9,918 100.0 9,598 100.0 9,345 100.0 9,213 100.0 9,047 100.0 -11.1 -1.8 Rape by force................... 8,620 84.7 8,461 85.3 8,287 86.3 8,115 86.8 7,937 86.2 7,931 87.7 -8.0 -0.1 Attempts to commit forcible rape.................... 1,556 15.3 1,457 14.7 1,311 13.7 1,230 13.2 1,276 13.8 1,116 12.3 -28.3 -12.5
Female population................ 17,818,043 18,093,375 18,214,757 18,450,418 18,689,664 18,939,596 6.3 1.3Rate per 100,000 female population.............. 57.1 54.8 52.7 50.6 49.3 47.8 -16.3 -3.0Note: Rates are based on annual population estimates provided by the Demographic Research Unit, California Department of Finance.

107
Table 8BUrGlarY CrimeS, 2002-2007
By Location, Time of Day, Type of Burglary, and Type of Entry
Location,time of day, type of burglary,
and type of entry
2002 2003 2004 2005 2006 2007 Percent change2002- 2006-2007 2007Number Percent Number Percent Number Percent Number Percent Number Percent Number Percent
TotalTotal....................................... 237,445 100.0 240,705 100.0 244,914 100.0 249,563 100.0 246,449 100.0 237,759 100.0 0.1 -3.5
Location. Residence...........................
Nonresidence......................136,742100,703
57.642.4
137,801102,904
57.242.8
139,581105,333
57.043.0
141,934107,629
56.943.1
143,021103,428
58.042.0
142,74995,010
60.040.0
4.4-5.7
-0.2-8.1
Time of day Daytime............................... Nighttime.............................
. Unknown.............................
89,70865,61382,124
37.827.634.6
91,19867,84081,667
37.928.233.9
93,22668,50583,183
38.128.034.0
94,87769,12685,560
38.027.734.3
96,85267,66081,937
39.327.533.2
97,73763,91076,112
41.126.932.0
9.0-2.6-7.3
0.9-5.5-7.1
Burglary and attempted burglary Burglary............................... Attempted burglary..............
221,58915,856
93.36.7
225,18015,525
93.66.4
230,60114,313
94.25.8
234,62114,942
94.06.0
232,13914,310
94.25.8
223,23214,527
93.96.1
0.7-8.4
-3.81.5
Type of entry Burglary............................ Force............................. No force.........................
221,589137,78283,807
100.062.237.8
225,180138,30786,873
100.061.438.6
230,601140,68789,914
100.061.039.0
234,621143,88690,735
100.061.338.7
232,139140,29691,843
100.060.439.6
223,232132,87790,355
100.059.540.5
0.7-3.67.8
-3.8-5.3-1.6
Note: Percentages may not add to 100.0 because of rounding.
Table 7aSSaUlT CrimeS, 2002-2007
By Type of Assault and Type of Weapon Used
Type of assaultand
weapon used
2002 2003 2004 2005 2006 2007Percent change2002- 2006-2007 2007Number Percent Number Percent Number Percent Number Percent Number Percent Number Percent
Total............................................ 387,053 387,033 378,502 368,037 373,265 370,485 -4.3 -0.7
Aggravated assault.................. 130,615 100.0 128,674 100.0 123,867 100.0 114,321 100.0 111,471 100.0 109,486 100.0 -16.2 -1.8 Firearm.................................. 22,916 17.5 22,311 17.3 22,237 18.0 23,266 20.4 23,504 21.1 21,720 19.8 -5.2 -7.6 Knife or cutting instrument.... 17,983 13.8 18,065 14.0 18,608 15.0 18,677 16.3 18,209 16.3 17,430 15.9 -3.1 -4.3 Other dangerous weapon...... 42,845 32.8 42,699 33.2 41,699 33.7 41,761 36.5 40,465 36.3 39,975 36.5 -6.7 -1.2 Personal weapon 1................ 46,871 35.9 45,599 35.4 41,323 33.4 30,617 26.8 29,293 26.3 30,361 27.7 -35.2 3.6
Non-aggravated assault 2......... 256,438 258,359 254,635 253,716 261,794 260,999 1.8 -0.3Note: Percentages may not add to 100.0 because of rounding.a Prior to 2005, the Los Angeles Police Department had included child abuse and domestic violence simple assaults in their aggravated assault statistics. This change may have contributed to the large decrease in aggravated assaults from 2004 to 2005.1 Hands, feet, etc.2 Assaults which do not involve the use of a firearm, knife, cutting instrument, or other dangerous weapon and in which there are no serious or aggravated injuries to the victims. Non-aggravated (simple) assaults are not included in the violent crime count. This category is shown here as a means of quality control and for the purpose of looking at total assault violence.

108
Table 9moTor VeHiCle THefT CrimeS, 2002-2007
By Type of Vehicle
Typeof
vehicle
2002 2003 2004 2005 2006 2007 Percent change2002- 2006-2007 2007Number Percent Number Percent Number Percent Number Percent Number Percent Number Percent
Total.................................... 221,780 100.0 240,798 100.0 251,747 100.0 256,998 100.0 242,692 100.0 220,126 100.0 -0.7 -9.3
Autos................................ 162,478 73.3 180,451 74.9 188,311 74.8 193,183 75.2 182,658 75.3 167,250 76.0 2.9 -8.4 Trucks and buses1............ 47,550 21.4 46,741 19.4 48,262 19.2 48,209 18.8 45,419 18.7 40,219 18.3 -15.4 -11.4 Other vehicles2................. 11,752 5.3 13,606 5.7 15,174 6.0 15,606 6.1 14,615 6.0 12,657 5.7 7.7 -13.4Note: Percentages may not add to 100.0 because of rounding.1 Includes pickup trucks, vans, and motor homes.2 Includes motorcycles, snowmobiles, motor scooters, trail bikes, etc.
Table 10larCenY-THefT CrimeS, 2002-2007
Number, Rate per 100,000 Population, and Percent Change
Valuecategories 2002 2003 2004 2005 2006 2007
Percent change2002- 2006-2007 2007
NumberTotal................................ 712,419 727,527 726,614 688,820 666,869 654,481 -8.1 -1.9
Under $50.................... 250,147 256,026 251,127 230,705 219,194 210,131 -16.0 -4.1 $50-$199...................... 143,798 146,475 145,082 133,188 123,996 118,991 -17.3 -4.0 $200-$400.................... 110,107 113,392 114,873 109,155 105,213 102,009 -7.4 -3.0 Over $400.................... 208,367 211,634 215,532 215,772 218,466 223,350 7.2 2.2
Rate per 100,000 population1
Total................................ 2,018.1 2,024.6 1,985.8 1,861.4 1,781.0 1,732.7 -14.1 -2.7
Under $50.................... 708.6 712.5 686.3 623.4 585.4 556.3 -21.5 -5.0 $50-$199...................... 407.3 407.6 396.5 359.9 331.1 315.0 -22.7 -4.9 $200-$400.................... 311.9 315.6 313.9 295.0 281.0 270.1 -13.4 -3.9 Over $400.................... 590.3 589.0 589.0 583.1 583.4 591.3 0.2 1.4Note: Rates may not add to total because of rounding.1 Rates are based on annual population estimates provided by the Demographic Research Unit, California Department of Finance (see Table 58).

109
Table 11larCenY-THefT CrimeS, 2002-2007
By Type and Value Categories
Type of larceny-theftand
value categories
2002 2003 2004 2005 2006 2007Percent change2002- 2006-2007 2007Number Percent Number Percent Number Percent Number Percent Number Percent Number Percent
TotalTotal............................................ 712,419 100.0 727,527 100.0 726,614 100.0 688,820 100.0 666,869 100.0 654,481 100.0 -8.1 -1.9
Type of larceny-theft Shoplifting................................ 90,597 12.7 93,086 12.8 93,482 12.9 86,364 12.5 82,775 12.4 88,412 13.5 -2.4 6.8 From motor vehicles................ 270,230 37.9 282,126 38.8 280,665 38.6 272,073 39.5 266,186 39.9 256,636 39.2 -5.0 -3.6 Motor vehicle accessories....... 78,528 11.0 80,734 11.1 82,037 11.3 73,035 10.6 64,615 9.7 57,762 8.8 -26.4 -10.6 Bicycles................................... 26,474 3.7 26,605 3.7 25,231 3.5 23,244 3.4 21,041 3.2 20,074 3.1 -24.2 -4.6 From buildings......................... 106,359 14.9 101,445 13.9 99,960 13.8 93,578 13.6 89,171 13.4 85,268 13.0 -19.8 -4.4
All other................................... 140,231 19.7 143,531 19.7 145,239 20.0 140,526 20.4 143,081 21.5 146,329 22.4 4.3 2.3 Pocket-picking...................... 3,788 0.5 3,864 0.5 3,509 0.5 3,274 0.5 3,384 0.5 3,791 0.6 0.1 12.0 Purse-snatching.................... 4,234 0.6 4,507 0.6 4,291 0.6 4,125 0.6 4,513 0.7 4,100 0.6 -3.2 -9.2 From coin machines............. 3,636 0.5 3,455 0.5 3,342 0.5 3,306 0.5 2,519 0.4 2,394 0.4 -34.2 -5.0 Other..................................... 128,573 18.0 131,705 18.1 134,097 18.5 129,821 18.8 132,665 19.9 136,044 20.8 5.8 2.5
Value categories Under $50................................ 250,147 35.1 256,026 35.2 251,127 34.6 230,705 33.5 219,194 32.9 210,131 32.1 -16.0 -4.1 $50 to $199.............................. 143,798 20.2 146,475 20.1 145,082 20.0 133,188 19.3 123,996 18.6 118,991 18.2 -17.3 -4.0 $200 to $400............................ 110,107 15.5 113,392 15.6 114,873 15.8 109,155 15.8 105,213 15.8 102,009 15.6 -7.4 -3.0 Over $400................................ 208,367 29.2 211,634 29.1 215,532 29.7 215,772 31.3 218,466 32.8 223,350 34.1 7.2 2.2Note: Percentages may not add to subtotals or 100.0 because of rounding.
Table 12ValUe of STolen anD reCoVereD ProPerTY, 2002-2007
By Type and Percent Change(Value Shown in Thousands of Dollars)
Year(s)
Stolen Recovered Percent recoveredto stolen1
Value
Total
Percent
Motor vehicles
Value Percent
All other
Value Percent Value
Total
Percent
Motor vehicles
Value Percent
All other
Value Percent TotalMotor
vehiclesAll
other2007...................2006...................2005...................2004...................2003...................2002...................
$2,812,907$2,894,595$2,757,557$2,643,105$2,517,050$2,489,135
100.0100.0100.0100.0100.0100.0
1,339,1621,453,1441,424,7221,363,2491,315,8701,241,829
47.650.251.751.652.349.9
1,473,7451,441,4501,332,8351,279,8561,201,1801,247,306
52.449.848.348.447.750.1
$911,963$1,016,286$1,023,849
$971,113$927,554$898,402
100.0100.0100.0100.0100.0100.0
838,472936,629964,401907,370870,057837,474
91.992.294.293.493.893.2
73,49179,65759,44863,74357,49760,928
8.17.85.86.66.26.8
32.435.137.136.736.936.1
62.664.567.766.666.167.4
5.05.54.55.04.84.9
Percent change in value2006 to 2007.......2002 to 2007.......
-2.813.0
-7.87.8
2.218.2
-10.31.5
-10.50.1
-7.720.6
Note: Values may not add to total because of rounding.1 Percent recovered is the ratio of the value of property recovered within the year to the value of property stolen within the same year.

110
Table 13ValUe of STolen anD reCoVereD ProPerTY, 2002-2007
By Type of Property(Value Shown in Thousands of Dollars)
Type of property2002 2003 2004 2005 2006 2007
Percent change2002- 2006-2007 2007Value Percent Value Percent Value Percent Value Percent Value Percent Value Percent
StolenTotal................................................... $2,489,135 100.0 $2,517,050 100.0 $2,643,105 100.0 $2,757,557 100.0 $2,894,595 100.0 $2,812,907 100.0 13.0 -2.8
Currency, notes, etc....................... 194,781 7.8 180,603 7.2 191,788 7.3 187,060 6.8 201,048 6.9 207,538 7.4 6.5 3.2 Jewelry and precious metals.......... 203,163 8.2 225,922 9.0 245,172 9.3 242,319 8.8 264,729 9.1 304,412 10.8 49.8 15.0 Clothing and furs............................ 50,170 2.0 49,276 2.0 48,501 1.8 50,073 1.8 48,995 1.7 64,912 2.3 29.4 32.5 Motor vehicles................................ 1,241,829 49.9 1,315,870 52.3 1,363,249 51.6 1,424,722 51.7 1,453,144 50.2 1,339,162 47.6 7.8 -7.8 Office equipment............................ 114,206 4.6 111,404 4.4 122,629 4.6 170,825 6.2 154,856 5.3 142,079 5.1 24.4 -8.3
Televisions, radios, stereos, etc..... 150,654 6.1 146,985 5.8 158,752 6.0 150,850 5.5 156,976 5.4 157,299 5.6 4.4 0.2 Firearms......................................... 8,626 0.3 9,175 0.4 11,552 0.4 11,196 0.4 12,279 0.4 18,975 0.7 120.0 54.5 Household goods............................ 38,603 1.6 39,144 1.6 35,568 1.3 42,750 1.6 52,531 1.8 40,573 1.4 5.1 -22.8 Consumable goods......................... 21,822 0.9 18,695 0.7 14,874 0.6 15,729 0.6 15,019 0.5 16,944 0.6 -22.4 12.8 Livestock......................................... 1,282 0.1 1,275 0.1 1,790 0.1 1,653 0.1 1,726 0.1 1,301 0.0 1.5 -24.6 Other............................................... 464,000 18.6 418,702 16.6 449,232 17.0 460,379 16.7 533,291 18.4 519,713 18.5 12.0 -2.5
RecoveredTotal................................................... $898,402 100.0 $927,554 100.0 $971,113 100.0 $1,023,849 100.0 $1,016,286 100.0 $911,963 100.0 1.5 -10.3
Currency, notes, etc....................... 4,502 0.5 4,441 0.5 4,149 0.4 2,872 0.3 5,047 0.5 4,142 0.5 -8.0 -17.9 Jewelry and precious metals.......... 5,302 0.6 6,646 0.7 8,968 0.9 6,068 0.6 10,319 1.0 12,828 1.4 141.9 24.3 Clothing and furs............................ 4,772 0.5 5,283 0.6 4,779 0.5 6,042 0.6 6,320 0.6 6,157 0.7 29.0 -2.6 Motor vehicles................................ 837,474 93.2 870,057 93.8 907,370 93.4 964,401 94.2 936,629 92.2 838,472 91.9 0.1 -10.5 Office equipment............................ 4,237 0.5 3,633 0.4 4,425 0.5 4,023 0.4 5,703 0.6 4,582 0.5 8.1 -19.7
Televisions, radios, stereos, etc..... 4,132 0.5 4,747 0.5 4,656 0.5 5,083 0.5 6,248 0.6 6,650 0.7 60.9 6.4 Firearms......................................... 426 0.0 459 0.0 497 0.1 705 0.1 709 0.1 592 0.1 39.0 -16.5 Household goods............................ 1,518 0.2 1,564 0.2 1,716 0.2 1,433 0.1 1,896 0.2 1,856 0.2 22.3 -2.1 Consumable goods......................... 1,759 0.2 1,258 0.1 1,972 0.2 1,329 0.1 2,064 0.2 1,540 0.2 -12.5 -25.4 Livestock......................................... 79 0.0 128 0.0 101 0.0 472 0.0 259 0.0 121 0.0 53.2 -53.3 Other............................................... 34,202 3.8 29,338 3.2 32,479 3.3 31,422 3.1 41,092 4.0 35,022 3.8 2.4 -14.8Note: Values and percentages may not add to total or 100.0 because of rounding .

111
Table 13ASTolen anD reCoVereD ProPerTY, 2002-2007
By Type of Property and Percent Recovered1
Type of property recovered 2002 2003 2004 2005 2006 2007Total................................................. 36.1 36.9 36.7 37.1 35.1 32.4
Currency, notes, etc...................... 2.3 2.5 2.2 1.5 2.5 2.0 Jewelry and precious metals......... 2.6 2.9 3.7 2.5 3.9 4.2 Clothing and furs........................... 9.5 10.7 9.9 12.1 12.9 9.5 Motor vehicles............................... 67.4 66.1 66.6 67.7 64.5 62.6 Office equipment........................... 3.7 3.3 3.6 2.4 3.7 3.2
Televisions, radios, stereos, etc.... 2.7 3.2 2.9 3.4 4.0 4.2 Firearms........................................ 4.9 5.0 4.3 6.3 5.8 3.1 Household goods.......................... 3.9 4.0 4.8 3.4 3.6 4.6 Consumable goods....................... 8.1 6.7 13.3 8.4 13.7 9.1 Livestock....................................... 6.2 10.0 5.6 28.6 15.0 9.3 Other............................................. 7.4 7.0 7.2 6.8 7.7 6.71 Percent recovered is the ratio of the value of property recovered within the year to the value of property stolen within the same year.
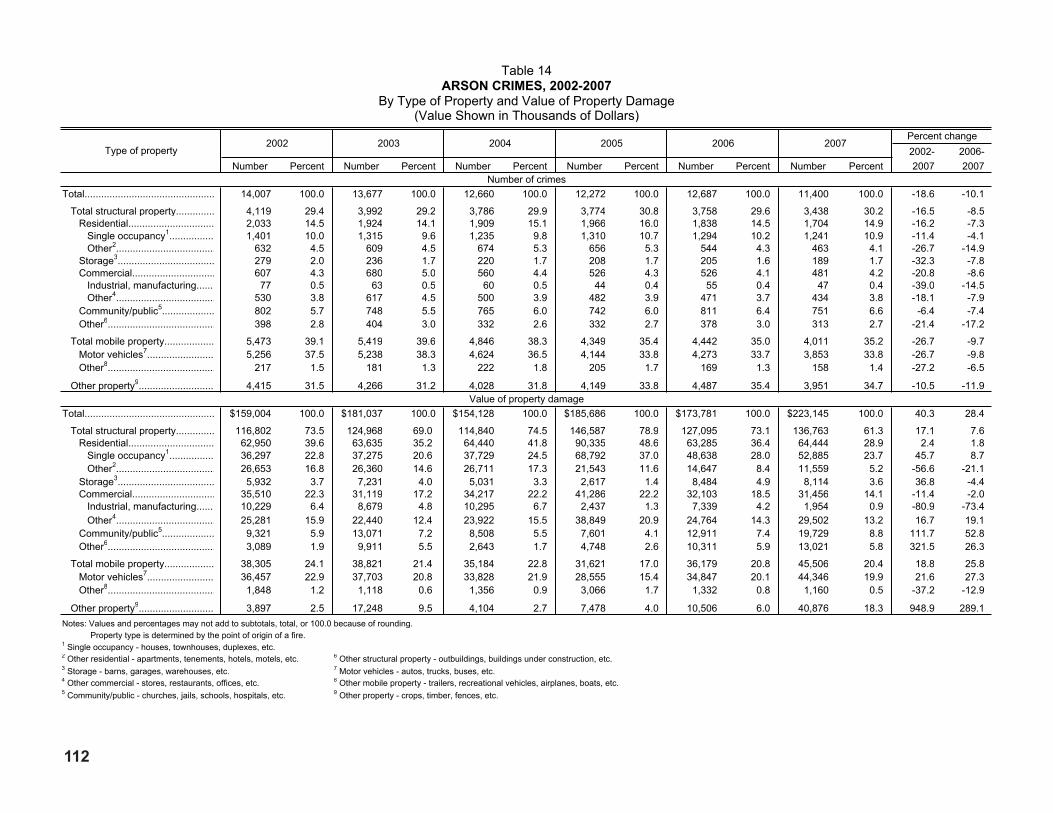
112
Table 14arSon CrimeS, 2002-2007
By Type of Property and Value of Property Damage(Value Shown in Thousands of Dollars)
Type of property2002 2003 2004 2005 2006 2007
Percent change2002- 2006-2007 2007Number Percent Number Percent Number Percent Number Percent Number Percent Number Percent
Number of crimesTotal............................................... 14,007 100.0 13,677 100.0 12,660 100.0 12,272 100.0 12,687 100.0 11,400 100.0 -18.6 -10.1
Total structural property.............. 4,119 29.4 3,992 29.2 3,786 29.9 3,774 30.8 3,758 29.6 3,438 30.2 -16.5 -8.5 Residential............................... 2,033 14.5 1,924 14.1 1,909 15.1 1,966 16.0 1,838 14.5 1,704 14.9 -16.2 -7.3 Single occupancy1................ 1,401 10.0 1,315 9.6 1,235 9.8 1,310 10.7 1,294 10.2 1,241 10.9 -11.4 -4.1 Other2.................................... 632 4.5 609 4.5 674 5.3 656 5.3 544 4.3 463 4.1 -26.7 -14.9 Storage3................................... 279 2.0 236 1.7 220 1.7 208 1.7 205 1.6 189 1.7 -32.3 -7.8 Commercial.............................. 607 4.3 680 5.0 560 4.4 526 4.3 526 4.1 481 4.2 -20.8 -8.6 Industrial, manufacturing...... 77 0.5 63 0.5 60 0.5 44 0.4 55 0.4 47 0.4 -39.0 -14.5 Other4.................................... 530 3.8 617 4.5 500 3.9 482 3.9 471 3.7 434 3.8 -18.1 -7.9 Community/public5................... 802 5.7 748 5.5 765 6.0 742 6.0 811 6.4 751 6.6 -6.4 -7.4 Other6....................................... 398 2.8 404 3.0 332 2.6 332 2.7 378 3.0 313 2.7 -21.4 -17.2
Total mobile property.................. 5,473 39.1 5,419 39.6 4,846 38.3 4,349 35.4 4,442 35.0 4,011 35.2 -26.7 -9.7 Motor vehicles7........................ 5,256 37.5 5,238 38.3 4,624 36.5 4,144 33.8 4,273 33.7 3,853 33.8 -26.7 -9.8 Other8....................................... 217 1.5 181 1.3 222 1.8 205 1.7 169 1.3 158 1.4 -27.2 -6.5
Other property9........................... 4,415 31.5 4,266 31.2 4,028 31.8 4,149 33.8 4,487 35.4 3,951 34.7 -10.5 -11.9Value of property damage
Total............................................... $159,004 100.0 $181,037 100.0 $154,128 100.0 $185,686 100.0 $173,781 100.0 $223,145 100.0 40.3 28.4
Total structural property.............. 116,802 73.5 124,968 69.0 114,840 74.5 146,587 78.9 127,095 73.1 136,763 61.3 17.1 7.6 Residential............................... 62,950 39.6 63,635 35.2 64,440 41.8 90,335 48.6 63,285 36.4 64,444 28.9 2.4 1.8 Single occupancy1................ 36,297 22.8 37,275 20.6 37,729 24.5 68,792 37.0 48,638 28.0 52,885 23.7 45.7 8.7 Other2.................................... 26,653 16.8 26,360 14.6 26,711 17.3 21,543 11.6 14,647 8.4 11,559 5.2 -56.6 -21.1 Storage3................................... 5,932 3.7 7,231 4.0 5,031 3.3 2,617 1.4 8,484 4.9 8,114 3.6 36.8 -4.4 Commercial.............................. 35,510 22.3 31,119 17.2 34,217 22.2 41,286 22.2 32,103 18.5 31,456 14.1 -11.4 -2.0 Industrial, manufacturing...... 10,229 6.4 8,679 4.8 10,295 6.7 2,437 1.3 7,339 4.2 1,954 0.9 -80.9 -73.4 Other4.................................... 25,281 15.9 22,440 12.4 23,922 15.5 38,849 20.9 24,764 14.3 29,502 13.2 16.7 19.1 Community/public5................... 9,321 5.9 13,071 7.2 8,508 5.5 7,601 4.1 12,911 7.4 19,729 8.8 111.7 52.8 Other6....................................... 3,089 1.9 9,911 5.5 2,643 1.7 4,748 2.6 10,311 5.9 13,021 5.8 321.5 26.3
Total mobile property.................. 38,305 24.1 38,821 21.4 35,184 22.8 31,621 17.0 36,179 20.8 45,506 20.4 18.8 25.8 Motor vehicles7........................ 36,457 22.9 37,703 20.8 33,828 21.9 28,555 15.4 34,847 20.1 44,346 19.9 21.6 27.3 Other8....................................... 1,848 1.2 1,118 0.6 1,356 0.9 3,066 1.7 1,332 0.8 1,160 0.5 -37.2 -12.9
Other property9........................... 3,897 2.5 17,248 9.5 4,104 2.7 7,478 4.0 10,506 6.0 40,876 18.3 948.9 289.1Notes: Values and percentages may not add to subtotals, total, or 100.0 because of rounding. Property type is determined by the point of origin of a fire.1 Single occupancy - houses, townhouses, duplexes, etc.2 Other residential - apartments, tenements, hotels, motels, etc. 6 Other structural property - outbuildings, buildings under construction, etc.3 Storage - barns, garages, warehouses, etc. 7 Motor vehicles - autos, trucks, buses, etc.4 Other commercial - stores, restaurants, offices, etc. 8 Other mobile property - trailers, recreational vehicles, airplanes, boats, etc.5 Community/public - churches, jails, schools, hospitals, etc. 9 Other property - crops, timber, fences, etc.

113
Table 15CrimeS CleareD, 2002-2007
Number of Crimes, Clearances, and Clearance Rate
Crimes,clearances,
and clearance rates2002 2003 2004 2005 2006 2007
Percent change2002- 2006-2007 2007
Number of crimes reported Violent crimes....................... 207,988 204,591 197,432 189,593 194,128 191,493 -7.9 -1.4 Homicide........................... 2,392 2,402 2,394 2,503 2,483 2,258 -5.6 -9.1 Forcible rape..................... 10,176 9,918 9,598 9,345 9,213 9,047 -11.1 -1.8 Robbery............................. 64,805 63,597 61,573 63,424 70,961 70,702 9.1 -0.4 Aggravated assault............ 130,615 128,674 123,867 114,321 111,471 109,486 -16.2 -1.8
Property crimes1................... 667,592 693,137 712,193 722,333 707,607 681,235 2.0 -3.7 Burglary............................. 237,445 240,705 244,914 249,563 246,449 237,759 0.1 -3.5 Motor vehicle theft............. 221,780 240,798 251,747 256,998 242,692 220,126 -0.7 -9.3 Larceny-theft over $400…… 208,367 211,634 215,532 215,772 218,466 223,350 7.2 2.2 Total larceny-theft1............... 712,419 727,527 726,614 688,820 666,869 654,481 -8.1 -1.9 Arson……………………… 14,007 13,677 12,660 12,272 12,687 11,400 -18.6 -10.1
Number of clearances Violent crimes....................... Homicide........................... Forcible rape..................... Robbery............................. Aggravated assault............
Property crimes1................... Burglary............................. Motor vehicle theft............. Larceny-theft over $400…… Total larceny-theft................ Arson………………………
95,8101,3624,436
15,78774,225
-29,57521,330
-107,465
1,542
98,1701,3234,617
17,21375,017
-30,45222,591
-108,889
1,381
93,1051,3144,304
16,05371,434
-30,74323,664
-109,053
1,452
83,3351,2494,018
16,31261,756
-30,76325,930
-102,411
1,478
79,0171,2924,054
17,39356,278
-31,10822,998
-96,139
1,470
80,3871,2083,925
18,62456,630
-30,79818,390
-98,691
1,422
-16.1-11.3-11.518.0
-23.7
-4.1
-13.8-
-8.2-7.8
1.7-6.5-3.27.10.6
--1.0
-20.0-
2.7-3.3
Clearance rate2
Violent crimes....................... 46.1 48.0 47.2 44.0 40.7 42.0 -8.9 3.2 Homicide........................... 56.9 55.1 54.9 49.9 52.0 53.5 -6.0 2.9 Forcible rape..................... 43.6 46.6 44.8 43.0 44.0 43.4 -0.5 -1.4 Robbery............................. 24.4 27.1 26.1 25.7 24.5 26.3 7.8 7.3 Aggravated assault............ 56.8 58.3 57.7 54.0 50.5 51.7 -9.0 2.4
Property crimes1................... - - - - - - - - Burglary............................. 12.5 12.7 12.6 12.3 12.6 13.0 4.0 3.2 Motor vehicle theft............. 9.6 9.4 9.4 10.1 9.5 8.4 -12.5 -11.6 Larceny-theft over $400…… - - - - - - - - Total larceny-theft................ 15.1 15.0 15.0 14.9 14.4 15.1 0.0 4.9 Arson……………………… 11.0 10.1 11.5 12.0 11.6 12.5 13.6 7.8Note: Dash indicates that data are not available.1 In 2003, larceny-theft over $400 was added to the property crime category to give a more representative depiction of crime in California. However, since clearance data are only available for total larceny-theft, the property crime clearances and clearance rate are not available. The number of clearances and clearance rate for total larceny-theft are shown. For additional information, see "Appendix 1, Data Characteristics and Known Limitations."2 Percentage of clearances to total crimes reported.
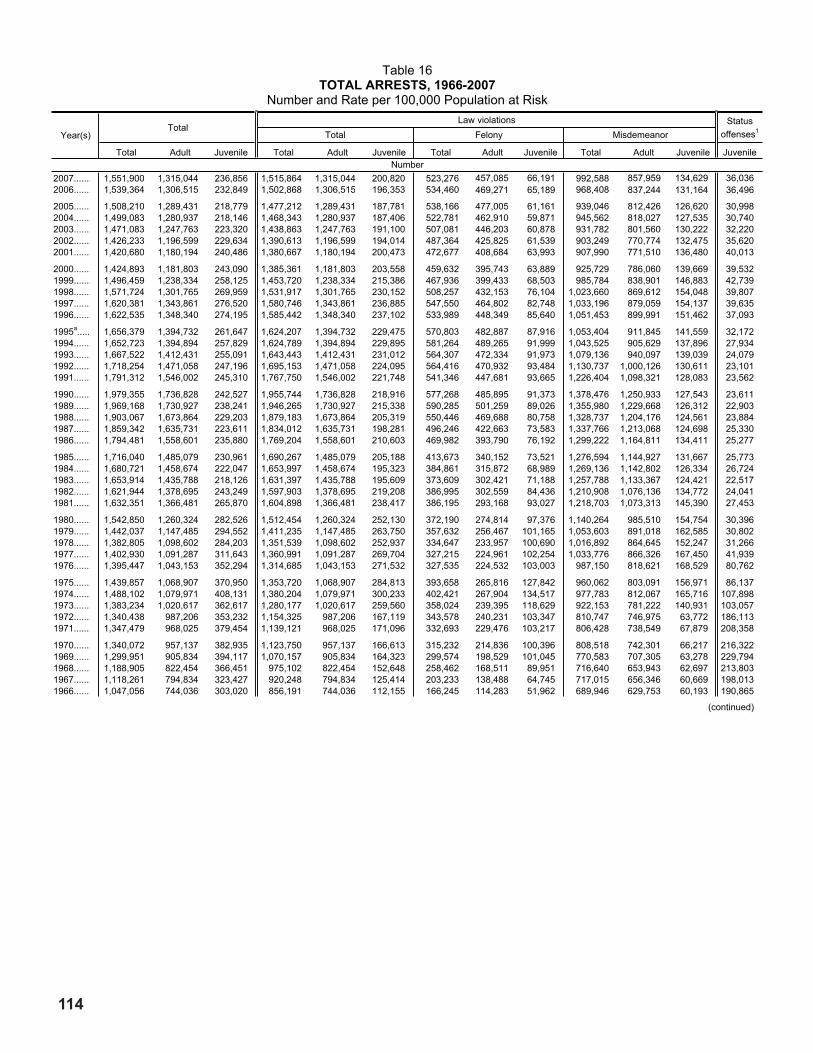
114
Table 16ToTal arreSTS, 1966-2007
Number and Rate per 100,000 Population at Risk
Year(s)Total
Law violations Statusoffenses1Total Felony Misdemeanor
Total Adult Juvenile Total Adult Juvenile Total Adult Juvenile Total Adult Juvenile JuvenileNumber
2007....... 1,551,900 1,315,044 236,856 1,515,864 1,315,044 200,820 523,276 457,085 66,191 992,588 857,959 134,629 36,0362006....... 1,539,364 1,306,515 232,849 1,502,868 1,306,515 196,353 534,460 469,271 65,189 968,408 837,244 131,164 36,496
2005....... 1,508,210 1,289,431 218,779 1,477,212 1,289,431 187,781 538,166 477,005 61,161 939,046 812,426 126,620 30,9982004....... 1,499,083 1,280,937 218,146 1,468,343 1,280,937 187,406 522,781 462,910 59,871 945,562 818,027 127,535 30,7402003....... 1,471,083 1,247,763 223,320 1,438,863 1,247,763 191,100 507,081 446,203 60,878 931,782 801,560 130,222 32,2202002....... 1,426,233 1,196,599 229,634 1,390,613 1,196,599 194,014 487,364 425,825 61,539 903,249 770,774 132,475 35,6202001....... 1,420,680 1,180,194 240,486 1,380,667 1,180,194 200,473 472,677 408,684 63,993 907,990 771,510 136,480 40,013
2000....... 1,424,893 1,181,803 243,090 1,385,361 1,181,803 203,558 459,632 395,743 63,889 925,729 786,060 139,669 39,5321999....... 1,496,459 1,238,334 258,125 1,453,720 1,238,334 215,386 467,936 399,433 68,503 985,784 838,901 146,883 42,7391998....... 1,571,724 1,301,765 269,959 1,531,917 1,301,765 230,152 508,257 432,153 76,104 1,023,660 869,612 154,048 39,8071997....... 1,620,381 1,343,861 276,520 1,580,746 1,343,861 236,885 547,550 464,802 82,748 1,033,196 879,059 154,137 39,6351996....... 1,622,535 1,348,340 274,195 1,585,442 1,348,340 237,102 533,989 448,349 85,640 1,051,453 899,991 151,462 37,093
1995a..... 1,656,379 1,394,732 261,647 1,624,207 1,394,732 229,475 570,803 482,887 87,916 1,053,404 911,845 141,559 32,1721994....... 1,652,723 1,394,894 257,829 1,624,789 1,394,894 229,895 581,264 489,265 91,999 1,043,525 905,629 137,896 27,9341993....... 1,667,522 1,412,431 255,091 1,643,443 1,412,431 231,012 564,307 472,334 91,973 1,079,136 940,097 139,039 24,0791992....... 1,718,254 1,471,058 247,196 1,695,153 1,471,058 224,095 564,416 470,932 93,484 1,130,737 1,000,126 130,611 23,1011991....... 1,791,312 1,546,002 245,310 1,767,750 1,546,002 221,748 541,346 447,681 93,665 1,226,404 1,098,321 128,083 23,562
1990....... 1,979,355 1,736,828 242,527 1,955,744 1,736,828 218,916 577,268 485,895 91,373 1,378,476 1,250,933 127,543 23,6111989....... 1,969,168 1,730,927 238,241 1,946,265 1,730,927 215,338 590,285 501,259 89,026 1,355,980 1,229,668 126,312 22,9031988....... 1,903,067 1,673,864 229,203 1,879,183 1,673,864 205,319 550,446 469,688 80,758 1,328,737 1,204,176 124,561 23,8841987....... 1,859,342 1,635,731 223,611 1,834,012 1,635,731 198,281 496,246 422,663 73,583 1,337,766 1,213,068 124,698 25,3301986....... 1,794,481 1,558,601 235,880 1,769,204 1,558,601 210,603 469,982 393,790 76,192 1,299,222 1,164,811 134,411 25,277
1985....... 1,716,040 1,485,079 230,961 1,690,267 1,485,079 205,188 413,673 340,152 73,521 1,276,594 1,144,927 131,667 25,7731984....... 1,680,721 1,458,674 222,047 1,653,997 1,458,674 195,323 384,861 315,872 68,989 1,269,136 1,142,802 126,334 26,7241983....... 1,653,914 1,435,788 218,126 1,631,397 1,435,788 195,609 373,609 302,421 71,188 1,257,788 1,133,367 124,421 22,5171982....... 1,621,944 1,378,695 243,249 1,597,903 1,378,695 219,208 386,995 302,559 84,436 1,210,908 1,076,136 134,772 24,0411981....... 1,632,351 1,366,481 265,870 1,604,898 1,366,481 238,417 386,195 293,168 93,027 1,218,703 1,073,313 145,390 27,453
1980....... 1,542,850 1,260,324 282,526 1,512,454 1,260,324 252,130 372,190 274,814 97,376 1,140,264 985,510 154,754 30,3961979....... 1,442,037 1,147,485 294,552 1,411,235 1,147,485 263,750 357,632 256,467 101,165 1,053,603 891,018 162,585 30,8021978....... 1,382,805 1,098,602 284,203 1,351,539 1,098,602 252,937 334,647 233,957 100,690 1,016,892 864,645 152,247 31,2661977....... 1,402,930 1,091,287 311,643 1,360,991 1,091,287 269,704 327,215 224,961 102,254 1,033,776 866,326 167,450 41,9391976....... 1,395,447 1,043,153 352,294 1,314,685 1,043,153 271,532 327,535 224,532 103,003 987,150 818,621 168,529 80,762
1975....... 1,439,857 1,068,907 370,950 1,353,720 1,068,907 284,813 393,658 265,816 127,842 960,062 803,091 156,971 86,1371974....... 1,488,102 1,079,971 408,131 1,380,204 1,079,971 300,233 402,421 267,904 134,517 977,783 812,067 165,716 107,8981973....... 1,383,234 1,020,617 362,617 1,280,177 1,020,617 259,560 358,024 239,395 118,629 922,153 781,222 140,931 103,0571972....... 1,340,438 987,206 353,232 1,154,325 987,206 167,119 343,578 240,231 103,347 810,747 746,975 63,772 186,1131971....... 1,347,479 968,025 379,454 1,139,121 968,025 171,096 332,693 229,476 103,217 806,428 738,549 67,879 208,358
1970....... 1,340,072 957,137 382,935 1,123,750 957,137 166,613 315,232 214,836 100,396 808,518 742,301 66,217 216,3221969....... 1,299,951 905,834 394,117 1,070,157 905,834 164,323 299,574 198,529 101,045 770,583 707,305 63,278 229,7941968....... 1,188,905 822,454 366,451 975,102 822,454 152,648 258,462 168,511 89,951 716,640 653,943 62,697 213,8031967....... 1,118,261 794,834 323,427 920,248 794,834 125,414 203,233 138,488 64,745 717,015 656,346 60,669 198,0131966....... 1,047,056 744,036 303,020 856,191 744,036 112,155 166,245 114,283 51,962 689,946 629,753 60,193
(c
190,865
ontinued)

115
Table 16 - continuedToTal arreSTS, 1966-2007
Number and Rate per 100,000 Population at Risk
Year(s)Total
Law violations Statusoffenses1Total Felony Misdemeanor
Total Adult Juvenile Total Adult Juvenile Total Adult Juvenile Total Adult Juvenile JuvenileRate per 100,000 population at risk2,3
2007....... 5,250.3 5,280.9 5,086.6 5,128.3 5,280.9 4,312.7 1,770.3 1,835.5 1,421.5 3,358.0 3,445.3 2,891.2 773.92006....... 5,265.1 5,282.9 5,167.7 5,140.3 5,282.9 4,357.8 1,828.0 1,897.5 1,446.8 3,312.3 3,385.4 2,911.0 810.0
2005....... 5,235.1 5,302.8 4,868.9 5,127.5 5,302.8 4,179.0 1,868.0 1,961.7 1,361.1 3,259.5 3,341.1 2,817.9 689.92004....... 5,286.4 5,358.1 4,901.5 5,178.0 5,358.1 4,210.8 1,843.6 1,936.3 1,345.2 3,334.5 3,421.8 2,865.5 690.72003....... 5,288.7 5,356.2 4,940.9 5,172.9 5,356.2 4,228.0 1,823.0 1,915.4 1,346.9 3,349.9 3,440.8 2,881.1 712.92002....... 5,223.8 5,219.1 5,248.7 5,093.4 5,219.1 4,434.6 1,785.1 1,857.3 1,406.6 3,308.3 3,361.8 3,028.0 814.22001....... 5,311.9 5,232.3 5,740.3 5,162.3 5,232.3 4,785.2 1,767.3 1,811.9 1,527.5 3,395.0 3,420.5 3,257.7 955.1
2000....... 5,437.7 5,323.8 6,068.7 5,286.8 5,323.8 5,081.8 1,754.1 1,782.8 1,595.0 3,532.8 3,541.1 3,486.8 986.91999....... 5,820.1 5,666.1 6,692.9 5,653.9 5,666.1 5,584.7 1,819.9 1,827.6 1,776.2 3,834.0 3,838.5 3,808.5 1,108.21998....... 6,221.4 6,055.2 7,170.4 6,063.9 6,055.2 6,113.1 2,011.9 2,010.2 2,021.4 4,052.0 4,045.1 4,091.7 1,057.31997....... 6,290.2 6,126.6 7,228.4 6,136.3 6,126.6 6,192.3 2,125.6 2,119.0 2,163.1 4,010.8 4,007.6 4,029.2 1,036.11996....... 6,349.4 6,177.8 7,354.0 6,204.2 6,177.8 6,359.2 2,089.6 2,054.2 2,296.9 4,114.6 4,123.5 4,062.3 994.8
1995a..... 6,593.1 6,485.4 7,233.9 6,465.1 6,485.4 6,344.4 2,272.1 2,245.4 2,430.7 4,193.0 4,240.0 3,913.8 889.51994....... 6,690.3 6,581.7 7,346.0 6,577.2 6,581.7 6,550.1 2,353.0 2,308.6 2,621.2 4,224.2 4,273.1 3,928.9 795.91993....... 6,852.5 6,750.4 7,478.7 6,753.5 6,750.4 6,772.8 2,319.0 2,257.4 2,696.4 4,434.6 4,493.0 4,076.3 705.91992....... 7,166.7 7,119.9 7,458.1 7,070.3 7,119.9 6,761.1 2,354.1 2,279.3 2,820.5 4,716.2 4,840.6 3,940.6 697.01991....... 7,595.1 7,594.5 7,599.0 7,495.2 7,594.5 6,869.1 2,295.3 2,199.2 2,901.5 5,199.9 5,395.3 3,967.6 729.9
1990....... 8,539.4 8,672.2 7,696.0 8,437.6 8,672.2 6,946.8 2,490.5 2,426.1 2,899.5 5,947.1 6,246.0 4,047.3 749.21989....... 8,742.4 8,898.6 7,753.7 8,640.7 8,898.6 7,008.3 2,620.6 2,576.9 2,897.4 6,020.1 6,321.6 4,110.9 745.41988....... 8,662.1 8,863.3 7,430.5 8,553.4 8,863.3 6,656.3 2,505.4 2,487.0 2,618.1 6,048.0 6,376.2 4,038.2 774.31987....... 8,654.7 8,900.1 7,202.1 8,536.8 8,900.1 6,386.3 2,309.9 2,299.7 2,370.0 6,226.9 6,600.4 4,016.3 815.81986....... 8,541.3 8,705.7 7,593.7 8,421.0 8,705.7 6,780.0 2,237.0 2,199.6 2,452.9 6,184.0 6,506.2 4,327.1 813.7
1985....... 8,345.2 8,501.3 7,463.9 8,219.8 8,501.3 6,631.0 2,011.7 1,947.2 2,376.0 6,208.1 6,554.1 4,255.0 832.91984....... 8,333.6 8,538.5 7,198.9 8,201.1 8,538.5 6,332.5 1,908.3 1,849.0 2,236.7 6,292.8 6,689.5 4,095.8 866.41983....... 8,327.6 8,565.2 7,041.7 8,214.2 8,565.2 6,314.8 1,881.1 1,804.1 2,298.1 6,333.0 6,761.1 4,016.6 726.91982....... 8,313.0 8,398.7 7,858.5 8,189.8 8,398.7 7,081.8 1,983.5 1,843.1 2,727.8 6,206.3 6,555.6 4,354.0 776.71981....... 8,513.9 8,496.8 8,602.9 8,370.7 8,496.8 7,714.6 2,014.3 1,822.9 3,010.1 6,356.4 6,673.9 4,704.5 888.3
1980....... 8,196.1 7,987.4 9,277.8 8,034.6 7,987.4 8,279.6 1,977.2 1,741.6 3,197.7 6,057.4 6,245.7 5,081.9 998.21979....... 7,849.2 7,488.5 9,662.8 7,681.6 7,488.5 8,652.3 1,946.6 1,673.7 3,318.7 5,734.9 5,814.8 5,333.6 1,010.51978....... 7,676.7 7,365.2 9,177.1 7,503.2 7,365.2 8,167.5 1,857.8 1,568.5 3,251.3 5,645.4 5,796.7 4,916.2 1,009.61977....... 7,962.4 7,541.4 9,897.3 7,724.4 7,541.4 8,565.4 1,857.1 1,554.6 3,247.4 5,867.2 5,986.8 5,317.9 1,331.91976....... 8,080.2 7,408.3 11,047.1 7,612.6 7,408.3 8,514.6 1,896.6 1,594.6 3,229.9 5,716.0 5,813.7 5,284.7 2,532.5
1975....... 8,512.5 7,805.2 11,521.0 8,003.3 7,805.2 8,845.8 2,327.3 1,941.0 3,970.5 5,676.0 5,864.2 4,875.2 2,675.31974....... 8,984.1 8,095.8 12,660.1 8,332.7 8,095.8 9,313.1 2,429.5 2,008.3 4,172.7 5,903.2 6,087.5 5,140.4 3,347.01973....... 8,519.0 7,832.2 11,310.5 7,884.3 7,832.2 8,096.0 2,205.0 1,837.1 3,700.2 5,679.3 5,995.1 4,395.8 3,214.51972....... 8,416.5 7,737.4 11,152.0 7,247.9 7,737.4 5,276.2 2,157.3 1,882.9 3,262.8 5,090.6 5,854.6 2,013.4 5,875.81971....... 8,606.1 7,717.8 12,183.7 7,275.4 7,717.8 5,493.6 2,124.9 1,829.5 3,314.1 5,150.5 5,888.2 2,179.5 6,690.1
1970....... 8,714.0 7,756.6 12,601.8 7,307.4 7,756.6 5,483.0 2,049.8 1,741.0 3,303.9 5,257.5 6,015.6 2,179.1 7,118.81969....... 8,844.9 7,770.3 12,966.1 7,281.4 7,770.3 5,406.1 2,038.3 1,703.0 3,324.3 5,243.1 6,067.3 2,081.8 7,560.01968....... 8,268.1 7,212.2 12,314.8 6,781.2 7,212.2 5,129.8 1,797.4 1,477.7 3,022.9 4,983.8 5,734.5 2,107.0 7,185.01967....... 7,950.3 7,122.3 11,130.0 6,542.5 7,122.3 4,315.8 1,444.9 1,241.0 2,228.1 5,097.6 5,881.3 2,087.8 6,814.21966....... 7,644.6 6,843.3 10,729.4 6,251.1 6,843.3 3,971.2 1,213.8 1,051.1 1,839.9 5,037.3 5,792.2 2,131.3 6,758.2Notes: Statewide arrest data from 1952-1965 can be found in Table 16 of Crime in California, 2006 . Since 1966 there have been many changes in laws, data collection procedures, etc.; therefore, caution should be used when comparing data for the 1966-2007 time period. Juvenile misdemeanor arrest data for 1973-2007 are not comparable to prior years due to changes in reporting criteria.a Includes estimated annual data for the Bakersfield Police Department and the Oakland Police Department. For additional information, see "Appendix 1, Data Characteristics and Known Limitations."1 Status offenses include truancy, incorrigibility, running away, and curfew violations. These offenses can only be committed or engaged in by a juvenile.2 Rates are based on annual population estimates provided by the Demographic Research Unit, California Department of Finance (see Table 58).3 Rates are based on the population at risk for each year. The categories are total (10-69 years of age), adult (18-69 years of age), and juvenile (10-17 years of age) (see Table 58).

116
Table 17ToTal arreSTS, 2002-2007
Number, Rate per 100,000 Population, and Percent Change
Year(s)Total
Law violations Statusoffenses1Total Felony Misdemeanor
Total Adult Juvenile Total Adult Juvenile Total Adult Juvenile Total Adult Juvenile JuvenileNumber
2007......................2006......................2005......................2004......................2003......................2002......................
1,551,9001,539,3641,508,2101,499,0831,471,0831,426,233
1,315,0441,306,5151,289,4311,280,9371,247,7631,196,599
236,856232,849218,779218,146223,320229,634
1,515,8641,502,8681,477,2121,468,3431,438,8631,390,613
1,315,0441,306,5151,289,4311,280,9371,247,7631,196,599
200,820196,353187,781187,406191,100194,014
523,276534,460538,166522,781507,081487,364
457,085469,271477,005462,910446,203425,825
66,19165,18961,16159,87160,87861,539
992,588968,408939,046945,562931,782903,249
857,959837,244812,426818,027801,560770,774
134,629131,164126,620127,535130,222132,475
36,03636,49630,99830,74032,22035,620
Percent change in number2006 to 2007.........2005 to 2006.........2004 to 2005.........2003 to 2004.........2002 to 2003.........
2002 to 2007.........
0.82.10.61.93.1
8.8
0.71.30.72.74.3
9.9
1.76.40.3
-2.3-2.7
3.1
0.91.70.62.03.5
9.0
0.71.30.72.74.3
9.9
2.34.60.2
-1.9-1.5
3.5
-2.1-0.72.93.14.0
7.4
-2.6-1.63.03.74.8
7.3
1.56.62.2
-1.7-1.1
7.6
2.53.1
-0.71.53.2
9.9
2.53.1
-0.72.14.0
11.3
2.63.6
-0.7-2.1-1.7
1.6
-1.317.7
0.8-4.6-9.5
1.2Rate per 100,000 total population2
2007......................2006......................2005......................2004......................2003......................2002......................
4,108.74,111.14,075.74,096.94,093.84,040.2
3,481.63,489.23,484.53,500.73,472.43,389.7
627.1621.9591.2596.2621.5650.5
4,013.34,013.63,992.04,012.94,004.23,939.3
3,481.63,489.23,484.53,500.73,472.43,389.7
531.7524.4507.5512.2531.8549.6
1,385.41,427.31,454.31,428.71,411.11,380.6
1,210.11,253.21,289.01,265.11,241.71,206.3
175.2174.1165.3163.6169.4174.3
2,627.92,586.32,537.62,584.22,593.02,558.7
2,271.42,236.02,195.52,235.62,230.62,183.4
356.4350.3342.2348.5362.4375.3
95.497.583.884.089.7
100.9Rate per 100,000 population at risk2,3
2007......................2006......................2005......................2004......................2003......................2002......................
5,250.35,265.15,235.15,286.45,288.75,223.8
5,280.95,282.95,302.85,358.15,356.25,219.1
5,086.65,167.74,868.94,901.54,940.95,248.7
5,128.35,140.35,127.55,178.05,172.95,093.4
5,280.95,282.95,302.85,358.15,356.25,219.1
4,312.74,357.84,179.04,210.84,228.04,434.6
1,770.31,828.01,868.01,843.61,823.01,785.1
1,835.51,897.51,961.71,936.31,915.41,857.3
1,421.51,446.81,361.11,345.21,346.91,406.6
3,358.03,312.33,259.53,334.53,349.93,308.3
3,445.33,385.43,341.13,421.83,440.83,361.8
2,891.22,911.02,817.92,865.52,881.13,028.0
773.9810.0689.9690.7712.9814.2
Percent change in rate per 100,000 population at risk2006 to 2007.........2005 to 2006.........2004 to 2005.........2003 to 2004.........2002 to 2003.........
2002 to 2007.........
-0.30.6
-1.00.01.2
0.5
0.0-0.4-1.00.02.6
1.2
-1.66.1
-0.7-0.8-5.9
-3.1
-0.20.2
-1.00.11.6
0.7
0.0-0.4-1.00.02.6
1.2
-1.04.3
-0.8-0.4-4.7
-2.7
-3.2-2.11.31.12.1
-0.8
-3.3-3.31.31.13.1
-1.2
-1.76.31.2
-0.1-4.2
1.1
1.41.6
-2.2-0.51.3
1.5
1.81.3
-2.4-0.62.3
2.5
-0.73.3
-1.7-0.5-4.9
-4.5
-4.517.4-0.1-3.1
-12.4
-4.9Note: Rates calculated from the total population may not add to subtotals or total because of rounding.1 Status offenses include truancy, incorrigibility, running away, and curfew violations. These offenses can only be committed or engaged in by a juvenile.2 Rates are based on annual population estimates provided by the Demographic Research Unit, California Department of Finance (see Table 58).3 Rates are based on the population at risk for each year. The categories are total (10-69 years of age), adult (18-69 years of age), and juvenile (10-17 years of age) (see Table 58).

117
Table 18ToTal arreSTS, 2002-2007
By Level of Offense for Adult and Juvenile Arrests
Level of offense 2002 2003 2004 2005 2006 2007Number Percent Number Percent Number Percent Number Percent Number Percent Number Percent
TotalTotal................................. 1,426,233 100.0 1,471,083 100.0 1,499,083 100.0 1,508,210 100.0 1,539,364 100.0 1,551,900 100.0
Level of offense Felony........................... Misdemeanor................ Status offenses1............
487,364903,249
35,620
34.263.3
2.5
507,081931,78232,220
34.563.32.2
522,781945,56230,740
34.963.12.1
538,166939,04630,998
35.762.32.1
534,460968,408
36,496
34.762.9
2.4
523,276992,588
36,036
33.764.0
2.3Level of offense for adult and juvenile arrests
Adult............................. 1,196,599 83.9 1,247,763 84.8 1,280,937 85.4 1,289,431 85.5 1,306,515 84.9 1,315,044 84.7 Felony........................ 425,825 29.9 446,203 30.3 462,910 30.9 477,005 31.6 469,271 30.5 457,085 29.5 Misdemeanor............. 770,774 54.0 801,560 54.5 818,027 54.6 812,426 53.9 837,244 54.4 857,959 55.3 Juvenile........................ 229,634 16.1 223,320 15.2 218,146 14.6 218,779 14.5 232,849 15.1 236,856 15.3 Felony........................ 61,539 4.3 60,878 4.1 59,871 4.0 61,161 4.1 65,189 4.2 66,191 4.3 Misdemeanor............. 132,475 9.3 130,222 8.9 127,535 8.5 126,620 8.4 131,164 8.5 134,629 8.7 Status offenses.......... 35,620 2.5 32,220 2.2 30,740 2.1 30,998 2.1 36,496 2.4 36,036 2.3Note: Percentages may not add to subtotals or 100.0 because of rounding.1 Status offenses include truancy, incorrigibility, running away, and curfew violations. These offenses can only be committed or engaged in by a juvenile.
Table 19felonY arreSTS, 2002-2007
By Category
Category 2002 2003 2004 2005 2006 2007
Number Percent Number Percent Number Percent Number Percent Number Percent Number PercentTotal................................ 487,364 100.0 507,081 100.0 522,781 100.0 538,166 100.0 534,460 100.0 523,276 100.0 Violent offenses........... 132,059 27.1 131,218 25.9 127,058 24.3 125,725 23.4 126,342 23.6 129,433 24.7 Property offenses........ 138,142 28.3 144,200 28.4 148,913 28.5 147,692 27.4 144,781 27.1 142,006 27.1 Drug offenses.............. 131,306 26.9 140,744 27.8 150,305 28.8 159,944 29.7 154,468 28.9 143,692 27.5 All other....................... 85,857 17.6 90,919 17.9 96,505 18.5 104,805 19.5 108,869 20.4 108,145 20.7Note: Percentages may not add to 100.0 because of rounding.

118
Table 20felonY arreSTS, 2002-2007
By Category and Offense
Category and offense 2002
Number Percent
2003
Number Percent
2004
Number Percent
2005
Number Percent
2006
Number Percent
2007
Number PercentTotal................................................... 487,364 507,081 522,781 538,166 534,460 523,276
Violent offenses.............................. Homicide...................................... Forcible rape................................ Robbery....................................... Assault......................................... Kidnapping...................................
132,0591,8642,549
16,957108,925
1,764
100.01.41.9
12.882.5
1.3
131,2181,8392,456
17,501107,726
1,696
100.01.41.9
13.382.1
1.3
127,0581,9782,237
17,864103,184
1,795
100.01.61.8
14.181.2
1.4
125,7251,9562,098
18,218101,695
1,758
100.01.61.7
14.580.9
1.4
126,3421,9672,122
20,376100,159
1,718
100.01.61.7
16.179.3
1.4
129,4332,0172,164
21,614101,838
1,800
100.01.61.7
16.778.7
1.4
Property offenses............................ Burglary........................................ Theft............................................. Motor vehicle theft........................ Forgery, checks, access cards.... Arson............................................
138,14248,31246,75027,08414,4181,578
100.035.033.819.610.41.1
144,20050,09149,25830,06413,304
1,483
100.034.734.220.89.21.0
148,91350,76052,39930,73113,591
1,432
100.034.135.220.69.11.0
147,69250,61852,51130,71712,379
1,467
100.034.335.620.88.41.0
144,78151,61052,37727,92711,470
1,397
100.035.636.219.37.91.0
142,00654,31652,32522,58211,405
1,378
100.038.236.815.98.01.0
Drug offenses.................................. Narcotics...................................... Marijuana..................................... Dangerous drugs......................... Other............................................
131,30648,88112,68266,5223,221
100.037.29.7
50.72.5
140,74450,44013,02274,775
2,507
100.035.89.3
53.11.8
150,30552,47413,10682,418
2,307
100.034.98.7
54.81.5
159,94452,27413,07592,972
1,623
100.032.78.2
58.11.0
154,46856,09413,54883,365
1,461
100.036.38.8
54.00.9
143,69255,07016,12471,143
1,355
100.038.311.249.5
0.9
All other........................................... 85,857 100.0 90,919 100.0 96,505 100.0 104,805 100.0 108,869 100.0 108,145 100.0Note: Percentages may not add to 100.0 because of rounding. `

119
Table 21felonY arreSTS, 2002-2007
By Category and Offense for Adult and Juvenile Arrests
Category and offense 2002 2003 2004 2005 2006 2007
Number Percent Number Percent Number Percent Number Percent Number Percent Number PercentTotal
Total...................................... 487,364 100.0 507,081 100.0 522,781 100.0 538,166 100.0 534,460 100.0 523,276 100.0Adult and juvenile arrests
Adult.................................. Juvenile.............................
425,82561,539
87.412.6
446,20360,878
88.012.0
462,91059,871
88.511.5
477,00561,161
88.611.4
469,27165,189
87.812.2
457,08566,191
87.412.6
Category and offense for adult and juvenile arrests Violent offenses................. 132,059 100.0 131,218 100.0 127,058 100.0 125,725 100.0 126,342 100.0 129,433 100.0 Adult............................... 116,194 88.0 115,410 88.0 111,541 87.8 110,052 87.5 109,263 86.5 111,383 86.1 Juvenile.......................... 15,865 12.0 15,808 12.0 15,517 12.2 15,673 12.5 17,079 13.5 18,050 13.9
Homicide......................... 1,864 100.0 1,839 100.0 1,978 100.0 1,956 100.0 1,967 100.0 2,017 100.0 Adult............................ 1,649 88.5 1,672 90.9 1,793 90.6 1,771 90.5 1,726 87.7 1,782 88.3 Juvenile....................... 215 11.5 167 9.1 185 9.4 185 9.5 241 12.3 235 11.7
Forcible rape................... 2,549 100.0 2,456 100.0 2,237 100.0 2,098 100.0 2,122 100.0 2,164 100.0 Adult............................ 2,207 86.6 2,155 87.7 1,926 86.1 1,862 88.8 1,898 89.4 1,923 88.9 Juvenile....................... 342 13.4 301 12.3 311 13.9 236 11.2 224 10.6 241 11.1
Robbery.......................... 16,957 100.0 17,501 100.0 17,864 100.0 18,218 100.0 20,376 100.0 21,614 100.0 Adult............................ 12,457 73.5 12,793 73.1 13,003 72.8 12,899 70.8 13,737 67.4 14,734 68.2 Juvenile....................... 4,500 26.5 4,708 26.9 4,861 27.2 5,319 29.2 6,639 32.6 6,880 31.8
Assault............................ 108,925 100.0 107,726 100.0 103,184 100.0 101,695 100.0 100,159 100.0 101,838 100.0 Adult............................ 98,255 90.2 97,202 90.2 93,129 90.3 91,847 90.3 90,265 90.1 91,231 89.6 Juvenile....................... 10,670 9.8 10,524 9.8 10,055 9.7 9,848 9.7 9,894 9.9 10,607 10.4
Kidnapping...................... 1,764 100.0 1,696 100.0 1,795 100.0 1,758 100.0 1,718 100.0 1,800 100.0 Adult............................ 1,626 92.2 1,588 93.6 1,690 94.2 1,673 95.2 1,637 95.3 1,713 95.2 Juvenile....................... 138 7.8 108 6.4 105 5.8 85 4.8 81 4.7 87 4.8
(continued)
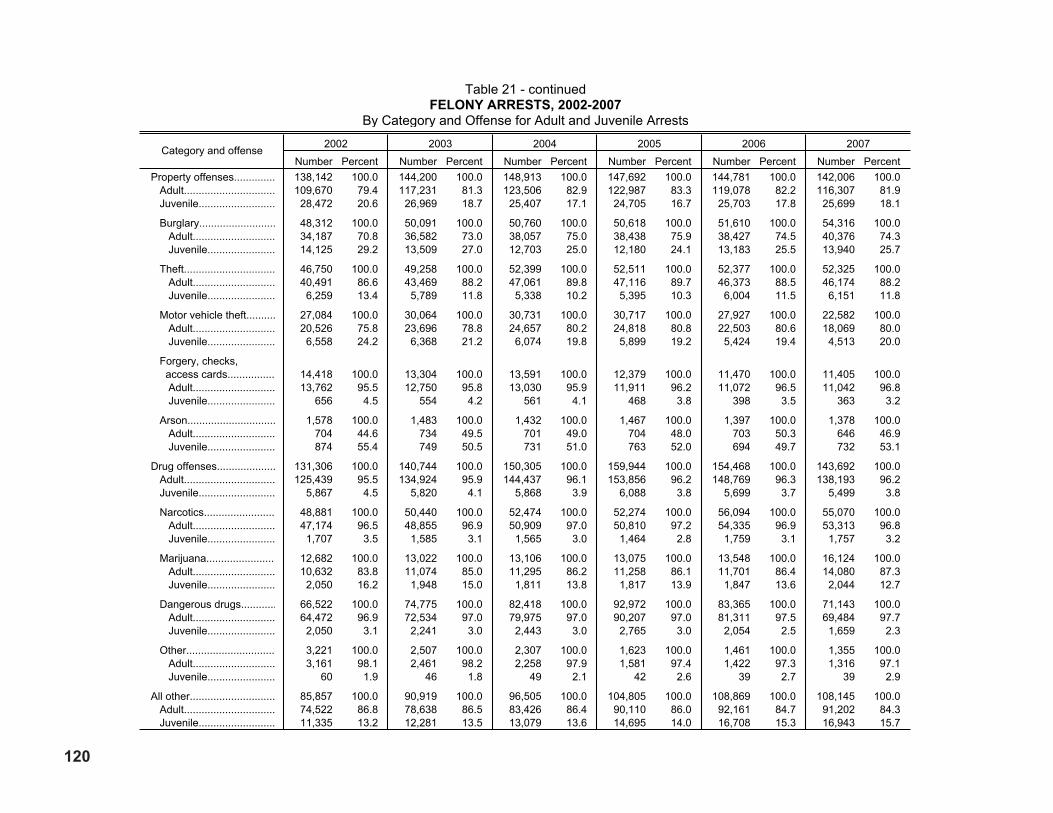
120
Table 21 - continuedfelonY arreSTS, 2002-2007
By Category and Offense for Adult and Juvenile Arrests
Category and offense 2002 2003 2004 2005 2006 2007
Number Percent Number Percent Number Percent Number Percent Number Percent Number Percent Property offenses.............. 138,142 100.0 144,200 100.0 148,913 100.0 147,692 100.0 144,781 100.0 142,006 100.0 Adult............................... 109,670 79.4 117,231 81.3 123,506 82.9 122,987 83.3 119,078 82.2 116,307 81.9 Juvenile.......................... 28,472 20.6 26,969 18.7 25,407 17.1 24,705 16.7 25,703 17.8 25,699 18.1
Burglary.......................... 48,312 100.0 50,091 100.0 50,760 100.0 50,618 100.0 51,610 100.0 54,316 100.0 Adult............................ 34,187 70.8 36,582 73.0 38,057 75.0 38,438 75.9 38,427 74.5 40,376 74.3 Juvenile....................... 14,125 29.2 13,509 27.0 12,703 25.0 12,180 24.1 13,183 25.5 13,940 25.7
Theft............................... 46,750 100.0 49,258 100.0 52,399 100.0 52,511 100.0 52,377 100.0 52,325 100.0 Adult............................ 40,491 86.6 43,469 88.2 47,061 89.8 47,116 89.7 46,373 88.5 46,174 88.2 Juvenile....................... 6,259 13.4 5,789 11.8 5,338 10.2 5,395 10.3 6,004 11.5 6,151 11.8
Motor vehicle theft.......... 27,084 100.0 30,064 100.0 30,731 100.0 30,717 100.0 27,927 100.0 22,582 100.0 Adult............................ 20,526 75.8 23,696 78.8 24,657 80.2 24,818 80.8 22,503 80.6 18,069 80.0 Juvenile.......................
Forgery, checks,
6,558 24.2 6,368 21.2 6,074 19.8 5,899 19.2 5,424 19.4 4,513 20.0
access cards................. 14,418 100.0 13,304 100.0 13,591 100.0 12,379 100.0 11,470 100.0 11,405 100.0 Adult............................ 13,762 95.5 12,750 95.8 13,030 95.9 11,911 96.2 11,072 96.5 11,042 96.8 Juvenile....................... 656 4.5 554 4.2 561 4.1 468 3.8 398 3.5 363 3.2
Arson.............................. 1,578 100.0 1,483 100.0 1,432 100.0 1,467 100.0 1,397 100.0 1,378 100.0 Adult............................ 704 44.6 734 49.5 701 49.0 704 48.0 703 50.3 646 46.9 Juvenile....................... 874 55.4 749 50.5 731 51.0 763 52.0 694 49.7 732 53.1
Drug offenses.................... 131,306 100.0 140,744 100.0 150,305 100.0 159,944 100.0 154,468 100.0 143,692 100.0 Adult............................... 125,439 95.5 134,924 95.9 144,437 96.1 153,856 96.2 148,769 96.3 138,193 96.2 Juvenile.......................... 5,867 4.5 5,820 4.1 5,868 3.9 6,088 3.8 5,699 3.7 5,499 3.8
Narcotics......................... 48,881 100.0 50,440 100.0 52,474 100.0 52,274 100.0 56,094 100.0 55,070 100.0 Adult............................ 47,174 96.5 48,855 96.9 50,909 97.0 50,810 97.2 54,335 96.9 53,313 96.8 Juvenile....................... 1,707 3.5 1,585 3.1 1,565 3.0 1,464 2.8 1,759 3.1 1,757 3.2
Marijuana........................ 12,682 100.0 13,022 100.0 13,106 100.0 13,075 100.0 13,548 100.0 16,124 100.0 Adult............................ 10,632 83.8 11,074 85.0 11,295 86.2 11,258 86.1 11,701 86.4 14,080 87.3 Juvenile....................... 2,050 16.2 1,948 15.0 1,811 13.8 1,817 13.9 1,847 13.6 2,044 12.7
Dangerous drugs............ 66,522 100.0 74,775 100.0 82,418 100.0 92,972 100.0 83,365 100.0 71,143 100.0 Adult............................ 64,472 96.9 72,534 97.0 79,975 97.0 90,207 97.0 81,311 97.5 69,484 97.7 Juvenile....................... 2,050 3.1 2,241 3.0 2,443 3.0 2,765 3.0 2,054 2.5 1,659 2.3
Other............................... 3,221 100.0 2,507 100.0 2,307 100.0 1,623 100.0 1,461 100.0 1,355 100.0 Adult............................ 3,161 98.1 2,461 98.2 2,258 97.9 1,581 97.4 1,422 97.3 1,316 97.1 Juvenile....................... 60 1.9 46 1.8 49 2.1 42 2.6 39 2.7 39 2.9
All other............................. 85,857 100.0 90,919 100.0 96,505 100.0 104,805 100.0 108,869 100.0 108,145 100.0 Adult............................... 74,522 86.8 78,638 86.5 83,426 86.4 90,110 86.0 92,161 84.7 91,202 84.3 Juvenile.......................... 11,335 13.2 12,281 13.5 13,079 13.6 14,695 14.0 16,708 15.3 16,943 15.7
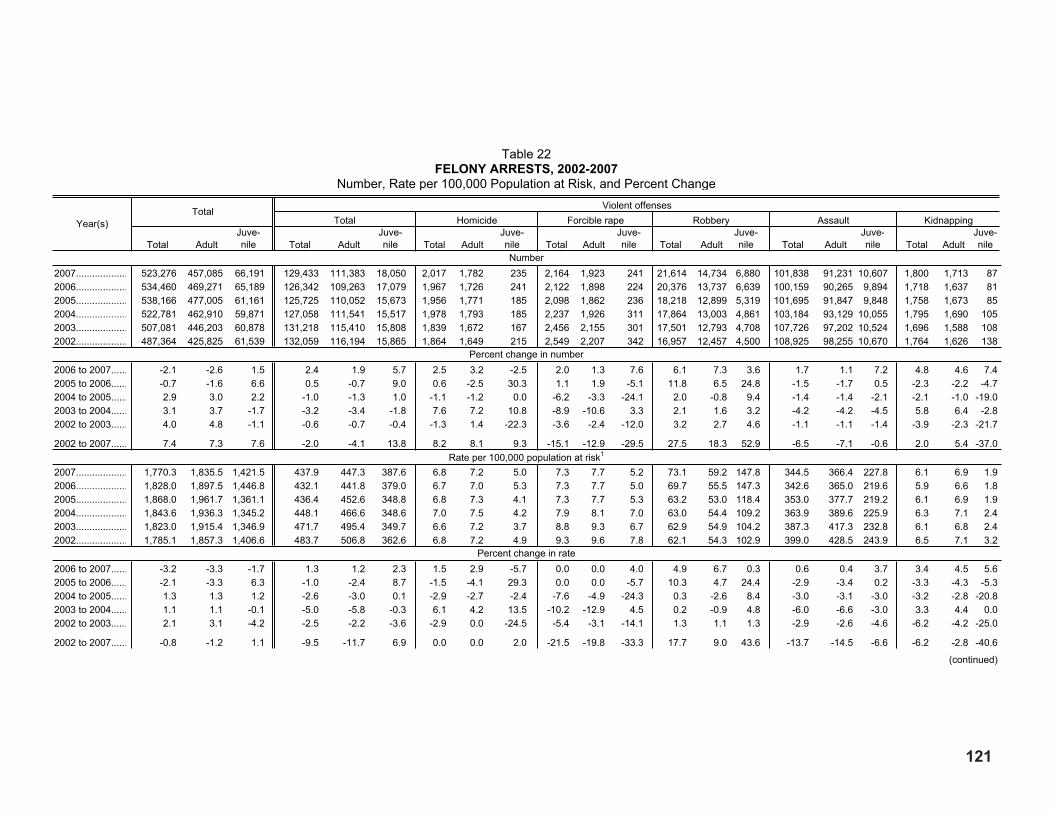
121
Table 22felonY arreSTS, 2002-2007
Number, Rate per 100,000 Population at Risk, and Percent ChangeViolent offensesTotal
Total Homicide Forcible rape Robbery Assault KidnappingYear(s)Juve- Juve- Juve- Juve- Juve- Juve- Juve-
Total Adult nile Total Adult nile Total Adult nile Total Adult nile Total Adult nile Total Adult nile Total Adult nileNumber
2007................... 523,276 457,085 66,191 129,433 111,383 18,050 2,017 1,782 235 2,164 1,923 241 21,614 14,734 6,880 101,838 91,231 10,607 1,800 1,713 872006................... 534,460 469,271 65,189 126,342 109,263 17,079 1,967 1,726 241 2,122 1,898 224 20,376 13,737 6,639 100,159 90,265 9,894 1,718 1,637 812005................... 538,166 477,005 61,161 125,725 110,052 15,673 1,956 1,771 185 2,098 1,862 236 18,218 12,899 5,319 101,695 91,847 9,848 1,758 1,673 852004................... 522,781 462,910 59,871 127,058 111,541 15,517 1,978 1,793 185 2,237 1,926 311 17,864 13,003 4,861 103,184 93,129 10,055 1,795 1,690 1052003................... 507,081 446,203 60,878 131,218 115,410 15,808 1,839 1,672 167 2,456 2,155 301 17,501 12,793 4,708 107,726 97,202 10,524 1,696 1,588 1082002................... 487,364 425,825 61,539 132,059 116,194 15,865 1,864 1,649 215 2,549 2,207 342 16,957 12,457 4,500 108,925 98,255 10,670 1,764 1,626 138
Percent change in number2006 to 2007...... -2.1 -2.6 1.5 2.4 1.9 5.7 2.5 3.2 -2.5 2.0 1.3 7.6 6.1 7.3 3.6 1.7 1.1 7.2 4.8 4.6 7.42005 to 2006...... -0.7 -1.6 6.6 0.5 -0.7 9.0 0.6 -2.5 30.3 1.1 1.9 -5.1 11.8 6.5 24.8 -1.5 -1.7 0.5 -2.3 -2.2 -4.72004 to 2005...... 2.9 3.0 2.2 -1.0 -1.3 1.0 -1.1 -1.2 0.0 -6.2 -3.3 -24.1 2.0 -0.8 9.4 -1.4 -1.4 -2.1 -2.1 -1.0 -19.02003 to 2004...... 3.1 3.7 -1.7 -3.2 -3.4 -1.8 7.6 7.2 10.8 -8.9 -10.6 3.3 2.1 1.6 3.2 -4.2 -4.2 -4.5 5.8 6.4 -2.82002 to 2003...... 4.0 4.8 -1.1 -0.6 -0.7 -0.4 -1.3 1.4 -22.3 -3.6 -2.4 -12.0 3.2 2.7 4.6 -1.1 -1.1 -1.4 -3.9 -2.3 -21.7
2002 to 2007...... 7.4 7.3 7.6 -2.0 -4.1 13.8 8.2 8.1 9.3 -15.1 -12.9 -29.5 27.5 18.3 52.9 -6.5 -7.1 -0.6 2.0 5.4 -37.0Rate per 100,000 population at risk1
2007................... 1,770.3 1,835.5 1,421.5 437.9 447.3 387.6 6.8 7.2 5.0 7.3 7.7 5.2 73.1 59.2 147.8 344.5 366.4 227.8 6.1 6.9 1.92006................... 1,828.0 1,897.5 1,446.8 432.1 441.8 379.0 6.7 7.0 5.3 7.3 7.7 5.0 69.7 55.5 147.3 342.6 365.0 219.6 5.9 6.6 1.82005................... 1,868.0 1,961.7 1,361.1 436.4 452.6 348.8 6.8 7.3 4.1 7.3 7.7 5.3 63.2 53.0 118.4 353.0 377.7 219.2 6.1 6.9 1.92004................... 1,843.6 1,936.3 1,345.2 448.1 466.6 348.6 7.0 7.5 4.2 7.9 8.1 7.0 63.0 54.4 109.2 363.9 389.6 225.9 6.3 7.1 2.42003................... 1,823.0 1,915.4 1,346.9 471.7 495.4 349.7 6.6 7.2 3.7 8.8 9.3 6.7 62.9 54.9 104.2 387.3 417.3 232.8 6.1 6.8 2.42002................... 1,785.1 1,857.3 1,406.6 483.7 506.8 362.6 6.8 7.2 4.9 9.3 9.6 7.8 62.1 54.3 102.9 399.0 428.5 243.9 6.5 7.1 3.2
Percent change in rate2006 to 2007...... -3.2 -3.3 -1.7 1.3 1.2 2.3 1.5 2.9 -5.7 0.0 0.0 4.0 4.9 6.7 0.3 0.6 0.4 3.7 3.4 4.5 5.62005 to 2006...... -2.1 -3.3 6.3 -1.0 -2.4 8.7 -1.5 -4.1 29.3 0.0 0.0 -5.7 10.3 4.7 24.4 -2.9 -3.4 0.2 -3.3 -4.3 -5.32004 to 2005...... 1.3 1.3 1.2 -2.6 -3.0 0.1 -2.9 -2.7 -2.4 -7.6 -4.9 -24.3 0.3 -2.6 8.4 -3.0 -3.1 -3.0 -3.2 -2.8 -20.82003 to 2004...... 1.1 1.1 -0.1 -5.0 -5.8 -0.3 6.1 4.2 13.5 -10.2 -12.9 4.5 0.2 -0.9 4.8 -6.0 -6.6 -3.0 3.3 4.4 0.02002 to 2003...... 2.1 3.1 -4.2 -2.5 -2.2 -3.6 -2.9 0.0 -24.5 -5.4 -3.1 -14.1 1.3 1.1 1.3 -2.9 -2.6 -4.6 -6.2 -4.2 -25.0
2002 to 2007...... -0.8 -1.2 1.1 -9.5 -11.7 6.9 0.0 0.0 2.0 -21.5 -19.8 -33.3 17.7 9.0 43.6 -13.7 -14.5 -6.6 -6.2 -2.8 -40.6
(continued)
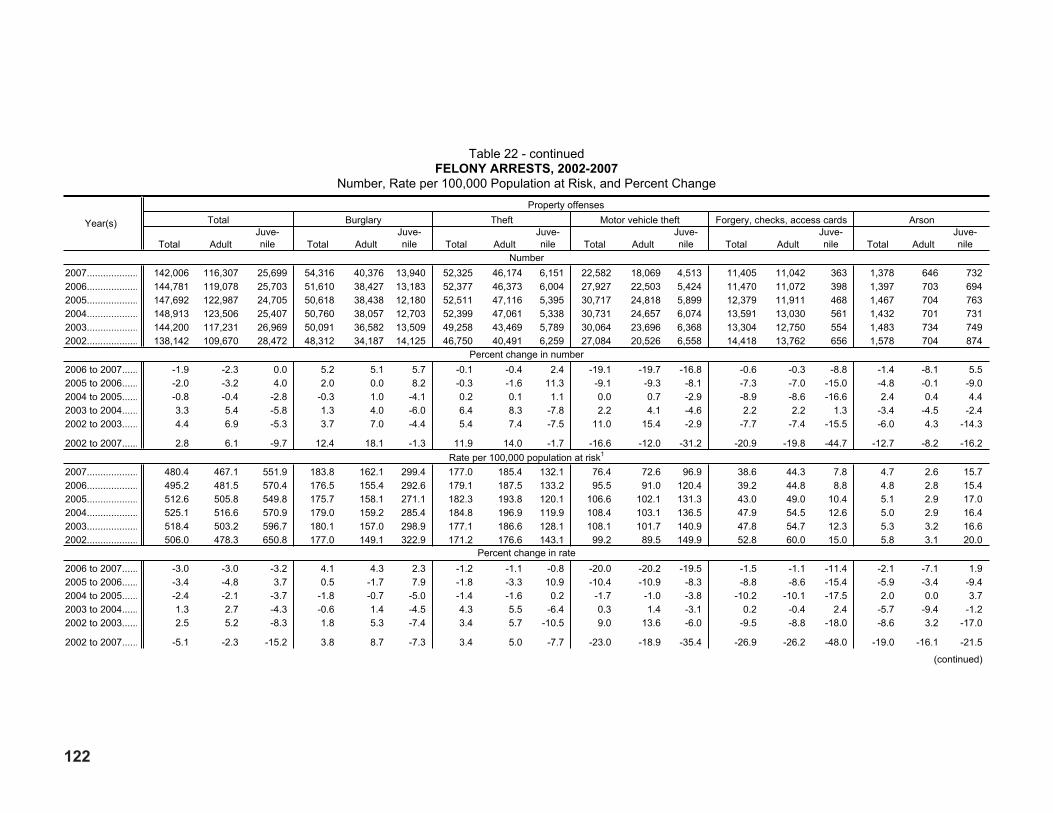
122
Table 22 - continuedfelonY arreSTS, 2002-2007
Number, Rate per 100,000 Population at Risk, and Percent ChangeProperty offenses
Total Burglary Theft Motor vehicle theft Forgery, checks, access cards ArsonYear(s)Juve- Juve- Juve- Juve- Juve- Juve-
Total Adult nile Total Adult nile Total Adult nile Total Adult nile Total Adult nile Total Adult nileNumber
2007................... 142,006 116,307 25,699 54,316 40,376 13,940 52,325 46,174 6,151 22,582 18,069 4,513 11,405 11,042 363 1,378 646 7322006................... 144,781 119,078 25,703 51,610 38,427 13,183 52,377 46,373 6,004 27,927 22,503 5,424 11,470 11,072 398 1,397 703 6942005................... 147,692 122,987 24,705 50,618 38,438 12,180 52,511 47,116 5,395 30,717 24,818 5,899 12,379 11,911 468 1,467 704 7632004................... 148,913 123,506 25,407 50,760 38,057 12,703 52,399 47,061 5,338 30,731 24,657 6,074 13,591 13,030 561 1,432 701 7312003................... 144,200 117,231 26,969 50,091 36,582 13,509 49,258 43,469 5,789 30,064 23,696 6,368 13,304 12,750 554 1,483 734 7492002................... 138,142 109,670 28,472 48,312 34,187 14,125 46,750 40,491 6,259 27,084 20,526 6,558 14,418 13,762 656 1,578 704 874
Percent change in number2006 to 2007...... -1.9 -2.3 0.0 5.2 5.1 5.7 -0.1 -0.4 2.4 -19.1 -19.7 -16.8 -0.6 -0.3 -8.8 -1.4 -8.1 5.52005 to 2006...... -2.0 -3.2 4.0 2.0 0.0 8.2 -0.3 -1.6 11.3 -9.1 -9.3 -8.1 -7.3 -7.0 -15.0 -4.8 -0.1 -9.02004 to 2005...... -0.8 -0.4 -2.8 -0.3 1.0 -4.1 0.2 0.1 1.1 0.0 0.7 -2.9 -8.9 -8.6 -16.6 2.4 0.4 4.42003 to 2004...... 3.3 5.4 -5.8 1.3 4.0 -6.0 6.4 8.3 -7.8 2.2 4.1 -4.6 2.2 2.2 1.3 -3.4 -4.5 -2.42002 to 2003...... 4.4 6.9 -5.3 3.7 7.0 -4.4 5.4 7.4 -7.5 11.0 15.4 -2.9 -7.7 -7.4 -15.5 -6.0 4.3 -14.3
2002 to 2007...... 2.8 6.1 -9.7 12.4 18.1 -1.3 11.9 14.0 -1.7 -16.6 -12.0 -31.2 -20.9 -19.8 -44.7 -12.7 -8.2 -16.2Rate per 100,000 population at risk1
2007................... 480.4 467.1 551.9 183.8 162.1 299.4 177.0 185.4 132.1 76.4 72.6 96.9 38.6 44.3 7.8 4.7 2.6 15.72006................... 495.2 481.5 570.4 176.5 155.4 292.6 179.1 187.5 133.2 95.5 91.0 120.4 39.2 44.8 8.8 4.8 2.8 15.42005................... 512.6 505.8 549.8 175.7 158.1 271.1 182.3 193.8 120.1 106.6 102.1 131.3 43.0 49.0 10.4 5.1 2.9 17.02004................... 525.1 516.6 570.9 179.0 159.2 285.4 184.8 196.9 119.9 108.4 103.1 136.5 47.9 54.5 12.6 5.0 2.9 16.42003................... 518.4 503.2 596.7 180.1 157.0 298.9 177.1 186.6 128.1 108.1 101.7 140.9 47.8 54.7 12.3 5.3 3.2 16.62002................... 506.0 478.3 650.8 177.0 149.1 322.9 171.2 176.6 143.1 99.2 89.5 149.9 52.8 60.0 15.0 5.8 3.1 20.0
Percent change in rate2006 to 2007...... -3.0 -3.0 -3.2 4.1 4.3 2.3 -1.2 -1.1 -0.8 -20.0 -20.2 -19.5 -1.5 -1.1 -11.4 -2.1 -7.1 1.92005 to 2006...... -3.4 -4.8 3.7 0.5 -1.7 7.9 -1.8 -3.3 10.9 -10.4 -10.9 -8.3 -8.8 -8.6 -15.4 -5.9 -3.4 -9.42004 to 2005...... -2.4 -2.1 -3.7 -1.8 -0.7 -5.0 -1.4 -1.6 0.2 -1.7 -1.0 -3.8 -10.2 -10.1 -17.5 2.0 0.0 3.72003 to 2004...... 1.3 2.7 -4.3 -0.6 1.4 -4.5 4.3 5.5 -6.4 0.3 1.4 -3.1 0.2 -0.4 2.4 -5.7 -9.4 -1.22002 to 2003...... 2.5 5.2 -8.3 1.8 5.3 -7.4 3.4 5.7 -10.5 9.0 13.6 -6.0 -9.5 -8.8 -18.0 -8.6 3.2 -17.0
2002 to 2007...... -5.1 -2.3 -15.2 3.8 8.7 -7.3 3.4 5.0 -7.7 -23.0 -18.9 -35.4 -26.9 -26.2 -48.0 -19.0 -16.1 -21.5
(continued)

123
Table 22 - continuedfelonY arreSTS, 2002-2007
Number, Rate per 100,000 Population at Risk, and Percent Change
Year(s)
Drug offenses All otherTotal Narcotics Marijuana Dangerous drugs Other
Total AdultJuve-nile Total Adult
Juve-nile Total Adult
Juve-nile Total Adult
Juve-nile Total Adult
Juve-nile Total Adult
Juve-nile
Number2007...................2006...................2005...................2004...................2003...................2002...................
143,692154,468159,944150,305140,744131,306
138,193148,769153,856144,437134,924125,439
5,4995,6996,0885,8685,8205,867
55,07056,09452,27452,47450,44048,881
53,31354,33550,81050,90948,85547,174
1,7571,7591,4641,5651,5851,707
16,12413,54813,07513,10613,02212,682
14,08011,70111,25811,29511,07410,632
2,0441,8471,8171,8111,9482,050
71,14383,36592,97282,41874,77566,522
69,48481,31190,20779,97572,53464,472
1,6592,0542,7652,4432,2412,050
1,3551,4611,6232,3072,5073,221
1,3161,4221,5812,2582,4613,161
393942494660
108,145108,869104,80596,50590,91985,857
91,20292,16190,11083,42678,63874,522
16,94316,70814,69513,07912,28111,335
Percent change in number2006 to 2007......2005 to 2006......2004 to 2005......2003 to 2004......2002 to 2003......
2002 to 2007......
-7.0-3.46.46.87.2
9.4
-7.1-3.36.57.17.6
10.2
-3.5-6.43.70.8
-0.8
-6.3
-1.87.3
-0.44.03.2
12.7
-1.96.9
-0.24.23.6
13.0
-0.120.2-6.5-1.3-7.1
2.9
19.03.6
-0.20.62.7
27.1
20.33.9
-0.32.04.2
32.4
10.71.70.3
-7.0-5.0
-0.3
-14.7-10.312.810.212.4
6.9
-14.5-9.912.810.312.5
7.8
-19.2-25.713.29.09.3
-19.1
-7.3-10.0-29.6
-8.0-22.2
-57.9
-7.5-10.1-30.0
-8.2-22.1
-58.4
----
-23.3
-35.0
-0.73.98.66.15.9
26.0
-1.02.38.06.15.5
22.4
1.413.712.4
6.58.3
49.5Rate per 100,000 population at risk1
2007...................2006...................2005...................2004...................2003...................2002...................
486.1528.3555.2530.0506.0480.9
554.9601.5632.7604.2579.2547.1
118.1126.5135.5131.8128.8134.1
186.3191.9181.4185.0181.3179.0
214.1219.7209.0212.9209.7205.8
37.739.032.635.235.139.0
54.546.345.446.246.846.5
56.547.346.347.247.546.4
43.941.040.440.743.146.9
240.7285.1322.7290.6268.8243.6
279.0328.8371.0334.5311.4281.2
35.645.661.554.949.646.9
4.65.05.68.19.0
11.8
5.35.76.59.4
10.613.8
0.80.90.91.11.01.4
365.9372.4363.8340.3326.9314.5
366.2372.7370.6349.0337.6325.0
363.9370.8327.0293.9271.7259.1
Percent change in rate2006 to 2007......2005 to 2006......2004 to 2005......2003 to 2004......2002 to 2003......
2002 to 2007......
-8.0-4.84.84.75.2
1.1
-7.7-4.94.74.35.9
1.4
-6.6-6.62.82.3
-4.0
-11.9
-2.95.8
-1.92.01.3
4.1
-2.55.1
-1.81.51.9
4.0
-3.319.6-7.40.3
-10.0
-3.3
17.72.0
-1.7-1.30.6
17.2
19.52.2
-1.9-0.62.4
21.8
7.11.5
-0.7-5.6-8.1
-6.4
-15.6-11.711.08.1
10.3
-1.2
-15.1-11.410.97.4
10.7
-0.8
-21.9-25.912.010.75.8
-24.1
-8.0-10.7-30.9-10.0-23.7
-61.0
-7.0-12.3-30.9-11.3-23.2
-61.6
-11.10.0
-18.210.0
-28.6
-42.9
-1.72.46.94.13.9
16.3
-1.70.66.23.43.9
12.7
-1.913.411.38.24.9
40.4Note: Dash indicates that a percent change is not calculated when the base number is less than 50.1 Rates are based on the population at risk for each year. The categories are total (10-69 years of age), adult (18-69 years of age), and juvenile (10-17 years of age) (see Table 58).

124
Table 23aDUlT felonY arreSTS, 2002-2007
By Category, Offense, and Law Enforcement Disposition
Category, offense,and
law enforcement disposition2002 2003 2004 2005 2006
2007 Percent change
Number Percent2002-2007
2006-2007
TotalTotal.................................................... 425,825 446,203 462,910 477,005 469,271 457,085 100.0 7.3 -2.6
Category and offense Violent offenses............................... 116,194 115,410 111,541 110,052 109,263 111,383 24.4 -4.1 1.9 Homicide....................................... 1,649 1,672 1,793 1,771 1,726 1,782 0.4 8.1 3.2 Forcible rape................................. 2,207 2,155 1,926 1,862 1,898 1,923 0.4 -12.9 1.3 Robbery........................................ 12,457 12,793 13,003 12,899 13,737 14,734 3.2 18.3 7.3 Assault.......................................... 98,255 97,202 93,129 91,847 90,265 91,231 20.0 -7.1 1.1 Kidnapping.................................... 1,626 1,588 1,690 1,673 1,637 1,713 0.4 5.4 4.6
Property offenses............................. 109,670 117,231 123,506 122,987 119,078 116,307 25.4 6.1 -2.3 Burglary......................................... 34,187 36,582 38,057 38,438 38,427 40,376 8.8 18.1 5.1 Theft.............................................. 40,491 43,469 47,061 47,116 46,373 46,174 10.1 14.0 -0.4 Motor vehicle theft......................... 20,526 23,696 24,657 24,818 22,503 18,069 4.0 -12.0 -19.7 Forgery, checks, access cards..... 13,762 12,750 13,030 11,911 11,072 11,042 2.4 -19.8 -0.3 Arson............................................. 704 734 701 704 703 646 0.1 -8.2 -8.1
Drug offenses................................... 125,439 134,924 144,437 153,856 148,769 138,193 30.2 10.2 -7.1 Narcotics....................................... 47,174 48,855 50,909 50,810 54,335 53,313 11.7 13.0 -1.9 Marijuana...................................... 10,632 11,074 11,295 11,258 11,701 14,080 3.1 32.4 20.3 Dangerous drugs.......................... 64,472 72,534 79,975 90,207 81,311 69,484 15.2 7.8 -14.5 Other............................................. 3,161 2,461 2,258 1,581 1,422 1,316 0.3 -58.4 -7.5
Sex offenses.................................... 7,811 7,766 7,682 7,354 7,767 7,402 1.6 -5.2 -4.7 Lewd or lascivious......................... 3,392 3,199 2,991 2,663 2,955 2,632 0.6 -22.4 -10.9 Other............................................. 4,419 4,567 4,691 4,691 4,812 4,770 1.0 7.9 -0.9
All other............................................ 66,711 70,872 75,744 82,756 84,394 83,800 18.3 25.6 -0.7 Weapons....................................... 14,385 15,920 17,637 19,633 19,847 19,777 4.3 37.5 -0.4 Driving under the influence........... 5,832 5,827 5,617 5,963 6,162 6,257 1.4 7.3 1.5 Hit-and-run.................................... 1,621 1,676 1,571 1,617 1,539 1,542 0.3 -4.9 0.2 Escape.......................................... 433 399 422 370 258 227 0.0 -47.6 -12.0 Other............................................. 44,440 47,050 50,497 55,173 56,588 55,997 12.3 26.0 -1.0
Law enforcement disposition Released.......................................... Turned over to other agency............ Complaint sought.............................
25,0804,483
396,262
24,8925,012
416,299
24,0554,794
434,061
22,6455,534
448,826
23,6056,136
439,530
23,3275,798
427,960
5.11.3
93.6
-7.029.38.0
-1.2-5.5-2.6
Notes: Percentages may not add to subtotals or 100.0 because of rounding.

125
Table 24JUVenile felonY arreSTS, 2002-2007
By Category, Offense, and Law Enforcement Disposition
Category, offense,and
law enforcement disposition2002 2003 2004 2005 2006
2007 Percent change
Number Percent2002-2007
2006-2007
TotalTotal.................................................... 61,539 60,878 59,871 61,161 65,189 66,191 100.0 7.6 1.5
Category and offense Violent offenses............................... 15,865 15,808 15,517 15,673 17,079 18,050 27.3 13.8 5.7 Homicide....................................... 215 167 185 185 241 235 0.4 9.3 -2.5 Forcible rape................................. 342 301 311 236 224 241 0.4 -29.5 7.6 Robbery........................................ 4,500 4,708 4,861 5,319 6,639 6,880 10.4 52.9 3.6 Assault.......................................... 10,670 10,524 10,055 9,848 9,894 10,607 16.0 -0.6 7.2 Kidnapping.................................... 138 108 105 85 81 87 0.1 -37.0 7.4
Property offenses............................. 28,472 26,969 25,407 24,705 25,703 25,699 38.8 -9.7 0.0 Burglary......................................... 14,125 13,509 12,703 12,180 13,183 13,940 21.1 -1.3 5.7 Theft.............................................. 6,259 5,789 5,338 5,395 6,004 6,151 9.3 -1.7 2.4 Motor vehicle theft......................... 6,558 6,368 6,074 5,899 5,424 4,513 6.8 -31.2 -16.8 Forgery, checks, access cards..... 656 554 561 468 398 363 0.5 -44.7 -8.8 Arson............................................. 874 749 731 763 694 732 1.1 -16.2 5.5
Drug offenses................................... 5,867 5,820 5,868 6,088 5,699 5,499 8.3 -6.3 -3.5 Narcotics....................................... 1,707 1,585 1,565 1,464 1,759 1,757 2.7 2.9 -0.1 Marijuana...................................... 2,050 1,948 1,811 1,817 1,847 2,044 3.1 -0.3 10.7 Dangerous drugs.......................... 2,050 2,241 2,443 2,765 2,054 1,659 2.5 -19.1 -19.2 Other............................................. 60 46 49 42 39 39 0.1 -35.0 -
All other............................................ 11,335 12,281 13,079 14,695 16,708 16,943 25.6 49.5 1.4Law enforcement disposition
Handled within department.............. Turned over to other agency............ Juvenile court/probation dept...........
5,486609
55,444
5,357525
54,996
5,595410
53,866
4,904429
55,828
5,471614
59,104
5,717591
59,883
8.60.9
90.5
4.2-3.08.0
4.5-3.71.3
Notes: Percentages may not add to subtotals because of rounding. Dash indicates that a percent change is not calculated when the base number is less than 50.

126
Table 25miSDemeanor arreSTS, 2002-2007
By Offense
Offense 2002 2003 2004 2005 2006 2007Number Percent Number Percent Number Percent Number Percent Number Percent Number Percent
Total.......................................... 903,249 100.0 931,782 100.0 945,562 100.0 939,046 100.0 968,408 100.0 992,588 100.0
Assault and battery................ 84,936 9.4 86,413 9.3 85,602 9.1 87,001 9.3 89,199 9.2 91,150 9.2 Petty theft.............................. 69,009 7.6 69,837 7.5 69,352 7.3 64,349 6.9 58,659 6.1 63,134 6.4 Drug offenses........................ 126,152 14.0 134,555 14.4 140,198 14.8 147,301 15.7 147,928 15.3 149,641 15.1 Drunk..................................... 100,095 11.1 98,613 10.6 99,795 10.6 96,801 10.3 107,024 11.1 115,239 11.6 Driving under the influence.... 173,748 19.2 180,074 19.3 177,056 18.7 176,384 18.8 192,903 19.9 199,866 20.1 All other................................. 349,309 38.7 362,290 38.9 373,559 39.5 367,210 39.1 372,695 38.5 373,558 37.6Note: Percentages may not add to 100.0 because of rounding.

127
Table 26miSDemeanor arreSTS, 2002-2007By Offense for Adult and Juvenile Arrests
Offense 2002 2003 2004 2005 2006 2007Number Percent Number Percent Number Percent Number Percent Number Percent Number Percent
TotalTotal......................................... 903,249 100.0 931,782 100.0 945,562 100.0 939,046 100.0 968,408 100.0 992,588 100.0
Adult and juvenile arrests Adult...................................... Juvenile.................................
770,774132,475
85.314.7
801,560130,222
86.014.0
818,027127,535
86.513.5
812,426126,620
86.513.5
837,244131,164
86.513.5
857,959134,629
86.413.6
Offense for adult and juvenile arrests Assault and battery............... 84,936 100.0 86,413 100.0 85,602 100.0 87,001 100.0 89,199 100.0 91,150 100.0 Adult................................... 62,421 73.5 64,017 74.1 63,962 74.7 65,049 74.8 66,442 74.5 68,813 75.5 Juvenile.............................. 22,515 26.5 22,396 25.9 21,640 25.3 21,952 25.2 22,757 25.5 22,337 24.5
Petty theft.............................. 69,009 100.0 69,837 100.0 69,352 100.0 64,349 100.0 58,659 100.0 63,134 100.0 Adult................................... 42,392 61.4 43,685 62.6 43,899 63.3 40,853 63.5 36,641 62.5 38,951 61.7 Juvenile.............................. 26,617 38.6 26,152 37.4 25,453 36.7 23,496 36.5 22,018 37.5 24,183 38.3
Drug offenses........................ 126,152 100.0 134,555 100.0 140,198 100.0 147,301 100.0 147,928 100.0 149,641 100.0 Adult................................... 108,832 86.3 118,142 87.8 124,589 88.9 131,511 89.3 132,124 89.3 132,782 88.7 Juvenile.............................. 17,320 13.7 16,413 12.2 15,609 11.1 15,790 10.7 15,804 10.7 16,859 11.3
Drunk..................................... 100,095 100.0 98,613 100.0 99,795 100.0 96,801 100.0 107,024 100.0 115,239 100.0 Adult................................... 96,059 96.0 94,853 96.2 96,131 96.3 93,214 96.3 102,823 96.1 110,569 95.9 Juvenile.............................. 4,036 4.0 3,760 3.8 3,664 3.7 3,587 3.7 4,201 3.9 4,670 4.1
Driving under the influence... 173,748 100.0 180,074 100.0 177,056 100.0 176,384 100.0 192,903 100.0 199,866 100.0 Adult................................... 172,266 99.1 178,561 99.2 175,653 99.2 175,004 99.2 191,282 99.2 198,296 99.2 Juvenile.............................. 1,482 0.9 1,513 0.8 1,403 0.8 1,380 0.8 1,621 0.8 1,570 0.8
All other................................. 349,309 100.0 362,290 100.0 373,559 100.0 367,210 100.0 372,695 100.0 373,558 100.0 Adult................................... 288,804 82.7 302,302 83.4 313,793 84.0 306,795 83.5 307,932 82.6 308,548 82.6 Juvenile.............................. 60,505 17.3 59,988 16.6 59,766 16.0 60,415 16.5 64,763 17.4 65,010 17.4
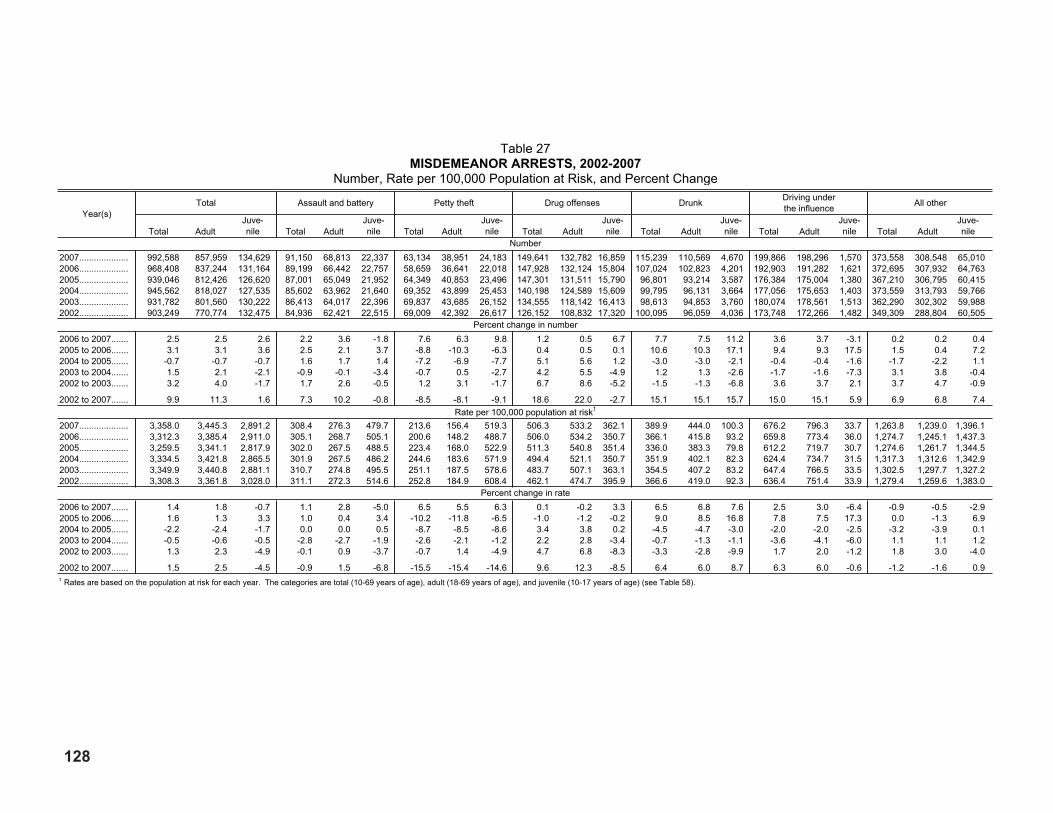
128
Table 27miSDemeanor arreSTS, 2002-2007
Number, Rate per 100,000 Population at Risk, and Percent Change
Year(s)Total Assault and battery Petty theft Drug offenses Drunk Driving under
the influence All other
Total AdultJuve-nile Total Adult
Juve-nile Total Adult
Juve-nile Total Adult
Juve-nile Total Adult
Juve-nile Total Adult
Juve-nile Total Adult
Juve-nile
Number2007....................2006....................2005....................2004....................2003....................2002....................
992,588968,408939,046945,562931,782903,249
857,959837,244812,426818,027801,560770,774
134,629131,164126,620127,535130,222132,475
91,15089,19987,00185,60286,41384,936
68,81366,44265,04963,96264,01762,421
22,33722,75721,95221,64022,39622,515
63,13458,65964,34969,35269,83769,009
38,95136,64140,85343,89943,68542,392
24,18322,01823,49625,45326,15226,617
149,641147,928147,301140,198134,555126,152
132,782 16,859132,124 15,804131,511 15,790124,589 15,609118,142 16,413108,832 17,320
115,239107,02496,80199,79598,613
100,095
110,569102,82393,21496,13194,85396,059
4,6704,2013,5873,6643,7604,036
199,866192,903176,384177,056180,074173,748
198,296191,282175,004175,653178,561172,266
1,5701,6211,3801,4031,5131,482
373,558372,695367,210373,559362,290349,309
308,548307,932306,795313,793302,302288,804
65,01064,76360,41559,76659,98860,505
Percent change in number2006 to 2007.......2005 to 2006.......2004 to 2005.......2003 to 2004.......2002 to 2003.......
2002 to 2007.......
2.53.1
-0.71.53.2
9.9
2.53.1
-0.72.14.0
11.3
2.63.6
-0.7-2.1-1.7
1.6
2.22.51.6
-0.91.7
7.3
3.62.11.7
-0.12.6
10.2
-1.83.71.4
-3.4-0.5
-0.8
7.6-8.8-7.2-0.71.2
-8.5
6.3-10.3-6.90.53.1
-8.1
9.8-6.3-7.7-2.7-1.7
-9.1
1.20.45.14.26.7
18.6
0.50.55.65.58.6
22.0
6.70.11.2
-4.9-5.2
-2.7
7.710.6-3.01.2
-1.5
15.1
7.510.3-3.01.3
-1.3
15.1
11.217.1-2.1-2.6-6.8
15.7
3.69.4
-0.4-1.73.6
15.0
3.79.3
-0.4-1.63.7
15.1
-3.117.5-1.6-7.32.1
5.9
0.21.5
-1.73.13.7
6.9
0.20.4
-2.23.84.7
6.8
0.47.21.1
-0.4-0.9
7.4Rate per 100,000 population at risk1
2007....................2006....................2005....................2004....................2003....................2002....................
3,358.03,312.33,259.53,334.53,349.93,308.3
3,445.33,385.43,341.13,421.83,440.83,361.8
2,891.22,911.02,817.92,865.52,881.13,028.0
308.4305.1302.0301.9310.7311.1
276.3268.7267.5267.5274.8272.3
479.7505.1488.5486.2495.5514.6
213.6200.6223.4244.6251.1252.8
156.4148.2168.0183.6187.5184.9
519.3488.7522.9571.9578.6608.4
506.3506.0511.3494.4483.7462.1
533.2534.2540.8521.1507.1474.7
362.1350.7351.4350.7363.1395.9
389.9366.1336.0351.9354.5366.6
444.0415.8383.3402.1407.2419.0
100.393.279.882.383.292.3
676.2659.8612.2624.4647.4636.4
796.3773.4719.7734.7766.5751.4
33.736.030.731.533.533.9
1,263.81,274.71,274.61,317.31,302.51,279.4
1,239.01,245.11,261.71,312.61,297.71,259.6
1,396.11,437.31,344.51,342.91,327.21,383.0
Percent change in rate2006 to 2007.......2005 to 2006.......2004 to 2005.......2003 to 2004.......2002 to 2003.......
2002 to 2007.......
1.41.6
-2.2-0.51.3
1.5
1.81.3
-2.4-0.62.3
2.5
-0.73.3
-1.7-0.5-4.9
-4.5
1.11.00.0
-2.8-0.1
-0.9
2.80.40.0
-2.70.9
1.5
-5.03.40.5
-1.9-3.7
-6.8
6.5-10.2
-8.7-2.6-0.7
-15.5
5.5-11.8
-8.5-2.11.4
-15.4
6.3-6.5-8.6-1.2-4.9
-14.6
0.1-1.03.42.24.7
9.6
-0.2-1.23.82.86.8
12.3
3.3-0.20.2
-3.4-8.3
-8.5
6.59.0
-4.5-0.7-3.3
6.4
6.88.5
-4.7-1.3-2.8
6.0
7.616.8-3.0-1.1-9.9
8.7
2.57.8
-2.0-3.61.7
6.3
3.07.5
-2.0-4.12.0
6.0
-6.417.3-2.5-6.0-1.2
-0.6
-0.90.0
-3.21.11.8
-1.2
-0.5-1.3-3.91.13.0
-1.6
-2.96.90.11.2
-4.0
0.91 Rates are based on the population at risk for each year. The categories are total (10-69 years of age), adult (18-69 years of age), and juvenile (10-17 years of age) (see Table 58).

129
Table 28aDUlT miSDemeanor arreSTS, 2002-2007
By Offense and Law Enforcement Disposition
Offenseand
law enforcement disposition2002 2003 2004 2005 2006
2007 Percent change
Number Percent2002-2007
2006-2007
TotalTotal............................................. 770,774 801,560 818,027 812,426 837,244 857,959 100.0 11.3 2.5
Offense Assault and battery................... 62,421 64,017 63,962 65,049 66,442 68,813 8.0 10.2 3.6 Burglary.................................... 213 206 266 314 399 332 0.0 55.9 -16.8 Petty theft................................. 42,392 43,685 43,899 40,853 36,641 38,951 4.5 -8.1 6.3 Checks and access cards......... 700 658 680 710 740 772 0.1 10.3 4.3 Drug offenses........................... 108,832 118,142 124,589 131,511 132,124 132,782 15.5 22.0 0.5
Indecent exposure.................... 1,503 1,387 1,367 1,403 1,311 1,292 0.2 -14.0 -1.4 Annoying children..................... 707 654 621 627 680 696 0.1 -1.6 2.4 Obscene matter........................ 70 51 60 67 69 67 0.0 -4.3 -2.9 Lewd conduct........................... 3,241 3,324 3,530 3,750 3,526 3,718 0.4 14.7 5.4 Prostitution................................ 11,682 13,025 13,870 12,893 11,968 11,970 1.4 2.5 0.0
Drunk........................................ 96,059 94,853 96,131 93,214 102,823 110,569 12.9 15.1 7.5 Liquor laws............................... 23,293 25,348 21,495 17,161 16,566 15,706 1.8 -32.6 -5.2 Disorderly conduct.................... 4,223 5,631 6,960 5,347 4,849 3,734 0.4 -11.6 -23.0 Disturbing the peace................. 5,470 5,163 5,249 4,654 4,828 4,832 0.6 -11.7 0.1 Malicious mischief.................... 7,221 6,696 6,873 7,197 7,492 7,487 0.9 3.7 -0.1
Trespassing.............................. 14,774 14,774 14,131 14,486 13,968 13,448 1.6 -9.0 -3.7 Weapons.................................. 3,407 3,430 3,821 4,041 4,277 4,279 0.5 25.6 0.0 Driving under the influence....... 172,266 178,561 175,653 175,004 191,282 198,296 23.1 15.1 3.7 Hit-and-run................................ 6,201 6,651 6,869 6,622 6,908 6,550 0.8 5.6 -5.2 Selected traffic violations.......... 23,792 24,030 23,835 23,192 23,122 21,860 2.5 -8.1 -5.5
Gambling.................................. 448 481 407 569 492 610 0.1 36.2 24.0 Nonsupport............................... 236 205 142 104 164 138 0.0 -41.5 -15.9 All other.................................... 181,623 190,588 203,617 203,658 206,573 211,057 24.6 16.2 2.2
Law enforcement disposition Released.................................. Turned over to other agency.... Complaint sought......................
37,6436,327
726,804
38,1767,417
755,967
35,2037,374
775,450
35,3569,126
767,944
38,3179,384
789,543
41,9409,333
806,686
4.91.1
94.0
11.447.511.0
9.5-0.52.2
Notes: Percentages may not add to 100.0 because of rounding.

130
Table 29JUVenile miSDemeanor anD STaTUS offenSe arreSTS, 2002-2007
By Level of Offense, Offense, and Law Enforcement Disposition
Level of offense, offense,and
law enforcement disposition2002 2003 2004 2005 2006
2007 Percent change
Number Percent2002-2007
2006-2007
TotalTotal................................................. 168,095 162,442 158,275 157,618 167,660 170,665 100.0 1.5 1.8
Level of offense and offense Misdemeanor offenses.................. 132,475 130,222 127,535 126,620 131,164 134,629 78.9 1.6 2.6 Assault and battery..................... 22,515 22,396 21,640 21,952 22,757 22,337 13.1 -0.8 -1.8 Burglary...................................... 413 287 381 340 323 291 0.2 -29.5 -9.9 Petty theft................................... 26,617 26,152 25,453 23,496 22,018 24,183 14.2 -9.1 9.8 Checks and access cards.......... 129 104 122 98 103 119 0.1 -7.8 15.5 Drug offenses............................. 17,320 16,413 15,609 15,790 15,804 16,859 9.9 -2.7 6.7 Drunk.......................................... 4,036 3,760 3,664 3,587 4,201 4,670 2.7 15.7 11.2 Liquor laws................................. 5,109 5,048 4,621 4,393 5,056 5,643 3.3 10.5 11.6 Disturbing the peace.................. 11,874 12,233 12,446 12,688 12,206 11,927 7.0 0.4 -2.3 Malicious mischief...................... 10,236 9,677 9,140 9,790 11,678 11,506 6.7 12.4 -1.5 Trespassing................................ 3,592 3,330 2,920 3,088 3,399 3,702 2.2 3.1 8.9 Weapons.................................... 1,768 1,954 1,981 2,333 2,277 2,065 1.2 16.8 -9.3 Driving under the influence......... 1,482 1,513 1,403 1,380 1,621 1,570 0.9 5.9 -3.1 Glue sniffing............................... 80 78 89 100 183 246 0.1 207.5 34.4 All other...................................... 27,304 27,277 28,066 27,585 29,538 29,511 17.3 8.1 -0.1
Status offenses1............................ 35,620 32,220 30,740 30,998 36,496 36,036 21.1 1.2 -1.3Law enforcement disposition
Handled within department............ Turned over to other agency......... Juvenile court/probation dept........
39,1792,646
126,270
36,1802,432
123,830
37,1192,004
119,152
33,5961,985
122,037
37,5241,944
128,192
38,7032,114
129,848
22.71.2
76.1
-1.2-20.1
2.8
3.18.71.3
Notes: Percentages may not add to subtotals because of rounding.1 Status offenses include truancy, incorrigibility, running away, and curfew violations. These offenses can only be committed or engaged in by a juvenile.

131
Table 30felonY anD miSDemeanor arreSTS, 2007Gender, Age, and Race/Ethnic Group of Arrestee
Gender, age,and
race/ethnic group
Total Total Felony Misdemeanor
Number Percent Number Percent Number Percent Number PercentTotal
Total.......................... 1,515,864 100.0 1,515,864 100.0 523,276 34.5 992,588 65.5Gender
Male........................ Female...................
1,193,011322,853
78.721.3
1,193,011322,853
100.0100.0
416,032107,244
34.933.2
776,979215,609
65.166.8
Age Under 18................. 18-29...................... 18-19................... 20-29................... 30 and over............
200,820628,798123,371505,427686,246
13.241.58.1
33.345.3
200,820628,798123,371505,427686,246
100.0100.0100.0100.0100.0
66,191223,674
45,316178,358233,411
33.035.636.735.334.0
134,629405,124
78,055327,069452,835
67.064.463.364.766.0
Race/ethnic group White...................... Hispanic.................. Black....................... Other......................
546,148618,598259,98591,133
36.040.817.26.0
546,148618,598259,98591,133
100.0100.0100.0100.0
164,274215,541113,96229,499
30.134.843.832.4
381,874403,057146,02361,634
69.965.256.267.6
Note: Percentages may not add to 100.0 because of rounding.

132
Table 31GenDer anD raCe/eTHniC GroUP of felonY arreSTeeS, 2007
By Category and Offense
Category Number Percentand
offense TotalGender
Male Female WhiteRace/ethnic group
Hispanic Black OtherTotal
GenderMale Female White
Race/ethnic groupHispanic Black Other
Total................................ 523,276 416,032 107,244 164,274 215,541 113,962 29,499 100.0 79.5 20.5 31.4 41.2 21.8 5.6
Violent offenses............ 129,433 105,701 23,732 36,376 55,038 30,238 7,781 100.0 81.7 18.3 28.1 42.5 23.4 6.0 Homicide................... 2,017 1,802 215 373 1,022 495 127 100.0 89.3 10.7 18.5 50.7 24.5 6.3 Forcible rape............. 2,164 2,157 7 495 1,095 448 126 100.0 99.7 0.3 22.9 50.6 20.7 5.8 Robbery..................... 21,614 18,781 2,833 3,504 8,425 8,685 1,000 100.0 86.9 13.1 16.2 39.0 40.2 4.6 Assault....................... 101,838 81,386 20,452 31,612 43,629 20,172 6,425 100.0 79.9 20.1 31.0 42.8 19.8 6.3 Kidnapping................ 1,800 1,575 225 392 867 438 103 100.0 87.5 12.5 21.8 48.2 24.3 5.7
Property offenses......... 142,006 103,767 38,239 45,840 58,275 28,541 9,350 100.0 73.1 26.9 32.3 41.0 20.1 6.6 Burglary..................... 54,316 40,337 13,979 18,032 21,552 11,074 3,658 100.0 74.3 25.7 33.2 39.7 20.4 6.7 Theft.......................... 52,325 36,880 15,445 17,897 20,299 10,508 3,621 100.0 70.5 29.5 34.2 38.8 20.1 6.9 Motor vehicle theft..... 22,582 18,084 4,498 5,889 11,161 4,310 1,222 100.0 80.1 19.9 26.1 49.4 19.1 5.4 Forgery, checks, access cards........... 11,405 7,262 4,143 3,368 4,820 2,466 751 100.0 63.7 36.3 29.5 42.3 21.6 6.6 Arson......................... 1,378 1,204 174 654 443 183 98 100.0 87.4 12.6 47.5 32.1 13.3 7.1
Drug offenses............... 143,692 114,477 29,215 48,157 53,710 34,987 6,838 100.0 79.7 20.3 33.5 37.4 24.3 4.8 Narcotics................... 55,070 43,816 11,254 12,927 15,843 24,449 1,851 100.0 79.6 20.4 23.5 28.8 44.4 3.4 Marijuana................... 16,124 14,572 1,552 5,095 4,704 5,258 1,067 100.0 90.4 9.6 31.6 29.2 32.6 6.6 Dangerous drugs....... 71,143 55,124 16,019 29,575 32,707 4,988 3,873 100.0 77.5 22.5 41.6 46.0 7.0 5.4 Other......................... 1,355 965 390 560 456 292 47 100.0 71.2 28.8 41.3 33.7 21.5 3.5
Sex offenses................. 8,745 8,415 330 2,713 3,949 1,595 488 100.0 96.2 3.8 31.0 45.2 18.2 5.6 Lewd or lascivious..... 3,382 3,316 66 853 1,922 431 176 100.0 98.0 2.0 25.2 56.8 12.7 5.2 Other......................... 5,363 5,099 264 1,860 2,027 1,164 312 100.0 95.1 4.9 34.7 37.8 21.7 5.8
Driving offenses............ 7,954 6,590 1,364 2,919 3,916 613 506 100.0 82.9 17.1 36.7 49.2 7.7 6.4 Driving under the influence................... 6,330 5,232 1,098 2,463 3,004 471 392 100.0 82.7 17.3 38.9 47.5 7.4 6.2 Hit-and-run................ 1,624 1,358 266 456 912 142 114 100.0 83.6 16.4 28.1 56.2 8.7 7.0
All other........................ 91,446 77,082 14,364 28,269 40,653 17,988 4,536 100.0 84.3 15.7 30.9 44.5 19.7 5.0 Weapons................... 26,284 24,654 1,630 6,183 13,372 5,326 1,403 100.0 93.8 6.2 23.5 50.9 20.3 5.3 Escape...................... 253 203 50 87 106 44 16 100.0 80.2 19.8 34.4 41.9 17.4 6.3 Other......................... 64,909 52,225 12,684 21,999 27,175 12,618 3,117 100.0 80.5 19.5 33.9 41.9 19.4 4.8Note: Percentages may not add to 100.0 because of rounding.

133
Table 32aGe of felonY arreSTeeS, 2007
Category and Offense
Categoryand
offense
Number Percent
Total Under 18 18-19 20-29 30-3940 andover Total Under 18 18-19 20-29 30-39
40 andover
Total............................................ 523,276 66,191 45,316 178,358 110,260 123,151 100.0 12.6 8.7 34.1 21.1 23.5
Violent offenses........................ 129,433 18,050 10,860 44,015 27,467 29,041 100.0 13.9 8.4 34.0 21.2 22.4 Homicide............................... 2,017 235 335 858 293 296 100.0 11.7 16.6 42.5 14.5 14.7 Forcible rape......................... 2,164 241 191 760 507 465 100.0 11.1 8.8 35.1 23.4 21.5 Robbery................................. 21,614 6,880 3,610 6,711 2,419 1,994 100.0 31.8 16.7 31.0 11.2 9.2 Assault.................................. 101,838 10,607 6,536 34,904 23,818 25,973 100.0 10.4 6.4 34.3 23.4 25.5 Kidnapping............................ 1,800 87 188 782 430 313 100.0 4.8 10.4 43.4 23.9 17.4
Property offenses..................... 142,006 25,699 15,387 48,626 26,691 25,603 100.0 18.1 10.8 34.2 18.8 18.0 Burglary................................. 54,316 13,940 6,965 17,000 8,454 7,957 100.0 25.7 12.8 31.3 15.6 14.6 Theft...................................... 52,325 6,151 4,705 18,087 11,041 12,341 100.0 11.8 9.0 34.6 21.1 23.6 Motor vehicle theft................. 22,582 4,513 2,788 8,493 4,043 2,745 100.0 20.0 12.3 37.6 17.9 12.2 Forgery, checks, access cards.................................... 11,405 363 851 4,846 3,014 2,331 100.0 3.2 7.5 42.5 26.4 20.4 Arson..................................... 1,378 732 78 200 139 229 100.0 53.1 5.7 14.5 10.1 16.6
Drug offenses........................... 143,692 5,499 9,157 49,245 34,979 44,812 100.0 3.8 6.4 34.3 24.3 31.2 Narcotics............................... 55,070 1,757 3,058 15,382 12,132 22,741 100.0 3.2 5.6 27.9 22.0 41.3 Marijuana.............................. 16,124 2,044 2,262 7,068 2,663 2,087 100.0 12.7 14.0 43.8 16.5 12.9 Dangerous drugs................... 71,143 1,659 3,781 26,347 19,819 19,537 100.0 2.3 5.3 37.0 27.9 27.5 Other..................................... 1,355 39 56 448 365 447 100.0 2.9 4.1 33.1 26.9 33.0
Sex offenses............................ 8,745 1,343 591 2,180 1,705 2,926 100.0 15.4 6.8 24.9 19.5 33.5 Lewd or lascivious................. 3,382 750 206 703 714 1,009 100.0 22.2 6.1 20.8 21.1 29.8 Other..................................... 5,363 593 385 1,477 991 1,917 100.0 11.1 7.2 27.5 18.5 35.7
Driving offenses....................... 7,954 155 525 3,187 1,786 2,301 100.0 1.9 6.6 40.1 22.5 28.9 Driving under the influence... 6,330 73 350 2,511 1,455 1,941 100.0 1.2 5.5 39.7 23.0 30.7 Hit-and-run............................ 1,624 82 175 676 331 360 100.0 5.0 10.8 41.6 20.4 22.2
All other.................................... 91,446 15,445 8,796 31,105 17,632 18,468 100.0 16.9 9.6 34.0 19.3 20.2 Weapons............................... 26,284 6,507 3,496 9,269 3,689 3,323 100.0 24.8 13.3 35.3 14.0 12.6 Escape.................................. 253 26 25 103 53 46 100.0 10.3 9.9 40.7 20.9 18.2 Other..................................... 64,909 8,912 5,275 21,733 13,890 15,099 100.0 13.7 8.1 33.5 21.4 23.3Note: Percentages may not add to 100.0 because of rounding.

134
Table 33GenDer anD raCe/eTHniC GroUP of felonY arreSTeeS, 2007
By Category, Offense, and AgeCategory, offense,
and ageTotal White Hispanic Black Other
Total Male Female Total Male Female Total Male Female Total Male Female Total Male FemaleTotal............................... 523,276 416,032 107,244 164,274 122,743 41,531 215,541 181,014 34,527 113,962 89,190 24,772 29,499 23,085 6,414
Under 10..................... 236 214 22 59 50 9 76 71 5 81 74 7 20 19 1 10-17........................... 65,955 54,650 11,305 14,475 11,521 2,954 32,263 27,470 4,793 15,069 12,261 2,808 4,148 3,398 750 18-19........................... 45,316 37,691 7,625 11,540 9,024 2,516 21,282 18,525 2,757 9,802 7,967 1,835 2,692 2,175 517 20-29........................... 178,358 142,345 36,013 49,459 36,495 12,964 85,239 71,988 13,251 33,037 25,623 7,414 10,623 8,239 2,384 30-39........................... 110,260 85,283 24,977 37,198 26,967 10,231 45,949 37,789 8,160 20,914 15,750 5,164 6,199 4,777 1,422 40-69........................... 122,152 94,967 27,185 51,079 38,281 12,798 30,496 24,955 5,541 34,851 27,326 7,525 5,726 4,405 1,321 70 and over................. 999 882 117 464 405 59 236 216 20 208 189 19 91 72 19
Violent offenses........... 129,433 105,701 23,732 36,376 28,333 8,043 55,038 46,893 8,145 30,238 24,205 6,033 7,781 6,270 1,511 Under 10.................. 44 40 4 8 7 1 16 15 1 19 17 2 1 1 0 10-17........................ 18,006 14,828 3,178 3,047 2,457 590 8,022 6,736 1,286 5,950 4,786 1,164 987 849 138 18-19........................ 10,860 9,295 1,565 2,154 1,754 400 5,134 4,517 617 2,973 2,516 457 599 508 91 20-29........................ 44,015 36,221 7,794 10,516 8,135 2,381 21,952 18,831 3,121 9,033 7,268 1,765 2,514 1,987 527 30-39........................ 27,467 21,925 5,542 8,332 6,308 2,024 12,189 10,257 1,932 5,173 3,989 1,184 1,773 1,371 402 40-69........................ 28,615 23,009 5,606 12,099 9,476 2,623 7,637 6,452 1,185 7,013 5,558 1,455 1,866 1,523 343 70 and over.............. 426 383 43 220 196 24 88 85 3 77 71 6 41 31 10
Homicide.................. 2,017 1,802 215 373 296 77 1,022 955 67 495 440 55 127 111 16 Under 10............... 0 0 0 0 0 0 0 0 0 0 0 0 0 0 0 10-17..................... 235 218 17 14 9 5 157 149 8 48 44 4 16 16 0 18-19..................... 335 318 17 34 28 6 190 184 6 87 84 3 24 22 2 20-29..................... 858 774 84 126 104 22 470 437 33 212 188 24 50 45 5 30-39..................... 293 245 48 64 48 16 128 115 13 78 68 10 23 14 9 40-69..................... 284 237 47 126 100 26 77 70 7 67 53 14 14 14 0 70 and over........... 12 10 2 9 7 2 0 0 0 3 3 0 0 0 0
Forcible rape............ 2,164 2,157 7 495 494 1 1,095 1,091 4 448 446 2 126 126 0 Under 10............... 0 0 0 0 0 0 0 0 0 0 0 0 0 0 0 10-17..................... 241 238 3 61 61 0 105 104 1 62 60 2 13 13 0 18-19..................... 191 190 1 47 47 0 93 92 1 42 42 0 9 9 0 20-29..................... 760 759 1 154 154 0 428 427 1 134 134 0 44 44 0 30-39..................... 507 505 2 107 106 1 285 284 1 91 91 0 24 24 0 40-69..................... 459 459 0 122 122 0 184 184 0 119 119 0 34 34 0 70 and over........... 6 6 0 4 4 0 0 0 0 0 0 0 2 2 0
Robbery.................... 21,614 18,781 2,833 3,504 2,944 560 8,425 7,513 912 8,685 7,439 1,246 1,000 885 115 Under 10............... 11 9 2 1 1 0 2 2 0 8 6 2 0 0 0 10-17..................... 6,869 5,961 908 663 583 80 2,550 2,245 305 3,309 2,821 488 347 312 35 18-19..................... 3,610 3,256 354 522 450 72 1,404 1,286 118 1,518 1,371 147 166 149 17 20-29..................... 6,711 5,913 798 1,173 997 176 3,052 2,759 293 2,186 1,886 300 300 271 29 30-39..................... 2,419 1,992 427 557 444 113 965 835 130 778 613 165 119 100 19 40-69..................... 1,985 1,642 343 585 467 118 448 382 66 884 740 144 68 53 15 70 and over........... 9 8 1 3 2 1 4 4 0 2 2 0 0 0
(continued)
0

135
Table 33 - continuedGenDer anD raCe/eTHniC GroUP of felonY arreSTeeS, 2007
By Category, Offense, and AgeCategory, offense,
and ageTotal White Hispanic Black Other
Total Male Female Total Male Female Total Male Female Total Male Female Total Male Female Assault..................... 101,838 81,386 20,452 31,612 24,284 7,328 43,629 36,545 7,084 20,172 15,498 4,674 6,425 5,059 1,366 Under 10............... 32 30 2 7 6 1 13 12 1 11 11 0 1 1 0 10-17..................... 10,575 8,345 2,230 2,304 1,801 503 5,169 4,206 963 2,502 1,839 663 600 499 101 18-19..................... 6,536 5,365 1,171 1,514 1,198 316 3,354 2,871 483 1,279 978 301 389 318 71 20-29..................... 34,904 28,072 6,832 8,922 6,770 2,152 17,585 14,818 2,767 6,323 4,896 1,427 2,074 1,588 486 30-39..................... 23,818 18,811 5,007 7,508 5,631 1,877 10,600 8,834 1,766 4,122 3,131 991 1,588 1,215 373 40-69..................... 25,576 20,406 5,170 11,154 8,696 2,458 6,824 5,723 1,101 5,863 4,577 1,286 1,735 1,410 325 70 and over........... 397 357 40 203 182 21 84 81 3 72 66 6 38 28 10
Kidnapping............... 1,800 1,575 225 392 315 77 867 789 78 438 382 56 103 89 14 Under 10............... 1 1 0 0 0 0 1 1 0 0 0 0 0 0 0 10-17..................... 86 66 20 5 3 2 41 32 9 29 22 7 11 9 2 18-19..................... 188 166 22 37 31 6 93 84 9 47 41 6 11 10 1 20-29..................... 782 703 79 141 110 31 417 390 27 178 164 14 46 39 7 30-39..................... 430 372 58 96 79 17 211 189 22 104 86 18 19 18 1 40-69..................... 311 265 46 112 91 21 104 93 11 80 69 11 15 12 3 70 and over........... 2 2 0 1 1 0 0 0 0 0 0 0 1 1 0
Property offenses........ 142,006 103,767 38,239 45,840 32,181 13,659 58,275 44,770 13,505 28,541 20,225 8,316 9,350 6,591 2,759 Under 10.................. 106 93 13 24 19 5 29 25 4 39 35 4 14 14 0 10-17........................ 25,593 20,053 5,540 6,490 4,930 1,560 11,638 9,257 2,381 5,598 4,457 1,141 1,867 1,409 458 18-19........................ 15,387 11,680 3,707 4,385 3,241 1,144 6,771 5,415 1,356 3,201 2,287 914 1,030 737 293 20-29........................ 48,626 35,042 13,584 14,426 9,845 4,581 22,562 17,394 5,168 8,311 5,460 2,851 3,327 2,343 984 30-39........................ 26,691 18,619 8,072 9,562 6,487 3,075 10,880 8,029 2,851 4,566 2,945 1,621 1,683 1,158 525 40-69........................ 25,453 18,168 7,285 10,880 7,608 3,272 6,361 4,624 1,737 6,797 5,015 1,782 1,415 921 494 70 and over.............. 150 112 38 73 51 22 34 26 8 29 26 3 14 9 5
Burglary.................... 54,316 40,337 13,979 18,032 13,094 4,938 21,552 16,494 5,058 11,074 8,142 2,932 3,658 2,607 1,051 Under 10............... 71 59 12 11 7 4 18 14 4 33 29 4 9 9 0 10-17..................... 13,869 10,864 3,005 3,759 2,868 891 5,953 4,717 1,236 3,130 2,521 609 1,027 758 269 18-19..................... 6,965 5,362 1,603 2,146 1,682 464 2,801 2,210 591 1,529 1,126 403 489 344 145 20-29..................... 17,000 12,460 4,540 5,404 3,829 1,575 7,411 5,727 1,684 3,010 2,037 973 1,175 867 308 30-39..................... 8,454 5,897 2,557 3,178 2,216 962 3,376 2,424 952 1,349 882 467 551 375 176 40-69..................... 7,916 5,668 2,248 3,510 2,478 1,032 1,986 1,397 589 2,017 1,541 476 403 252 151 70 and over........... 41 27 14 24 14 10 7 5 2 6 6 0 4 2 2
Theft......................... 51,253 36,273 14,980 17,553 12,033 5,520 19,875 14,769 5,106 10,297 7,109 3,188 3,528 2,362 1,166 Under 10............... 8 8 0 3 3 0 3 3 0 0 0 0 2 2 0 10-17..................... 6,122 4,637 1,485 1,521 1,127 394 2,721 2,117 604 1,404 1,049 355 476 344 132 18-19..................... 4,642 3,393 1,249 1,386 970 416 1,981 1,528 453 936 653 283 339 242 97 20-29..................... 17,629 12,357 5,272 5,470 3,671 1,799 7,872 5,866 2,006 3,007 1,959 1,048 1,280 861 419 30-39..................... 10,718 7,334 3,384 3,937 2,629 1,308 4,325 3,122 1,203 1,767 1,138 629 689 445 244 40-69..................... 12,050 8,481 3,569 5,198 3,605 1,593 2,953 2,119 834 3,165 2,294 871 734 463 271 70 and over........... 84 63 21 38 28 10 20 14 6 18 16 2 8 5
(continued)
3

136
Table 33 - continuedGenDer anD raCe/eTHniC GroUP of felonY arreSTeeS, 2007
By Category, Offense, and AgeCategory, offense,
and ageTotal White Hispanic Black Other
Total Male Female Total Male Female Total Male Female Total Male Female Total Male Female Identity theft.............. 1,072 607 465 344 192 152 424 242 182 211 111 100 93 62 31 Under 10............... 0 0 0 0 0 0 0 0 0 0 0 0 0 0 0 10-17..................... 21 11 10 7 3 4 9 6 3 2 0 2 3 2 1 18-19..................... 63 34 29 20 12 8 27 16 11 13 4 9 3 2 1 20-29..................... 458 256 202 133 78 55 206 116 90 73 34 39 46 28 18 30-39..................... 323 187 136 112 56 56 116 72 44 68 38 30 27 21 6 40-69..................... 206 119 87 72 43 29 66 32 34 54 35 19 14 9 5 70 and over........... 1 0 1 0 0 0 0 0 0 1 0 1 0 0 0
Motor vehicle theft.... 22,582 18,084 4,498 5,889 4,400 1,489 11,161 9,315 1,846 4,310 3,389 921 1,222 980 242 Under 10............... 2 2 0 0 0 0 1 1 0 1 1 0 0 0 0 10-17..................... 4,511 3,659 852 740 538 202 2,559 2,093 466 939 798 141 273 230 43 18-19..................... 2,788 2,307 481 581 429 152 1,578 1,362 216 487 402 85 142 114 28 20-29..................... 8,493 6,672 1,821 2,186 1,567 619 4,599 3,805 794 1,235 933 302 473 367 106 30-39..................... 4,043 3,214 829 1,310 1,018 292 1,725 1,451 274 772 555 217 236 190 46 40-69..................... 2,736 2,221 515 1,069 845 224 697 601 96 873 697 176 97 78 19 70 and over...........
Forgery, checks,
9 9 0 3 3 0 2 2 0 3 3 0 1 1 0
access cards.......... 11,405 7,262 4,143 3,368 1,879 1,489 4,820 3,555 1,265 2,466 1,338 1,128 751 490 261 Under 10............... 0 0 0 0 0 0 0 0 0 0 0 0 0 0 0 10-17..................... 363 239 124 118 75 43 159 111 48 55 31 24 31 22 9 18-19..................... 851 508 343 220 117 103 355 271 84 226 92 134 50 28 22 20-29..................... 4,846 3,128 1,718 1,147 626 521 2,394 1,808 586 961 482 479 344 212 132 30-39..................... 3,014 1,881 1,133 971 523 448 1,288 919 369 582 318 264 173 121 52 40-69..................... 2,320 1,496 824 907 534 373 620 442 178 641 414 227 152 106 46 70 and over........... 11 10 1 5 4 1 4 4 0 1 1 0 1 1 0
Arson........................ 1,378 1,204 174 654 583 71 443 395 48 183 136 47 98 90 8 Under 10............... 25 24 1 10 9 1 7 7 0 5 5 0 3 3 0 10-17..................... 707 643 64 345 319 26 237 213 24 68 58 10 57 53 4 18-19..................... 78 76 2 32 31 1 29 28 1 10 10 0 7 7 0 20-29..................... 200 169 31 86 74 12 80 72 8 25 15 10 9 8 1 30-39..................... 139 106 33 54 45 9 50 41 9 28 14 14 7 6 1 40-69..................... 225 183 42 124 103 21 39 33 6 47 34 13 15 13 2 70 and over........... 4 3 1 3 2 1 1 1 0 0 0 0 0 0 0
Drug offenses.............. 143,692 114,477 29,215 48,157 34,904 13,253 53,710 46,014 7,696 34,987 28,056 6,931 6,838 5,503 1,335 Under 10.................. 7 6 1 1 0 1 2 2 0 3 3 0 1 1 0 10-17........................ 5,492 4,634 858 1,531 1,195 336 2,400 2,099 301 1,173 1,004 169 388 336 52 18-19........................ 9,157 7,712 1,445 2,776 2,124 652 3,935 3,503 432 1,903 1,626 277 543 459 84 20-29........................ 49,245 39,884 9,361 14,346 10,353 3,993 22,998 19,944 3,054 9,086 7,345 1,741 2,815 2,242 573 30-39........................ 34,979 27,485 7,494 11,846 8,376 3,470 14,127 11,976 2,151 7,328 5,784 1,544 1,678 1,349 329 40-69........................ 44,655 34,616 10,039 17,618 12,821 4,797 10,212 8,457 1,755 15,419 12,227 3,192 1,406 1,111 295 70 and over.............. 157 140 17 39 35 4 36 33 3 75 67 8 7 5
(continued)
2

137
Table 33 - continuedGenDer anD raCe/eTHniC GroUP of felonY arreSTeeS, 2007
By Category, Offense, and AgeCategory, offense,
and ageTotal White Hispanic Black Other
Total Male Female Total Male Female Total Male Female Total Male Female Total Male Female Narcotics.................. 55,070 43,816 11,254 12,927 9,440 3,487 15,843 13,991 1,852 24,449 18,886 5,563 1,851 1,499 352 Under 10............... 4 3 1 1 0 1 0 0 0 2 2 0 1 1 0 10-17..................... 1,753 1,430 323 477 367 110 574 503 71 597 471 126 105 89 16 18-19..................... 3,058 2,563 495 908 716 192 1,003 915 88 1,007 822 185 140 110 30 20-29..................... 15,382 12,589 2,793 4,145 3,154 991 5,907 5,366 541 4,669 3,545 1,124 661 524 137 30-39..................... 12,132 9,505 2,627 2,675 1,828 847 4,146 3,638 508 4,852 3,642 1,210 459 397 62 40-69..................... 22,632 17,626 5,006 4,704 3,359 1,345 4,191 3,547 644 13,255 10,344 2,911 482 376 106 70 and over........... 109 100 9 17 16 1 22 22 0 67 60 7 3 2 1
Marijuana................. 16,124 14,572 1,552 5,095 4,441 654 4,704 4,366 338 5,258 4,796 462 1,067 969 98 Under 10............... 3 3 0 0 0 0 2 2 0 1 1 0 0 0 0 10-17..................... 2,041 1,868 173 550 480 70 877 806 71 452 430 22 162 152 10 18-19..................... 2,262 2,108 154 735 673 62 732 697 35 616 567 49 179 171 8 20-29..................... 7,068 6,401 667 2,094 1,831 263 2,121 1,979 142 2,376 2,157 219 477 434 43 30-39..................... 2,663 2,401 262 819 720 99 640 591 49 1,057 965 92 147 125 22 40-69..................... 2,074 1,779 295 891 732 159 330 289 41 753 673 80 100 85 15 70 and over........... 13 12 1 6 5 1 2 2 0 3 3 0 2 2 0
Dangerous drugs...... 71,143 55,124 16,019 29,575 20,671 8,904 32,707 27,300 5,407 4,988 4,151 837 3,873 3,002 871 Under 10............... 0 0 0 0 0 0 0 0 0 0 0 0 0 0 0 10-17..................... 1,659 1,305 354 489 338 151 935 777 158 116 96 20 119 94 25 18-19..................... 3,781 2,993 788 1,118 724 394 2,173 1,867 306 269 227 42 221 175 46 20-29..................... 26,347 20,565 5,782 7,940 5,260 2,680 14,798 12,464 2,334 1,948 1,570 378 1,661 1,271 390 30-39..................... 19,819 15,329 4,490 8,198 5,740 2,458 9,204 7,639 1,565 1,357 1,131 226 1,060 819 241 40-69..................... 19,506 14,907 4,599 11,816 8,597 3,219 5,585 4,544 1,041 1,294 1,123 171 811 643 168 70 and over........... 31 25 6 14 12 2 12 9 3 4 4 0 1 0 1
Other drugs.............. 1,355 965 390 560 352 208 456 357 99 292 223 69 47 33 14 Under 10............... 0 0 0 0 0 0 0 0 0 0 0 0 0 0 0 10-17..................... 39 31 8 15 10 5 14 13 1 8 7 1 2 1 1 18-19..................... 56 48 8 15 11 4 27 24 3 11 10 1 3 3 0 20-29..................... 448 329 119 167 108 59 172 135 37 93 73 20 16 13 3 30-39..................... 365 250 115 154 88 66 137 108 29 62 46 16 12 8 4 40-69..................... 443 304 139 207 133 74 106 77 29 117 87 30 13 7 6 70 and over........... 4 3 1 2 2 0 0 0 0 1 0 1 1 1 0
Sex offenses............... 8,745 8,415 330 2,713 2,591 122 3,949 3,846 103 1,595 1,532 63 488 446 42 Under 10.................. 16 15 1 3 2 1 5 5 0 8 8 0 0 0 0 10-17........................ 1,327 1,220 107 362 327 35 638 592 46 287 265 22 40 36 4 18-19........................ 591 572 19 143 135 8 329 323 6 88 85 3 31 29 2 20-29........................ 2,180 2,095 85 510 486 24 1,171 1,140 31 377 353 24 122 116 6 30-39........................ 1,705 1,653 52 524 501 23 795 783 12 285 277 8 101 92 9 40-69........................ 2,812 2,747 65 1,119 1,088 31 970 963 7 543 537 6 180 159 21 70 and over.............. 114 113 1 52 52 0 41 40 1 7 7 0 14 14
(continued)
0

138
Table 33 - continuedGenDer anD raCe/eTHniC GroUP of felonY arreSTeeS, 2007
By Category, Offense, and AgeCategory, offense,
and ageTotal White Hispanic Black Other
Total Male Female Total Male Female Total Male Female Total Male Female Total Male Female Lewd or lascivious.... 3,382 3,316 66 853 823 30 1,922 1,898 24 431 423 8 176 172 4 Under 10............... 11 10 1 3 2 1 3 3 0 5 5 0 0 0 0 10-17..................... 739 716 23 230 218 12 343 337 6 148 144 4 18 17 1 18-19..................... 206 203 3 41 40 1 115 114 1 35 35 0 15 14 1 20-29..................... 703 685 18 113 108 5 469 458 11 87 85 2 34 34 0 30-39..................... 714 701 13 148 142 6 466 461 5 66 65 1 34 33 1 40-69..................... 948 940 8 292 287 5 502 501 1 87 86 1 67 66 1 70 and over........... 61 61 0 26 26 0 24 24 0 3 3 0 8 8 0
Other sex.................. 5,363 5,099 264 1,860 1,768 92 2,027 1,948 79 1,164 1,109 55 312 274 38 Under 10............... 5 5 0 0 0 0 2 2 0 3 3 0 0 0 0 10-17..................... 588 504 84 132 109 23 295 255 40 139 121 18 22 19 3 18-19..................... 385 369 16 102 95 7 214 209 5 53 50 3 16 15 1 20-29..................... 1,477 1,410 67 397 378 19 702 682 20 290 268 22 88 82 6 30-39..................... 991 952 39 376 359 17 329 322 7 219 212 7 67 59 8 40-69..................... 1,864 1,807 57 827 801 26 468 462 6 456 451 5 113 93 20 70 and over........... 53 52 1 26 26 0 17 16 1 4 4 0 6 6 0
Driving offenses.......... 7,954 6,590 1,364 2,919 2,182 737 3,916 3,519 397 613 481 132 506 408 98 Under 10.................. 0 0 0 0 0 0 0 0 0 0 0 0 0 0 0 10-17........................ 155 120 35 56 43 13 73 59 14 15 10 5 11 8 3 18-19........................ 525 453 72 173 132 41 273 255 18 39 33 6 40 33 7 20-29........................ 3,187 2,692 495 993 770 223 1,774 1,588 186 214 168 46 206 166 40 30-39........................ 1,786 1,506 280 562 425 137 969 877 92 140 107 33 115 97 18 40-69........................ 2,245 1,771 474 1,098 781 317 815 730 85 202 160 42 130 100 30 70 and over..............
Driving under the
56 48 8 37 31 6 12 10 2 3 3 0 4 4 0
influence................. 6,330 5,232 1,098 2,463 1,820 643 3,004 2,729 275 471 370 101 392 313 79 Under 10............... 0 0 0 0 0 0 0 0 0 0 0 0 0 0 0 10-17..................... 73 57 16 36 30 6 27 20 7 3 2 1 7 5 2 18-19..................... 350 296 54 130 97 33 181 169 12 15 10 5 24 20 4 20-29..................... 2,511 2,106 405 825 624 201 1,364 1,226 138 159 127 32 163 129 34 30-39..................... 1,455 1,241 214 481 366 115 764 708 56 114 87 27 96 80 16 40-69..................... 1,905 1,498 407 963 677 286 665 603 62 177 141 36 100 77 23 70 and over........... 36 34 2 28 26 2 3 3 0 3 3 0 2 2 0
Hit-and-run............... 1,624 1,358 266 456 362 94 912 790 122 142 111 31 114 95 19 Under 10............... 0 0 0 0 0 0 0 0 0 0 0 0 0 0 0 10-17..................... 82 63 19 20 13 7 46 39 7 12 8 4 4 3 1 18-19..................... 175 157 18 43 35 8 92 86 6 24 23 1 16 13 3 20-29..................... 676 586 90 168 146 22 410 362 48 55 41 14 43 37 6 30-39..................... 331 265 66 81 59 22 205 169 36 26 20 6 19 17 2 40-69..................... 340 273 67 135 104 31 150 127 23 25 19 6 30 23 7 70 and over........... 20 14 6 9 5 4 9 7 2 0 0 0 2 2
(continued)
0
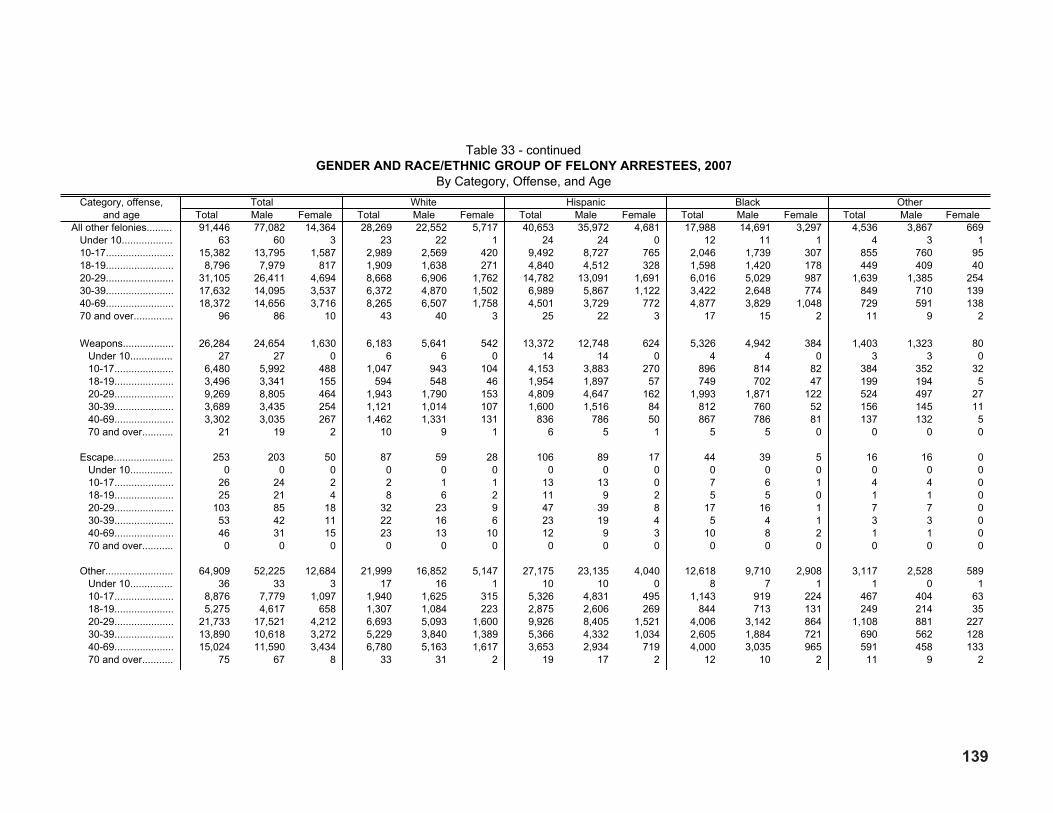
139
Table 33 - continuedGenDer anD raCe/eTHniC GroUP of felonY arreSTeeS, 2007
By Category, Offense, and AgeCategory, offense,
and ageTotal White Hispanic Black Other
Total Male Female Total Male Female Total Male Female Total Male Female Total Male Female All other felonies.......... 91,446 77,082 14,364 28,269 22,552 5,717 40,653 35,972 4,681 17,988 14,691 3,297 4,536 3,867 669 Under 10.................. 63 60 3 23 22 1 24 24 0 12 11 1 4 3 1 10-17........................ 15,382 13,795 1,587 2,989 2,569 420 9,492 8,727 765 2,046 1,739 307 855 760 95 18-19........................ 8,796 7,979 817 1,909 1,638 271 4,840 4,512 328 1,598 1,420 178 449 409 40 20-29........................ 31,105 26,411 4,694 8,668 6,906 1,762 14,782 13,091 1,691 6,016 5,029 987 1,639 1,385 254 30-39........................ 17,632 14,095 3,537 6,372 4,870 1,502 6,989 5,867 1,122 3,422 2,648 774 849 710 139 40-69........................ 18,372 14,656 3,716 8,265 6,507 1,758 4,501 3,729 772 4,877 3,829 1,048 729 591 138 70 and over.............. 96 86 10 43 40 3 25 22 3 17 15 2 11 9 2
Weapons.................. 26,284 24,654 1,630 6,183 5,641 542 13,372 12,748 624 5,326 4,942 384 1,403 1,323 80 Under 10............... 27 27 0 6 6 0 14 14 0 4 4 0 3 3 0 10-17..................... 6,480 5,992 488 1,047 943 104 4,153 3,883 270 896 814 82 384 352 32 18-19..................... 3,496 3,341 155 594 548 46 1,954 1,897 57 749 702 47 199 194 5 20-29..................... 9,269 8,805 464 1,943 1,790 153 4,809 4,647 162 1,993 1,871 122 524 497 27 30-39..................... 3,689 3,435 254 1,121 1,014 107 1,600 1,516 84 812 760 52 156 145 11 40-69..................... 3,302 3,035 267 1,462 1,331 131 836 786 50 867 786 81 137 132 5 70 and over........... 21 19 2 10 9 1 6 5 1 5 5 0 0 0 0
Escape..................... 253 203 50 87 59 28 106 89 17 44 39 5 16 16 0 Under 10............... 0 0 0 0 0 0 0 0 0 0 0 0 0 0 0 10-17..................... 26 24 2 2 1 1 13 13 0 7 6 1 4 4 0 18-19..................... 25 21 4 8 6 2 11 9 2 5 5 0 1 1 0 20-29..................... 103 85 18 32 23 9 47 39 8 17 16 1 7 7 0 30-39..................... 53 42 11 22 16 6 23 19 4 5 4 1 3 3 0 40-69..................... 46 31 15 23 13 10 12 9 3 10 8 2 1 1 0 70 and over........... 0 0 0 0 0 0 0 0 0 0 0 0 0 0 0
Other........................ 64,909 52,225 12,684 21,999 16,852 5,147 27,175 23,135 4,040 12,618 9,710 2,908 3,117 2,528 589 Under 10............... 36 33 3 17 16 1 10 10 0 8 7 1 1 0 1 10-17..................... 8,876 7,779 1,097 1,940 1,625 315 5,326 4,831 495 1,143 919 224 467 404 63 18-19..................... 5,275 4,617 658 1,307 1,084 223 2,875 2,606 269 844 713 131 249 214 35 20-29..................... 21,733 17,521 4,212 6,693 5,093 1,600 9,926 8,405 1,521 4,006 3,142 864 1,108 881 227 30-39..................... 13,890 10,618 3,272 5,229 3,840 1,389 5,366 4,332 1,034 2,605 1,884 721 690 562 128 40-69..................... 15,024 11,590 3,434 6,780 5,163 1,617 3,653 2,934 719 4,000 3,035 965 591 458 133 70 and over........... 75 67 8 33 31 2 19 17 2 12 10 2 11 9 2

140
Table 34GenDer anD raCe/eTHniC GroUP of miSDemeanor arreSTeeS, 2007
By Offense
OffenseNumber Percent
Total Gender Race/ethnic group Total Gender Race/ethnic groupMale Female White Hispanic Black Other Male Female White Hispanic Black Other
Total........................................... 992,588 776,979 215,609 381,874 403,057 146,023 61,634 100.0 78.3 21.7 38.5 40.6 14.7 6.2
Assault and battery.................. 91,150 69,210 21,940 30,176 37,316 17,898 5,760 100.0 75.9 24.1 33.1 40.9 19.6 6.3 Burglary................................... 623 446 177 222 236 111 54 100.0 71.6 28.4 35.6 37.9 17.8 8.7 Petty theft................................ 63,134 33,964 29,170 20,188 26,162 10,560 6,224 100.0 53.8 46.2 32.0 41.4 16.7 9.9 Checks and access cards....... 891 496 395 330 244 173 144 100.0 55.7 44.3 37.0 27.4 19.4 16.2 Marijuana................................. 57,995 51,032 6,963 22,153 21,380 11,019 3,443 100.0 88.0 12.0 38.2 36.9 19.0 5.9
Other drug............................... 91,646 67,413 24,233 38,542 33,445 15,334 4,325 100.0 73.6 26.4 42.1 36.5 16.7 4.7 Indecent exposure................... 1,423 1,318 105 612 496 239 76 100.0 92.6 7.4 43.0 34.9 16.8 5.3 Annoying children.................... 907 818 89 274 467 104 62 100.0 90.2 9.8 30.2 51.5 11.5 6.8 Obscene matter....................... 97 82 15 57 22 13 5 100.0 84.5 15.5 58.8 22.7 13.4 5.2 Lewd conduct.......................... 4,059 2,511 1,548 1,437 1,110 1,291 221 100.0 61.9 38.1 35.4 27.3 31.8 5.4
Prostitution.............................. 12,540 3,872 8,668 3,030 3,048 5,209 1,253 100.0 30.9 69.1 24.2 24.3 41.5 10.0 Drunk....................................... 115,239 98,408 16,831 56,807 42,645 9,857 5,930 100.0 85.4 14.6 49.3 37.0 8.6 5.1 Liquor laws.............................. 21,349 16,279 5,070 10,637 7,433 1,505 1,774 100.0 76.3 23.7 49.8 34.8 7.0 8.3 Disturbing the peace............... 16,759 11,396 5,363 3,758 8,467 3,490 1,044 100.0 68.0 32.0 22.4 50.5 20.8 6.2 Malicious mischief................... 18,993 16,544 2,449 5,284 10,408 2,268 1,033 100.0 87.1 12.9 27.8 54.8 11.9 5.4
Trespassing............................. 17,150 13,907 3,243 7,261 5,609 3,380 900 100.0 81.1 18.9 42.3 32.7 19.7 5.2 Weapons................................. 6,344 5,782 562 2,065 2,873 984 422 100.0 91.1 8.9 32.6 45.3 15.5 6.7 Driving under the influence...... 199,866 162,172 37,694 79,783 91,562 14,394 14,127 100.0 81.1 18.9 39.9 45.8 7.2 7.1 Hit-and-run.............................. 7,124 5,598 1,526 2,377 3,676 498 573 100.0 78.6 21.4 33.4 51.6 7.0 8.0 Selected traffic violations......... 22,597 19,374 3,223 8,380 9,152 3,485 1,580 100.0 85.7 14.3 37.1 40.5 15.4 7.0
Gambling................................. 686 648 38 8 462 156 60 100.0 94.5 5.5 1.2 67.3 22.7 8.7 All other................................... 242,016 195,709 46,307 88,493 96,844 44,055 12,624 100.0 80.9 19.1 36.6 40.0 18.2 5.2Note: Percentages may not add to 100.0 because of rounding.

141
Table 35aGe of miSDemeanor arreSTeeS, 2007
By Offense
OffenseNumber Percent
Total Under 18 18-19 20-29 30-3940 andover Total Under 18 18-19 20-29 30-39
40 andover
Total............................................ 992,588 134,629 78,055 327,069 185,981 266,854 100.0 13.6 7.9 33.0 18.7 26.9
Assault and battery.................. 91,150 22,337 6,066 26,409 16,654 19,684 100.0 24.5 6.7 29.0 18.3 21.6 Burglary................................... 623 291 61 138 71 62 100.0 46.7 9.8 22.2 11.4 10.0 Petty theft................................ 63,134 24,183 7,800 14,401 6,964 9,786 100.0 38.3 12.4 22.8 11.0 15.5 Checks and access cards........ 891 119 50 344 199 179 100.0 13.4 5.6 38.6 22.3 20.1 Marijuana................................. 57,995 14,576 10,257 21,676 6,170 5,316 100.0 25.1 17.7 37.4 10.6 9.2
Other drug............................... 91,646 2,283 5,274 30,338 23,348 30,403 100.0 2.5 5.8 33.1 25.5 33.2 Indecent exposure................... 1,423 131 45 352 299 596 100.0 9.2 3.2 24.7 21.0 41.9 Annoying children.................... 907 211 131 221 130 214 100.0 23.3 14.4 24.4 14.3 23.6 Obscene matter....................... 97 30 5 15 15 32 100.0 30.9 5.2 15.5 15.5 33.0 Lewd conduct.......................... 4,059 341 398 1,180 815 1,325 100.0 8.4 9.8 29.1 20.1 32.6
Prostitution............................... 12,540 570 1,935 4,945 2,302 2,788 100.0 4.5 15.4 39.4 18.4 22.2 Drunk....................................... 115,239 4,670 6,931 37,334 22,408 43,896 100.0 4.1 6.0 32.4 19.4 38.1 Liquor laws.............................. 21,349 5,643 6,515 4,831 1,407 2,953 100.0 26.4 30.5 22.6 6.6 13.8 Disturbing the peace................ 16,759 11,927 786 2,069 797 1,180 100.0 71.2 4.7 12.3 4.8 7.0 Malicious mischief................... 18,993 11,506 1,754 3,137 1,216 1,380 100.0 60.6 9.2 16.5 6.4 7.3
Trespassing............................. 17,150 3,702 1,466 3,733 2,682 5,567 100.0 21.6 8.5 21.8 15.6 32.5 Weapons................................. 6,344 2,065 893 2,021 660 705 100.0 32.6 14.1 31.9 10.4 11.1 Driving under the influence...... 199,866 1,570 9,876 88,280 46,098 54,042 100.0 0.8 4.9 44.2 23.1 27.0 Hit-and-run............................... 7,124 574 827 2,800 1,297 1,626 100.0 8.1 11.6 39.3 18.2 22.8 Selected traffic violations......... 22,597 737 2,363 9,955 4,679 4,863 100.0 3.3 10.5 44.1 20.7 21.5
Gambling................................. 686 76 27 120 117 346 100.0 11.1 3.9 17.5 17.1 50.4 All other................................... 242,016 27,087 14,595 72,770 47,653 79,911 100.0 11.2 6.0 30.1 19.7 33.0Note: Percentages may not add to 100.0 because of rounding.
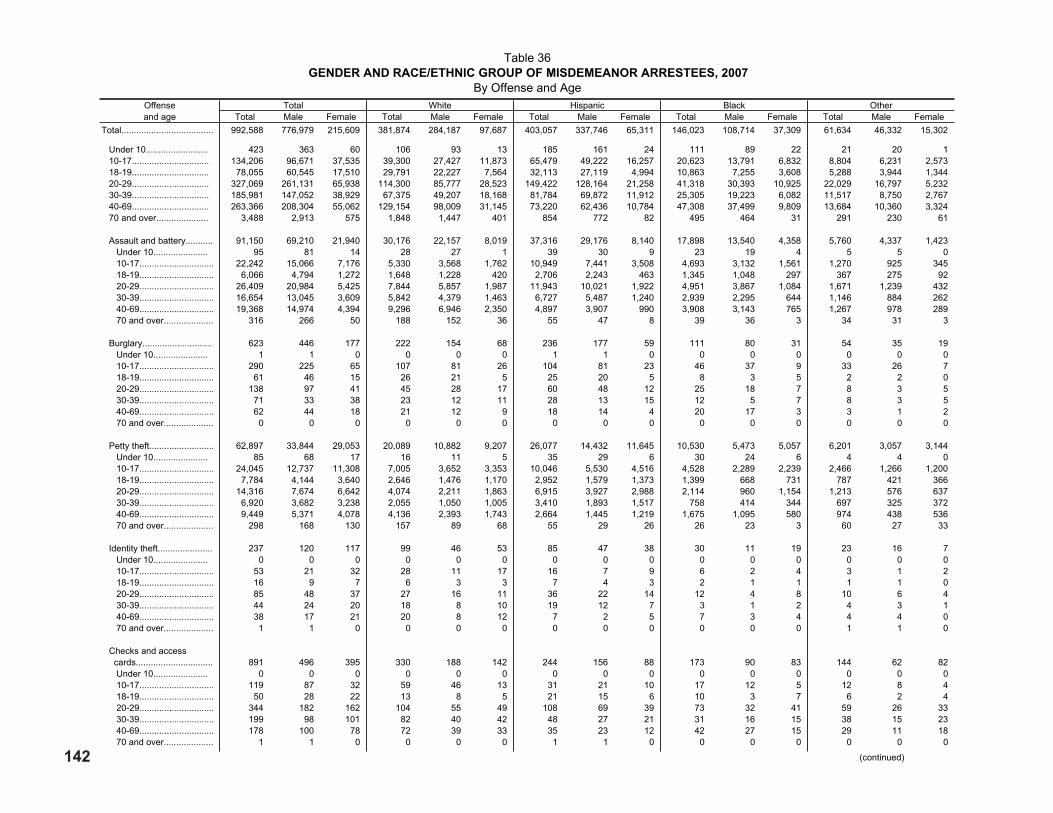
142
Table 36GenDer anD raCe/eTHniC GroUP of miSDemeanor arreSTeeS, 2007
By Offense and AgeOffenseand age
Total White Hispanic Black OtherTotal Male Female Total Male Female Total Male Female Total Male Female Total Male Female
Total..................................... 992,588 776,979 215,609 381,874 284,187 97,687 403,057 337,746 65,311 146,023 108,714 37,309 61,634 46,332 15,302
Under 10......................... 423 363 60 106 93 13 185 161 24 111 89 22 21 20 1 10-17............................... 134,206 96,671 37,535 39,300 27,427 11,873 65,479 49,222 16,257 20,623 13,791 6,832 8,804 6,231 2,573 18-19............................... 78,055 60,545 17,510 29,791 22,227 7,564 32,113 27,119 4,994 10,863 7,255 3,608 5,288 3,944 1,344 20-29............................... 327,069 261,131 65,938 114,300 85,777 28,523 149,422 128,164 21,258 41,318 30,393 10,925 22,029 16,797 5,232 30-39............................... 185,981 147,052 38,929 67,375 49,207 18,168 81,784 69,872 11,912 25,305 19,223 6,082 11,517 8,750 2,767 40-69............................... 263,366 208,304 55,062 129,154 98,009 31,145 73,220 62,436 10,784 47,308 37,499 9,809 13,684 10,360 3,324 70 and over..................... 3,488 2,913 575 1,848 1,447 401 854 772 82 495 464 31 291 230 61
Assault and battery........... 91,150 69,210 21,940 30,176 22,157 8,019 37,316 29,176 8,140 17,898 13,540 4,358 5,760 4,337 1,423 Under 10...................... 95 81 14 28 27 1 39 30 9 23 19 4 5 5 0 10-17.............................. 22,242 15,066 7,176 5,330 3,568 1,762 10,949 7,441 3,508 4,693 3,132 1,561 1,270 925 345 18-19.............................. 6,066 4,794 1,272 1,648 1,228 420 2,706 2,243 463 1,345 1,048 297 367 275 92 20-29.............................. 26,409 20,984 5,425 7,844 5,857 1,987 11,943 10,021 1,922 4,951 3,867 1,084 1,671 1,239 432 30-39.............................. 16,654 13,045 3,609 5,842 4,379 1,463 6,727 5,487 1,240 2,939 2,295 644 1,146 884 262 40-69.............................. 19,368 14,974 4,394 9,296 6,946 2,350 4,897 3,907 990 3,908 3,143 765 1,267 978 289 70 and over.................... 316 266 50 188 152 36 55 47 8 39 36 3 34 31 3
Burglary............................ 623 446 177 222 154 68 236 177 59 111 80 31 54 35 19 Under 10...................... 1 1 0 0 0 0 1 1 0 0 0 0 0 0 0 10-17.............................. 290 225 65 107 81 26 104 81 23 46 37 9 33 26 7 18-19.............................. 61 46 15 26 21 5 25 20 5 8 3 5 2 2 0 20-29.............................. 138 97 41 45 28 17 60 48 12 25 18 7 8 3 5 30-39.............................. 71 33 38 23 12 11 28 13 15 12 5 7 8 3 5 40-69.............................. 62 44 18 21 12 9 18 14 4 20 17 3 3 1 2 70 and over.................... 0 0 0 0 0 0 0 0 0 0 0 0 0 0 0
Petty theft.......................... 62,897 33,844 29,053 20,089 10,882 9,207 26,077 14,432 11,645 10,530 5,473 5,057 6,201 3,057 3,144 Under 10...................... 85 68 17 16 11 5 35 29 6 30 24 6 4 4 0 10-17.............................. 24,045 12,737 11,308 7,005 3,652 3,353 10,046 5,530 4,516 4,528 2,289 2,239 2,466 1,266 1,200 18-19.............................. 7,784 4,144 3,640 2,646 1,476 1,170 2,952 1,579 1,373 1,399 668 731 787 421 366 20-29.............................. 14,316 7,674 6,642 4,074 2,211 1,863 6,915 3,927 2,988 2,114 960 1,154 1,213 576 637 30-39.............................. 6,920 3,682 3,238 2,055 1,050 1,005 3,410 1,893 1,517 758 414 344 697 325 372 40-69.............................. 9,449 5,371 4,078 4,136 2,393 1,743 2,664 1,445 1,219 1,675 1,095 580 974 438 536 70 and over.................... 298 168 130 157 89 68 55 29 26 26 23 3 60 27 33
Identity theft...................... 237 120 117 99 46 53 85 47 38 30 11 19 23 16 7 Under 10...................... 0 0 0 0 0 0 0 0 0 0 0 0 0 0 0 10-17.............................. 53 21 32 28 11 17 16 7 9 6 2 4 3 1 2 18-19.............................. 16 9 7 6 3 3 7 4 3 2 1 1 1 1 0 20-29.............................. 85 48 37 27 16 11 36 22 14 12 4 8 10 6 4 30-39.............................. 44 24 20 18 8 10 19 12 7 3 1 2 4 3 1 40-69.............................. 38 17 21 20 8 12 7 2 5 7 3 4 4 4 0 70 and over....................
Checks and access
1 1 0 0 0 0 0 0 0 0 0 0 1 1 0
cards............................... 891 496 395 330 188 142 244 156 88 173 90 83 144 62 82 Under 10...................... 0 0 0 0 0 0 0 0 0 0 0 0 0 0 0 10-17.............................. 119 87 32 59 46 13 31 21 10 17 12 5 12 8 4 18-19.............................. 50 28 22 13 8 5 21 15 6 10 3 7 6 2 4 20-29.............................. 344 182 162 104 55 49 108 69 39 73 32 41 59 26 33 30-39.............................. 199 98 101 82 40 42 48 27 21 31 16 15 38 15 23 40-69.............................. 178 100 78 72 39 33 35 23 12 42 27 15 29 11 18 70 and over.................... 1 1 0 0 0 0 1 1 0 0 0 0 0 0
(continued)
0

143
Table 36 - continuedGenDer anD raCe/eTHniC GroUP of miSDemeanor arreSTeeS, 2007
By Offense and AgeOffenseand age
Total White Hispanic Black OtherTotal Male Female Total Male Female Total Male Female Total Male Female Total Male Female
Drug offenses.................... 149,641 118,445 31,196 60,695 44,616 16,079 54,825 46,502 8,323 26,353 21,049 5,304 7,768 6,278 1,490 Under 10...................... 17 15 2 7 6 1 6 6 0 4 3 1 0 0 0 10-17.............................. 16,842 14,169 2,673 5,979 4,679 1,300 8,096 7,073 1,023 1,956 1,719 237 811 698 113 18-19.............................. 15,531 13,020 2,511 6,321 4,940 1,381 6,272 5,559 713 1,918 1,659 259 1,020 862 158 20-29.............................. 52,014 41,622 10,392 19,709 14,540 5,169 22,102 18,817 3,285 7,116 5,797 1,319 3,087 2,468 619 30-39.............................. 29,518 22,387 7,131 12,527 8,772 3,755 10,357 8,531 1,826 5,087 3,855 1,232 1,547 1,229 318 40-69.............................. 35,628 27,150 8,478 16,124 11,657 4,467 7,970 6,496 1,474 10,236 7,981 2,255 1,298 1,016 282 70 and over.................... 91 82 9 28 22 6 22 20 2 36 35 1 5 5 0
Marijuana....................... 57,995 51,032 6,963 22,153 18,711 3,442 21,380 19,473 1,907 11,019 9,797 1,222 3,443 3,051 392 Under 10.................. 16 14 2 6 5 1 6 6 0 4 3 1 0 0 0 10-17........................ 14,560 12,582 1,978 5,063 4,148 915 6,980 6,196 784 1,810 1,614 196 707 624 83 18-19........................ 10,257 9,119 1,138 4,175 3,557 618 3,733 3,451 282 1,595 1,439 156 754 672 82 20-29........................ 21,676 19,292 2,384 7,716 6,642 1,074 7,911 7,287 624 4,541 4,019 522 1,508 1,344 164 30-39........................ 6,170 5,411 759 2,384 2,003 381 1,766 1,628 138 1,727 1,523 204 293 257 36 40-69........................ 5,296 4,594 702 2,797 2,344 453 983 904 79 1,336 1,193 143 180 153 27 70 and over.............. 20 20 0 12 12 0 1 1 0 6 6 0 1 1 0
Other drug...................... 91,646 67,413 24,233 38,542 25,905 12,637 33,445 27,029 6,416 15,334 11,252 4,082 4,325 3,227 1,098 Under 10.................. 1 1 0 1 1 0 0 0 0 0 0 0 0 0 0 10-17........................ 2,282 1,587 695 916 531 385 1,116 877 239 146 105 41 104 74 30 18-19........................ 5,274 3,901 1,373 2,146 1,383 763 2,539 2,108 431 323 220 103 266 190 76 20-29........................ 30,338 22,330 8,008 11,993 7,898 4,095 14,191 11,530 2,661 2,575 1,778 797 1,579 1,124 455 30-39........................ 23,348 16,976 6,372 10,143 6,769 3,374 8,591 6,903 1,688 3,360 2,332 1,028 1,254 972 282 40-69........................ 30,332 22,556 7,776 13,327 9,313 4,014 6,987 5,592 1,395 8,900 6,788 2,112 1,118 863 255 70 and over.............. 71 62 9 16 10 6 21 19 2 30 29 1 4 4 0
Indecent exposure............ 1,423 1,318 105 612 555 57 496 479 17 239 214 25 76 70 6 Under 10...................... 0 0 0 0 0 0 0 0 0 0 0 0 0 0 0 10-17.............................. 131 123 8 66 62 4 41 38 3 18 17 1 6 6 0 18-19.............................. 45 40 5 19 17 2 19 18 1 7 5 2 0 0 0 20-29.............................. 352 325 27 122 111 11 159 156 3 50 40 10 21 18 3 30-39.............................. 299 278 21 100 88 12 127 124 3 54 49 5 18 17 1 40-69.............................. 573 529 44 292 264 28 144 137 7 108 101 7 29 27 2 70 and over.................... 23 23 0 13 13 0 6 6 0 2 2 0 2 2 0
Annoying children............. 907 818 89 274 251 23 467 422 45 104 95 9 62 50 12 Under 10...................... 1 1 0 0 0 0 1 1 0 0 0 0 0 0 0 10-17.............................. 210 142 68 46 32 14 122 84 38 24 17 7 18 9 9 18-19.............................. 131 123 8 41 38 3 68 65 3 15 15 0 7 5 2 20-29.............................. 221 216 5 53 52 1 135 133 2 22 20 2 11 11 0 30-39.............................. 130 129 1 38 38 0 66 65 1 17 17 0 9 9 0 40-69.............................. 206 199 7 91 86 5 72 71 1 26 26 0 17 16 1 70 and over.................... 8 8 0 5 5 0 3 3 0 0 0 0 0 0 0
Obscene matter................ 97 82 15 57 51 6 22 20 2 13 7 6 5 4 1 Under 10...................... 0 0 0 0 0 0 0 0 0 0 0 0 0 0 0 10-17.............................. 30 17 13 13 7 6 10 8 2 6 1 5 1 1 0 18-19.............................. 5 5 0 0 0 0 3 3 0 2 2 0 0 0 0 20-29.............................. 15 14 1 10 10 0 1 1 0 4 3 1 0 0 0 30-39.............................. 15 14 1 7 7 0 5 5 0 1 1 0 2 1 1 40-69.............................. 31 31 0 26 26 0 3 3 0 0 0 0 2 2 0 70 and over.................... 1 1 0 1 1 0 0 0 0 0 0 0 0 0
(continued)
0

144
Table 36 - continuedGenDer anD raCe/eTHniC GroUP of miSDemeanor arreSTeeS, 2007
By Offense and AgeOffenseand age
Total White Hispanic Black OtherTotal Male Female Total Male Female Total Male Female Total Male Female Total Male Female
Lewd conduct.................... 4,059 2,511 1,548 1,437 1,015 422 1,110 929 181 1,291 408 883 221 159 62 Under 10...................... 0 0 0 0 0 0 0 0 0 0 0 0 0 0 0 10-17.............................. 341 210 131 68 47 21 123 102 21 125 43 82 25 18 7 18-19.............................. 398 113 285 83 36 47 72 51 21 210 11 199 33 15 18 20-29.............................. 1,180 640 540 330 211 119 364 296 68 421 89 332 65 44 21 30-39.............................. 815 564 251 282 201 81 272 238 34 219 89 130 42 36 6 40-69.............................. 1,302 962 340 656 502 154 276 239 37 315 175 140 55 46 9 70 and over.................... 23 22 1 18 18 0 3 3 0 1 1 0 1 0 1
Prostitution........................ 12,540 3,872 8,668 3,030 831 2,199 3,048 2,068 980 5,209 525 4,684 1,253 448 805 Under 10...................... 0 0 0 0 0 0 0 0 0 0 0 0 0 0 0 10-17.............................. 570 53 517 104 12 92 75 23 52 372 14 358 19 4 15 18-19.............................. 1,935 160 1,775 355 27 328 258 98 160 1,228 23 1,205 94 12 82 20-29.............................. 4,945 1,390 3,555 1,091 216 875 1,225 857 368 2,329 197 2,132 300 120 180 30-39.............................. 2,302 1,115 1,187 579 185 394 815 647 168 570 141 429 338 142 196 40-69.............................. 2,765 1,132 1,633 890 380 510 670 438 232 708 148 560 497 166 331 70 and over.................... 23 22 1 11 11 0 5 5 0 2 2 0 5 4 1
Drunk................................ 115,239 98,408 16,831 56,807 46,334 10,473 42,645 38,719 3,926 9,857 8,320 1,537 5,930 5,035 895 Under 10...................... 3 3 0 2 2 0 1 1 0 0 0 0 0 0 0 10-17.............................. 4,667 3,417 1,250 2,034 1,379 655 2,107 1,617 490 232 192 40 294 229 65 18-19.............................. 6,931 5,955 976 3,204 2,634 570 2,920 2,629 291 423 370 53 384 322 62 20-29.............................. 37,334 32,826 4,508 16,390 13,872 2,518 15,830 14,532 1,298 2,730 2,369 361 2,384 2,053 331 30-39.............................. 22,408 19,212 3,196 9,557 7,639 1,918 9,762 9,011 751 1,927 1,583 344 1,162 979 183 40-69.............................. 43,487 36,619 6,868 25,431 20,647 4,784 11,874 10,782 1,092 4,501 3,763 738 1,681 1,427 254 70 and over.................... 409 376 33 189 161 28 151 147 4 44 43 1 25 25 0
Liquor laws........................ 21,349 16,279 5,070 10,637 7,707 2,930 7,433 6,092 1,341 1,505 1,212 293 1,774 1,268 506 Under 10...................... 7 5 2 4 3 1 3 2 1 0 0 0 0 0 0 10-17.............................. 5,636 4,009 1,627 2,851 1,904 947 2,176 1,665 511 272 204 68 337 236 101 18-19.............................. 6,515 5,015 1,500 3,844 2,815 1,029 1,916 1,621 295 267 220 47 488 359 129 20-29.............................. 4,831 3,744 1,087 2,307 1,703 604 1,723 1,428 295 299 250 49 502 363 139 30-39.............................. 1,407 1,133 274 428 336 92 688 569 119 149 121 28 142 107 35 40-69.............................. 2,911 2,336 575 1,185 931 254 915 795 120 512 411 101 299 199 100 70 and over.................... 42 37 5 18 15 3 12 12 0 6 6 0 6 4 2
Disorderly conduct............ 4,047 3,313 734 2,361 1,888 473 842 739 103 684 564 120 160 122 38 Under 10...................... 0 0 0 0 0 0 0 0 0 0 0 0 0 0 0 10-17.............................. 313 271 42 113 95 18 129 114 15 56 48 8 15 14 1 18-19.............................. 303 248 55 152 119 33 84 77 7 52 38 14 15 14 1 20-29.............................. 807 672 135 419 331 88 217 207 10 130 106 24 41 28 13 30-39.............................. 675 536 139 395 303 92 151 128 23 94 78 16 35 27 8 40-69.............................. 1,931 1,570 361 1,267 1,027 240 259 211 48 351 293 58 54 39 15 70 and over.................... 18 16 2 15 13 2 2 2 0 1 1 0 0 0 0
Disturbing the peace......... 16,759 11,396 5,363 3,758 2,795 963 8,467 5,634 2,833 3,490 2,222 1,268 1,044 745 299 Under 10...................... 37 28 9 5 3 2 12 11 1 18 12 6 2 2 0 10-17.............................. 11,890 7,557 4,333 1,741 1,232 509 6,723 4,214 2,509 2,717 1,636 1,081 709 475 234 18-19.............................. 786 634 152 214 157 57 350 307 43 163 119 44 59 51 8 20-29.............................. 2,069 1,687 382 815 666 149 801 659 142 297 236 61 156 126 30 30-39.............................. 797 613 184 311 248 63 311 241 70 115 80 35 60 44 16 40-69.............................. 1,159 862 297 661 481 180 266 199 67 176 136 40 56 46 10 70 and over.................... 21 15 6 11 8 3 4 3 1 4 3 1 2 1
(continued)
1

145
Table 36 - continuedGenDer anD raCe/eTHniC GroUP of miSDemeanor arreSTeeS, 2007
By Offense and AgeOffenseand age
Total White Hispanic Black OtherTotal Male Female Total Male Female Total Male Female Total Male Female Total Male Female
Malicious mischief............. 18,993 16,544 2,449 5,284 4,456 828 10,408 9,459 949 2,268 1,734 534 1,033 895 138 Under 10...................... 93 84 9 28 25 3 46 43 3 14 12 2 5 4 1 10-17.............................. 11,413 10,147 1,266 2,493 2,135 358 7,304 6,667 637 1,025 821 204 591 524 67 18-19.............................. 1,754 1,574 180 487 426 61 1,003 940 63 175 133 42 89 75 14 20-29.............................. 3,137 2,685 452 1,060 911 149 1,370 1,237 133 521 378 143 186 159 27 30-39.............................. 1,216 968 248 502 398 104 406 340 66 228 164 64 80 66 14 40-69.............................. 1,360 1,069 291 703 551 152 276 229 47 305 226 79 76 63 13 70 and over.................... 20 17 3 11 10 1 3 3 0 0 0 0 6 4 2
Trespassing...................... 17,150 13,907 3,243 7,261 5,607 1,654 5,609 4,796 813 3,380 2,768 612 900 736 164 Under 10...................... 16 14 2 3 3 0 4 4 0 8 6 2 1 1 0 10-17.............................. 3,686 2,999 687 1,173 906 267 1,705 1,409 296 632 530 102 176 154 22 18-19.............................. 1,466 1,256 210 568 465 103 515 463 52 302 262 40 81 66 15 20-29.............................. 3,733 3,092 641 1,468 1,152 316 1,334 1,164 170 728 614 114 203 162 41 30-39.............................. 2,682 2,134 548 1,082 825 257 898 765 133 532 407 125 170 137 33 40-69.............................. 5,472 4,333 1,139 2,903 2,206 697 1,139 977 162 1,172 944 228 258 206 52 70 and over.................... 95 79 16 64 50 14 14 14 0 6 5 1 11 10 1
Weapons........................... 6,344 5,782 562 2,065 1,848 217 2,873 2,661 212 984 894 90 422 379 43 Under 10...................... 7 7 0 2 2 0 3 3 0 2 2 0 0 0 0 10-17.............................. 2,058 1,862 196 558 493 65 1,104 1,011 93 264 236 28 132 122 10 18-19.............................. 893 825 68 242 219 23 455 423 32 135 125 10 61 58 3 20-29.............................. 2,021 1,850 171 613 544 69 897 845 52 355 324 31 156 137 19 30-39.............................. 660 594 66 260 232 28 252 229 23 115 105 10 33 28 5 40-69.............................. 685 624 61 379 347 32 159 147 12 109 98 11 38 32 6 70 and over....................
Driving under the
20 20 0 11 11 0 3 3 0 4 4 0 2 2 0
influence.......................... 199,866 162,172 37,694 79,783 57,895 21,888 91,562 81,778 9,784 14,394 11,434 2,960 14,127 11,065 3,062 Under 10...................... 1 1 0 0 0 0 0 0 0 1 1 0 0 0 0 10-17.............................. 1,569 1,185 384 894 595 299 560 496 64 42 39 3 73 55 18 18-19.............................. 9,876 8,001 1,875 4,252 3,168 1,084 4,558 4,010 548 404 323 81 662 500 162 20-29.............................. 88,280 71,605 16,675 31,590 22,879 8,711 44,506 39,424 5,082 5,179 4,042 1,137 7,005 5,260 1,745 30-39.............................. 46,098 38,318 7,780 15,153 11,024 4,129 23,956 21,698 2,258 3,737 2,970 767 3,252 2,626 626 40-69.............................. 53,117 42,291 10,826 27,266 19,730 7,536 17,808 15,991 1,817 4,951 3,986 965 3,092 2,584 508 70 and over.................... 925 771 154 628 499 129 174 159 15 80 73 7 43 40 3
Glue sniffing...................... 1,439 1,238 201 507 400 107 778 705 73 84 71 13 70 62 8 Under 10...................... 0 0 0 0 0 0 0 0 0 0 0 0 0 0 0 10-17.............................. 246 203 43 34 25 9 200 168 32 7 6 1 5 4 1 18-19.............................. 183 164 19 42 33 9 133 123 10 4 4 0 4 4 0 20-29.............................. 380 343 37 136 116 20 194 182 12 31 27 4 19 18 1 30-39.............................. 223 180 43 91 58 33 101 93 8 14 12 2 17 17 0 40-69.............................. 398 339 59 202 166 36 150 139 11 28 22 6 18 12 6 70 and over.................... 9 9 0 2 2 0 0 0 0 0 0 0 7 7 0
Hit-and-run........................ 7,124 5,598 1,526 2,377 1,730 647 3,676 3,095 581 498 362 136 573 411 162 Under 10...................... 0 0 0 0 0 0 0 0 0 0 0 0 0 0 0 10-17.............................. 574 427 147 177 120 57 304 245 59 39 30 9 54 32 22 18-19.............................. 827 667 160 252 194 58 457 384 73 62 48 14 56 41 15 20-29.............................. 2,800 2,276 524 748 563 185 1,646 1,418 228 208 148 60 198 147 51 30-39.............................. 1,297 1,004 293 393 285 108 734 602 132 79 55 24 91 62 29 40-69.............................. 1,517 1,150 367 733 523 210 519 431 88 108 79 29 157 117 40 70 and over.................... 109 74 35 74 45 29 16 15 1 2 2 0 17 12
(continued)
5
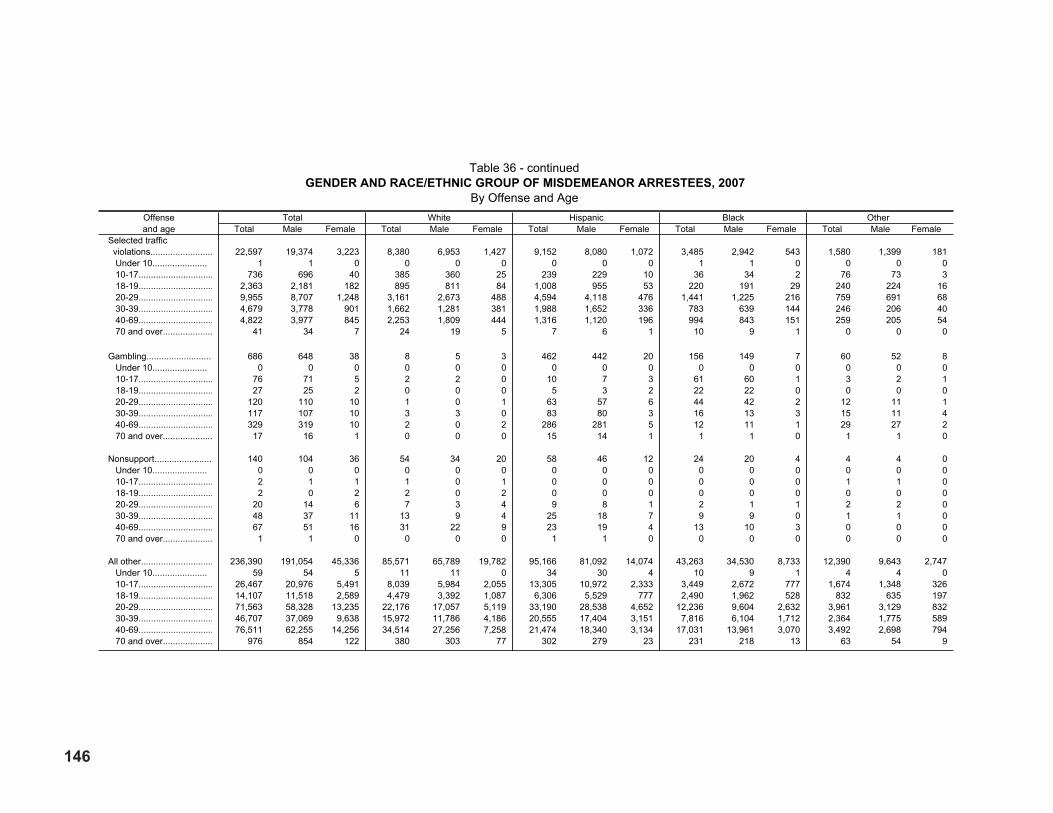
146
Table 36 - continuedGenDer anD raCe/eTHniC GroUP of miSDemeanor arreSTeeS, 2007
By Offense and AgeOffenseand age
Total White Hispanic Black OtherTotal Male Female Total Male Female Total Male Female Total Male Female Total Male Female
Selected traffic violations......................... 22,597 19,374 3,223 8,380 6,953 1,427 9,152 8,080 1,072 3,485 2,942 543 1,580 1,399 181 Under 10...................... 1 1 0 0 0 0 0 0 0 1 1 0 0 0 0 10-17.............................. 736 696 40 385 360 25 239 229 10 36 34 2 76 73 3 18-19.............................. 2,363 2,181 182 895 811 84 1,008 955 53 220 191 29 240 224 16 20-29.............................. 9,955 8,707 1,248 3,161 2,673 488 4,594 4,118 476 1,441 1,225 216 759 691 68 30-39.............................. 4,679 3,778 901 1,662 1,281 381 1,988 1,652 336 783 639 144 246 206 40 40-69.............................. 4,822 3,977 845 2,253 1,809 444 1,316 1,120 196 994 843 151 259 205 54 70 and over.................... 41 34 7 24 19 5 7 6 1 10 9 1 0 0 0
Gambling........................... 686 648 38 8 5 3 462 442 20 156 149 7 60 52 8 Under 10...................... 0 0 0 0 0 0 0 0 0 0 0 0 0 0 0 10-17.............................. 76 71 5 2 2 0 10 7 3 61 60 1 3 2 1 18-19.............................. 27 25 2 0 0 0 5 3 2 22 22 0 0 0 0 20-29.............................. 120 110 10 1 0 1 63 57 6 44 42 2 12 11 1 30-39.............................. 117 107 10 3 3 0 83 80 3 16 13 3 15 11 4 40-69.............................. 329 319 10 2 0 2 286 281 5 12 11 1 29 27 2 70 and over.................... 17 16 1 0 0 0 15 14 1 1 1 0 1 1 0
Nonsupport....................... 140 104 36 54 34 20 58 46 12 24 20 4 4 4 0 Under 10...................... 0 0 0 0 0 0 0 0 0 0 0 0 0 0 0 10-17.............................. 2 1 1 1 0 1 0 0 0 0 0 0 1 1 0 18-19.............................. 2 0 2 2 0 2 0 0 0 0 0 0 0 0 0 20-29.............................. 20 14 6 7 3 4 9 8 1 2 1 1 2 2 0 30-39.............................. 48 37 11 13 9 4 25 18 7 9 9 0 1 1 0 40-69.............................. 67 51 16 31 22 9 23 19 4 13 10 3 0 0 0 70 and over.................... 1 1 0 0 0 0 1 1 0 0 0 0 0 0 0
All other............................. 236,390 191,054 45,336 85,571 65,789 19,782 95,166 81,092 14,074 43,263 34,530 8,733 12,390 9,643 2,747 Under 10...................... 59 54 5 11 11 0 34 30 4 10 9 1 4 4 0 10-17.............................. 26,467 20,976 5,491 8,039 5,984 2,055 13,305 10,972 2,333 3,449 2,672 777 1,674 1,348 326 18-19.............................. 14,107 11,518 2,589 4,479 3,392 1,087 6,306 5,529 777 2,490 1,962 528 832 635 197 20-29.............................. 71,563 58,328 13,235 22,176 17,057 5,119 33,190 28,538 4,652 12,236 9,604 2,632 3,961 3,129 832 30-39.............................. 46,707 37,069 9,638 15,972 11,786 4,186 20,555 17,404 3,151 7,816 6,104 1,712 2,364 1,775 589 40-69.............................. 76,511 62,255 14,256 34,514 27,256 7,258 21,474 18,340 3,134 17,031 13,961 3,070 3,492 2,698 794 70 and over.................... 976 854 122 380 303 77 302 279 23 231 218 13 63 54 9

147
Table 37aDUlT felonY arreST DiSPoSiTionS, 1975-2007
By Type of Disposition
Year(s) TotalLaw enforcement
releasesComplaints
denied1Dismissed,acquitted2 Convicted
Number Percent Number Percent Number Percent Number Percent Number Percent2007.......... 332,647 100.0 10,273 3.1 42,632 12.8 48,728 14.6 231,014 69.42006.......... 319,818 100.0 9,107 2.8 42,506 13.3 46,456 14.5 221,749 69.3
2005.......... 319,587 100.0 10,114 3.2 39,034 12.2 43,638 13.7 226,801 71.02004.......... 345,415 100.0 10,721 3.1 43,179 12.5 48,150 13.9 243,365 70.52003.......... 316,377 100.0 10,352 3.3 42,922 13.6 45,775 14.5 217,328 68.72002.......... 287,499 100.0 11,195 3.9 39,833 13.9 41,020 14.3 195,451 68.02001.......... 271,992 100.0 11,248 4.1 39,414 14.5 37,703 13.9 183,627 67.5
2000.......... 267,512 100.0 7,698 2.9 37,152 13.9 36,576 13.7 186,086 69.61999 ......... 278,715 100.0 9,616 3.5 40,217 14.4 36,004 12.9 192,878 69.21998 ......... 314,483 100.0 13,880 4.4 42,763 13.6 39,866 12.7 217,974 69.31997.......... 326,768 100.0 14,289 4.4 47,829 14.6 42,842 13.1 221,808 67.91996.......... 328,168 100.0 12,802 3.9 47,941 14.6 43,566 13.3 223,859 68.2
1995.......... 345,125 100.0 15,100 4.4 45,877 13.3 45,838 13.3 238,310 69.11994.......... 342,321 100.0 16,713 4.9 44,791 13.1 45,108 13.2 235,709 68.91993.......... 345,469 100.0 16,464 4.8 44,512 12.9 43,157 12.5 241,336 69.91992.......... 284,810 100.0 12,273 4.3 32,284 11.3 40,134 14.1 200,119 70.31991.......... 303,707 100.0 20,222 6.7 45,756 15.1 42,002 13.8 195,727 64.4
1990.......... 258,734 100.0 15,444 6.0 33,503 12.9 40,444 15.6 169,343 65.51989.......... 275,151 100.0 20,773 7.5 45,682 16.6 41,069 14.9 167,627 60.91988.......... 265,990 100.0 19,230 7.2 51,222 19.3 41,867 15.7 153,671 57.81987.......... 270,496 100.0 21,019 7.8 52,464 19.4 43,413 16.0 153,600 56.81986.......... 258,832 100.0 22,773 8.8 47,807 18.5 39,962 15.4 148,290 57.3
1985.......... 240,978 100.0 23,003 9.5 39,732 16.5 37,710 15.6 140,533 58.31984.......... 210,398 100.0 20,180 9.6 35,498 16.9 34,453 16.4 120,267 57.21983.......... 201,158 100.0 19,006 9.4 37,215 18.5 33,284 16.5 111,653 55.51982.......... 203,805 100.0 20,895 10.3 37,010 18.2 34,457 16.9 111,443 54.71981.......... 205,168 100.0 21,122 10.3 31,312 15.3 36,112 17.6 116,622 56.8
1980.......... 189,303 100.0 20,057 10.6 27,925 14.8 35,766 18.9 105,555 55.81979.......... 170,980 100.0 18,326 10.7 23,332 13.6 31,649 18.5 97,673 57.11978.......... 150,004 100.0 14,596 9.7 20,989 14.0 29,501 19.7 84,918 56.61977.......... 145,525 100.0 12,831 8.8 20,141 13.8 30,374 20.9 82,179 56.51976.......... 157,537 100.0 10,595 6.7 21,571 13.7 37,856 24.0 87,515 55.6
1975.......... 174,069 100.0 14,798 8.5 23,443 13.5 51,505 29.6 84,323 48.4Notes: Percentages may not add to 100.0 because of rounding Santa Clara County did not report for 1975 through 1977 and Alameda County did not report for 1975 and 1976.1 The "complaints denied" category includes single complaints, combined cases, and petitions to revoke probation.2 The "dismissed, acquitted" category includes diversions that have been dismissed.
.

148
Table 38aDUlT felonY arreST DiSPoSiTionS, 2002-2007
By Type of Disposition and SentenceType of disposition
and sentence2002 2003 2004 2005 2006 2007
Number Percent Number Percent Number Percent Number Percent Number Percent Number PercentTotal..................................................... 287,499 100.0 316,377 100.0 345,415 100.0 319,587 100.0 319,818 100.0 332,647 100.0
Law enforcement releases............... 11,195 3.9 10,352 3.3 10,721 3.1 10,114 3.2 9,107 2.8 10,273 3.1 Total complaints denied.................... 39,833 13.9 42,922 13.6 43,179 12.5 39,034 12.2 42,506 13.3 42,632 12.8 Single complaints.......................... 37,855 13.2 40,593 12.8 41,508 12.0 37,312 11.7 40,784 12.8 41,264 12.4 Combined cases............................ 194 0.1 265 0.1 262 0.1 314 0.1 322 0.1 286 0.1 Petitions to revoke probation......... 1,784 0.6 2,064 0.7 1,409 0.4 1,408 0.4 1,400 0.4 1,082 0.3 Complaints filed................................ 236,471 82.3 263,103 83.2 291,515 84.4 270,439 84.6 268,205 83.9 279,742 84.1
Court dispositions.......................... 236,471 82.3 263,103 83.2 291,515 84.4 270,439 84.6 268,205 83.9 279,742 84.1 Dismissed................................... 35,445 12.3 39,711 12.6 42,279 12.2 38,026 11.9 40,857 12.8 43,217 13.0 Diversions dismissed.................. 4,809 1.7 5,141 1.6 5,111 1.5 5,031 1.6 4,974 1.6 4,836 1.5 Acquitted..................................... 766 0.3 923 0.3 760 0.2 581 0.2 625 0.2 675 0.2 Convicted.................................... 195,451 68.0 217,328 68.7 243,365 70.5 226,801 71.0 221,749 69.3 231,014 69.4
Sentence................................. 195,451 68.0 217,328 68.7 243,365 70.5 226,801 71.0 221,749 69.3 231,014 69.4 Death.................................... 17 0.0 22 0.0 12 0.0 22 0.0 17 0.0 17 0.0 Prison................................... California Rehabilitation
32,412 11.3 37,097 11.7 43,743 12.7 42,405 13.3 39,730 12.4 42,723 12.8
Center (Civil Addict)............ 267 0.1 242 0.1 207 0.1 227 0.1 190 0.1 128 0.0 Youth Authority..................... 7 0.0 4 0.0 2 0.0 7 0.0 6 0.0 11 0.0 Probation.............................. 31,499 11.0 33,471 10.6 35,579 10.3 34,128 10.7 33,636 10.5 34,487 10.4 Probation with jail................. 120,800 42.0 132,531 41.9 145,669 42.2 132,781 41.5 129,700 40.6 133,517 40.1 Jail........................................ 7,133 2.5 8,207 2.6 9,069 2.6 8,842 2.8 8,964 2.8 10,133 3.0 Fine....................................... 1,815 0.6 2,065 0.7 2,426 0.7 2,401 0.8 2,892 0.9 3,452 1.0 Other1................................... 1,501 0.5 3,689 1.2 6,658 1.9 5,988 1.9 6,614 2.1 6,546 2.0Note: Percentages may not add to subtotals or 100.0 because of rounding.1 The "other" category includes no sentence given, sentence suspended, and sentence stayed.
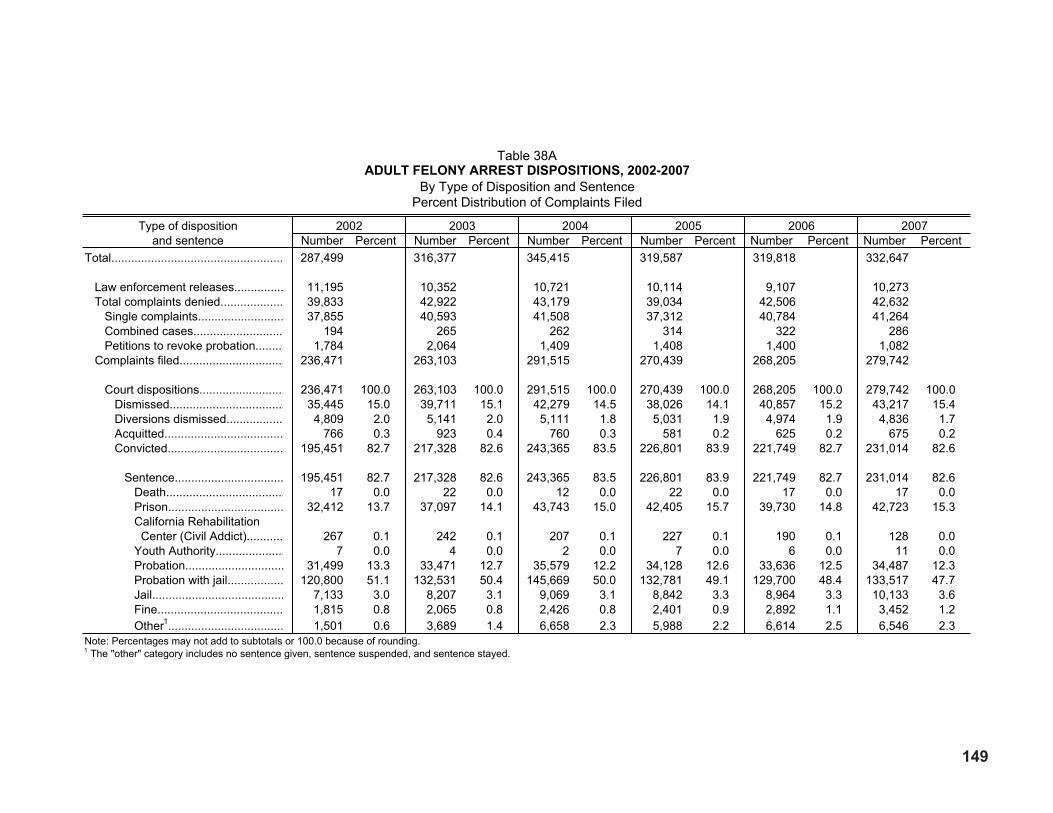
149
Table 38AaDUlT felonY arreST DiSPoSiTionS, 2002-2007
By Type of Disposition and SentencePercent Distribution of Complaints Filed
Type of dispositionand sentence
2002 2003 2004 2005 2006 2007Number Percent Number Percent Number Percent Number Percent Number Percent Number Percent
Total.................................................... 287,499 316,377 345,415 319,587 319,818 332,647
Law enforcement releases............... 11,195 10,352 10,721 10,114 9,107 10,273 Total complaints denied................... 39,833 42,922 43,179 39,034 42,506 42,632 Single complaints.......................... 37,855 40,593 41,508 37,312 40,784 41,264
. Combined cases........................... 194 265 262 314 322 286
. Petitions to revoke probation........ 1,784 2,064 1,409 1,408 1,400 1,082
. Complaints filed............................... 236,471 263,103 291,515 270,439 268,205 279,742
. Court dispositions......................... 236,471 100.0 263,103 100.0 291,515 100.0 270,439 100.0 268,205 100.0 279,742 100.0
. Dismissed.................................. 35,445 15.0 39,711 15.1 42,279 14.5 38,026 14.1 40,857 15.2 43,217 15.4
. Diversions dismissed................. 4,809 2.0 5,141 2.0 5,111 1.8 5,031 1.9 4,974 1.9 4,836 1.7 Acquitted.................................... 766 0.3 923 0.4 760 0.3 581 0.2 625 0.2 675 0.2 Convicted................................... 195,451 82.7 217,328 82.6 243,365 83.5 226,801 83.9 221,749 82.7 231,014 82.6
Sentence................................. 195,451 82.7 217,328 82.6 243,365 83.5 226,801 83.9 221,749 82.7 231,014 82.6. Death................................... 17 0.0 22 0.0 12 0.0 22 0.0 17 0.0 17 0.0
Prison................................... California Rehabilitation
32,412 13.7 37,097 14.1 43,743 15.0 42,405 15.7 39,730 14.8 42,723 15.3
Center (Civil Addict)........... 267 0.1 242 0.1 207 0.1 227 0.1 190 0.1 128 0.0. Youth Authority.................... 7 0.0 4 0.0 2 0.0 7 0.0 6 0.0 11 0.0
Probation.............................. 31,499 13.3 33,471 12.7 35,579 12.2 34,128 12.6 33,636 12.5 34,487 12.3 Probation with jail................. 120,800 51.1 132,531 50.4 145,669 50.0 132,781 49.1 129,700 48.4 133,517 47.7 Jail........................................ 7,133 3.0 8,207 3.1 9,069 3.1 8,842 3.3 8,964 3.3 10,133 3.6 Fine...................................... 1,815 0.8 2,065 0.8 2,426 0.8 2,401 0.9 2,892 1.1 3,452 1.2 Other1................................... 1,501 0.6 3,689 1.4 6,658 2.3 5,988 2.2 6,614 2.5 6,546 2.3Note: Percentages may not add to subtotals or 100.0 because of rounding.1 The "other" category includes no sentence given, sentence suspended, and sentence stayed.

150
Table 40aDUlT felonY arreST DiSPoSiTionS, 2007
Arrest Offense Category by Type of Disposition
Type ofdisposition
Total Violent offenses1 Property offenses2 Drug offenses All otherNumber Percent Number Percent Number Percent Number Percent Number Percent
Total........................................... 332,647 100.0 86,106 100.0 92,988 100.0 97,291 100.0 56,262 100.0
Law enforcement releases...... 10,273 3.1 3,447 4.0 2,624 2.8 2,812 2.9 1,390 2.5 Complaints denied3................. 42,632 12.8 19,493 22.6 8,864 9.5 8,591 8.8 5,684 10.1 Dismissed, acquitted4.............. 48,728 14.6 11,912 13.8 11,071 11.9 18,571 19.1 7,174 12.8 Convicted.............................. 231,014 69.4 51,254 59.5 70,429 75.7 67,317 69.2 42,014 74.7Note: Percentages may not add to 100.0 because of rounding.1 Violent offenses include homicide, forcible rape, robbery, assault, and kidnapping.2 Property offenses include burglary, theft, motor vehicle theft, forgery, checks and access card offenses, and arson.3 The "complaints denied" category includes single complaints, combined cases, and petitions to revoke probation.4 The "dismissed, acquitted" category includes diversions that have been dismissed.
Table 39aDUlT felonY arreST DiSPoSiTionS, 2002-2007
By Type of Disposition
Type of 2002 2003 2004 2005 2006 2007disposition Number Percent Number Percent Number Percent Number Percent Number Percent Number Percent
Total........................................... 287,499 100.0 316,377 100.0 345,415 100.0 319,587 100.0 319,818 100.0 332,647 100.0
Law enforcement releases...... 11,195 3.9 10,352 3.3 10,721 3.1 10,114 3.2 9,107 2.8 10,273 3.1 Complaints denied1................. 39,833 13.9 42,922 13.6 43,179 12.5 39,034 12.2 42,506 13.3 42,632 12.8 Dismissed, acquitted2............. 41,020 14.3 45,775 14.5 48,150 13.9 43,638 13.7 46,456 14.5 48,728 14.6 Convicted................................ 195,451 68.0 217,328 68.7 243,365 70.5 226,801 71.0 221,749 69.3 231,014 69.4Note: Percentages may not add to 100.0 because of rounding.1 The "complaints denied" category includes single complaints, combined cases, and petitions to revoke probation.2 The "dismissed, acquitted" category includes diversions that have been dismissed.
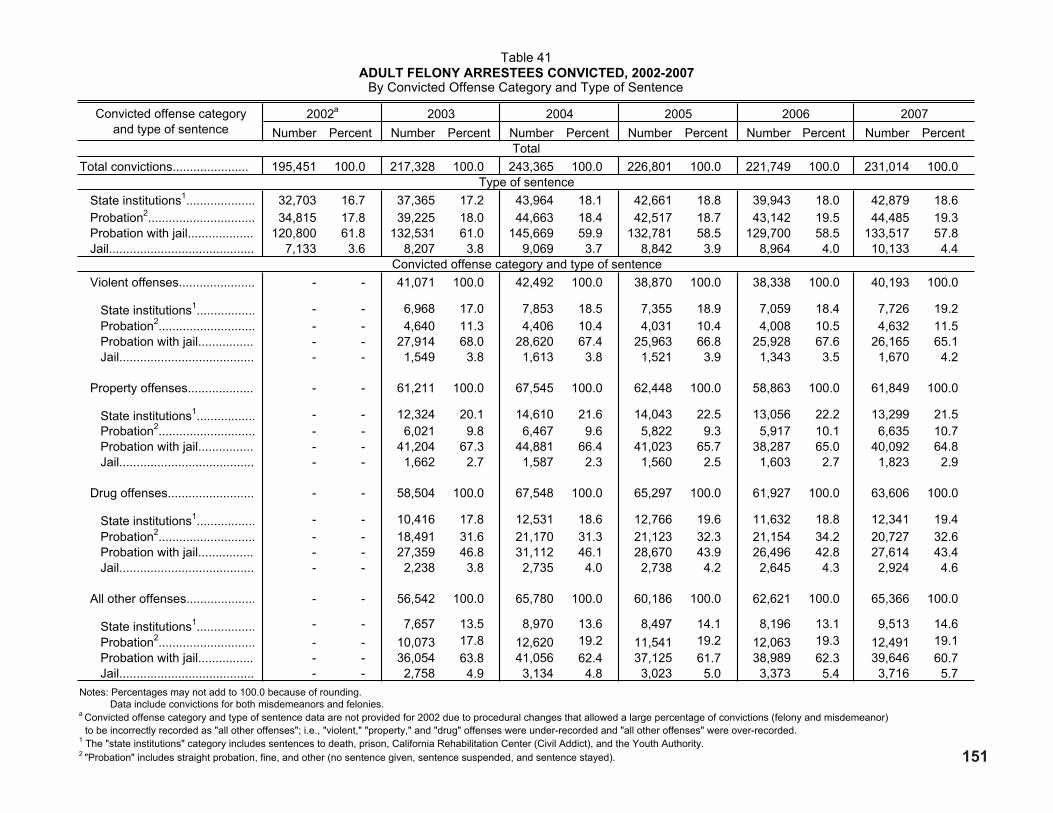
151
Table 41aDUlT felonY arreSTeeS ConViCTeD, 2002-2007
By Convicted Offense Category and Type of Sentence
Convicted offense categoryand type of sentence
2002a 2003 2004 2005 2006 2007Number Percent Number Percent Number Percent Number Percent Number Percent Number Percent
TotalTotal convictions...................... 195,451 100.0 217,328 100.0 243,365 100.0 226,801 100.0 221,749 100.0 231,014 100.0
Type of sentence State institutions1.................... 32,703 16.7 37,365 17.2 43,964 18.1 42,661 18.8 39,943 18.0 42,879 18.6 Probation2............................... 34,815 17.8 39,225 18.0 44,663 18.4 42,517 18.7 43,142 19.5 44,485 19.3 Probation with jail................... 120,800 61.8 132,531 61.0 145,669 59.9 132,781 58.5 129,700 58.5 133,517 57.8 Jail.......................................... 7,133 3.6 8,207 3.8 9,069 3.7 8,842 3.9 8,964 4.0 10,133 4.4
Convicted offense category and type of sentence Violent offenses...................... - - 41,071 100.0 42,492 100.0 38,870 100.0 38,338 100.0 40,193 100.0
State institutions1................. - - 6,968 17.0 7,853 18.5 7,355 18.9 7,059 18.4 7,726 19.2 Probation2............................ - - 4,640 11.3 4,406 10.4 4,031 10.4 4,008 10.5 4,632 11.5 Probation with jail................ - - 27,914 68.0 28,620 67.4 25,963 66.8 25,928 67.6 26,165 65.1 Jail....................................... - - 1,549 3.8 1,613 3.8 1,521 3.9 1,343 3.5 1,670 4.2
Property offenses................... - - 61,211 100.0 67,545 100.0 62,448 100.0 58,863 100.0 61,849 100.0
State institutions1................. Probation2............................
--
--
12,3246,021
20.19.8
14,6106,467
21.69.6
14,0435,822
22.59.3
13,0565,917
22.210.1
13,2996,635
21.510.7
Probation with jail................ - - 41,204 67.3 44,881 66.4 41,023 65.7 38,287 65.0 40,092 64.8 Jail....................................... - - 1,662 2.7 1,587 2.3 1,560 2.5 1,603 2.7 1,823 2.9
Drug offenses......................... - - 58,504 100.0 67,548 100.0 65,297 100.0 61,927 100.0 63,606 100.0
State institutions1................. - - 10,416 17.8 12,531 18.6 12,766 19.6 11,632 18.8 12,341 19.4 Probation2............................ - - 18,491 31.6 21,170 31.3 21,123 32.3 21,154 34.2 20,727 32.6 Probation with jail................ - - 27,359 46.8 31,112 46.1 28,670 43.9 26,496 42.8 27,614 43.4 Jail....................................... - - 2,238 3.8 2,735 4.0 2,738 4.2 2,645 4.3 2,924 4.6
All other offenses.................... - - 56,542 100.0 65,780 100.0 60,186 100.0 62,621 100.0 65,366 100.0
State institutions1................. - - 7,657 13.5 8,970 13.6 8,497 14.1 8,196 13.1 9,513 14.6 Probation2............................ - - 10,073 17.8 12,620 19.2 11,541 19.2 12,063 19.3 12,491 19.1 Probation with jail................ - - 36,054 63.8 41,056 62.4 37,125 61.7 38,989 62.3 39,646 60.7 Jail....................................... - - 2,758 4.9 3,134 4.8 3,023 5.0 3,373 5.4 3,716 5.7Notes: Percentages may not add to 100.0 because of rounding. Data include convictions for both misdemeanors and felonies. a Convicted offense category and type of sentence data are not provided for 2002 due to procedural changes that allowed a large percentage of convictions (felony and misdemeanor) to be incorrectly recorded as "all other offenses"; i.e., "violent," "property," and "drug" offenses were under-recorded and "all other offenses" were over-recorded.1 The "state institutions" category includes sentences to death, prison, California Rehabilitation Center (Civil Addict), and the Youth Authority.2 "Probation" includes straight probation, fine, and other (no sentence given, sentence suspended, and sentence stayed).

152
Table 42aDUlT felonY arreSTeeS ConViCTeD, 2007Convicted Offense Category by Type of Sentence
Type of sentence Total Violent offenses1 Property offenses2 Drug offenses All otherNumber Percent Number Percent Number Percent Number Percent Number Percent
Total........................................ 231,014 100.0 40,193 100.0 61,849 100.0 63,606 100.0 65,366 100.0
Death...................................... 17 0.0 17 0.0 0 0.0 0 0.0 0 0.0 Prison..................................... 42,723 18.5 7,699 19.2 13,242 21.4 12,294 19.3 9,488 14.5 California Rehabilitation Center (Civil Addict).............. 128 0.1 4 0.0 55 0.1 46 0.1 23 0.0 Youth Authority....................... 11 0.0 6 0.0 2 0.0 1 0.0 2 0.0 Probation................................ 34,487 14.9 3,830 9.5 5,146 8.3 16,480 25.9 9,031 13.8 Probation with jail................... 133,517 57.8 26,165 65.1 40,092 64.8 27,614 43.4 39,646 60.7 Jail.......................................... 10,133 4.4 1,670 4.2 1,823 2.9 2,924 4.6 3,716 5.7 Fine......................................... 3,452 1.5 229 0.6 419 0.7 1,112 1.7 1,692 2.6 Other3..................................... 6,546 2.8 573 1.4 1,070 1.7 3,135 4.9 1,768 2.7Notes: Percentages may not add to 100.0 because of rounding. Data include convictions for both misdemeanors and felonies.1 Violent offenses include homicide, forcible rape, robbery, assault, and kidnapping.2 Property offenses include burglary, theft, motor vehicle theft, forgery, checks and a3 The "other" category includes no sentence given, sentence suspended, and senten
ccess card offenses, and arson.ce stayed.

153
Table 43aDUlTS UnDer STaTe anD loCal SUPerViSion, 1966-2007
Number and Rate per 100,000 Population at Risk
Year(s)Total
State supervision Local supervision
Total
Institutioninmate
populationParolees/
outpatients Total
Averagedaily jail
population
Adultson
active probationNumber Rate Number Rate Number Rate Number Rate Number Rate Number Rate Number Rate
2007......... 729,928 2,931.2 298,682 1,199.4 171,751 689.7 126,931 509.7 431,246 1,731.8 84,047 337.5 347,199 1,394.32006......... 722,740 2,922.4 294,623 1,191.3 172,774 698.6 121,849 492.7 428,117 1,731.1 81,622 330.0 346,495 1,401.1
2005......... 708,995 2,915.7 283,356 1,165.3 168,270 692.0 115,086 473.3 425,639 1,750.4 81,197 333.9 344,442 1,416.52004......... 697,109 2,916.0 278,068 1,163.1 164,169 686.7 113,899 476.4 419,041 1,752.8 77,814 325.5 341,227 1,427.32003......... 703,979 3,021.9 276,245 1,185.8 161,944 695.2 114,301 490.7 427,734 1,836.1 75,285 323.2 352,449 1,512.92002......... 689,515 3,007.4 277,230 1,209.2 159,869 697.3 117,361 511.9 412,285 1,798.2 75,545 329.5 336,740 1,468.72001......... 681,809 3,022.8 279,428 1,238.8 157,379 697.7 122,049 541.1 402,381 1,783.9 73,841 327.4 328,540 1,456.6
2000......... 691,048 3,113.1 282,684 1,273.4 161,000 725.3 121,684 548.2 408,364 1,839.6 75,076 338.2 333,288 1,501.41999......... 694,131 3,176.0 279,035 1,276.7 161,100 737.1 117,935 539.6 415,096 1,899.3 76,311 349.2 338,785 1,550.11998......... 676,317 3,145.9 272,747 1,268.7 160,093 744.7 112,654 524.0 403,570 1,877.2 79,143 368.1 324,427 1,509.11997......... 643,902 2,935.5 262,477 1,196.6 155,906 710.8 106,571 485.9 381,425 1,738.9 76,894 350.6 304,531 1,388.31996......... 610,508 2,797.2 248,998 1,140.8 146,632 671.8 102,366 469.0 361,510 1,656.3 72,007 329.9 289,503 1,326.4
1995......... 592,624 2,755.6 234,556 1,090.7 137,089 637.5 97,467 453.2 358,068 1,665.0 71,082 330.5 286,986 1,334.51994......... 573,035 2,703.8 218,697 1,031.9 127,784 602.9 90,913 429.0 354,338 1,671.9 69,233 326.7 285,105 1,345.21993......... 557,503 2,664.5 209,178 999.7 121,954 582.9 87,224 416.9 348,325 1,664.7 67,576 323.0 280,749 1,341.81992......... 572,812 2,772.4 199,205 964.2 111,338 538.9 87,867 425.3 373,607 1,808.3 70,853 342.9 302,754 1,465.31991......... 571,890 2,809.3 187,770 922.4 103,563 508.7 84,207 413.7 384,120 1,886.9 68,699 337.5 315,421 1,549.4
1990......... 547,913 2,735.8 171,368 855.7 99,145 495.0 72,223 360.6 376,545 1,880.1 70,845 353.7 305,700 1,526.41989......... 509,416 2,618.9 150,382 773.1 89,171 458.4 61,211 314.7 359,034 1,845.8 74,016 380.5 285,018 1,465.31988......... 463,353 2,453.5 130,689 692.0 78,102 413.6 52,587 278.5 332,664 1,761.5 67,021 354.9 265,643 1,406.61987......... 418,862 2,279.1 112,566 612.5 69,176 376.4 43,390 236.1 306,296 1,666.6 63,767 347.0 242,529 1,319.61986......... 375,933 2,099.8 97,432 544.2 62,128 347.0 35,304 197.2 278,501 1,555.6 57,887 323.3 220,614 1,232.3
1985......... 346,269 1,982.2 84,767 485.2 52,747 301.9 32,020 183.3 261,502 1,497.0 51,053 292.3 210,449 1,204.71984......... 318,427 1,863.9 73,685 431.3 45,685 267.4 28,000 163.9 244,742 1,432.6 47,329 277.0 197,413 1,155.61983......... 283,205 1,689.5 64,439 384.4 41,642 248.4 22,797 136.0 218,766 1,305.0 42,211 251.8 176,555 1,053.21982......... 251,903 1,534.5 55,809 340.0 37,600 229.1 18,209 110.9 196,094 1,194.6 39,085 238.1 157,009 956.51981......... 234,612 1,458.8 48,397 300.9 32,966 205.0 15,431 95.9 186,215 1,157.9 33,652 209.2 152,563 948.6
1980......... 225,048 1,426.3 43,918 278.3 27,916 176.9 16,002 101.4 181,130 1,147.9 30,045 190.4 151,085 957.51979......... 218,951 1,428.9 41,392 270.1 25,527 166.6 15,865 103.5 177,559 1,158.7 26,993 176.2 150,566 982.61978......... 221,014 1,481.7 40,963 274.6 24,068 161.4 16,895 113.3 180,051 1,207.1 26,938 180.6 153,113 1,026.51977......... 220,266 1,522.2 44,133 305.0 22,127 152.9 22,006 152.1 176,133 1,217.2 26,546 183.4 149,587 1,033.71976......... 225,843 1,603.9 45,400 322.4 23,641 167.9 21,759 154.5 180,443 1,281.5 28,201 200.3 152,242 1,081.2
1975......... 224,372 1,638.4 46,240 337.6 22,723 165.9 23,517 171.7 178,132 1,300.7 24,992 182.5 153,140 1,118.21974......... 232,711 1,744.5 48,607 364.4 27,479 206.0 21,128 158.4 184,104 1,380.1 25,217 189.0 158,887 1,191.11973......... 222,787 1,709.7 48,104 369.2 24,984 191.7 23,120 177.4 174,683 1,340.5 24,391 187.2 150,292 1,153.31972......... 202,744 1,589.1 32,606 255.6 17,758 139.2 14,848 116.4 170,138 1,333.5 26,955 211.3 143,183 1,122.21971......... 193,906 1,546.0 34,199 272.7 18,391 146.6 15,808 126.0 159,707 1,273.3 27,629 220.3 132,078 1,053.0
1970......... 182,385 1,478.0 37,326 302.5 22,399 181.5 14,927 121.0 145,059 1,175.6 27,964 226.6 117,095 948.91969......... 167,142 1,433.8 37,431 321.1 24,403 209.3 13,028 111.8 129,711 1,112.7 27,669 237.3 102,042 875.31968......... 157,029 1,377.0 37,439 328.3 25,606 224.5 11,833 103.8 119,590 1,048.7 26,308 230.7 93,282 818.01967......... 143,158 1,282.8 35,670 319.6 23,668 212.1 12,002 107.5 107,488 963.2 23,971 214.8 83,517 748.41966......... 140,121 1,288.8 36,024 331.3 23,563 216.7 12,461 114.6 104,097 957.4 23,452 215.7 80,645 741.7Source: State supervision and jail population data are provided by the California Department of Corrections and Rehabilitation (CDCR).Notes: State supervision data from 1952-1965 can be found in Table 43 of Crime in California, 2006 . Since 1966 there have been many changes in laws, data collection procedures, etc.; therefore, caution should be used when co Rates are based on the adult population at risk (18-69 years of age) for each year (see Table 58).
mparing data for the 1966-2007 period.
..
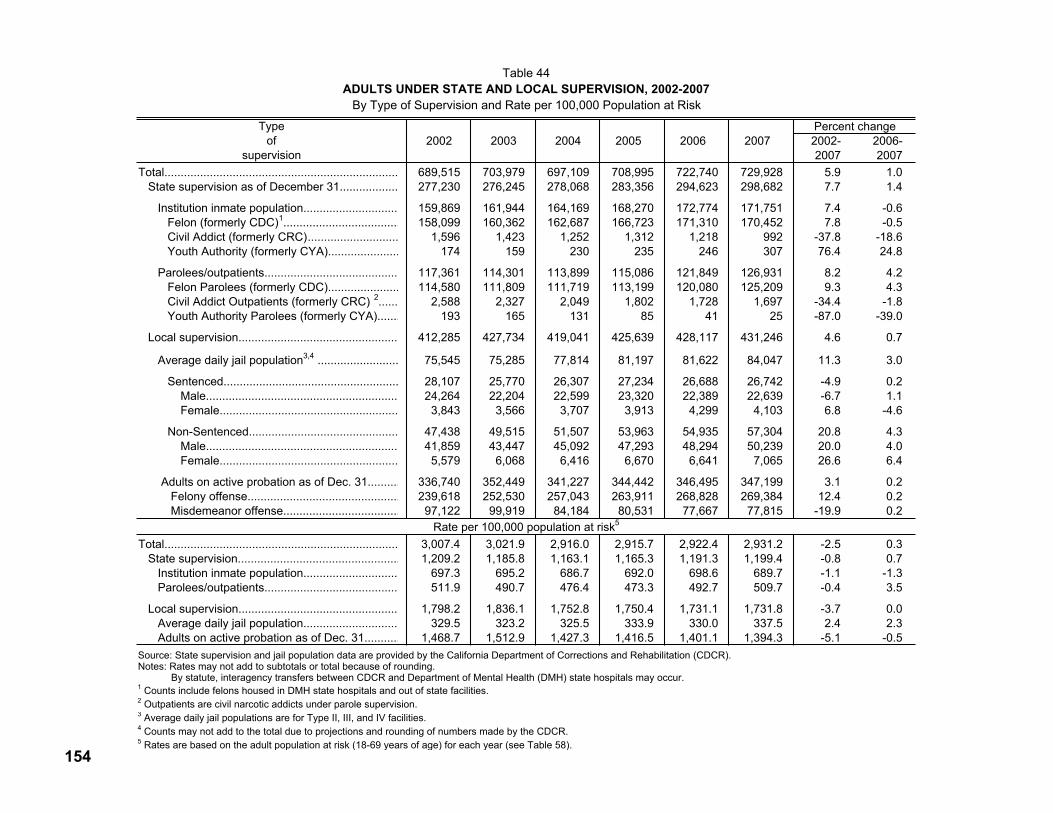
154
Table 44aDUlTS UnDer STaTe anD loCal SUPerViSion, 2002-2007
By Type of Supervision and Rate per 100,000 Population at Risk
Typeof
supervision2002 2003 2004 2005 2006 2007
Percent change2002- 2006-2007 2007
Total........................................................................ 689,515 703,979 697,109 708,995 722,740 729,928 5.9 1.0 State supervision as of December 31.................. 277,230 276,245 278,068 283,356 294,623 298,682 7.7 1.4
Institution inmate population............................. 159,869 161,944 164,169 168,270 172,774 171,751 7.4 -0.6 Felon (formerly CDC)1.................................... 158,099 160,362 162,687 166,723 171,310 170,452 7.8 -0.5 Civil Addict (formerly CRC)............................ 1,596 1,423 1,252 1,312 1,218 992 -37.8 -18.6 Youth Authority (formerly CYA)...................... 174 159 230 235 246 307 76.4 24.8
Parolees/outpatients......................................... 117,361 114,301 113,899 115,086 121,849 126,931 8.2 4.2 Felon Parolees (formerly CDC)...................... 114,580 111,809 111,719 113,199 120,080 125,209 9.3 4.3 Civil Addict Outpatients (formerly CRC) 2...... 2,588 2,327 2,049 1,802 1,728 1,697 -34.4 -1.8 Youth Authority Parolees (formerly CYA)....... 193 165 131 85 41 25 -87.0 -39.0
Local supervision................................................. 412,285 427,734 419,041 425,639 428,117 431,246 4.6 0.7
Average daily jail population3,4 ......................... 75,545 75,285 77,814 81,197 81,622 84,047 11.3 3.0
Sentenced...................................................... 28,107 25,770 26,307 27,234 26,688 26,742 -4.9 0.2 Male........................................................... 24,264 22,204 22,599 23,320 22,389 22,639 -6.7 1.1 Female....................................................... 3,843 3,566 3,707 3,913 4,299 4,103 6.8 -4.6
Non-Sentenced.............................................. 47,438 49,515 51,507 53,963 54,935 57,304 20.8 4.3 Male........................................................... 41,859 43,447 45,092 47,293 48,294 50,239 20.0 4.0 Female....................................................... 5,579 6,068 6,416 6,670 6,641 7,065 26.6 6.4
Adults on active probation as of Dec. 31.......... 336,740 352,449 341,227 344,442 346,495 347,199 3.1 0.2 Felony offense............................................... 239,618 252,530 257,043 263,911 268,828 269,384 12.4 0.2 Misdemeanor offense.................................... 97,122 99,919 84,184 80,531 77,667 77,815 -19.9 0.2
Rate per 100,000 population at risk5
Total........................................................................ 3,007.4 3,021.9 2,916.0 2,915.7 2,922.4 2,931.2 -2.5 0.3 State supervision.................................................. 1,209.2 1,185.8 1,163.1 1,165.3 1,191.3 1,199.4 -0.8 0.7 Institution inmate population............................. 697.3 695.2 686.7 692.0 698.6 689.7 -1.1 -1.3 Parolees/outpatients......................................... 511.9 490.7 476.4 473.3 492.7 509.7 -0.4 3.5
Local supervision................................................. 1,798.2 1,836.1 1,752.8 1,750.4 1,731.1 1,731.8 -3.7 0.0 Average daily jail population............................. 329.5 323.2 325.5 333.9 330.0 337.5 2.4 2.3 Adults on active probation as of Dec. 31........... 1,468.7 1,512.9 1,427.3 1,416.5 1,401.1 1,394.3 -5.1 -0.5Source: State supervision and jail population data are provided by the California Department of Corrections and Rehabilitation (CDCR).Notes: Rates may not add to subtotals or total because of rounding. By statute, interagency transfers between CDCR and Department of Mental Health (DMH) state hospitals may occur.1 Counts include felons housed in DMH state hospitals and out of state facilities.2 Outpatients are civil narcotic addicts under parole supervision.3 Average daily jail populations are for Type II, III, and IV facilities.4 Counts may not add to the total due to projections and rounding of numbers made by the CDCR.5 Rates are based on the adult population at risk (18-69 years of age) for each year (see Table 58).
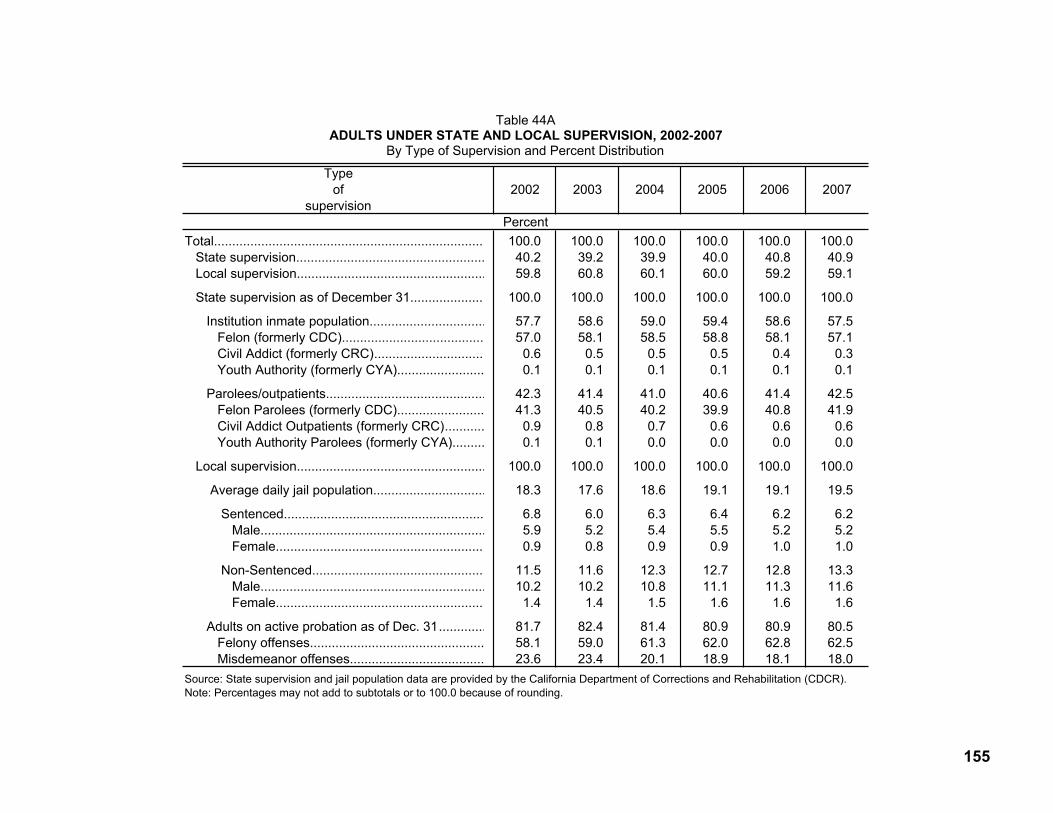
155
Table 44AaDUlTS UnDer STaTe anD loCal SUPerViSion, 2002-2007
By Type of Supervision and Percent Distribution
Typeof
supervision2002 2003 2004 2005 2006 2007
PercentTotal.......................................................................... 100.0 100.0 100.0 100.0 100.0 100.0 State supervision.................................................... 40.2 39.2 39.9 40.0 40.8 40.9 Local supervision.................................................... 59.8 60.8 60.1 60.0 59.2 59.1
State supervision as of December 31.................... 100.0 100.0 100.0 100.0 100.0 100.0
Institution inmate population................................ 57.7 58.6 59.0 59.4 58.6 57.5 Felon (formerly CDC)....................................... 57.0 58.1 58.5 58.8 58.1 57.1 Civil Addict (formerly CRC).............................. 0.6 0.5 0.5 0.5 0.4 0.3 Youth Authority (formerly CYA)........................ 0.1 0.1 0.1 0.1 0.1 0.1
Parolees/outpatients............................................ 42.3 41.4 41.0 40.6 41.4 42.5 Felon Parolees (formerly CDC)........................ 41.3 40.5 40.2 39.9 40.8 41.9 Civil Addict Outpatients (formerly CRC)........... 0.9 0.8 0.7 0.6 0.6 0.6 Youth Authority Parolees (formerly CYA)......... 0.1 0.1 0.0 0.0 0.0 0.0
Local supervision.................................................... 100.0 100.0 100.0 100.0 100.0 100.0
Average daily jail population............................... 18.3 17.6 18.6 19.1 19.1 19.5
Sentenced....................................................... 6.8 6.0 6.3 6.4 6.2 6.2 Male.............................................................. 5.9 5.2 5.4 5.5 5.2 5.2 Female......................................................... 0.9 0.8 0.9 0.9 1.0 1.0
Non-Sentenced............................................... 11.5 11.6 12.3 12.7 12.8 13.3 Male.............................................................. 10.2 10.2 10.8 11.1 11.3 11.6 Female......................................................... 1.4 1.4 1.5 1.6 1.6 1.6
Adults on active probation as of Dec. 31............. 81.7 82.4 81.4 80.9 80.9 80.5 Felony offenses................................................ 58.1 59.0 61.3 62.0 62.8 62.5 Misdemeanor offenses..................................... 23.6 23.4 20.1 18.9 18.1 18.0Source: State supervision and jail population data are provided by the California Department of Corrections and Rehabilitation (CDCR).Note: Percentages may not add to subtotals or to 100.0 because of rounding.

156
Table 45aDUlTS on aCTiVe ProBaTion aS of DeCemBer 31, 2002-2007
By Level of Offense
Year(s) Total Felony offense Misdemeanor offenseNumber Percent Number Percent Number Percent
2007……………… 347,199 100.0 269,384 77.6 77,815 22.42006……………… 346,495 100.0 268,828 77.6 77,667 22.42005……………… 344,442 100.0 263,911 76.6 80,531 23.42004……………… 341,227 100.0 257,043 75.3 84,184 24.72003……………… 352,449 100.0 252,530 71.7 99,919 28.32002……………… 336,740 100.0 239,618 71.2 97,122 28.8
Percent change in number2002 to 2007……… 3.1 12.4 -19.92006 to 2007……… 0.2 0.2 0.2Note: These data include adults placed on supervised probation only. Data are limited to original grants of probation and do not include subsequent grants of probation to persons already under supervised probation in the same county.

157
Table 46aDUlTS PlaCeD on anD remoVeD from ProBaTion, 2002-2007
By Level of Offense, Type of Removal, and Rate per 100,000 Population at Risk
Level of offenseand
placements & removals
2002 2003 2004 2005 2006 2007 Percent change2002- 2006-2007 2007Number Percent Number Percent Number Percent Number Percent Number Percent Number Percent
Placed on probationTotal....................................
Felony offense................. Misdemeanor offense......
171,738
120,64551,093
100.0
70.229.8
180,367
129,49750,870
100.0
71.828.2
193,467
142,31051,157
100.0
73.626.4
193,147
147,16145,986
100.0
76.223.8
197,952
153,05344,899
100.0
77.322.7
195,703
150,82444,879
100.0
77.122.9
14.0
25.0-12.2
-1.1
-1.50.0
Rate per 100,000 population at risk1 - Placed on probationTotal....................................
Felony offense................. Misdemeanor offense......
749.1
526.2222.8
774.3
555.9218.4
809.3
595.3214.0
794.3
605.2189.1
800.4
618.9181.5
785.9
605.7180.2
4.9
15.1-19.1
-1.8
-2.1-0.7
Removed from probationTotal....................................
Felony offense................. Misdemeanor offense......
Terminated...................... Felony offense.............. Misdemeanor offense...
Revoked.......................... Felony offense.............. Misdemeanor offense...
Other2.............................. Felony offense.............. Misdemeanor offense...
164,434
116,93747,497
74,74552,97421,771
72,68653,07419,612
17,00310,8896,114
100.0
71.128.9
45.532.213.2
44.232.311.9
10.36.63.7
164,453
119,36645,087
76,67658,32818,348
78,25255,88322,369
9,5255,1554,370
100.0
72.627.4
46.635.511.2
47.634.013.6
5.83.12.7
191,945
140,16851,777
83,80664,25719,549
83,73061,09022,640
24,40914,8219,588
100.0
73.027.0
43.733.510.2
43.631.811.8
12.77.75.0
195,815
143,98551,830
91,07969,13021,949
82,74161,89320,848
21,99512,9629,033
100.0
73.526.5
46.535.311.2
42.331.610.6
11.26.64.6
200,725
154,37746,348
89,07168,60320,468
80,98863,36517,623
30,66622,4098,257
100.0
76.923.1
44.434.210.2
40.331.68.8
15.311.24.1
190,528
145,42545,103
86,98466,47020,514
79,19762,63916,558
24,34716,3168,031
100.0
76.323.7
45.734.910.8
41.632.98.7
12.88.64.2
15.9
24.4-5.0
16.425.5-5.8
9.018.0
-15.6
43.249.831.4
-5.1
-5.8-2.7
-2.3-3.10.2
-2.2-1.1-6.0
-20.6-27.2-2.7
Rate per 100,000 population at risk1 - Removed from probationTotal....................................
Terminated...................... Revoked.......................... Other................................
717.2
326.0317.074.2
705.9
329.1335.940.9
802.9
350.6350.2102.1
805.3
374.6340.390.5
811.6
360.2327.5124.0
765.1
349.3318.097.8
6.7
7.10.3
31.8
-5.7
-3.0-2.9
-21.1Notes: Rates and percentages may not add to subtotals, total, or 100.0 because of rounding. These data include adults placed on supervised probation only. Data are limited to original grants of probation and do not include subsequent grants of probation to persons already under supervised probation in the same county.1 Rates are based on the adult population at risk (18-69 years of age) for each year (see Table 58).2 "Other" includes transfer of jurisdiction from one county to another, death, sentence vacated, successful appeal, deportation, etc.

158
Table 47aDUlTS CommiTTeD To STaTe inSTiTUTionS, 2002-2007
By Type of Commitment, Type of Institution, and Rate per 100,000 Population at Risk
Type of commitmentand
type of institution
2002 2003 2004 2005 2006 2007 Percent change2002- 2006-2007 2007Number Percent Number Percent Number Percent Number Percent Number Percent Number Percent
TotalTotal.............................................. 54,056 100.0 60,218 100.0 65,533 100.0 69,399 100.0 70,359 100.0 68,648 100.0 27.0 -2.4
Type of commitment Newly received from court........... Parolee/outpatient returned with new commitment................
39,707
14,349
73.5
26.5
44,508
15,710
73.9
26.1
47,689
17,844
72.8
27.2
49,656
19,743
71.6
28.4
49,595
20,764
70.5
29.5
47,808
20,840
69.6
30.4
20.4
45.2
-3.6
0.4Type of institution
Felon (formerly CDC).................. Newly received from court........ Parolee returned with new commitment............................
Civil Addict (formerly CRC).......... Newly received from court........ Outpatient returned with new commitment............................
Youth Authority (formerly CYA)... Newly received from court1....... Newly received from court, 1731.5(c) WI2.......................... Parolee returned with new commitment3..........................
52,93338,605
14,328
1,0471,026
21
768
68
0
97.971.4
26.5
1.91.9
0.0
0.10.0
0.1
0.0
59,08943,413
15,676
1,0671,034
33
628
53
1
98.172.1
26.0
1.81.7
0.1
0.10.0
0.1
0.0
64,63546,812
17,823
842821
21
563
53
0
98.671.4
27.2
1.31.3
0.0
0.10.0
0.1
0.0
68,31848,597
19,721
985963
22
966
90
0
98.470.0
28.4
1.41.4
0.0
0.10.0
0.1
0.0
69,39048,640
20,750
889875
14
806
74
0
98.669.1
29.5
1.31.2
0.0
0.10.0
0.1
0.0
67,80246,979
20,823
749732
17
975
92
0
98.868.4
30.3
1.11.1
0.0
0.10.0
0.1
0.0
28.121.7
45.3
-28.5-28.7
-
27.6-
35.3
-
-2.3-3.4
0.4
-15.7-16.3
-
21.3-
24.3
-Rate per 100,000 population at risk4
Total..............................................
Felon............................................ Civil Addict................................... Youth Authority............................
235.8
230.94.60.3
258.5
253.64.60.3
274.1
270.43.50.2
285.4
281.04.10.4
284.5
280.63.60.3
275.7
272.33.00.4
16.9
17.9-34.833.3
-3.1
-3.0-16.733.3
Source: State institution data are provided by the California Department of Corrections and Rehabilitation (CDCR).Notes: Rates and percentages may not add to subtotals, total, or 100.0 because of rounding. Dash indicates that a percent change is not calculated when the base number is less than 50.1 Counts are for commitments of adults from criminal courts.2 Persons sentenced to CDCR and transferred to the custody of the Youth Authority under Welfare and Institutions Code 1731.5(c).3 Adults returned from criminal court who had previous Youth Authority commitments and/or who may have been under Youth Authority ju4 Rates are based on the adult population at risk (18-69 years of age) for each year (see Table 58).
risdiction at the time of the new commitment.

159
Table 48Criminal JUSTiCe eXPenDiTUreS, fiSCal YearS 1967/68-2006/07
(Amounts Shown in Thousands of Dollars)
Year(s) Totalexpenditures1
Lawenforcement Prosecution2
Publicdefense Courts Corrections
2006/07a .......... - - - - - -2005/06 ..........… $28,328,949 13,265,007 1,119,295 679,149 1,349,760 11,915,738
2004/05 ..........… $26,275,121 12,692,200 1,039,764 638,208 1,422,316 10,482,6332003/04 ..........… $24,651,419 11,931,991 981,063 605,643 1,381,724 9,750,9982002/03 ..........… $23,304,696 11,400,704 932,469 581,238 1,344,861 9,045,4242001/02 ..........… $21,880,014 10,573,663 874,021 540,638 1,322,337 8,569,3552000/01 ..........… $21,181,256 9,923,976 1,456,518 508,963 1,244,994 8,046,805
1999/00 ........... $19,922,982 9,286,154 1,370,359 480,137 1,221,668 7,564,6641998/99 ........... $18,721,494 8,761,423 1,209,460 449,789 1,305,527 6,995,2951997/98 ........... $18,134,068 8,342,033 1,071,695 426,602 1,687,760 6,605,9781996/97 ........... $17,190,332 7,769,054 1,021,622 412,801 1,669,069 6,317,7861995/96 ........... $16,447,382 7,436,062 942,499 392,849 1,663,692 6,012,280
1994/95............ $15,386,553 7,070,775 859,275 370,529 1,515,084 5,570,8901993/94............ $14,551,913 6,738,242 791,630 348,477 1,433,470 5,240,0941992/93............ $13,752,935 6,532,639 722,223 348,955 1,399,056 4,750,0621991/92............ $13,762,103 6,481,822 713,921 348,021 1,454,060 4,764,2791990/91............ $12,685,772 5,960,782 643,180 314,062 1,324,390 4,443,358
1989/90............ $11,395,198 5,385,470 561,517 275,951 1,190,047 3,982,2131988/89............ $9,963,497 4,891,280 491,895 246,779 1,021,579 3,311,9641987/88............ $9,087,289 4,509,517 453,235 213,335 898,335 3,012,8671986/87............ $8,370,447 4,243,343 414,671 185,772 826,289 2,700,3721985/86............ $7,486,696 3,888,570 383,142 157,113 752,993 2,304,878
1984/85............ $6,679,904 3,591,614 343,958 138,085 662,461 1,943,7861983/84............ $5,878,081 3,256,388 307,483 119,559 551,094 1,643,5571982/83............ $5,355,311 2,981,519 280,884 111,941 516,024 1,464,9431981/82............ $4,954,317 2,741,479 260,176 96,737 468,538 1,387,3871980/81............ $4,362,811 2,400,827 231,873 84,066 405,827 1,240,218
1979/80............ $3,784,620 2,058,821 205,311 74,906 351,335 1,094,2471978/79............ $3,070,469 1,661,488 165,848 55,961 290,726 896,4461977/78............ $2,888,395 1,578,641 148,676 54,795 279,578 826,7051976/77............ $2,596,473 1,418,008 128,716 47,387 255,752 746,6101975/76............ $2,312,906 1,284,178 93,364 37,018 217,072 681,274
1974/75............ $2,112,394 1,160,710 76,426 34,528 210,607 630,1231973/74............ $1,829,886 1,018,333 67,162 29,555 180,499 534,3371972/73............ $1,612,369 903,534 58,073 25,238 160,329 465,1951971/72............ $1,429,104 797,603 49,547 21,785 145,161 415,0081970/71............ $1,295,856 716,479 42,655 17,753 130,018 388,951
1969/70............ $1,133,462 618,773 35,724 13,806 114,250 350,9091968/69............ $977,673 531,381 28,838 9,387 101,364 306,7031967/68b........... $839,631 448,924 24,618 6,847 89,120 270,122Source: State of California Governor's Budget and the Controller of the State of California.Notes: Dash indicates that data are not available. Expenditure data for the Department of Justice and other regulatory agencies are not included.1 Expenditures include salaries and employee benefits, services, and supplies.2 The passage of Assembly Bill 196 required that county-level child support programs, previously administered by district attorneys, be operated by local child support agencies. This accounts for the large decrease in prosecution expenditures from 2000/01 to 2001/02.a The 2006/07 data were not available from the Office of the State Controller in time for inclusion in this publication.b The 1967/68 law enforcement costs do not include state police expenditures.
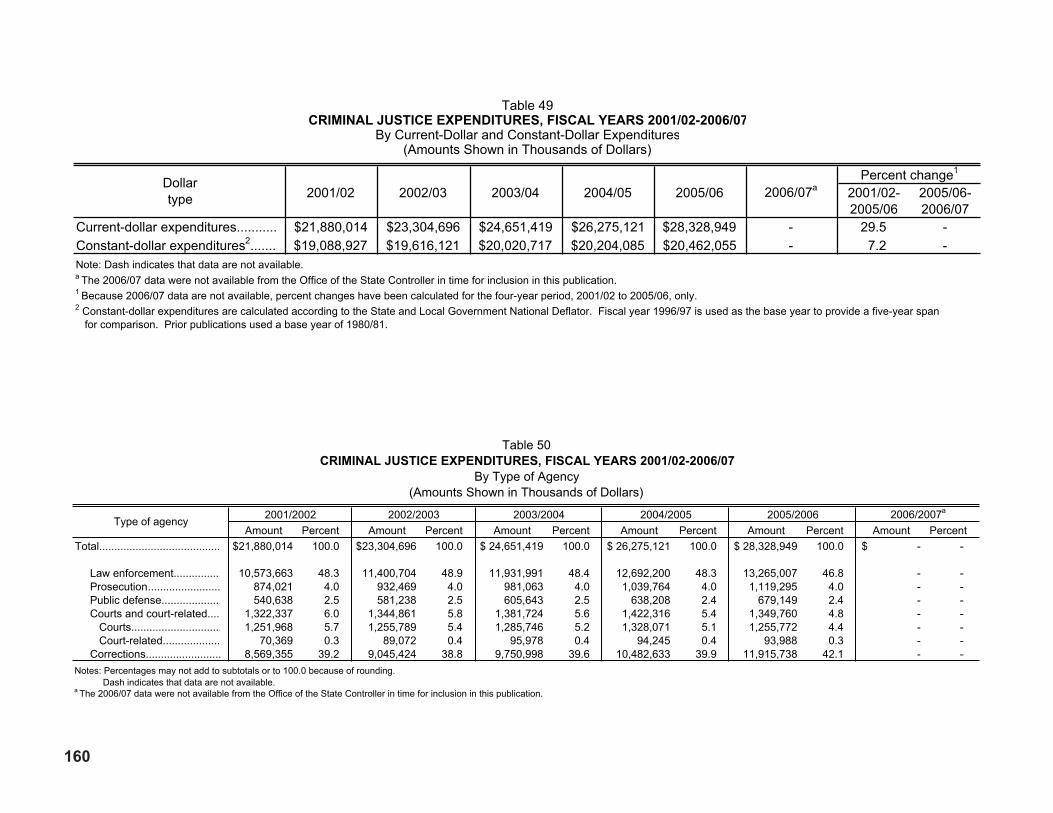
160
Table 50Criminal JUSTiCe eXPenDiTUreS, fiSCal YearS 2001/02-2006/07
By Type of Agency(Amounts Shown in Thousands of Dollars)
Type of agency 2001/2002 2002/2003 2003/2004 2004/2005 2005/2006 2006/2007a
Amount Percent Amount Percent Amount Percent Amount Percent Amount Percent Amount PercentTotal........................................ $21,880,014 100.0 $23,304,696 100.0 $ 24,651,419 100.0 $ 26,275,121 100.0 $ 28,328,949 100.0 $ - -
Law enforcement................ Prosecution........................ Public defense.................... Courts and court-related.... Courts.............................. Court-related................... Corrections.........................
10,573,663 874,021 540,638 1,322,337 1,251,968 70,369 8,569,355
48.34.02.56.05.70.3
39.2
11,400,704 932,469 581,238 1,344,861 1,255,789 89,072 9,045,424
48.94.02.55.85.40.4
38.8
11,931,991 981,063 605,643 1,381,724 1,285,746 95,978 9,750,998
48.44.02.55.65.20.4
39.6
12,692,200 1,039,764 638,208 1,422,316 1,328,071 94,245 10,482,633
48.34.02.45.45.10.4
39.9
13,265,007 1,119,295 679,149 1,349,760 1,255,772 93,988 11,915,738
46.84.02.44.84.40.3
42.1
- -- -- -- -- -- -- -
Notes: Percentages may not add to subtotals or to 100.0 because of rounding. Dash indicates that data are not available.a The 2006/07 data were not available from the Office of the State Controller in time for inclusion in this publication.
Table 49Criminal JUSTiCe eXPenDiTUreS, fiSCal YearS 2001/02-2006/07
By Current-Dollar and Constant-Dollar Expenditures(Amounts Shown in Thousands of Dollars)
Dollartype 2001/02 2002/03 2003/04 2004/05 2005/06 2006/07a
Percent change1
2001/02- 2005/06-2005/06 2006/07
Current-dollar expenditures........... $21,880,014 $23,304,696 $24,651,419 $26,275,121 $28,328,949 - 29.5 -Constant-dollar expenditures2....... $19,088,927 $19,616,121 $20,020,717 $20,204,085 $20,462,055 - 7.2 -Note: Dash indicates that data are not available.a The 2006/07 data were not available from the Office of the State Controller in time for inclusion in this publication.1 Because 2006/07 data are not available, percent changes have been calculated for the four-year period, 2001/02 to 2005/06, only.2 Constant-dollar expenditures are calculated according to the State and Local Government National Deflator. Fiscal year 1996/97 is used as the base year to provide a five-year span for comparison. Prior publications used a base year of 1980/81.

161
Table 51Criminal JUSTiCe eXPenDiTUreS, fiSCal YearS 2001/02-2006/07
By Type of Agency(Amounts Shown in Thousands of Dollars)
Agency 2001/02 2002/03 2003/04 2004/05 2005/06 2006/07aPercent change
2001/02- 2005/06-2005/06 2006/07
Total1........................................................... $21,880,014 $23,304,696 $24,651,419 $26,275,121 $28,328,949 - 29.5 -
Law enforcement...................................... 10,573,663 11,400,704 11,931,991 12,692,200 13,265,007 - 25.5 - California Highway Patrol...................... 1,078,558 1,236,545 1,286,464 1,379,198 1,451,089 - 34.5 - Police departments................................ 6,580,059 7,112,274 7,471,857 7,953,759 8,182,388 - 24.4 - Sheriffs' departments............................. 2,915,046 3,051,885 3,173,670 3,359,243 3,631,530 - 24.6 -
Prosecution............................................... 874,021 932,469 981,063 1,039,764 1,119,295 - 28.1 -
Public defense.......................................... 540,638 581,238 605,643 638,208 679,149 - 25.6 -
Courts and court-related........................... 1,322,337 1,344,861 1,381,724 1,422,316 1,349,760 - 2.1 - Courts.................................................... 1,251,968 1,255,789 1,285,746 1,328,071 1,255,772 - 0.3 -
Court-related.......................................... 70,369 89,072 95,978 94,245 93,988 - 33.6 - County clerks...................................... 7,290 8,119 23,971 25,966 29,687 - 307.2 - Grand juries........................................ 5,958 6,582 6,946 7,037 6,984 - 17.2 - All other2.............................................. 57,121 74,371 65,061 61,242 57,317 - 0.3 -
Corrections............................................... 8,569,355 9,045,424 9,750,998 10,482,633 11,915,738 - 39.1 - Probation departments.......................... 1,525,425 1,526,753 1,647,181 1,706,361 1,845,422 - 21.0 - Jails........................................................ 1,776,172 1,855,917 1,938,826 2,107,385 2,376,202 - 33.8 - Dept. of Corrections & Rehabilitation3.... - - - - 7,694,114 - - - Youth Authority................................... 436,910 426,247 434,803 408,334 - - - - Department of Corrections.................. 4,830,848 5,236,507 5,730,188 6,260,553 - - - -Source: State of California Governor's Budget and the Controller of the State of California.Notes: Dash indicates that data are not available. Because 2006/07 data are not available, percent changes have been calculated for the four-year period, 2001/02 to 2005/06, only. Expenditure data for the Department of Justice and state regulatory agencies are not included.a The 2006/07 data were not available from the Controller of the State of California in time for inclusion in this publication.1 Expenditures include salaries and employee benefits, services, and supplies.2 Includes expenditures related to the administration of justice not reported in any other category to the Controller of the State of California.3 In July 2005, the Department of Corrections and the California Youth Authority were consolidated into the Department of Corrections and Rehabilitation.

162
Table 52Criminal JUSTiCe fUll-Time PerSonnel, 1969-2007
By Type of Agency
Year(s)Total
personnelLaw
enforcement Prosecution1Public
defense Courts Corrections2007............... 210,797 121,305 10,179 4,137 1,972 73,2042006............... 209,768 116,128 9,619 3,924 1,922 78,175
2005............... 201,589 113,604 9,297 3,790 1,917 72,9812004............... 196,922 112,826 9,166 3,733 1,915 69,2822003............... 199,784 114,945 9,480 3,788 1,915 69,6562002............... 200,219 115,552 10,069 3,773 1,913 68,9122001............... 200,837 108,208 17,296 3,686 1,906 69,741
2000............... 194,377 103,579 18,481 3,950 1,880 66,4871999............... 190,362 102,769 16,476 3,857 1,880 65,3801998............... 183,998 98,495 15,876 3,651 1,868 64,1081997............... 176,865 96,322 14,826 3,622 1,844 60,2511996............... 169,917 94,207 12,548 3,533 1,809 57,820
1995............... 162,076 91,198 11,998 3,246 1,805 53,8291994............... 155,267 86,933 11,461 3,224 1,817 51,8321993............... 151,663 85,989 10,324 3,278 1,762 50,3101992............... 149,183 87,020 10,272 3,220 1,763 46,9081991............... 150,737 88,628 10,027 3,255 1,745 47,082
1990............... 146,119 86,814 9,984 3,104 1,710 44,5071989............... 138,803 83,807 8,955 3,040 1,719 41,2821988............... 124,016 72,586 8,251 2,822 1,613 38,7441987............... 125,642 77,015 8,334 2,390 1,589 36,3141986............... 120,116 75,437 8,470 2,270 1,540 32,399
1985............... 115,091 73,582 8,072 2,163 1,502 29,7721984............... 110,640 74,536 7,686 2,013 1,473 24,9321983............... 107,131 72,618 7,460 1,987 1,451 23,6151982............... 105,001 71,352 7,407 1,972 1,410 22,8601981............... 102,350 69,420 7,184 1,929 1,393 22,424
1980............... 101,808 67,321 7,272 1,893 1,352 23,9701979............... 97,687 65,120 6,916 1,766 1,302 22,5831978............... 97,604 64,928 6,806 1,782 1,276 22,8121977............... 98,867 65,971 6,809 1,784 1,269 23,0341976............... 96,475 64,060 6,183 1,680 1,278 23,274
1975............... 94,743 64,177 4,875 1,574 1,266 22,8511974............... 90,684 62,020 4,352 1,559 1,215 21,5381973............... 86,956 59,697 4,439 1,385 1,213 20,2221972............... 83,626 58,028 3,428 1,236 1,186 19,7481971............... 81,782 57,099 3,227 1,120 1,160 19,176
1970............... 77,887 55,320 2,506 929 1,105 18,0271969............... 72,853 51,104 2,786 914 1,084 16,965 Notes: Law enforcement personnel counts do not include state police, UC Lawrence-Livermore Lab, or Bay Area Rapid Transit for 1969-1971. Additionally, state police and UC Lawrence-Livermore Lab did not report in 1972 and 1973. Personnel in the Department of Justice and state regulatory agencies are not included.1The passage of Assembly Bill 196 required that county-level child support programs, previously administered by district attorneys, be operated by local child support agencies. This accounts for the large decrease in prosecution personnel since 2001.

163
Table 53Criminal JUSTiCe fUll-Time PerSonnel, 2002-2007
By Type of Agency and Personnel Classification
Type of agencyand
personnel classification2002 2003 2004 2005 2006 2007
Percent change2002- 2006-2007 2007
Total1..............................................................
Law enforcement.........................................
Prosecution.................................................. Attorneys................................................... Investigators............................................. Clerical and all other.................................
Public defense............................................. Attorneys................................................... Investigators............................................. Clerical and all other.................................
Courts.......................................................... Judgeship................................................. Auxiliary2...................................................
Corrections.................................................. Probation departments............................. Probation officers.................................. All other................................................. Dept. of Corrections & Rehabilitation3...... Department of Corrections..................... Youth Authority......................................
200,219
115,552
10,0693,8721,6994,498
3,7732,294
510969
1,9131,498
415
68,91218,8149,2469,568
-45,0245,074
199,784
114,945
9,4803,7851,6634,032
3,7882,300
4791,009
1,9151,498
417
69,65619,5779,451
10,126-
45,3584,721
196,922
112,826
9,1663,7151,6123,839
3,7332,263
4581,012
1,9151,498
417
69,28218,2118,9049,307
-46,7934,278
201,589
113,604
9,2973,8011,5663,930
3,7902,325
4621,003
1,9171,498
419
72,98118,7439,1179,626
-50,2733,965
209,768
116,128
9,6193,9041,6374,078
3,9242,407
4771,040
1,9221,498
424
78,17519,5669,469
10,09758,609
--
210,797
121,305
10,1794,1151,7774,287
4,1372,526
5041,107
1,9721,548
424
73,20419,8829,8919,991
53,322--
5.3
5.0
1.16.34.6
-4.7
9.610.1-1.214.2
3.13.32.2
6.25.77.04.4
---
0.5
4.5
5.85.48.65.1
5.44.95.76.4
2.63.30.0
-6.41.64.5
-1.0-9.0
--
Sources: Law enforcement, district attorney, public defender, and probation personnel surveys (CJSC); Annual Report of the Administrative Office of the California Courts(California Judicial Council); and the State of California's Governor's Budget .
Notes: Personnel in the Department of Justice and state regulatory agencies are not included. Dash indicates that data are not available.1 Law enforcement personnel counts are obtained from a one-day survey taken on October 31. All other personnel survey counts are taken on June 30. Court and Department of Corrections and Rehabilitation personnel are fiscal year counts obtained from the Governor's Budget .2 Includes court commissioners and referees.3 In July 2005, the Department of Corrections and the California Youth Authority were consolidated into the Department of Corrections and Rehabilitation.

164
Table 54laW enforCemenT fUll-Time PerSonnel, 2002-2007
By Type of Agency
Type of agency 2002 2003 2004 2005 2006 2007Percent change2002- 2006-2007 2007
TotalTotal...................................................... 115,552 114,945 112,826 113,604 116,128 121,305 5.0 4.5
Sworn and civilian Sworn...………................................... Civilian...……...…..............................
75,61239,940
75,33639,609
73,95138,875
74,44539,159
75,62540,503
78,72442,581
4.16.6
4.15.1
Agency Police departments............................ 53,848 54,035 53,022 53,701 54,681 55,941 3.9 2.3 Sworn..............…………................. 38,071 38,224 37,663 38,367 38,642 39,753 4.4 2.9 Civilian........................………......... 15,777 15,811 15,359 15,334 16,039 16,188 2.6 0.9
Sheriffs' departments......................... 48,289 47,422 46,353 46,535 48,136 51,021 5.7 6.0 Sworn.................…..………............ 28,435 27,515 26,904 26,740 27,795 29,146 2.5 4.9 Civilian..................…………............ 19,854 19,907 19,449 19,795 20,341 21,875 10.2 7.5
California Highway Patrol.................. 10,317 10,202 10,082 9,978 9,901 10,975 6.4 10.8 Sworn.................………….............. 6,847 7,249 7,065 6,953 6,807 7,469 9.1 9.7 Civilian..................………............... 3,470 2,953 3,017 3,025 3,094 3,506 1.0 13.3
Other law enforcement agencies1....... 3,098 3,286 3,369 3,390 3,410 3,368 8.7 -1.2 Sworn..........………......................... 2,259 2,348 2,319 2,385 2,381 2,356 4.3 -1.0 Civilian..........……………................ 839 938 1,050 1,005 1,029 1,012 20.6 -1.7Source: Law Enforcement Personnel Survey conducted by CJSC: A one-day survey taken October 31.Note: Personnel in the Department of Justice and state regulatory agencies are not included.1 The "Other law enforcement agencies" category includes personnel from University of California, UC Lawrence-Livermore Lab, State Parks and Recreation, California State University, and Bay Area Rapid Transit.
Table 55Criminal JUSTiCe fUll-Time PerSonnel, 2002-2007
By Type of Agency
Type of agency 2002 2003 2004 2005 2006 2007Number Percent Number Percent Number Percent Number Percent Number Percent Number Percent
Total................................. 200,219 100.0 199,784 100.0 196,922 100.0 201,589 100.0 209,768 100.0 210,797 100.0
Law enforcement........... 115,552 57.7 114,945 57.5 112,826 57.3 113,604 56.4 116,128 55.4 121,305 57.5 Prosecution................... 10,069 5.0 9,480 4.7 9,166 4.7 9,297 4.6 9,619 4.6 10,179 4.8 Public defense............... 3,773 1.9 3,788 1.9 3,733 1.9 3,790 1.9 3,924 1.9 4,137 2.0 Courts............................ 1,913 1.0 1,915 1.0 1,915 1.0 1,917 1.0 1,922 0.9 1,972 0.9 Corrections.................... 68,912 34.4 69,656 34.9 69,282 35.2 72,981 36.2 78,175 37.3 73,204 34.7Note: Percentages may not add to 100.0 because of rounding.
.

165
Table 56CiTiZenS' ComPlainTS aGainST PeaCe offiCerS, 1981- 2007
Type of Complaint and Level of Criminal Complaint
Year(s) TotalReported1 Sustained
Non-criminalReported Sustained
CriminalTotal
Reported SustainedFelony
Reported SustainedMisdemeanor
Reported Sustained2007a............ 24,358 1,735 23,460 1,638 898 97 401 27 497 702006.............. 21,620 1,688 19,957 1,572 1,663 116 1,122 46 541 70
2005.............. 21,653 2,143 19,851 2,020 1,802 123 1,283 37 519 862004.............. 20,609 2,053 18,782 1,932 1,827 121 1,154 41 673 802003.............. 20,937 1,992 19,267 1,841 1,670 151 1,035 47 635 1042002.............. 21,970 2,574 20,259 2,405 1,711 169 1,015 61 696 1082001.............. 22,455 2,688 20,377 2,523 2,078 165 1,373 52 705 113
2000.............. 23,395 2,395 21,470 2,166 1,925 229 1,217 54 708 1751999.............. 19,034 2,549 17,802 2,307 1,232 242 604 94 628 1481998.............. 17,483 2,706 15,902 2,433 1,581 273 890 115 691 1581997.............. 16,966 2,458 15,702 2,240 1,264 218 601 75 663 1431996.............. 19,376 2,728 17,865 2,439 1,511 289 646 93 865 196
1995.............. 19,233 3,340 17,470 2,968 1,763 372 798 152 965 2201994.............. 19,629 2,860 18,291 2,576 1,338 284 490 101 848 1831993.............. 18,931 2,555 17,070 2,315 1,861 240 739 97 1,122 1431992.............. 17,468 2,769 15,723 2,459 1,745 310 782 110 963 2001991.............. 16,467 2,632 15,063 2,377 1,404 255 544 89 860 166
1990.............. 14,755 2,754 13,343 2,459 1,412 295 493 86 919 2091989.............. 14,855 2,759 13,388 2,491 1,467 268 603 98 864 1701988.............. 13,817 2,438 12,363 2,148 1,454 290 605 115 849 1751987.............. 14,180 2,244 13,334 2,077 846 167 251 57 595 1101986.............. 12,811 2,412 12,083 2,252 728 160 245 49 483 111
1985.............. 13,999 2,839 13,172 2,593 827 246 290 97 537 1491984.............. 12,875 2,357 12,137 2,204 738 153 223 49 515 1041983.............. 12,008 2,353 11,321 2,194 687 159 228 75 459 841982.............. 11,599 2,092 10,156 1,854 1,443 238 322 40 1,121 1981981.............. 8,686 1,552 8,081 1,450 605 102 188 42 417 60Notes: Data collection began in 1981. Because of the individual nature of the requirements of Penal Code section 832.5(a), reporting definitions and procedures vary among reporting agencies. The data collected under Penal Code section 13012(e) are accurate and complete to the extent that the contributing agency or agencies met reporting obligations. 1 Based on a survey conducted in 2004, it is estimated that complaints from inmates in prisons and jails may constitute approximately one-third of all complaints reported by law enforcement agencies.a The increase in the number of reported non-criminal complaints and the decrease in the number of reported felony complaints are substantially impacted by reporting policy changes made by two law enforcement agencies.

166
Table 57DomeSTiC ViolenCe-relaTeD CallS for aSSiSTanCe, 1986-2007
Type of Call and Weapon
Year(s)
Total calls Type of weapon1
Total
Caseswithout
a weapon
Casesinvolvinga weapon Total Firearm
Knifeor cutting
instrument
Otherdangerous
weaponPersonal
2weaponNot
reported3
2007.......... 174,649 105,227 69,422 69,422 1,027 3,442 10,940 54,013 02006.......... 176,299 95,353 80,946 80,946 1,277 3,662 11,953 64,054 0
2005.......... 181,362 88,335 93,027 93,027 1,233 3,700 12,867 75,227 02004.......... 186,439 88,703 97,736 97,736 1,193 4,028 13,054 79,461 02003……… 194,288 87,557 106,731 106,731 1,380 4,027 14,194 87,130 02002a......… 196,569 76,710 119,859 119,859 1,528 4,091 15,295 98,945 02001.......... 198,031 61,665 136,366 136,366 1,325 4,213 15,557 115,271 0
2000.......... 196,880 61,724 135,156 135,156 1,441 4,363 15,048 114,304 01999b .......... 186,406 58,611 127,795 127,795 1,520 4,237 13,929 108,109 01998b .......... 196,832 60,174 136,658 136,658 1,921 4,422 15,535 114,780 01997b .......... 220,156 64,506 155,650 155,650 2,073 5,462 17,502 130,613 01996.......... 227,899 68,824 159,075 159,075 2,327 5,868 16,474 134,406 0
1995c......... 246,315 72,016 174,299 174,299 2,838 6,370 16,385 148,706 01994.......... 250,439 68,199 182,240 182,240 3,089 6,491 16,716 155,944 01993.......... 238,895 65,635 173,260 173,260 2,951 6,273 15,366 148,670 01992.......... 240,826 65,473 175,353 175,353 3,053 6,507 14,518 151,275 01991.......... 203,638 55,083 148,555 148,555 3,129 5,423 12,008 127,958 37
1990.......... 195,019 54,079 140,940 140,940 2,610 5,417 10,879 117,693 4,3411989.......... 188,581 52,512 136,069 136,069 2,730 5,276 9,935 113,907 4,2211988.......... 182,540 54,345 128,195 128,195 2,532 5,048 9,634 110,068 9131987.......... 181,112 57,232 123,880 123,880 2,704 4,865 8,228 107,055 1,0281986d......... 83,661 27,818 55,843 55,843 1,255 2,293 4,062 47,778 4551 Penal Code section 13730 does not require that the type of weapon involved in a domestic violence-related call be reported.2 Hands, feet, etc.3 Prior to 1989, the "personal weapon" category was not recognized by all reporting agencies as a type of weapon. When those agencies began reporting personal weapon calls as cases involving weapons, they did not provide the type of weapon designation. This accounts for the large increase in "not reported" weapons in 1989 and 1990.a In April 2002, law enforcement agencies were instructed to report personal weapons only if the assault resulted in an injury (aggravated assault).b The San Francisco Police Department was unable to provide complete data for 1997, and did not report data for 1998 and 1999 due to computer problems. In 1996, 6,422 domestic violence-related calls for assistance were reported by this department.c The Oakland Police Department was unable to provide 1995 data. In 1994, 5,237 domestic violence-related calls for assistance were reported by this ded Data collection began in July 1986; therefore, only six months of data are available and displayed for 1986.
partment.

167
Table 58PoPUlaTion eSTimaTeS, 1966-2007
Year(s) Totalpopulation
Population at riskTotal1 Adult2 Juvenile3
2007................ 37,771,431 29,558,540 24,902,100 4,656,4402006................ 37,444,385 29,236,911 24,731,088 4,505,823
2005................ 37,004,661 28,809,579 24,316,140 4,493,4392004................ 36,590,814 28,357,204 23,906,564 4,450,6402003................ 35,934,000 27,815,344 23,295,523 4,519,8212002................ 35,301,000 27,302,433 22,927,383 4,375,0502001................ 34,758,000 26,745,137 22,555,739 4,189,398
2000................ 34,480,000 26,203,950 22,198,297 4,005,6531999................ 34,036,000 25,711,892 21,855,190 3,856,7021998................ 33,494,000 25,263,064 21,498,170 3,764,8941997................ 32,957,000 25,760,375 21,934,916 3,825,4591996................ 32,383,000 25,554,242 21,825,735 3,728,507
1995................ 32,063,000 25,122,782 21,505,839 3,616,9431994................ 32,140,000 24,703,379 21,193,571 3,509,8081993................ 31,742,000 24,334,534 20,923,632 3,410,9021992................ 31,300,000 23,975,578 20,661,120 3,314,4581991................ 30,646,000 23,585,168 20,356,984 3,228,184
1990................ 29,557,836 23,178,961 20,027,633 3,151,3281989................ 28,771,207 22,524,392 19,451,763 3,072,6291988................ 28,060,746 21,969,953 18,885,349 3,084,6041987................ 27,388,477 21,483,563 18,378,758 3,104,8051986................ 26,741,621 21,009,362 17,903,122 3,106,240
1985................ 26,112,632 20,563,314 17,468,941 3,094,3731984................ 25,587,254 20,167,923 17,083,479 3,084,4441983................ 25,075,581 19,860,746 16,763,095 3,097,6511982................ 24,546,566 19,510,945 16,415,571 3,095,3741981................ 24,038,711 19,172,812 16,082,355 3,090,457
1980................ 23,668,145 18,824,197 15,778,999 3,045,1981979................ 23,255,000 18,371,691 15,323,376 3,048,3151978................ 22,839,000 18,012,901 14,916,032 3,096,8691977................ 22,350,000 17,619,453 14,470,680 3,148,7731976................ 21,935,000 17,269,884 14,080,872 3,189,012
1975................ 21,537,000 16,914,556 13,694,793 3,219,7631974................ 21,173,000 16,563,671 13,339,906 3,223,7651973................ 20,868,000 16,237,031 13,031,007 3,206,0241972................ 20,585,000 15,926,249 12,758,809 3,167,4401971................ 20,346,000 15,657,238 12,542,795 3,114,443
1970................ 20,039,000 15,378,312 12,339,580 3,038,7321969................ 19,856,000 14,697,200 11,657,600 3,039,6001968................ 19,554,000 14,379,400 11,403,700 2,975,7001967................ 19,478,000 14,065,700 11,159,800 2,905,9001966................ 19,132,000 13,696,700 10,872,500 2,824,200Source: Population estimates were provided by the Demographic Research Unit, California Department of Finance.1 Total population at risk, 10-69 years of age.2 Adult population at risk, 18-69 years of age.3 Juvenile population at risk, 10-17 years of age.

Appendices

DaTa CHaraCTeriSTiCS anD KnoWn limiTaTionS
170 CRIME IN CALIFORNIA, 2007
CrimeSUniform Crime reporting Program (UCr)
Crime data from the UCR Program have been published continuously for 55 years. Data are available from 1952 to 2007.
The number of reported homicide, rape, and aggravated assault crimes represents known victims, while for robbery, burglary, larceny-theft, motor vehicle theft, and arson, the number represents known incidents.
If multiple crimes occur during the same event, only the most serious (based upon a hierarchy) is counted. Arson is the exception.
In 2003, larceny-theft over $400 was added to the property crime category to provide a more representative depiction of crime in California. A 1983 California law raised the lower limit of felony theft from $200 to $400. Therefore, data for larceny-theft over $400 have only been available since 1983. Caution should be used when comparing current data to pre-1983 property crime data.
Prior to 2006, the Los Angeles Police Department had included child abuse and domestic violence simple assaults in their aggravated assault statistics.
arreSTSmonthly arrest and Citation register (maCr)
Arrest data from the MACR reporting system date back to 1957. Prior to 1957, only adult felony arrest data were available.
If a person is arrested for multiple offenses, MACR selects only the most serious offense, based on the severity of possible punishment.
Felony arrest counts may include some misdemeanor warrants for felony offenses.
Thesubjectivityof the classificationand labelingprocessmust be considered in the analysis of race/ethnic group data.
Beginning in 2004, the population category of "other" for race/ethnic group includes the Department of Finance's race/ethnic group of "multi-racial."
TheBakersfieldPoliceDepartmentwasunabletoprovidearrest data for February through December 1995. The Oakland Police Department was unable to provide any arrest data for 1995. Estimates by both agencies were added to the 1995 statewide totals for publication trend tables.
aDUlT felonY arreST DiSPoSiTionSoffender-Based Transaction Statistics (oBTS)
Disposition data from the OBTS system are available from 1975. The OBTS system, which began with a 25 percent sample in four counties in 1973, became operational on a statewide basis in 1975. All 58 counties were reporting by 1978.
OBTS data are grouped by the year of disposition regardless of the year in which the arrest occurred.
Adult Felony Arrest Disposition data represent final dispositions equal to approximately 65-75 percent of the total adult felony arrests made during a calendar year.
Onlythefinaldispositionofanarresteventisselectedforstatistical purposes. Intermediate dispositions (diversion programs, suspended proceedings, reopenings, retrials, or subsequent actions) are not included in OBTS data.
If a person is arrested for multiple offenses, OBTS selects only the most serious offense, based on the severity of possible punishment. If there are multiple court dispositions, OBTS selects the most serious court disposition and the associated offense.
OBTS data on state institutional commitments may vary from information compiled and reported by other state agencies because of differences in the data collection systems and criteria.
The OBTS file includes some persons whose age atarrest was under 18. These minors received a final disposition in adult court under provisions of the Welfare and Institutions Code sections 602, 707(a), 707(b), 707(c), and 707.1(a).
2002 OBTS data for convictions by type of offense are not available due to a procedural change that allowed a large percentage of convictions to be incorrectly recorded as "all other offenses." This caused "violent," "property," and "drug" offenses to be under-recorded and "all other offenses" to be over-recorded.
The 2002 report filewas created inMay 2004; the 2003reportfileinOctober2004;the2004reportfileinJanuary2006; the 2005 report file inApril 2006; the 2006 reportfile inApril 2007; and the2007 report file inApril 2008.
CRIME IN CALIFORNIA, 2007

DATA LIMITATIONS 171
Expenditure data for 2006/2007 were not available from the Office of the State Controller in time for inclusion inthis publication.
The 1996 data collection survey forms were revised in an attempt to collect counts on the number of criminal justice personnel employed by prosecutors, public defenders, and probation departments, regardless of the funding source. Prior to 1996, counts excluded state- and federally-funded positions.
CiTiZenS' ComPlainTS aGainST PeaCe offiCerS
Data on Citizens' Complaints Against Peace Officers have been collected since 1981. Data are available in a statewide total only.
Because of the nature of the requirements of Penal Code section832.5,reportingdefinitionsandproceduresmayvaryamong individual reporting agencies.
Based on a survey conducted in 2004, it is estimated that complaints from inmates in prisons and jails may constitute approximately one-third of all complaints reported by law enforcement agencies.
In 2007, two law enforcement agencies implemented new reporting policies, substantially impacting the number of reported non-criminal and felony complaints.
DomeSTiC ViolenCe
Reporting of Domestic Violence-Related Calls for Assistance began in July 1986. The first full year ofreporting was 1987.
Thedefinitionof "domesticviolence" issubject tovaryinginterpretations by law enforcement agencies. As a result, different types of domestic relationships are included in the database.
San Francisco Police Department did not report data from April 1997 to December 1999.
Included in the data are any cases which resulted in a report being written by the responding law enforcement agencies. Data, therefore, include both cases where an arrest was made and those where circumstances did not warrant an arrest.
In April 2002, law enforcement agencies were instructed to report personal weapons (hands, fists, or feet) onlyif the assault resulted in an injury (aggravated assault). This corresponds to a notable decrease in the number of personal weapons reported.
aDUlT CorreCTionS
Adult corrections data are compiled from a number of sources and are complete from 1966. State supervision data are available from 1960, and state institutional data are available from 1952.
The source for county and city jail data is the Corrections StandardsAuthority (CSA), "JailProfileSurvey,"which isbased on type II, III, and IV facilities only. Some juveniles may be included.
Jail counts may not add to the total due to projections and rounding of numbers made by the CSA.
Probation data include adults placed on supervised probation only. Court probation, diversion, and summary probation are not included.
Persons are counted once for each jurisdiction. Therefore, data include original grants of probation and do not include subsequent grants of probation to persons already under probation supervision ordered by the same level court in the same county. Also, the probationers under jurisdiction of both superior and lower courts (or unified courts) andany who are jurisdictional cases of more than one county are counted more than one time in statewide totals.
From 2001 to 2005, San Francisco did not report adult probation data. San Francisco resumed reporting in 2006.
The following counties report all their adults on active probation for felony offenses: Contra Costa (2000–2007), Merced (2003–2007), Sacramento (2003–2007), Siskiyou (2000–2007), Tulare (2000–2007), and Yolo (2000–2007).
In addition to the California Rehabilitation Center (CRC), Civil Narcotic Addicts are also housed at 12 other facilities: Central California Women's Facility, California Institute for Men, California Institute for Women, Deuel Vocational Institution, High Desert State Prison, North Kern State Prison, San Quentin, Substance Abuse Treatment Facility, Valley State Prison, Wasco State Prison, California Correctional Institution, and RJ Donovan Correctional Facility.
Criminal JUSTiCe eXPenDiTUreS anD PerSonnel
Expenditure data are available from the 1967/68 fiscalyear, and personnel data are available from 1969.
The UCR definition specifies that law enforcement agencies should only report personnel paid by funds designated for law enforcement.
APPENDIX 1
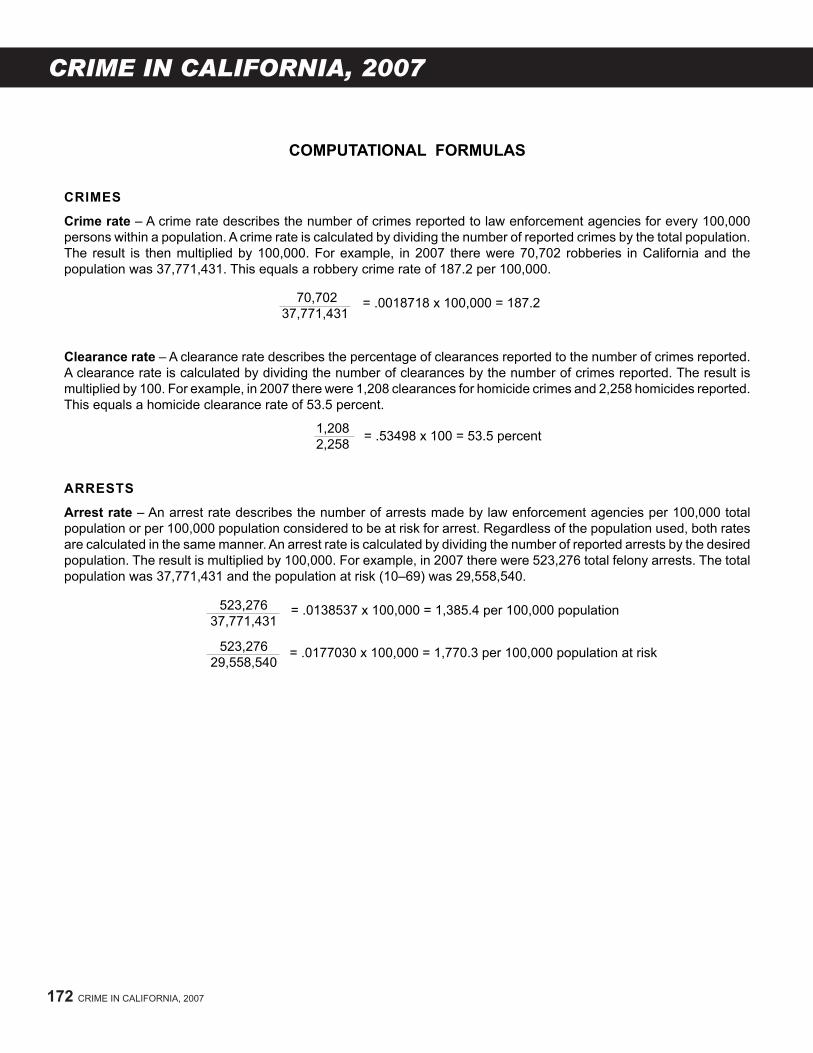
CrimeS
Crime rate – A crime rate describes the number of crimes reported to law enforcement agencies for every 100,000 persons within a population. A crime rate is calculated by dividing the number of reported crimes by the total population. The result is then multiplied by 100,000. For example, in 2007 there were 70,702 robberies in California and the population was 37,771,431. This equals a robbery crime rate of 187.2 per 100,000.
70,702 37,771,431
Clearance rate – A clearance rate describes the percentage of clearances reported to the number of crimes reported. A clearance rate is calculated by dividing the number of clearances by the number of crimes reported. The result is multiplied by 100. For example, in 2007 there were 1,208 clearances for homicide crimes and 2,258 homicides reported. This equals a homicide clearance rate of 53.5 percent.
1,2082,258
172 CRIME IN CALIFORNIA, 2007
= .0018718 x 100,000 = 187.2
= .53498 x 100 = 53.5 percent
arreSTS
arrest rate – An arrest rate describes the number of arrests made by law enforcement agencies per 100,000 total population or per 100,000 population considered to be at risk for arrest. Regardless of the population used, both rates are calculated in the same manner. An arrest rate is calculated by dividing the number of reported arrests by the desired population. The result is multiplied by 100,000. For example, in 2007 there were 523,276 total felony arrests. The total population was 37,771,431 and the population at risk (10–69) was 29,558,540.
523,27637,771,431
523,27629,558,540
= .0138537 x 100,000 = 1,385.4 per 100,000 population
= .0177030 x 100,000 = 1,770.3 per 100,000 population at risk
ComPUTaTional formUlaS
CRIME IN CALIFORNIA, 2007

FORMULAS 173
aDUlT CorreCTionS
adult correction rate – An adult correction rate describes the number of adults under supervision per 100,000 in the at-risk population. An adult correction rate is calculated by dividing the number of adults under supervision by the adult population at risk (18–69). The result is multiplied by 100,000. For example, in 2007 there were 729,928 adults under state and local supervision and the adult population at risk was 24,902,100. This equals an adult correction rate of 2,931.2 per 100,000 population at risk.
729,92824,902,100 = .0293119 x 100,000 = 2,931.2
aDDiTional informaTion
Percent change – A percent change describes the change in number or rate from one year to another. A percent change is calculated by subtracting the base-year data from the current-year data. The result is divided by the base-year data and multiplied by 100. For example, in 2007 the robbery crime rate was 187.2. In 2002 the robbery crime rate was 183.6. The percent change in rate from 2002 to 2007 is a 2.0 percent increase.
187.2 – 183.6183.6
Populations at risk – The Arrest section of this report includes three comparison populations: total (10–69 years of age), adult (18–69 years of age), and juvenile (10–17 years of age).
When a series of rates are calculated using different populations, the rate calculated for the total will not be equal to the sum of the rates for the parts. For example, the arrest rate calculated using the total at-risk population will not equal the sum of the juvenile arrest rate (based on the juvenile at-risk population) and the adult arrest rate (based on the adult at-risk population).
Also, the percent changes calculated for these at-risk rates cannot be added. This is because the percent change in the total arrest rate is the result of independent changes in both the number of arrests and the at-risk populations of adults and juveniles.
= .01960 x 100 = 2.0 percent
APPENDIX 2

174 CRIME IN CALIFORNIA, 2007
felonY-leVel arreST offenSeS
arreST offenSe CoDeSThefollowingstatutesandtheiroffensegroupingswerevalidatthetimeofthecloseoutofthe2007arrestoffensecodefile.Allstatutory codes listed are for Penal Code sections unless indicated as follows:BP - Business and Professions CodeCC - Corporations CodeEC - Education CodeFA - Food and Agriculture CodeFC - Financial CodeFG - Fish and Game Code
Homicide - 128, 187(a), 189, 192(a), 192(b), 193(a), 193(b), 273ab, 399, 12310(a) forcible rape - 220, 220(a), 220(b), 261, 261(a)(1), 261(a)(2), 261(a)(3), 261(a)(4), 261(a)(4)(a), 261(a)(4)(b), 261(a)(4)(c), 261(a)(4)(d), 261(a)(5), 261(a)(6), 261(a)(7), 262(a)(1), 262(a)(2), 262(a)(3), 262(a)(4), 262(a)(5), 264.1, 266c, 269(a), 269(a)(1), 269(a)(2), 288.7(a), 288.7(b), 664/261
robbery - 211, 212.5(a), 212.5(b), 212.5(c), 213(a)(1)(a), 213(b), 214, 215(a), 278.5(a), 664/211, 664/212.5(a), 664/212.5(b)
assault - 69, 71, 76(a), 95.1, 139(a), 140, 140(a), 146e(b), 148(b), 148(c), 148(d), 148(d)(1), 148.1(a), 148.1(b), 148.1(c), 148.1(d), 148.3(b), 148.4(b)(1), 148.4(b)(2), 148.10(a)*, 149, 151(a)(2), 186.26(a), 186.26(c), 203, 205, 206, 217.1(a), 217.1(b), 218, 219, 219.1, 219.2*, 222, 241.1, 241.4, 241.7, 242*, 242/243*, 243(c), 243(c)(1)*, 243(c)(2)*, 243(d), 243.1, 243.3*, 243.6*, 243.7, 243.9(a)*, 244, 244.5(b), 244.5(c), 245(a)(1)*, 245(a)(2)*, 245(a)(3), 245(b), 245(c), 245(d)(1), 245(d)(2), 245(d)(3), 245.2, 245.3, 245.5(a), 245.5(b), 245.5(c), 246*, 246.3(a)*, 247(a), 247(b), 247.5*, 273a(a), 273d(a), 273.5(a), 273.5(e)*, 347(a), 347(b), 368(a), 368(b)(1), 375(a)*, 375(d), 401, 405a, 405b, 417(b)*, 417(c), 417.1, 417.3, 417.6(a), 417.8, 422*, 422.7(a), 588a*, 601(a)(1), 601(a)(2), 625c, 664/187(a), 664/189, 1768.8(b), 1768.85(a)*, 1808.4(d), 4131.5, 4500, 4501, 4501.5, 6254.21(b) GC*, 11412, 11413(a), 11418(a)(1), 11418(a)(2), 11418(b)(1), 11418(b)(2), 11418(b)(3), 11418(b)(4), 11418(c), 11418(d)(1), 11418(d)(2), 11418.1*, 11418.5(a)*, 11419(a)*, 12303*, 12303.1(a), 12303.1(b), 12303.1(c), 12303.2, 12303.3, 12303.6, 12304*, 12305 HS, 12308, 12309, 12310(b), 12312, 12355(a), 12355(b), 15656(a), 21464(c) VC, 23110(b) VC, 38318(b) VC, 38318.5(b) VC
Kidnapping - 157, 207(a), 207(b), 207(c), 207(d), 208(b), 208(d), 209(a), 209(b), 209(b)(1), 209.5(a), 209.5(b), 210, 278, 278.5(a), 280(b), 4503
Burglary - 459*, 460, 460(a), 460(b)*, 461, 461.1, 461.2, 463(a), 464, 664/459, 664/460, 664/460(a), 664/460(b)
Theft - 72, 115(a), 115.5(b), 116, 117, 134, 154(b), 155(b), 155.5(b), 156, 166(c)(4)*, 182(a)(4), 304 HN, 305 HN, 332(a)*, 334(a)*, 337.7, 350(a)*, 350(a)(2)*, 350(b), 368(c)*, 368(d)*, 368(e)*, 424(a)(1), 424(a)(2), 424(a)(3), 424(a)(4), 424(a)(5), 424(a)(6), 424(a)(7), 463(b), 474, 481, 481.1(a), 483.5(a), 484(a)*, 484(b)*, 484b*, 484c, 484.1(a)*, 485*, 487, 487(a), 487a(a), 487a(b), 487b, 487(b)(1)(a), 487(b)(3), 487(c)*, 487(d), 487d, 487e, 487g, 489, 495, 496(a), 496a(a), 496(c), 496c*, 496(d)*, 496(d)(a), 496(e), 497, 498(d), 499c(b)(1), 499c(b)(2), 499c(b)(3), 499c(b)(4), 499d, 500*, 500(a)(1)*, 500(a)(2)*, 500(a)(3)*, 502(c)(1)(a), 502(c)(1)(b), 502(c)(2), 502(c)(4), 502(c)(5), 502(c)(6)*, 502(c)(7)*, 502.5*, 502.7(a)(1)*, 502.7(a)(2)*, 502.7(a)(3)*, 502.7(a)(4)*, 502.7(a)(5)*, 502.7(b)(1)*, 502.7(b)(2), 502.7(c)*, 502.7(d)*, 502.7(g), 502.8(a)*, 502.8(b)*, 502.8(c), 502.8(d), 502.8(e), 502.8(f), 503*, 504*, 504a*, 504b*, 505*, 506*, 506b, 507*, 508*, 514*, 528, 529, 529a*, 529.1, 529.2, 529.3, 530*, 530.5(a)*, 530.5(c)(3)*, 530.5(d)(1)*, 530.5(d)(2)*, 532(a)*, 532a(1)*, 532a(2)*, 532a(3)*, 532a(4)*, 533, 534, 535, 537(a)(2), 537(c)(2)*, 537e(a)(3), 538*, 538.5, 540, 541, 542, 543, 548(a), 549, 550(a)(1), 550(a)(2), 550(a)(3), 550(a)(4), 550(a)(5), 550(a)(6), 550(a)(7), 550(a)(8), 550(b)(1), 550(b)(2), 550(b)(3), 560, 560.4, 566, 571(b), 577, 578, 580, 581, 593d(b), 620, 648*, 650 BP, 664/487, 666, 1733 IC, 1778 LC, 1871.4(a)(1) IC, 1871.4(a)(2) IC, 1871.4(a)(3) IC, 2101(a)(1) UI, 2102(a) UI, 2107 UI, 2108 UI, 2110 UI, 2110.5 UI, 2114 UI, 2116(a) UI, 2116(b) UI, 2121 UI, 2255(b) CC, 2945.4(a) CI, 2945.4(g) CI*, 3215 LC, 3352 FC, 3361 FC, 3531 FC, 4463(a)(1) VC, 4463(a)(2) VC, 7027.3 BP, 7028.16 BP*, 10250.52 BP, 10752(a) VC, 10752(b) VC, 10801 VC, 10802 VC, 10803(a) VC, 10803(b) VC, 10855 VC*, 10980(b) WI, 10980(c)(2) WI, 10980(d) WI, 10980(g)(2) WI, 11010(a) BP, 11019(a) BP, 11022(a) BP, 11320 BP, 11482.5 WI, 11483 WI*, 11483.5 WI, 11760(a) IC, 11880(a) IC, 14014(a) WI*, 14025(a) WI, 14107 WI, 17410 WI, 17511.12(a) BP, 17551(a) FA, 17551(b) FA, 18848 FA*, 22430(a) BP, 22753(a) BP*, 25110 CC, 25401 CC, 25541 CC, 27443(a) GC, 27443(b) GC, 30475(b) RT, 30480 RT, 31110 CC, 31201 CC, 31410 CC, 31411 CC, 44209 HS, 94319.14(b) EC,
94320(f) EC, 94320(g) EC, 103800 HS
motor Vehicle Theft - 487(d), 666.5(a), 10851(a) VC, 10851(b) VC, 10851(e) VC
forgery, Checks, access Cards - 113, 114, 470(a), 470(b), 470(c), 470(d)*, 470a*, 470b, 471, 472, 473, 475, 475(a), 475(b), 475(c)*, 476, 476a(a), 476a(b)*, 477, 478, 479, 480, 480(a), 484e(a), 484e(b), 484e(c), 484e(d), 484e(e), 484f(a), 484f(b), 484f(c), 484g(a)*, 484g(b)*, 484h(a)*, 484i(b), 484i(c), 617, 664/470(a), 10980(e) WI
arson - 451(a), 451(b), 451(c), 451(d), 451.5(a), 451.5(a)(1), 451.5(a)(2)(a), 451.5(a)(3), 452(a), 452(b), 452(c), 453(a), 453(b), 454(a)(1), 454(a)(2), 455
Drug offenses
narcotics - 11350(a) HS, 11350(b) HS*, 11351 HS, 11351.5 HS, 11352(a) HS, 11352(b) HS, 11353(a) HS, 11353(b) HS, 11353(c) HS, 11354(a) HS
marijuana - 11357(a) HS, 11358 HS, 11359 HS, 11360(a) HS, 11361(a) HS, 11361(b) HS
Dangerous Drugs - 4060 BP*, 11353.5 HS, 11353.7 HS, 11370.1(a) HS, 11375(b) HS, 11375(b)(1) HS, 11377(a) HS, 11378 HS, 11378.5 HS, 11379(a) HS, 11379(b) HS, 11379.5(a) HS, 11379.5(b) HS, 11380(a) HS, 11550(e) HS
all other - 4324(a) BP*, 4324(b) BP*, 4336(a) BP, 11104(a) HS, 11106(j) HS*, 11152 HS, 11153(a)(1) HS, 11154(a) HS, 11154(b) HS, 11155 HS, 11156 HS, 11157 HS, 11162.5(a) HS, 11166 HS, 11173(a) HS*, 11173(b) HS, 11173(c) HS, 11173(d) HS, 11174 HS, 11355 HS*, 11363 HS, 11364.7(b) HS, 11366 HS*, 11366.5(a) HS, 11366.5(b) HS, 11366.6 HS, 11366.7(b) HS, 11366.8(a) HS, 11366.8(b) HS, 11368 HS*, 11370.6(a) HS, 11370.9(a) HS, 11370.9(b) HS, 11370.9(c) HS, 11371 HS, 11371.1 HS, 11379.6(a) HS, 11379.6(b) HS, 11382 HS*, 11383(a) HS, 11383(b) HS, 11383(c)(1) HS, 11383(c)(2) HS, 11383(f) HS, 11383(g) HS, 11390 HS, 11391 HS
Sex offenses
lewd or lascivious - 266j, 269(a)(4), 288(a), 288(b)(1), 288(b)(2), 288(c)(1)*, 288(c)(2)*, 288.5(a)
all other - 243.4(a), 243.4(b), 243.4(c)*, 243.4(d)*, 243.4(j), 261.5(a), 261.5(c), 261.5(d), 265, 266, 266a, 266b, 266d, 266e, 266f, 266g, 266h, 266h(a), 266h(b)(1), 266h(b)(2), 266i, 266i(a)(1), 266i(b)(1), 266i(b)(2), 267, 269(a)(3), 269(a)(5), 285, 286(a), 286(b)(1), 286(b)(2), 286(c)(1), 286(c)(2), 286(c)(3), 286(d), 286(e), 286(f), 286(g), 286(h), 286(i), 286(j), 286(k), 288a(a), 288a(b)(1), 288a(b)(2), 288a(c)(1), 288a(c)(2), 288a(c)(3), 288a(d)(1), 288a(d)(2), 288a(d)(3), 288a(e), 288a(f), 288a(f)(1), 288a(f)(2), 288a(f)(3), 288a(f)(4), 288a(g), 288a(h), 288a(i), 288a(j), 288a(k), 288.2(a)*, 288.2(b)*, 288.3, 288.3(a), 288.4(a)(2), 288.4(b), 289(a), 289(a)(1), 289(a)(2), 289(b), 289(c), 289(d), 289(d)(1), 289(d)(2), 289(d)(3), 289(d)(4), 289(e), 289(f), 289(g), 289(h), 289(i), 289(j), 289.6(a)*, 289.6(a)(2), 290(b)*, 290(f)(2)*, 290(g)(3), 290.002*, 290.010*, 290.011(a)*, 290.011(b)*, 290.011(c)*, 290.011(d)*, 290.011(f)*, 290.012(a)*, 290.012(b)*, 290.012(c)*, 290.013*, 290.014*, 290.015*, 290.018(b), 290.018(d)*, 290.018(f)*, 290.018(g)*, 311.1(a), 311.10(a)*, 311.11(a)*, 311.11(b), 311.2(a)*, 311.2(b), 311.2(c)*, 311.2(d), 311.3(a)*, 311.4(a)*, 311.4(b), 311.4(c), 311.5*, 311.7*, 313.1(a)*, 313.1(b)*, 313.1(c)(1)*, 314.1*, 647f, 647.6(a)(1)*, 647.6(a)(2)*, 647.6(b), 647.6(c)(1), 647.6(c)(2), 664/286(b)(1), 664/286(b)(2), 664/286(c), 664/286(d), 664/286(e), 729(a)*
Driving Under the Influence - 655(f) HN, 23153(a) VC, 23153(b) VC, 23153(d) VC, 23175(a) VC, 23175.5 VC, 23550(a) VC*, 23550.5 VC*, 23550.5(a) VC*
Hit-and-run - 20001(a) VC, 20001(b)(1) VC*, 20001(b)(2) VC*
GC - Government CodeHN - Harbors and Navigation CodeHS - Health and Safety CodeIC - Insurance CodeLC - Labor CodeMV - Military and Veterans Code
PR - Public Resources CodeRT - Revenue and Taxation CodeSH - Streets and Highways CodeUI - Unemployment Insurance CodeVC - Vehicle CodeWI - Welfare and Institutions Code
CRIME IN CALIFORNIA, 2007

CODES 175
notes: These codes are valid for 2007 data and may not be applicable for prior years. "All Other Felony Offenses" also includes sections in the Election Code and Water Code. "All Other Misdemeanor Offenses" also includes sections in the California Code of Regulations, City or County Ordinances, Civil Procedure Code, Election
Code, Public Utilities Code, Uniform Fire Code, and Water Code.*These code sections can be either a felony or a misdemeanor.
miSDemeanor-leVel arreST offenSeS
Weapons - 171b(a)(1), 171b(a)(2), 171b(a)(3), 171b(a)(4), 171b(a)(5), 171c, 171d(a)*, 171d(b)*, 186.28(a), 626.9(b)*, 626.9(d), 626.9(h), 626.9(i), 626.95(a)*, 626.10(a), 626.10(b)*, 4502(a), 4502(b), 8101(a) WI, 8101(b) WI, 8103(a)(1) WI, 8103(f)(1) WI, 12001.5, 12020(a)*, 12020(a)(1)*, 12020(a)(2)*, 12020(a)(3)*, 12020(a)(4)*, 12020(c)(7), 12020(c)(11), 12021(a)(1), 12021(b), 12021(c)(1), 12021(d)(1)*, 12021(e)*, 12021(g)(1)*, 12021.1(a), 12021.1(c), 12023(a)*, 12025(a)(1)*, 12025(a)(2)*, 12025(a)(3)*, 12025(b)(2), 12025(b)(4), 12025(b)(5)*, 12025(b)(6)(a)*, 12031(a)(1)*, 12031(a)(2)(a), 12031(a)(2)(b), 12031(a)(2)(c), 12031(a)(2)(f)*, 12034(b), 12034(c), 12034(d), 12035(b)(1), 12040(a), 12072(a)(1), 12072(a)(2)*, 12072(a)(3)(a)*, 12072(a)(4)*, 12072(a)(5)*, 12072(d), 12076(b)(1)*,
manslaughter-misd. - 191.5(b)*, 192(c)(1)*, 192(c)(2), 192.5(b), 192.5(c)*, 192.5(d), 193(c)(2)assault and Battery - 71*, 147, 148(a), 148(a)(1), 148.1(a)*, 148.10(a)*, 148.2.1, 148.2.2, 148.2.3, 148.2.4, 148.3(a), 148.4(a)(1), 148.4(a)(2), 151(a)(1), 219.2*, 240, 240/241, 240/242, 241(a), 241(b), 241.1*, 241.2(a), 241.3(a), 241.4, 241.6, 241/243, 242*, 242/243*, 243(a), 243(b), 243(c)(1)*, 243(c)(2)*, 243(d)*, 243(e)(1), 243.2(a), 243.2(a)(1), 243.25, 243.3*, 243.35(a), 243.4(c)*, 243.4(d)(1), 243.5(a)(1), 243.5(a)(2), 243.6*, 243.8, 243.8(a), 243.9(a)*, 245(a)(1)*, 245(a)(2)*, 246*, 246.3(a)*, 246.3(b), 247.5*, 248, 273a(b), 273d(a), 273.5(e)*, 368(b), 368(c), 374c, 375(a)*, 375(b), 375(c), 383, 402a, 417(a)(1), 417(a)(2), 417(b)*, 417.4, 417.25(a), 422*, 422.6(a), 423.2(a), 423.2(b), 1768.85(a)*, 2652, 11414(a), 11418(d)*, 11418.1*, 11418.5(a)*, 11419(a)*, 12304*, 12556(c), 12680 HS, 15656(b) WIBurglary - misd. - 459*, 460(b)*Petty Theft - 368(d)*, 368(e)*, 463(c), 484(a)*, 484(b)*, 484b*, 484.1(a)*, 485*, 487(c)*, 487c, 487f, 488, 490, 490.1(a), 490.5(a), 490.7(b)(1), 490.7(b)(2), 490.7(b)(3), 490.7(b)(4), 496c*, 502.5*, 530*, 530.5(a)*, 530.5(c)(1)*, 530.5(c)(3)*, 530.5(d)(1)*, 530.5(d)(2)*, 530.5(e), 532(a)*, 538*, 565, 8726 HS, 14014(a) WI*, 22435.2(a) BP, 22435.2(b) BP, 22435.2(c), 22435.2(e) BP, 22435.2(f) BP, 22435.11(a) BP, 22435.12 BP, 22753(a) BP*, 41950(a) PRother Theft - Includes approximately 200 statute codes that can be identifieduponrequest.Checks and access Cards - 112(a), 470a*, 470(d)*, 472, 475(c)*, 476a(b)*, 484e(a), 484e(b), 484g(a)*, 484g(b)*, 484h(a)*, 484i(a), 484jDrug offenses marijuana - 11357(a) HS*, 11357(b) HS, 11357(c) HS, 11357(d)
HS, 11357(e) HS, 11360(b) HS, 23222(b) VC other Drugs - 377, 647(f), 2241 BP, 2242.1(a) BP, 2762(e) BP,
2878.5(a) BP, 4051 BP, 4059(a) BP, 4060 BP*, 4140 BP, 4141 BP, 4142 BP, 4163 BP, 4323 BP, 4324(a) BP*, 4324(b) BP*, 4325(a) BP, 4326(a) BP, 4326(b) BP, 4331(a) BP, 4332 BP, 11100(g)(1) HS, 11100(g)(2) HS, 11100(g)(3) HS, 11100.1(a) HS, 11104(c) HS, 11104.5 HS, 11106(j) HS*, 11150 HS, 11159 HS, 11161(a) HS, 11162 HS, 11162.5(b) HS, 11170 HS, 11171 HS, 11172 HS, 11173(a) HS*, 11175 HS, 11180 HS, 11190 HS, 11207 HS, 11217 HS, 11350(b) HS*, 11352.1(b) HS, 11355 HS*, 11364 HS, 11364.7(a) HS, 11364.7(c) HS, 11365(a) HS, 11366 HS*, 11368 HS*, 11375(b)(2) HS, 11377(b)(1) HS, 11382 HS*, 11532(a) HS, 11550(a) HS, 11594 HS, 109575 HS, 109580 HS
indecent exposure - 314.1*, 314.2annoying Children - 261.5(b), 288a(b)(1), 288(c)(1)*, 288.4(a)(1), 647.6(a)(1), 647.6(a)(2)obscene matter - 288.2(a)*, 288.2(b)*, 311.10(a)*, 311(a), 311.1(a)*, 311.11(a), 311.2(a)*, 311.2(c)*, 311.3(a)*, 311.3(b), 311.3(b)(1), 311.3(b)(2), 311.3(b)(3), 311.3(b)(4), 311.3(b)(5), 311.3(b)(6), 311.4(a)*, 311.5*, 311.6, 311.7*, 313.1(a)*, 313.1(b)*, 313.1(c)(1)*, 313.1(c)(2), 313.1(e)lewd Conduct - 288(c)(2)*, 647(a), 647(d), 647(i), 647(k)(1), 647(k)(2), 653b(a)Prostitution - 315, 316, 647(b), 653.22(a), 25601 BPContribute to Delinquency of minor - 272, 272(b)(1)Drunk - 647(f)liquor laws - 172a, 172b.1, 172d.1, 172g.1, 172l, 303, 303a, 307, 347b, 397, 11200, 23220 VC, 23222(a) VC, 23224(a) VC, 23224(b) VC, 23300 BP, 23301 BP, 25177 BP, 25351 BP, 25602(a) BP, 25604 BP, 25606 BP, 25607(a) BP, 25608 BP, 25609 BP, 25612.5(c)(3) BP, 25617 BP, 25620 BP, 25631 BP, 25632 BP, 25657(a) BP, 25657(b) BP,
25658(a) BP, 25658(b) BP, 25658(c) BP, 25659.5(c) BP, 25659.5(d) BP, 25660.5 BP, 25661 BP, 25662(a) BP, 25663(a) BP, 25663(b) BP, 25664 BP, 25665 BP, 120305 HSDisorderly Conduct - 647, 647(c), 647(e), 647(h), 647(j), 647bDisturbing the Peace - 171f.2, 302(a), 403, 404(a), 404(b), 404.6(a), 404.6(c)*, 405, 406, 407, 408, 409, 415(1), 415(2), 415(3), 415.5(a)(1), 415.5(a)(2), 415.5(a)(3), 416(a), 602.10, 602.11(a), 626.2, 626.4(d), 626.6(a), 626.7(a), 626.8(a)(1), 626.8(a)(2), 626.8(a)(3), 626.81(a), 626.85(a)(1), 653c(a), 653m(a), 653m(b), 653m(c)(2), 653x(a), 727, 9051 GC, 11460(a)malicious mischief - 625b(a), 10750(a) VC, 10851.5 VC, 10852 VC, 10853 VC, 10854 VC, 28051.5 VCVandalism - 422.6(b), 423.2(e), 423.2(f), 555.1, 587a, 587.1(a), 588b, 590, 591.5, 592(a), 594(a)*, 594(a)(1)*, 594(b)(1)*, 594(b)(2)(a), 594(b)(3), 594(b)(4), 594.3(a)*, 594.35(a)*, 594.4(a)*, 603, 604, 605.1, 605.2, 605.3, 607, 615, 616, 618, 622, 622 1/2, 623(a), 623(a)(1), 623(a)(2), 623(a)(3), 623(a)(4), 623(a)(5), 623(a)(6), 640.5(b)(1), 640.5(c)(1), 640.8, 11411(a),11411(c)*, 23110(a) VC, 27491.3 GC, 38318(a) VC, 38319 VCTrespassing - 171f.1, 369g(a), 369i(a), 369i(b), 398 MV, 409.5(c), 554(a), 554(b), 554(c), 554(d), 554(e), 554(f), 554(g), 554(h), 554(i), 555, 558, 587b, 593b, 602, 602(a), 602(b), 602(c), 602(d), 602(e), 602(f), 602(g), 602(h)(1), 602(i), 602(j), 602(k), 602(l)(1), 602(l)(2), 602(l)(3), 602(l)(4), 602(m), 602(n), 602(o), 602(o)(1), 602(o)(2), 602(p), 602(q), 602(r), 602(s), 602(t), 602(u)(1), 602.1(a), 602.1(b), 602.4, 602.5, 602.5(a), 602.5(b), 602.6, 602.8(a), 627.2, 627.7(a)(1), 627.8, 1583 FG, 27174.2 SH, 32210 ECWeapons - 136.2(a)(7)(b)2, 171d(a)*, 171d(b)*, 171.5(c)(1), 171.5(c)(2), 171.5(c)(3), 171.5(c)(4), 171.5(c)(5), 171.5(c)(6), 171.5(c)(7), 171.5(c)(8), 171.5(c)(9), 171.5(c)(10), 171.5(c)(11), 171.5(c)(12), 468, 626.10(a)*, 626.10(b)*, 626.9(b)*, 626.95(a)*, 653k, 12001.1(a), 12020(a)*, 12020(a)(1)*, 12020(a)(2)*, 12020(a)(3)*, 12020(a)(4)*, 12020.1, 12020.5, 12021(d)(1)*, 12021(e)*, 12021(g)(1)*, 12021(g)(2), 12023(a)*, 12024, 12025(a)(1)*, 12025(a)(2)*, 12025(a)(3)*, 12025(b)(5)*, 12025(b)(6)(a)*, 12025(b)(6)(b), 12031(a)(1)*, 12031(a)(2)(f)*, 12034(a), 12035(b)(2), 12036(b), 12036(c), 12051(b), 12070(a), 12072(a)(2)*, 12072(a)(3)(a)*, 12072(a)(5)*, 12076(b)(1)*, 12082, 12094, 12094(a), 12101(a)(1)*, 12101(b)(1)*, 12125(a), 12280(b), 12303*, 12316(a), 12316(b)(1)*, 12316(c), 12403.7(a)*, 12403.7(a)(4), 12403.7(b)*, 12403.7(c)*, 12403.7(d)*, 12403.7(g)*, 12403.8(a), 12403.8(b), 12420, 12551, 12552(a), 12553, 12553(a)(1), 12553(b), 12582, 12590(a)(1), 12590(a)(2), 12651(a), 12651(b), 12651(c), 12651(d), 12652Driving Under the Influence - 655(b) HN, 655(c) HN, 655(e) HN, 23152(a) VC, 23152(b) VC, 23152(c) VC, 23152(d) VC, 23247(a) VC, 23247(b) VC, 23247(c) VC, 23247(d) VC, 23550(a) VC*, 23550.5 VC*, 23550.5(a) VC*Glue Sniffing - 380(a), 381(a), 381(b), 381b, 647(f)Hit-and-run - 20001(b)(1) VC*, 20001(b)(2) VC*, 20002(a) VC, 20002(a)(1) VC, 20002(a)(2) VC, 20002(b) VCJoy riding - 499b, 499b(a)Selected Traffic Violations - 23103(a) VC, 23103(b) VC, 23104(a) VC, 23109(a) VC, 23109(b) VC, 23109(c) VC, 23109(d) VC, 38316 VC, 38317 VC, 40508(a) VC, 40508(b) VC, 40508(c) VC, 40519 VC, 42006(e) VCGambling - 318, 319, 320, 321, 322, 323, 324, 326, 326.5(b), 326.5(n), 330, 330a, 330b(1), 330c, 330.1, 330.4, 331, 335, 336, 337s(b), 337.1, 337.2, 337.5, 11300, 19941(a)(1) BPnonsupport - 270*, 270a, 270c, 270.5(a), 270.6, 271aall other misdemeanor offenses
12090, 12091, 12101(a)(1)*, 12101(b)(1)*, 12220(a), 12220(b), 12280(a)(1), 12280(b), 12281(j), 12316(b)(1)*, 12320, 12321, 12403.7(a)*, 12403.7(a)(7), 12403.7(b)*, 12403.7(c)*, 12403.7(d)*, 12403.7(g)*, 12422, 12520escape - 107, 109, 110, 836.6(a)*, 836.6(b)*, 871(b) WI, 1026.4(a), 1152(b) WI, 1370.5(a), 1768.7(a) WI, 1768.7(b) WI, 2042, 3002 WI, 4011.7*, 4530(a), 4530(b), 4530(c), 4532(a)(1), 4532(a)(2), 4532(b)(1), 4532(b)(2), 4533, 4534, 4535, 4536(a), 4550.1, 4550.2, 7326 WIBookmaking - 337a.1, 337a.2, 337a.3, 337a.4, 337a.5, 337a.6, 337iall other felony offenses
APPENDIX 3

176 CRIME IN CALIFORNIA, 2007
aCQUiTTal: a judgment of a court, based either on the verdict ofajuryorajudicialofficer,thatthedefendantisnotguiltyofthe offense(s) for which he/she was tried.
aDJUDiCaTion: the formal hearing and settling of a case by judicial procedure.
aDUlT: a person 18 years of age or older.
aGGraVaTeD aSSaUlT: an unlawful attack by one person uponanotherforthepurposeofinflictingsevereoraggravatedbodily injury. This type of assault usually is accompanied by the use of a weapon or by means likely to produce death or great bodilyharm(UCRdefinition).
arreST: ". . . taking a person into custody, in a case and in the manner authorized by law. An arrest may be made by a peace officerorbyaprivateperson."(834PC)
arreST raTe: the number of arrests per 100,000 population. See computational formulas page for further explanation.
arSon: any willful or malicious burning or attempt to burn, with or without intent to defraud, a dwelling house, public building, motor vehicle or aircraft, personal property of another, etc. (UCR definition).
aUTomaTeD Criminal HiSTorY SYSTem (aCHS): a centralized, automated system containing criminal history summaryinformationonpersonsarrestedandfingerprintedinCalifornia.
aVeraGe DailY Jail PoPUlaTion: the average number of inmates housed in a local facility per day. The number includes inmates housed in single cells, double cells, dormitories (multiple occupancy cells), disabled housing, disciplinary segregation, and administrative segregation. The values reported are based upon each facility's "early morning" count. See Type I, II, III, and IV Facilities.
BUrGlarY: the unlawful entry of a structure to commit a felony oratheft.Attemptedburglaryisincluded(UCRdefinition).
California DeParTmenT of CorreCTionS anD reHaBiliTaTion (CDCr): the state agency that operates all state adult prisons and juvenile facilities, oversees a variety of community correctional facilities and other important correctional facility responsibilities, and supervises all adult and juvenile parolees during their reentry into society.
Criminal JUSTiCe GloSSarY
California reHaBiliTaTion CenTer (CrC): an institution operated by the California Department of Corrections and Rehabilitation, which is designated for the treatment of persons addicted to narcotics or in imminent danger of addiction. Commitment to the facility is by civil procedure only.
California DeParTmenT of THe YoUTH aUTHoriTY (CYa): the state agency which has jurisdiction over and maintains institutions as correctional schools for the reception of wards of the juvenile court and other persons committed from criminal courts. (Consolidated with the CDCR and renamed the Division of Juvenile Justice, July 2006.)
CaSeloaD: the total number of clients or cases on probation or under supervision with a given agency.
CHarGe: a formal allegation that a specific person hascommittedaspecificoffense.
CiTaTion: a written order, issued by the police for a violation, to appearbeforeamagistrateorprobationofficeratalaterdate.
CiVil CommiTmenT: a type of commitment in which criminal proceedings are suspended while a defendant undergoes treatment at the California Rehabilitation Center (CRC) as a narcotic addict.
ClearanCe: an offense is cleared or "solved" for crime reporting purposes when at least one person is arrested, charged with the commission of the offense, and turned over to the court for prosecution or cited to juvenile authorities. In certain situations a clearance may be counted by "exceptional means" whenthepolicedefinitelyknowtheidentityoftheoffender,haveenough information to support an arrest, and know the location of the offender but for some reason cannot take the offender into custody.
ClearanCe raTe: method used to determine the percentage of crimes cleared. The rate is based on the number of crimes reported.
ComBineD CaSeS: cases declined by the prosecutor in favor of other counts/cases.
CommiTmenT: a warrant, order, or process by which the courtdirectsajudicialofficertotakeapersontoacorrectionalfacility.
ComPlainT: averifiedwrittenaccusation,filedbyaprosecutingattorney with a local criminal court, which charges one or more persons with the commission of one or more offenses.
CRIME IN CALIFORNIA, 2007

GLOSSARY 177
DiSmiSSal:adecisionbyajudicialofficertoterminateacasewithout a determination of guilt or innocence.
DiSPoSiTion – CoUrT: an action taken as the result of an appearance in court by a defendant. Examples are: adults – dismissed, acquitted, or convicted and sentenced; juveniles – dismissed, transferred, remanded to adult court, placed on probation, or sentenced to a California Department of Corrections and Rehabilitation youth facility.
DiSPoSiTion – laW enforCemenT: an action taken as the result of an arrest. Examples of police dispositions are: adults - released by law enforcement, referred to another jurisdiction, or a misdemeanor or felony complaint sought; juveniles - handled within the department, referred to another agency, or referred to the probation department or juvenile court.
DiSPoSiTion – ProSeCUTor: an action taken as the result of complaints which were requested by the arresting agency. Dispositions include granting a misdemeanor or a felony complaint, or denying a complaint for such reasons as lackof corpus, lackof sufficient evidence, interest of justice,complainant refuses to testify, witness unavailable, inadmissible search,deferredparolerevocation,prefilingdeferralandother.
DiVerSion: a disposition of a criminal defendant either before adjudication or following adjudication but prior to sentencing, in which the court directs the defendant to participate in a work, educational, or rehabilitation program.
DiVerSion DiSmiSSeD: criminal charges dismissed after the successful completion of a diversion program.
DrUGS: see Controlled Substance.
felonY: a crime which is punishable with death or by imprisonment in the state prison (17 & 18 PC).
filinG: adocumentfiledwiththecourtclerkbyaprosecutingattorney alleging that a person committed or attempted to commit a crime.
fine: the penalty imposed upon a convicted person by a court requiringthepaymentofaspecifiedsumofmoney.
forCiBle raPe: the carnal knowledge of a female forcibly and against her will. Assaults or attempts to commit rape by forceorthreatofforceareincluded(UCRdefinition).
GranT: the act of placing an adult on probation.
ConTrolleD SUBSTanCe: a drug, substance, or immediate precursor which is included in Schedules I through V inclusive, as set forth in Health and Safety Code Sections 11054 through 11058. These would include heroin, marijuana, amphetamines, barbiturates, and psychedelics.
ConViCTion: a judgment, based either on the verdict of a jury orajudicialofficerorontheguiltypleaofthedefendant,thatthe defendant is guilty.
CorreCTionS: those agencies or facilities concerned with thecustody,confinement,supervision,ortreatmentofallegedor adjudicated offenders.
CorreCTionS STanDarDS aUTHoriTY (CSa): the division within the CDCR which develops and maintains standards for the construction and operation of local jail and juvenile detention facilities (formerly the Board of Corrections).
CoUrT: an agency of the judicial branch of government, authorized or established by statute or constitution, having one ormorejudicialofficersonitsstaff.Acourthastheauthoritytodecide upon controversies in law and disputed matters of fact brought before it. Because of court consolidation we no longer distinguish between lower court and superior court.
CrC: see California Rehabilitation Center.
Crime: ". . . an act committed or omitted in violation of a law forbidding or commanding it. . ." (15 PC).
Crime raTe: the number of reported crimes per 100,000 general population. See computational formulas page in Appendix 2 for further explanation.
Criminal CommiTmenT: a type of commitment which results when a defendant is sentenced to an adult prison or juvenile facility overseen by the California Department of Corrections and Rehabilitation.
CYa: see California Department of the Youth Authority.
DefenDanT: a person against whom a criminal proceeding is pending.
DeferreD Parole reVoCaTion: action taken by a prosecutor to revoke the parole status of an offender to return thesubjecttostateprisoninlieuoffilingnewcharges.
DelinQUenT aCTS: those acts described under Welfare and Institutions Code section 602 which involve violations by a juvenileofanylaworordinancedefiningcrime,ortheviolationof a court order of the juvenile court.
APPENDIX 4

178 CRIME IN CALIFORNIA, 2007
GUilTY Plea: a defendant's formal answer in open court to charge(s) in a complaint, indictment, or information stating that the charge(s) is true and that he/she has committed the offense(s) as charged.
HomiCiDe: the willful (nonnegligent) killing of one human being by another. Murder and nonnegligent manslaughter are included (UCRdefinition).
infraCTion:anoffensepunishablebyfineorotherpenalty,but not by incarceration.
Jail: a county or city facility for incarceration of sentenced and unsentenced persons. See Type I, II, III, and IV Facilities.
JUriSDiCTion: the territory, subject matter, or person over which lawful authority may be exercised.
JUVenile: a person under the age of the 18.
larCenY-THefT: the unlawful taking, carrying, leading, or riding away of property from the possession or constructive possession of another (except embezzlement, fraud, forgery, andworthlesschecks)(UCRdefinition).
loCal SUPerViSion: local correctional agencies provide confinement, rehabilitation, and probation services for thosesentenced to their care and also house persons awaiting trial or sentencing.
miSDemeanor: a crime punishable by imprisonment in a county jail for up to one year.
monTHlY arreST anD CiTaTion reGiSTer (maCr): a reporting system used to collect information on adult and juvenile arrests and citations by police and sheriffs' departments. This register contains data on arrest offenses, arrestee characteristics (age, gender, and race/ethnic group), and law enforcement dispositions.
moTor VeHiCle THefT: the theft or attempted theft of a motorvehicle(UCRdefinition).
noT aGGraVaTeD (SimPle) aSSaUlT: assaults and attempted assaults where no weapon is used and which do not result in serious or aggravated injury to the victim (UCR definition).
offenDer-BaSeD TranSaCTion STaTiSTiCS (oBTS): a system designed to collect statistical information on the various processes within the criminal justice system that occur between thepointofthefelonyarrestofanadultandthepointoffinaldisposition.
offenSe: the charged offense is the crime for which the defendantwasarrestedorfiledonbythedistrictattorney.Theconvicted offense is the offense the defendant was convicted of or pled guilty to in court. The sustained offense is the offense for which the juvenile court sustains a petition.
oUTPaTienT: a period of supervision following release from the California Rehabilitation Center (CRC).
Parole: an added period of control following release from prison (3000(a) PC).
Parole ViolaTion: violation of one or more of the conditions of parole or an illegal act for which parole is revoked rather than proceeding with criminal prosecution. See Deferred Parole Revocation.
PC (Penal CoDe): the California Penal Code contains statutesthatdefinecriminaloffensesandspecifycorrespondingpunishments along with criminal justice system mandates and procedures.
PeTiTion To reVoKe ProBaTion: action taken by a prosecutor to revoke the probation status of an offender to return the subject to county jail or state prison.
PoPUlaTion aT riSK: that portion of the total population, who becauseoflikecharacteristicstothespecificstudygroup,areconsidered "at risk." For example, if one were studying juvenile arrestees, all persons between 10 and 17 years of age would constitute the at-risk population.
Pre-filinG Deferral: action taken by a prosecutor to defer thefilingof felonychargesagainstafirst-timeoffenderwhocommittedalessseriousfelony.Acaseisfiledbutthereisno further disposition until the subject completes a diversionary program (e.g., support group, rehabilitation program).
PriSon: astatecorrectionalfacilitywherepersonsareconfinedfollowing conviction for a felony offense.
ProBaTion: ajudicialrequirementthatapersonfulfillcertainconditionsofbehaviorinlieuofasentencetoconfinement.SeeStraight Probation.
ProBaTion WiTH Jail: a type of disposition given upon conviction which imposes a jail term as a condition of probation.
ProPerTY CrimeS: crimes against property. This category includes burglary, motor vehicle theft, and larceny-theft over $400.
ProPerTY offenSeS: felony arrest offenses for crimes against property. This category includes burglary, theft; motor vehicle theft; forgery, check, and access card offenses; and arson.
CRIME IN CALIFORNIA, 2007

GLOSSARY 179
SUmmarY DaTa SYSTem: a data collection method based on the sum of the number of events/counts which occur in a specified period of time (e.g., UniformCrimeReporting database).
SUSTaineD: toaffirmorapproveaswhenanappellatecourtsustains the decision of a lower court.
SWorn PerSonnel: a full-time employee of a law enforcement agency who has sworn to carry out law enforcement duties and has full arrest powers.
TerminaTeD: satisfactorily completed specified term of probation.
TYPe i faCiliTY: a local detention facility used for detainment of persons for not more than 96 hours after booking, excluding holidays. Type I facilities may also detain persons on a court order, for either their own safekeeping or sentence persons to a city jail as an inmate worker. This facility may also house inmate workers sentenced to the county jail, provided such placement in the facility is made voluntarily by the inmate. As used in this section,theydefineaninmateworkerasapersonassignedtodo designed tasks outside his/her cell or dormitory, pursuant to the written policy of the facility, for a minimum of four hours each dayonafive-dayscheduledworkweek.
TYPe ii faCiliTY: a local detention facility for the detention of persons pending an arraignment, during a trial, or a sentence of commitment.
TYPe iii faCiliTY: a local detention facility used only for persons convicted and sentenced.
TYPe iV faCiliTY: a local detention facility or portion of it designated for the housing of inmates eligible under Penal Code section 1208 for work/education furlough and/or other programs involving inmate access into the community.
Uniform Crime rePorTinG (UCr): a federal reporting system which provides data on crime based on police statistics submitted by law enforcement agencies throughout the nation. DOJ administers and forwards the data for California to the federal program.
ViolenT CrimeS: crimes against persons. This category includes homicide, forcible rape, robbery, and aggravated assault.
ViolenT offenSeS: felony arrest offenses for crimes against people. This category includes homicide, forcible rape, robbery, assault, and kidnapping.
YoUTH aUTHoriTY: Youth correctional facility operated by the Division of Juvenile Justice, California Department of Corrections and Rehabilitation.
ProSeCUTor: an attorney employed by a governmental agencywhoseofficialduty is to initiateandmaintaincriminalproceedings on behalf of the government against persons accused of committing criminal offenses.
PUniSHmenT: penalty imposed for wrong doing; varies by type of crime committed. See Felony, Misdemeanor, and Infraction.
raTe: a comparison of a number of events to a population.
remoVal: a case removed from an active caseload and no longer under the supervision of the probation department or a case not removed but escalated to a more advanced level of supervision.
reVoCaTion: cancellation or suspension of parole or probation.
reVoKe: to withdraw, repeal, or cancel probation or parole for an adult.
roBBerY: the taking or attempting to take anything of value from the care, custody, or control of a person or persons by force or threat of force or violence and/or by putting the victim in fear (UCRdefinition).
SenTenCe: the penalty imposed by a court upon a convicted person.
STaTe inSTiTUTion: a facility for housing defendants who are under the jurisdiction of state correctional or treatment programs.
STaTe SUPerViSion: the state correctional system provides confinement,rehabilitation,andparoleservices.Theprincipalprovider of these services for adults is the California Department of Corrections and Rehabilitation (CDCR), which includes the California Rehabilitation Center (CRC). Based on special circumstances, some adult offenders are placed in the CDCR's youth facilities and California Department of Mental Health (CDMH).
STaTUS offenSe: an act or conduct, described by Welfare and Institutions Code section 601, which is declared by statute to be an offense but only when committed or engaged in by a juvenile and which can be adjudicated only in juvenile court.
STraiGHT ProBaTion: probation granted to adults without condition or stipulation that the defendant serve time in jail as a condition of probation.
SUBSeQUenT DiSPoSiTion: a judicial decision or sentence given at the time of a court return.
SUBSeQUenT GranT: a subsequent grant of probation in the same court for an adult still on probation for the initial grant..
APPENDIX 4

CRIME IN CALIFORNIA, 2007
Crime in California presents statistics showing the number and types of offenses known to public authorities and the number of administrative actions taken by the criminal justice system. For 55 years, Crime in California has provided information on crimes and the criminal justice process. The collection and publication of these data are mandated by California Penal Code sections 13010–13012.
Crime and arrest rates are calculated using annual population estimates provided by the Demographic Research Unit, California Department of Finance. Beginning in 2004, population estimates are based on the 2000 Census. Population estimates for 1990 through 2003 are based on the 1990 Census. Readers are advised to exercise care in interpreting changes in percent and rate between decennial census samples.
Anumberoffactorscaninfluencecountsinparticularjurisdictions.Thefollowingfactorsshouldbeconsideredwhenutilizing crime statistics, especially for comparative purposes:
Variations in composition of the population, particularly age structure. Population density and size of locality and its surrounding area. Stability of population with respect to residents' mobility, commuting patterns, and transient factors. Modes of transportation and highway system. Economic conditions, including median income and job availability. Cultural conditions, such as education, recreation, and religious characteristics. Family conditions with respect to divorce and family cohesiveness. Effective strength of law enforcement agencies. Administrative and investigative emphases of law enforcement. Policies of other components of the criminal justice system (i.e., prosecutorial, judicial, correctional, and probational). Attitudes of citizenry toward crime. Crime reporting practices of citizenry. Illegal drug supply, cost, and demand.
Historical data are included in this Crime in California report to provide trend data. The time periods for which data are available vary from database to database depending upon the date each program was instituted. For additional information, see Appendix 1, Data Characteristics and Known Limitations, on pages 160–161.
Since 1952, there have been many changes in laws and data collection procedures. For instance, in 1986 legislation was enacted which required reporting domestic violence as criminal conduct. As a result, the aggravated assault rate increased over 35 percent in one year. Also, in 1983, California law raised the lower limit of felony theft from $200 to over $400. In order to maintain long-term felony trend data, the DOJ removed theft ($200 and over) from its measure of crime. These types of changes should be considered when comparing data.
noTeS
180 CRIME IN CALIFORNIA, 2007

**Available on the Internet.
Annual PublicationsAnti-Reproductive-Rights Crimes in California**Crime in California**Crime in California, Advance Release**Criminal Justice Profile - A Supplement to Crime in California (statewide and individual counties)**Hate Crime in California**Homicide in California**Juvenile Justice in California**Preliminary Report, Crime (January through June, January through September, and January through December)**
foci and forumsThe California Experience in American Juvenile Justice: Some Historical Perspectives (December 1988)Controlling Plea Bargaining in California (September 1985)Coordinating Justice in California: “There ought to be a law about it” (December 1988)Crime Control and the Criminal Career (December 1992)The Development of California Drunk Driving Legislation (December 1988)Employment and Crime (February 1989)The Impact of California’s “Prior Felony Conviction” Law (September 1987)The Origins and Development of Penalties for Drunk Drivers in California (August 1988)A Policy Role for Focus Groups: Community Corrections (September 1991)The Prevalence and Incidence of Arrests Among Adult Males in California (August 1988)The Social Structure of Street Drug Dealing (December 1988)
outlooksAdult Felony Arrest Dispositions in California (1982-1984,1986-1989)Crime in Urban and Rural California (November 1984 and December 1997)**Death in Custody, California (May 2005)**Felony Drug Arrests in California, 1985 (December 1986)
Juvenile Justice in California, 1983 (June 1984)Motor Vehicle Theft in California (December 1987)Motor Vehicle Theft Recovery Data, 1983-1989 (October 1990)Women in Crime: The Sentencing of Female Defendants (April 1988)
ReportsAdult Felony Arrest Dispositions in California (April 1992)Concealable Firearms Charges in California**(2000–2003)Crime in California and the United States, (1983, 1990, 2000)**Effectiveness of Statutory Requirements for the Registration of Sex Offenders - A Report to the California State LegislatureExecutive Summary of the Final Report - Blue Ribbon Commission on Inmate Population Management (January 1990)The Juvenile Justice System in California: An Overview (April 1989)Parolees Returned to Prison and the California Prison Population (January 1988)Target Hardening: A Literature Review (October 1989)
Report SeriesReport on Arrests for Burglary in California, 1998**Report on Arrests for Domestic Violence in California, 1998**Report on Arrests for Driving Under the Influence in California, 1997**Report on Drug Arrests in California, From 1990 to 1999 (December 2000)**Report on Juvenile Felony Arrests in California, 1998 (March 2000)**Report on Violent Crimes Committed Against Senior Citizens in California, 1998**
Research SeriesWhy Did the Crime Rate Decrease Through 1999? (And Why Might it Decrease or Increase in 2000 and Beyond?) (December 2000)**
Special Report to the Legislature on Senate Bill 780 (California Freedom of Access to Clinic and Church Entrances Act and Reproductive Rights Law Enforcement Act) (August 2003)Special Report to the Legislature on Senate Bill 1608 (Felons and others with firearms) (July 2002)Special Report to the Legislature on Senate Resolution 18 (Crimes Committed Against Homeless Persons) (October 2002)**
Monograph SeriesConspicuous Depredation: Automobile Theft in Los Angeles, 1904 to 1987 (March 1990)Controlling Felony Plea Bargaining in California: The Impact of the Victim’s Bill of Rights (1986)Development of a White Collar Crime Index (December 1992)Incapacitation Strategies and the Career Criminal (December 1992)Measuring White Collar Crime in Depository Institutions (December 1993)Prosecutors’ Response to Parental Child Stealing: A Statewide Study (April 1995)Race & Delinquency in Los Angeles Juvenile Court, 1950 (December 1990)Survey Report: “The Expansion of the Criminal Justice and Penal System in California - Is greater coordination required?” (December 1988)
MiscellaneousCalifornia Criminal Justice Time Line, 1822-2000 (June 2001)**Crime in California (April 2001)**Gang Organization and Migration/Drugs, Gangs & Law EnforcementProceedings of the Attorney General’s Crime Conference 85 (September 1985)Proceedings of Symposium 87: White Collar/Institutional Crime - Its Measure- ment and Analysis
CJSC PUBLICATIoNS
For publications or assistance in obtaining statistical information or a customized statistical report, please contact:
California Department of JusticeBureau of Criminal Information and Analysis
Criminal Justice Statistics CenterSpecial Requests Unit
P.O. Box 903427Sacramento, CA 94203-4270
Phone: (916) 227-3509 fax: (916) 227-0427 E-mail: [email protected] Internet: http://ag.ca.gov/cjsc
Annual publications from 1999-2006 are also available on CD-ROM, including data tables in the Excel spreadsheet format.
09/08

California Department of JusticeDivision of California Justice Information ServicesBureau of Criminal Information and AnalysisCRIMINAL JUSTICE STATISTICS CENTERP. O. Box 903427Sacramento, CA 94203-4270
Forwarding and AddressCorrection Requested