Embed Size (px)
Citation preview

Crime Scene Investigation: Troubleshooting Java apps in Containers
Deepthi Sebastian
IBM
Agenda
• The Methodology
• The Crime Files
• The Investigation Journey
• Bonus: Investigating a crime in progress
The Methodology
• Identify the nature of the crime
• Preliminary Walkthrough
• Collect further evidence
• Analyze and draw conclusions
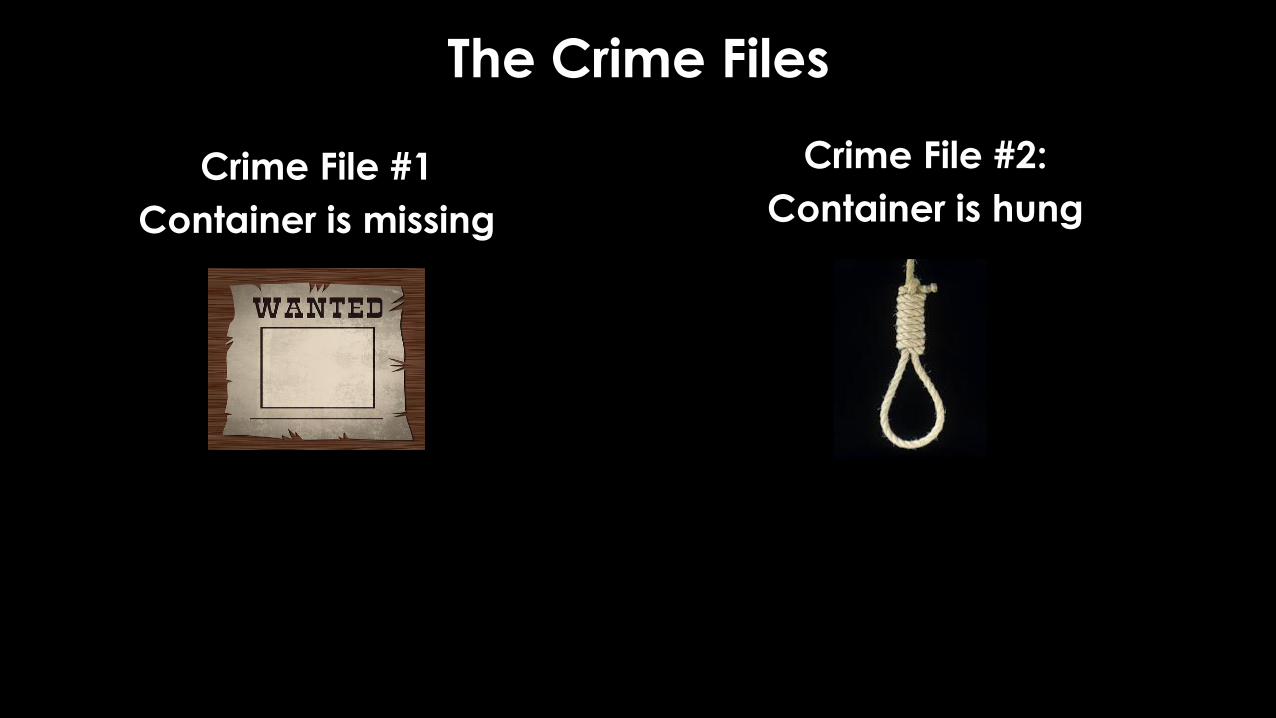
The Crime Files
Crime File #1
Container is missing
Crime File #2:
Container is hung
Crime File #1
Container is missing
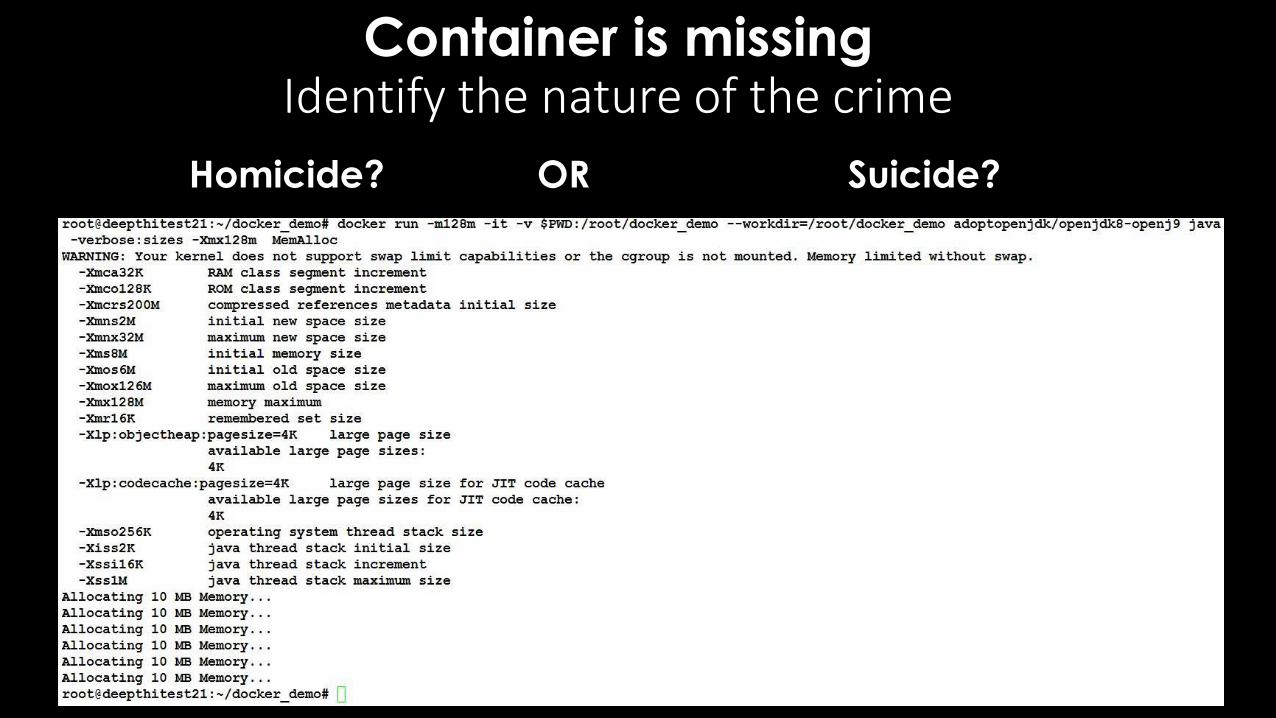
Container is missing Identify the nature of the crime
Homicide? OR Suicide?
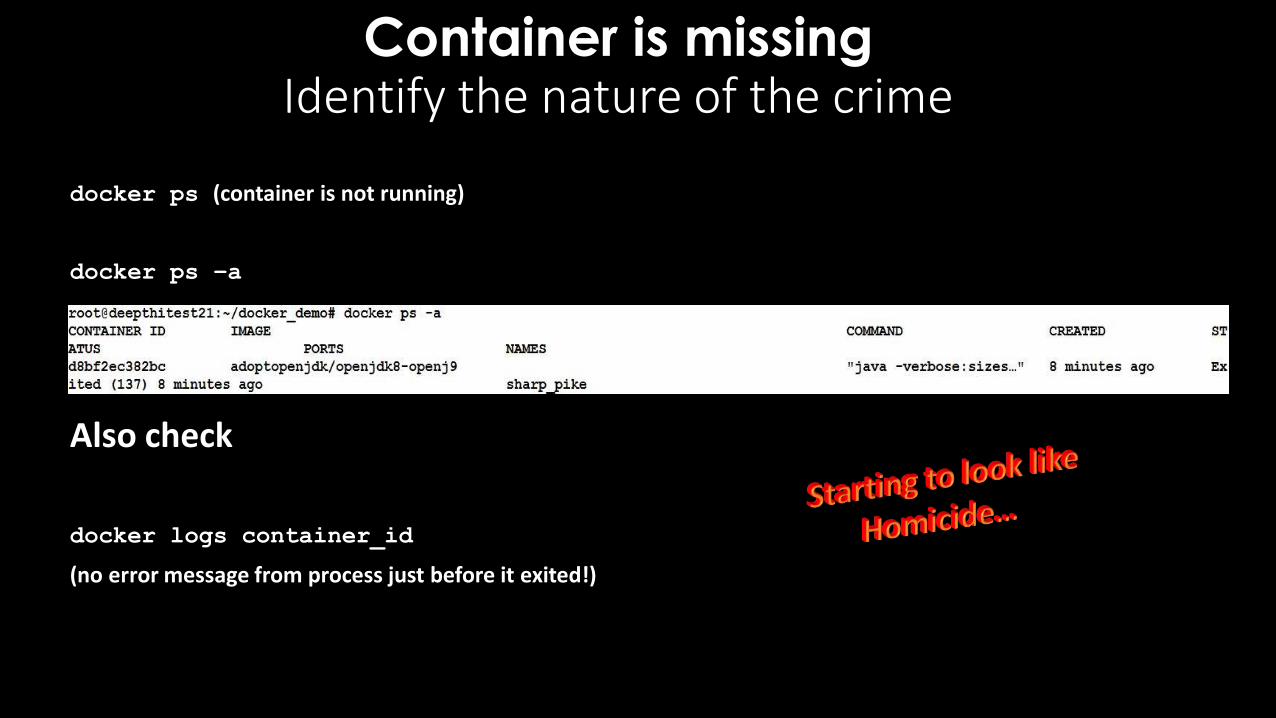
Container is missing Identify the nature of the crime
docker ps (container is not running)
docker ps –a
Also check
docker logs container_id
(no error message from process just before it exited!)
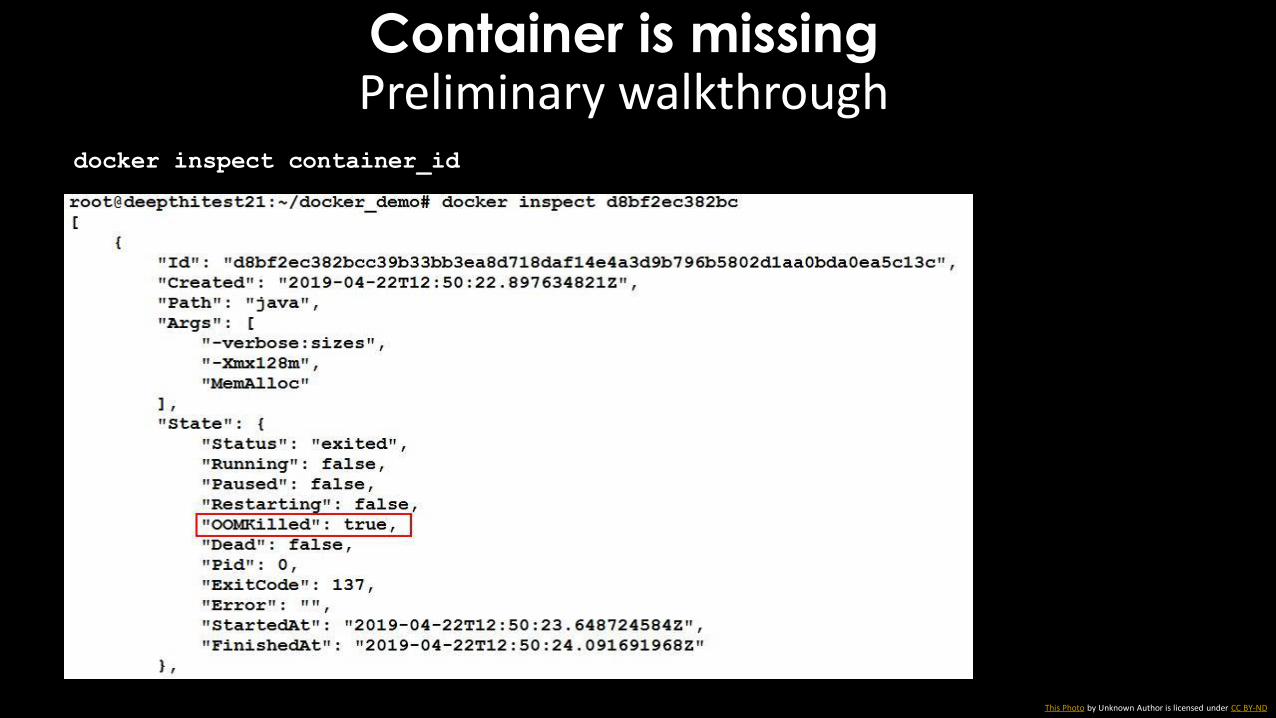
Container is missing Preliminary walkthrough
docker inspect container_id
This Photo by Unknown Author is licensed under CC BY-ND
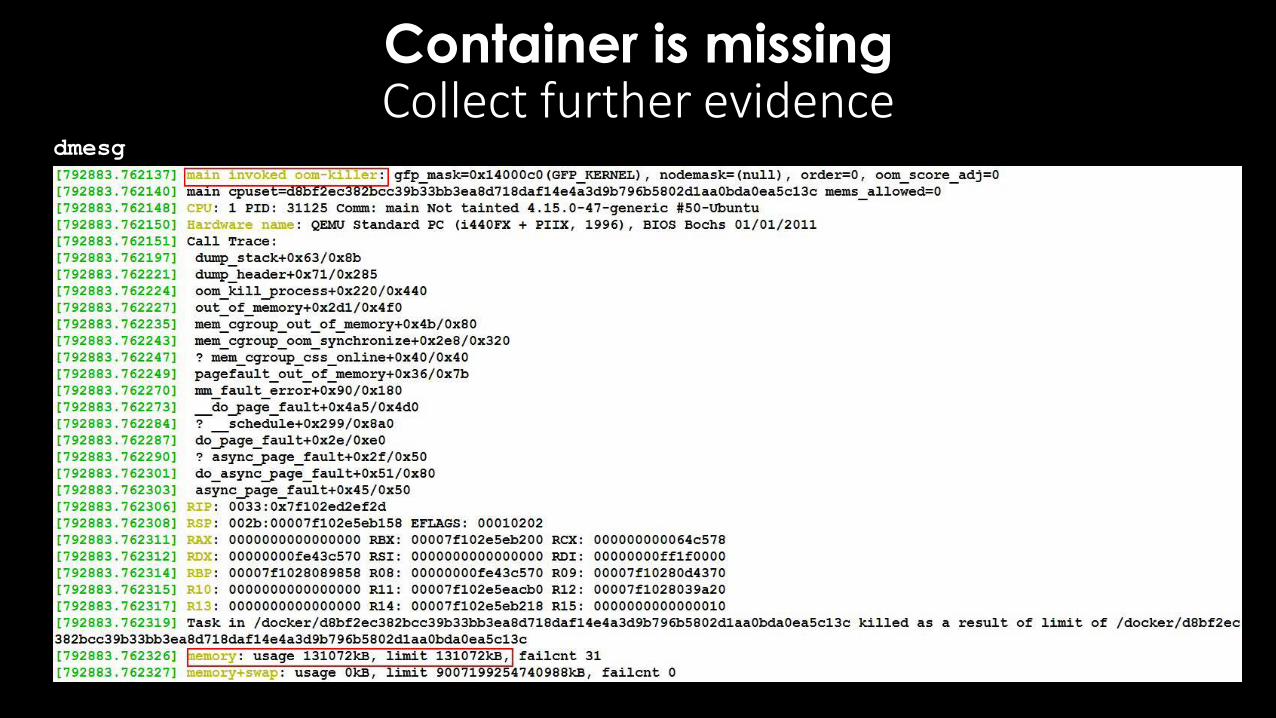
Container is missing Collect further evidence
dmesg
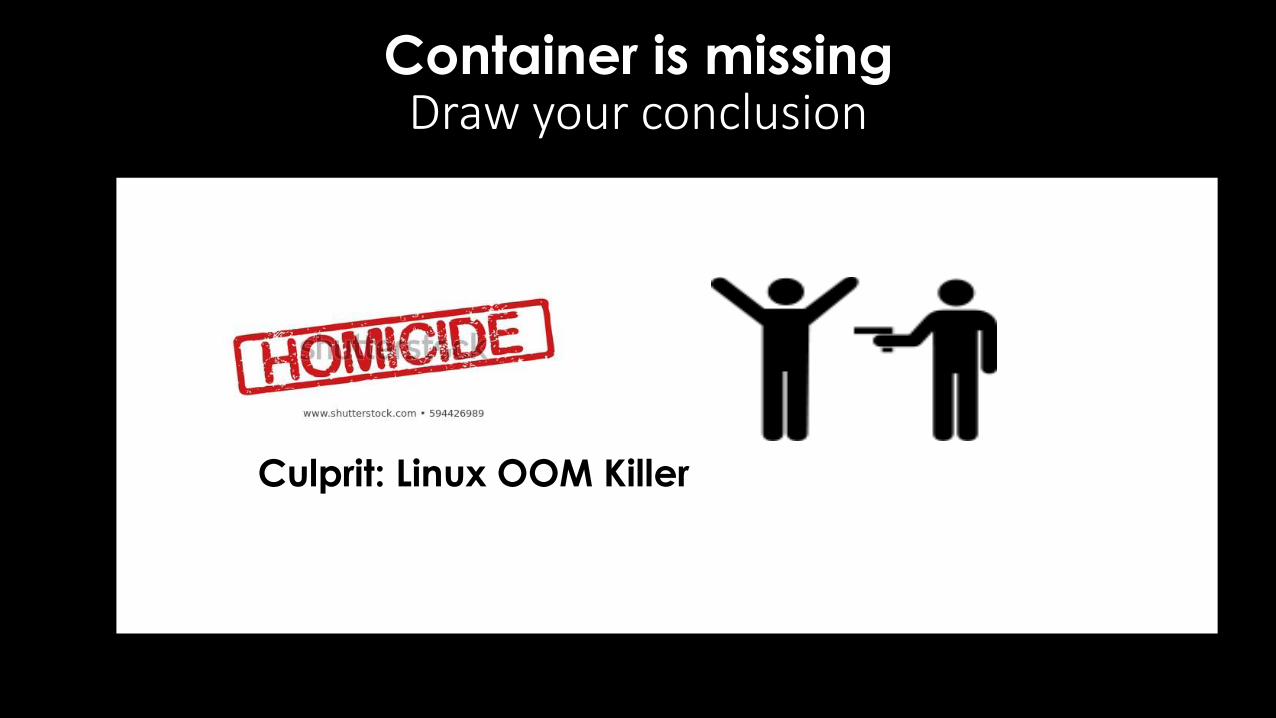
Container is missing Draw your conclusion
Culprit: Linux OOM Killer
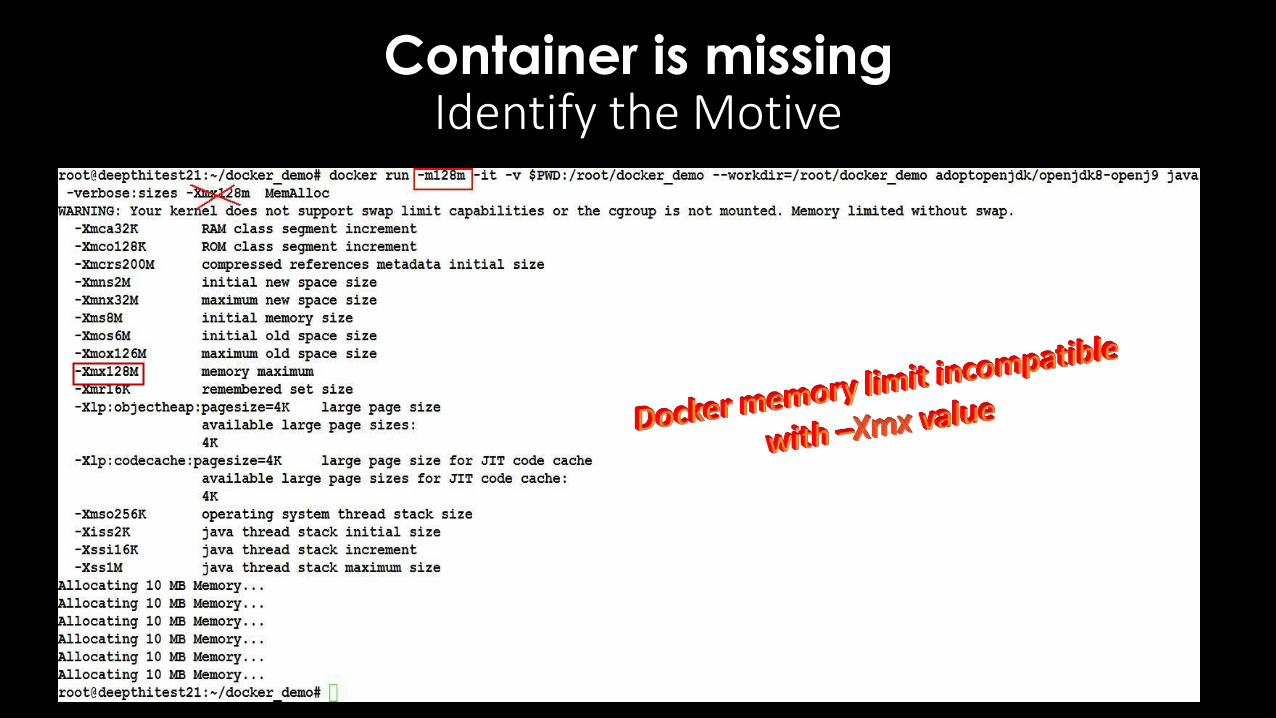
Container is missing Identify the Motive
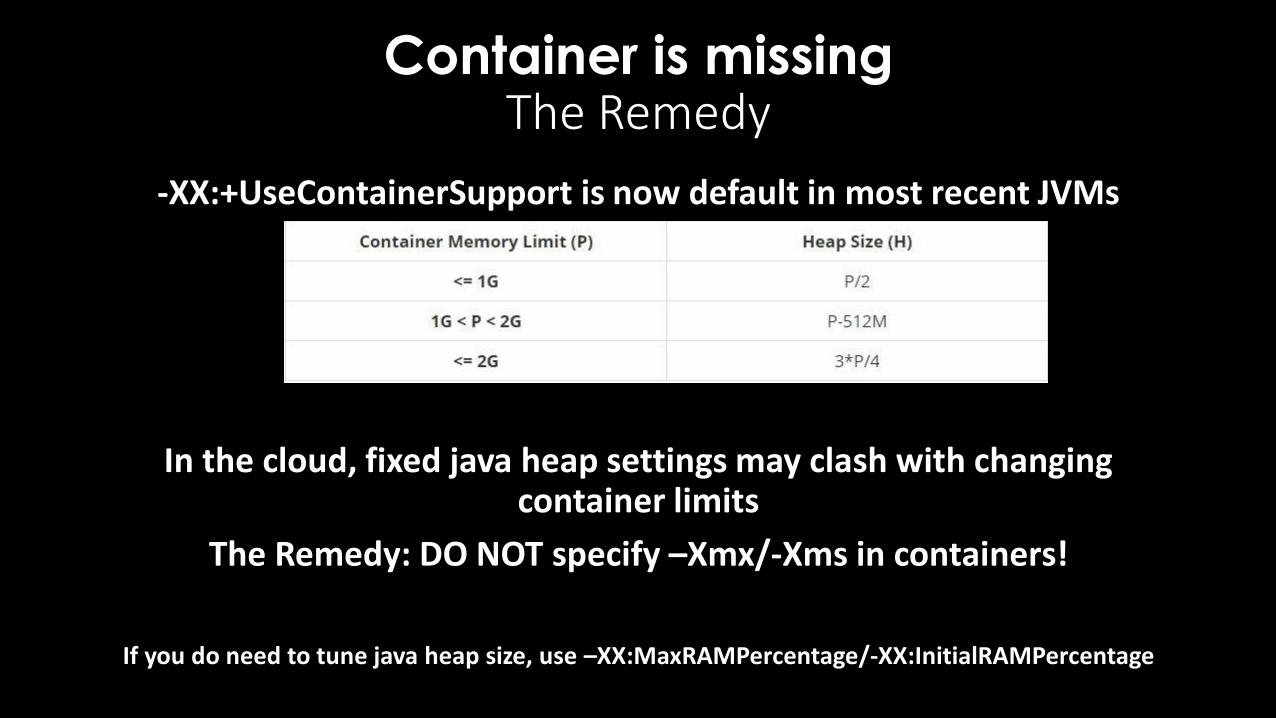
-XX:+UseContainerSupport is now default in most recent JVMs
In the cloud, fixed java heap settings may clash with changing container limits
The Remedy: DO NOT specify –Xmx/-Xms in containers!
If you do need to tune java heap size, use –XX:MaxRAMPercentage/-XX:InitialRAMPercentage
Container is missing The Remedy
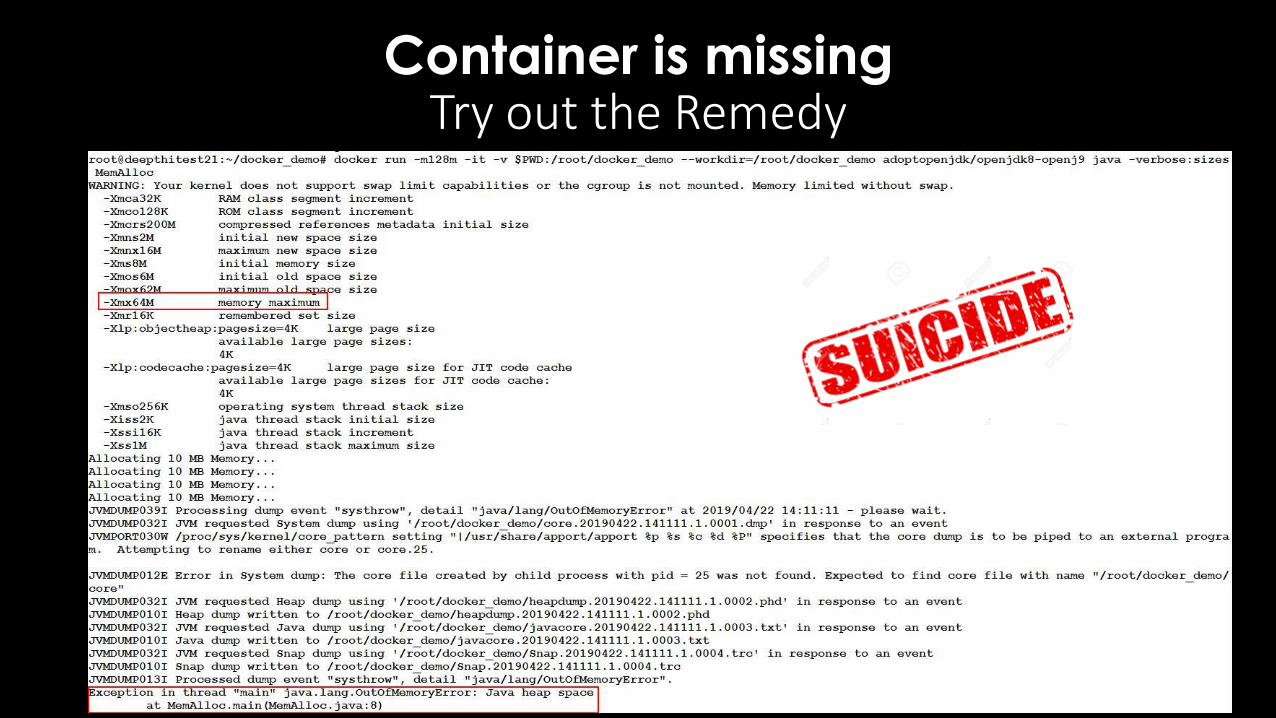
Container is missing Try out the Remedy
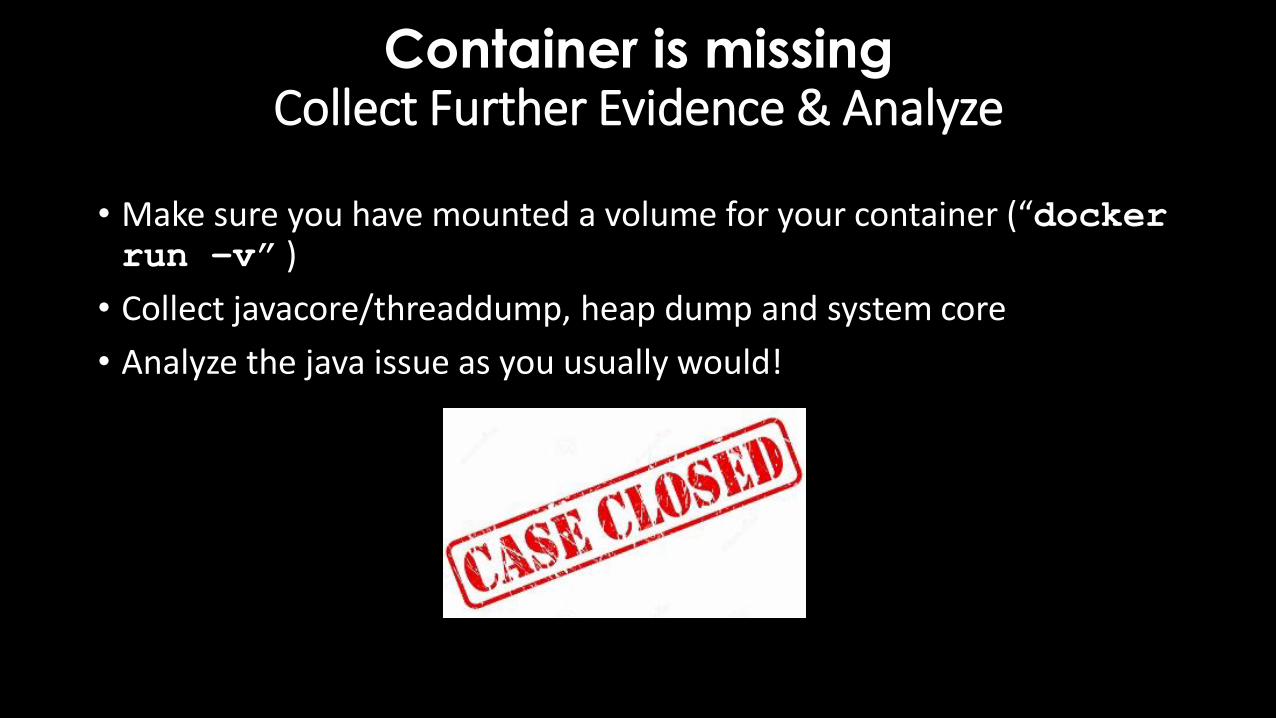
Container is missing Collect Further Evidence & Analyze
• Make sure you have mounted a volume for your container (“docker run –v” )
• Collect javacore/threaddump, heap dump and system core
• Analyze the java issue as you usually would!
Crime File #2:
Container is hung
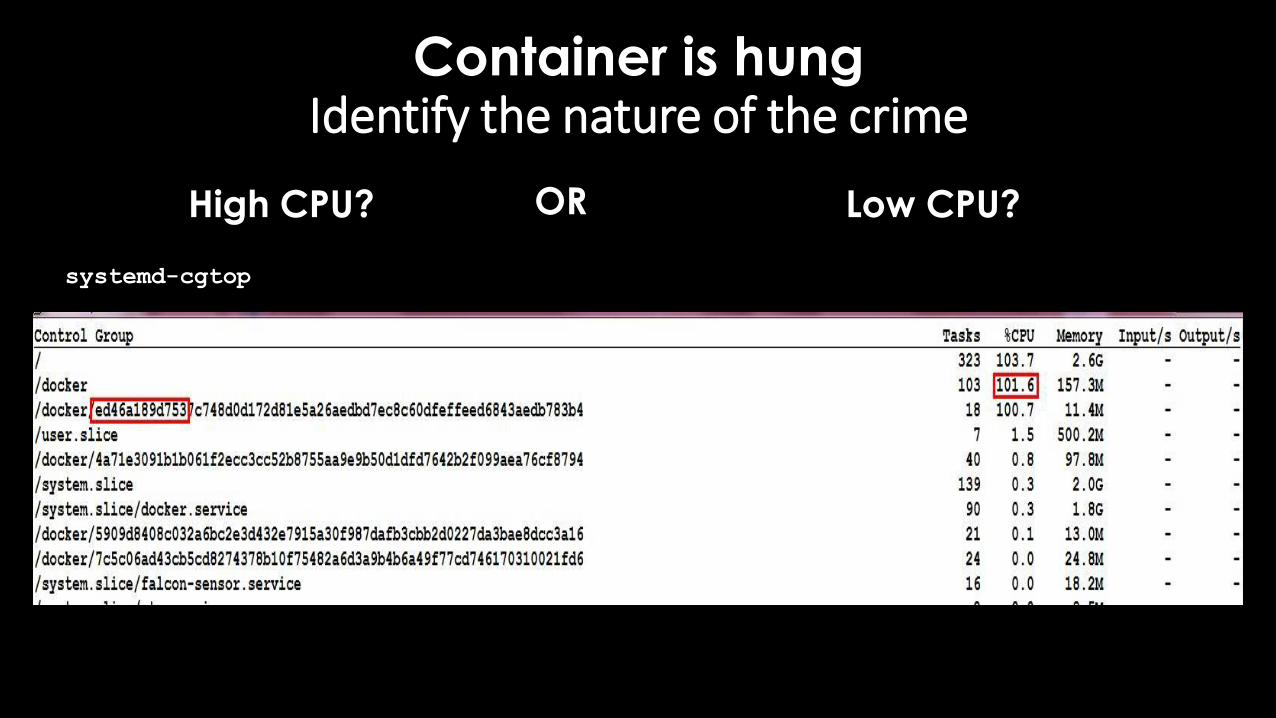
Container is hung Identify the nature of the crime
systemd-cgtop
High CPU? OR Low CPU?
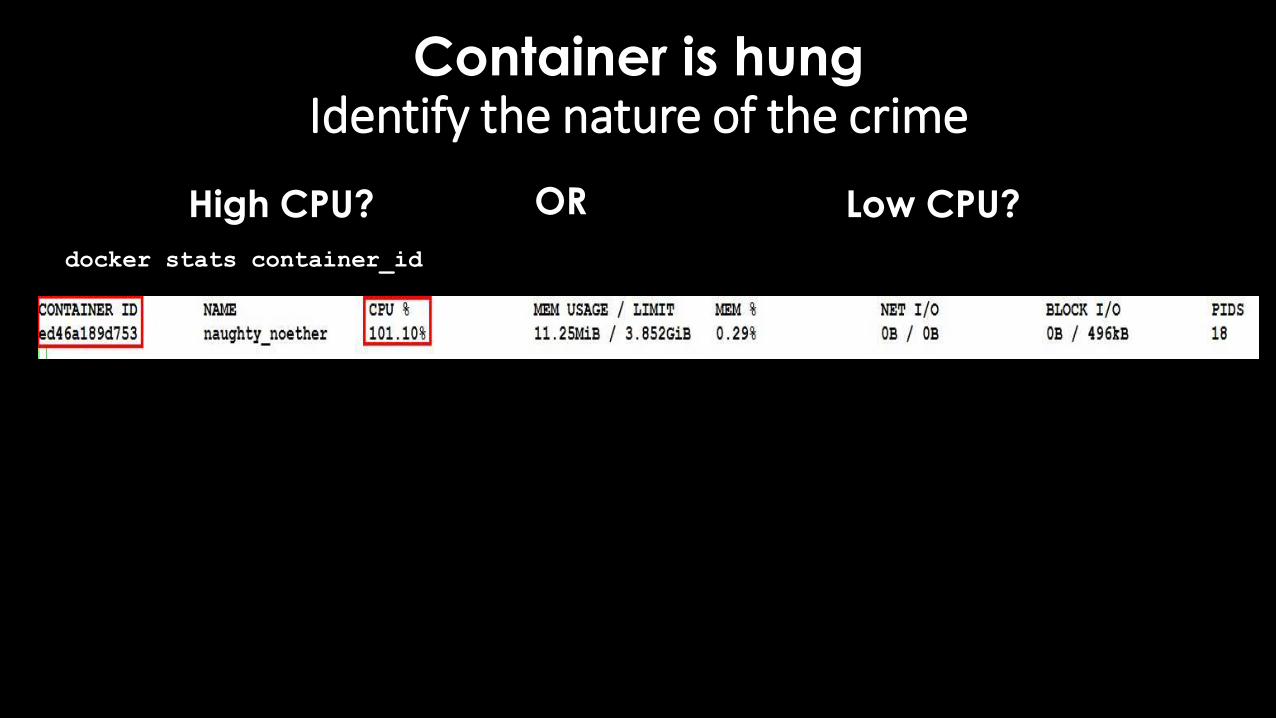
Container is hung Identify the nature of the crime
docker stats container_id
High CPU? OR Low CPU?
Container is hung Preliminary walkthrough
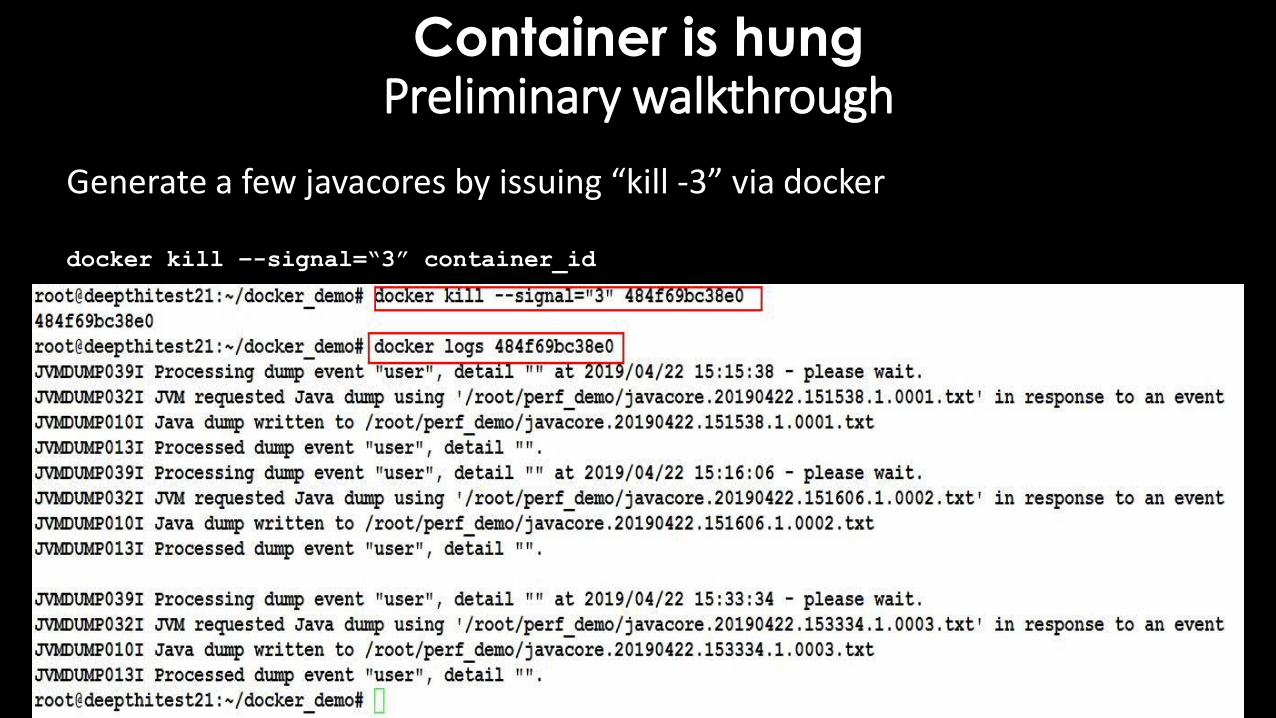
Generate a few javacores by issuing “kill -3” via docker
docker kill –-signal=“3” container_id
Container is hung: High CPU Preliminary walkthrough
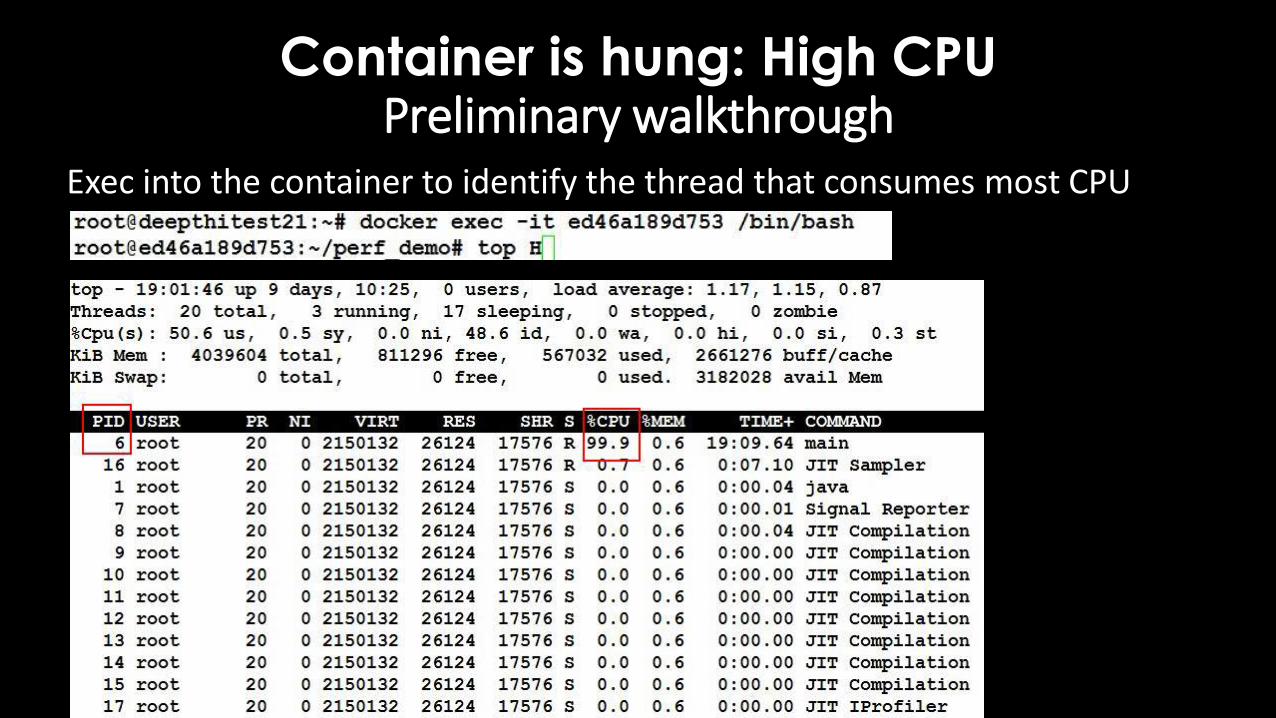
Exec into the container to identify the thread that consumes most CPU
Container is hung: High CPU Collect further evidence
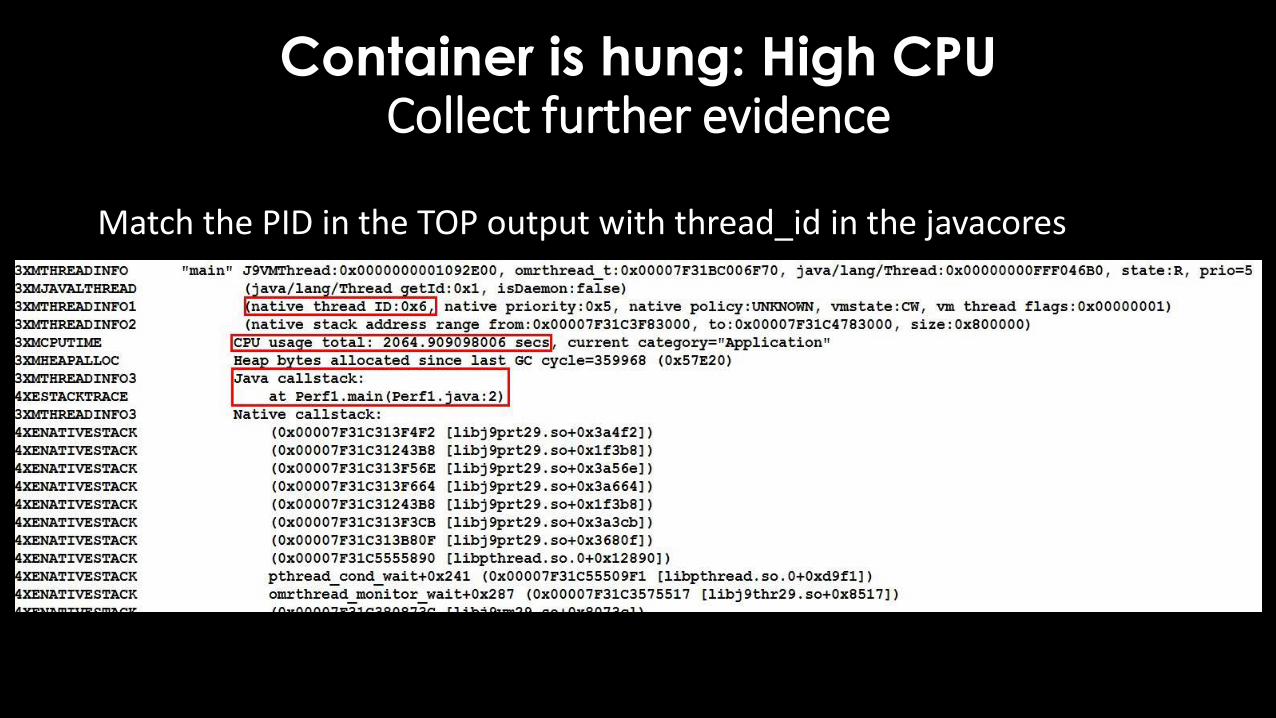
Match the PID in the TOP output with thread_id in the javacores
Container is hung: High CPU Analyze and draw conclusion
Examine your code for obvious loops!
Other possible culprits: • Excessive GC
• Too many threads
• Insufficient resources
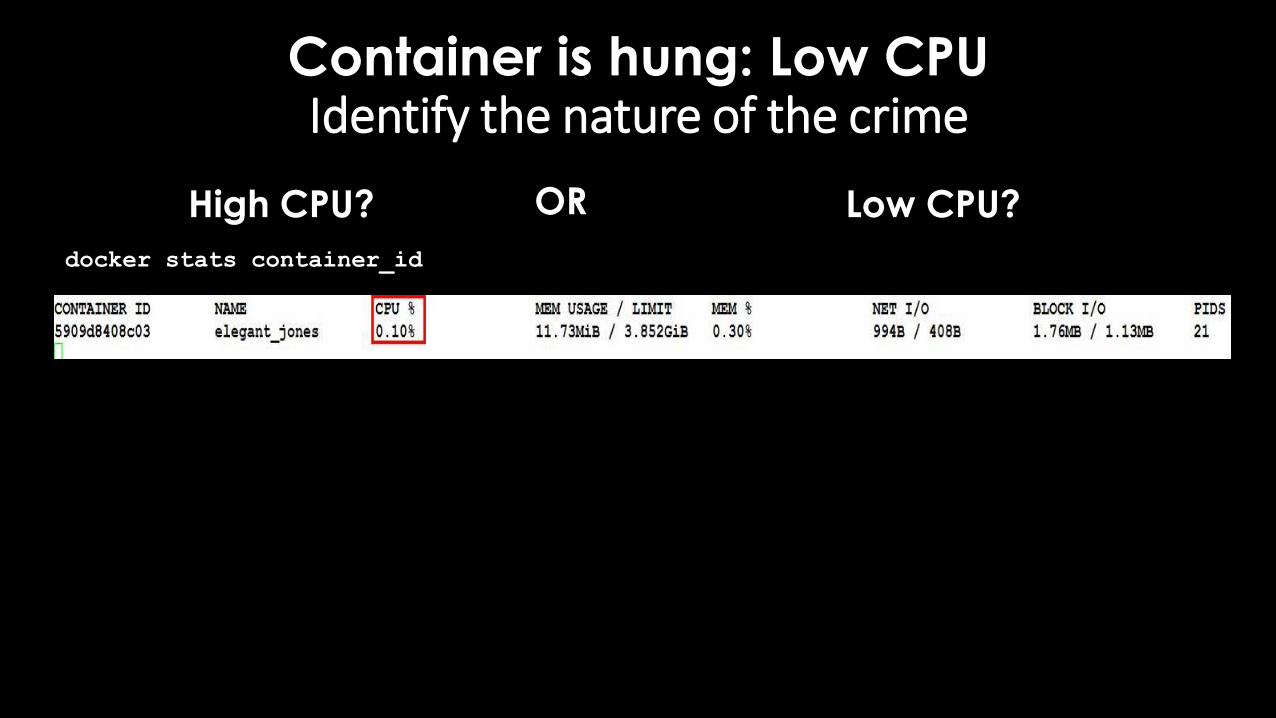
Container is hung: Low CPU Identify the nature of the crime
docker stats container_id
High CPU? OR Low CPU?
Container is hung: Low CPU Preliminary walkthrough
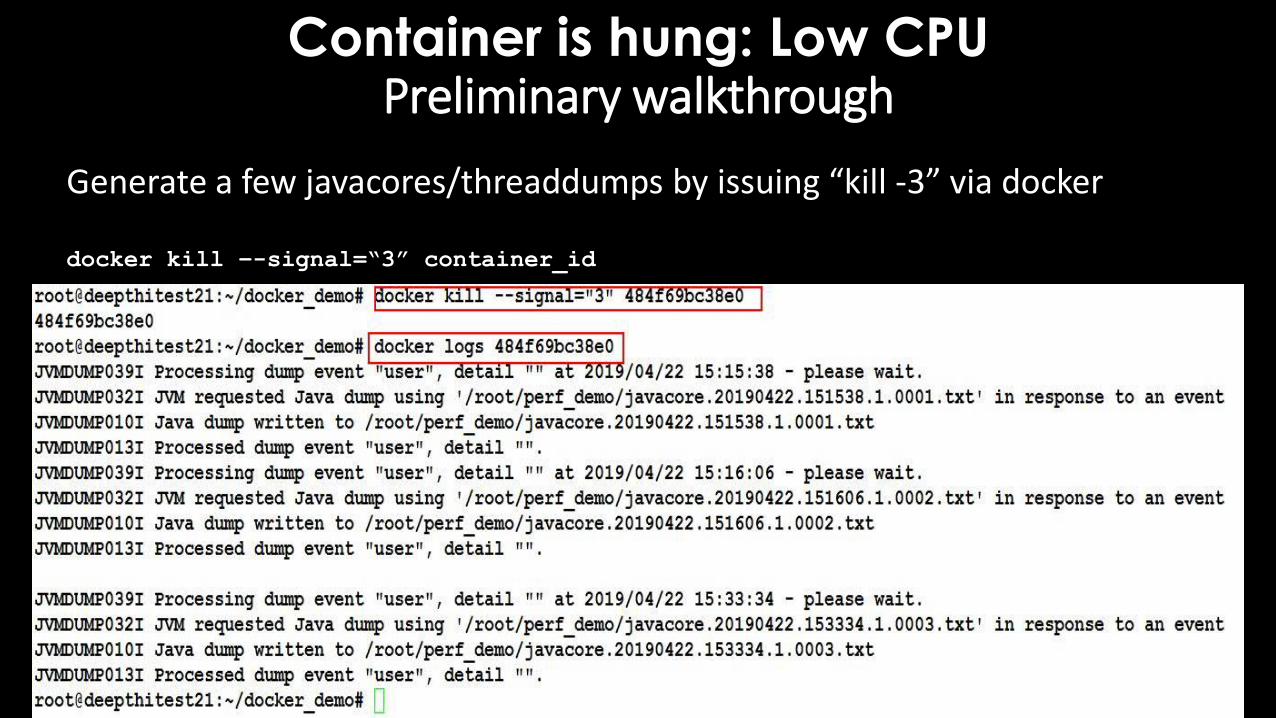
Generate a few javacores/threaddumps by issuing “kill -3” via docker
docker kill –-signal=“3” container_id
Container is hung: Low CPU Collect further Evidence
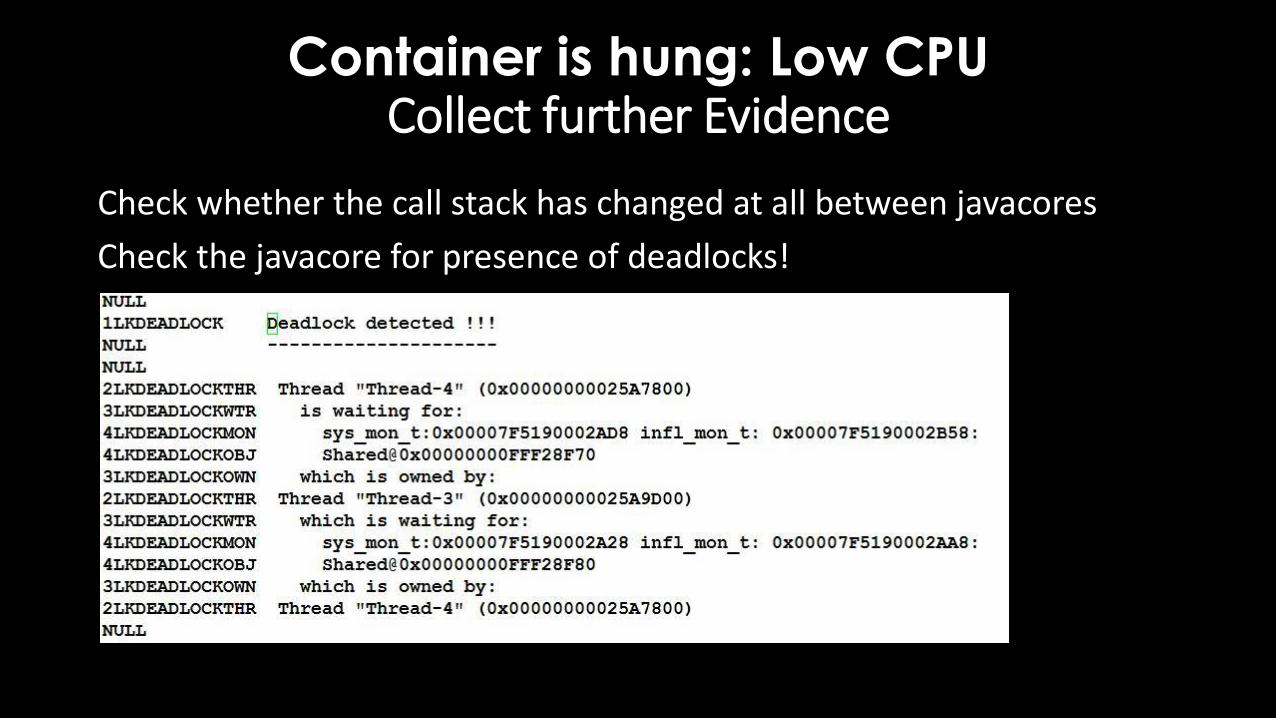
Check whether the call stack has changed at all between javacores
Check the javacore for presence of deadlocks!
Container is hung: Low CPU Analyze and draw conclusion
Examine your code for obvious deadlocking scenarios
Other possible culprits: • Bottlenecks i.e. Multiple threads waiting on a lock
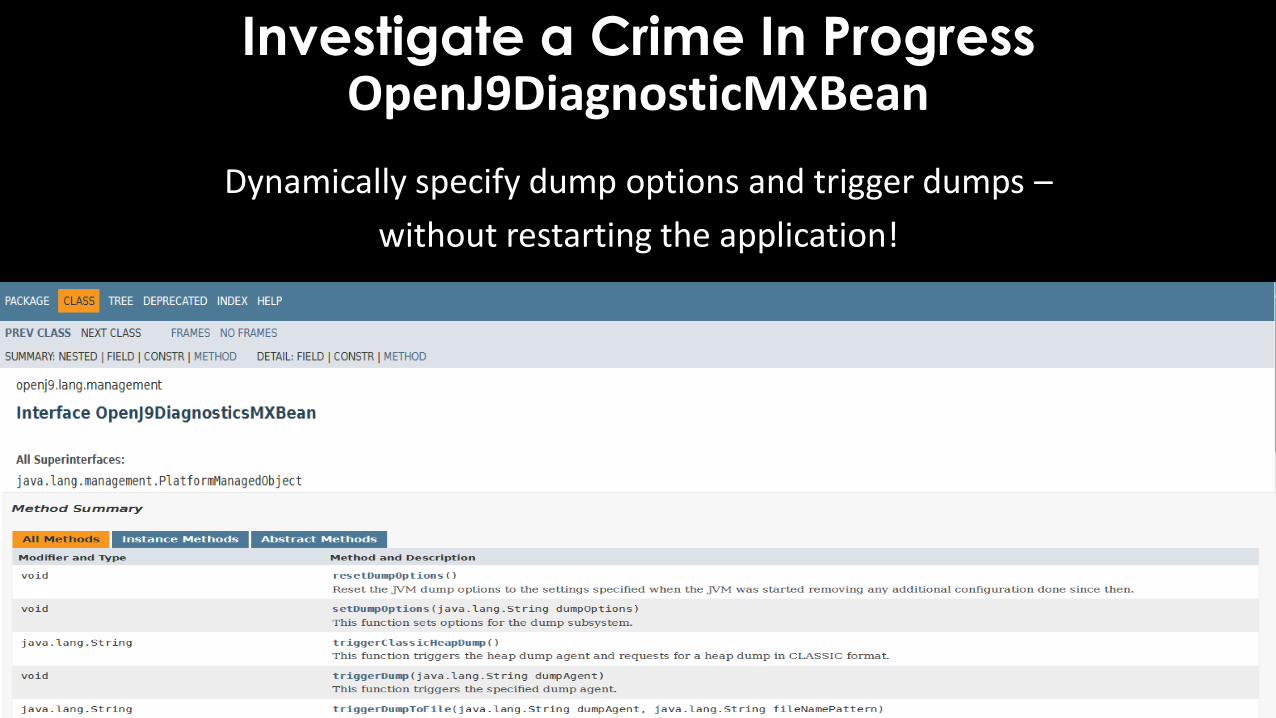
Investigate a Crime In Progress OpenJ9DiagnosticMXBean
Dynamically specify dump options and trigger dumps –
without restarting the application!
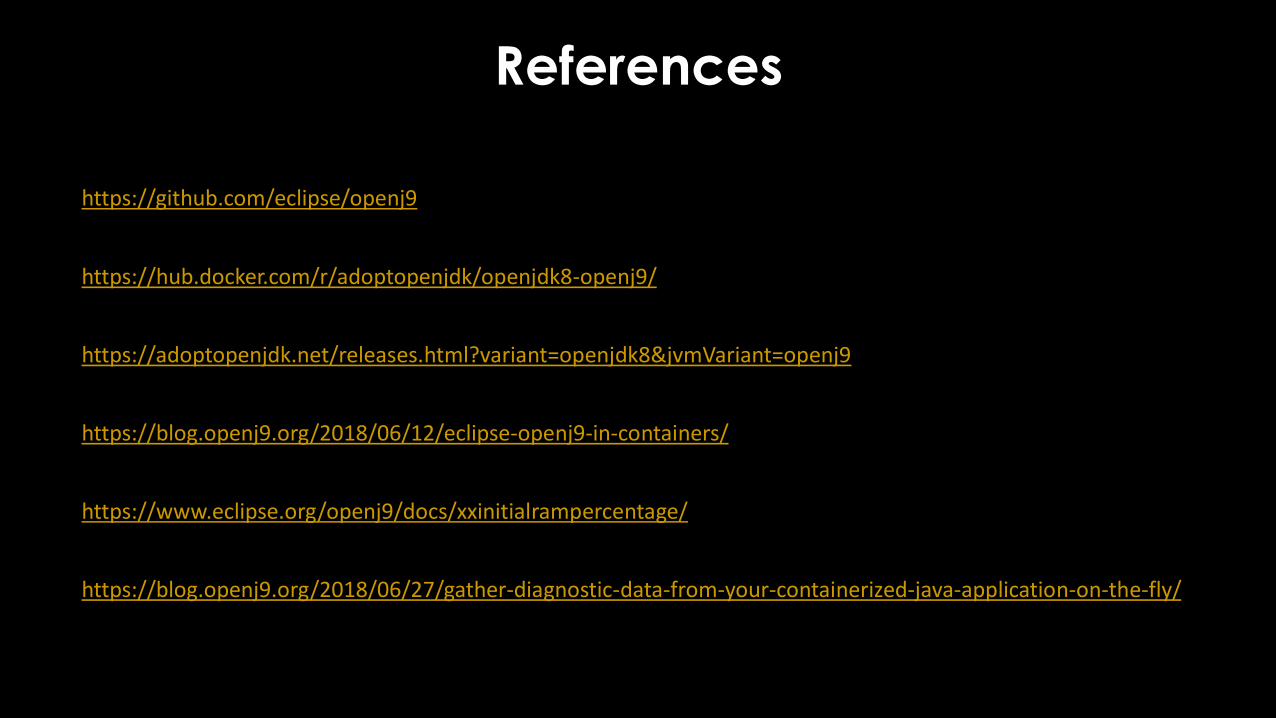
References
https://github.com/eclipse/openj9
https://hub.docker.com/r/adoptopenjdk/openjdk8-openj9/
https://adoptopenjdk.net/releases.html?variant=openjdk8&jvmVariant=openj9
https://blog.openj9.org/2018/06/12/eclipse-openj9-in-containers/
https://www.eclipse.org/openj9/docs/xxinitialrampercentage/
https://blog.openj9.org/2018/06/27/gather-diagnostic-data-from-your-containerized-java-application-on-the-fly/

Thank You!
Demo
OpenJ9DiagnosticMXBean