Embed Size (px)
DESCRIPTION
Crime Statistics User Event Sandra Campbell Justice Analytical Services. 6 October 2014. Overview. Two sources of crime statistics Key strengths and limitations Users and uses What do the statistics tell us? Police reform Statistics from 2013-14 onwards Next steps. - PowerPoint PPT Presentation
Citation preview
Crime Statistics User Event
Sandra CampbellJustice Analytical Services
6 October 2014

Overview
• Two sources of crime statistics
• Key strengths and limitations
• Users and uses
• What do the statistics tell us?
• Police reform
• Statistics from 2013-14 onwards
• Next steps

Crime Statistics in Scotland
Two complementary sources:
1. Police Recorded Crime
2. Scottish Crime and Justice Survey

Police Recorded Crime
Key strengths:
•Frequency – annual data
•Geography – local authority level
•Time series – historical time series

Police Recorded Crime
Limitations:
•Not all crimes are reported to the police – what are the barriers?
•No information on characteristics of victims and perpetrators e.g. age and gender or on circumstances of the crime e.g. locus of the crime

Users and Uses
Scottish Government:
•Justice Strategy
•Policy development
Also:
•Local authorities, Community Partnerships, Academia, Scottish Parliament, ISD Scotland, Charities and Support groups …… and many more
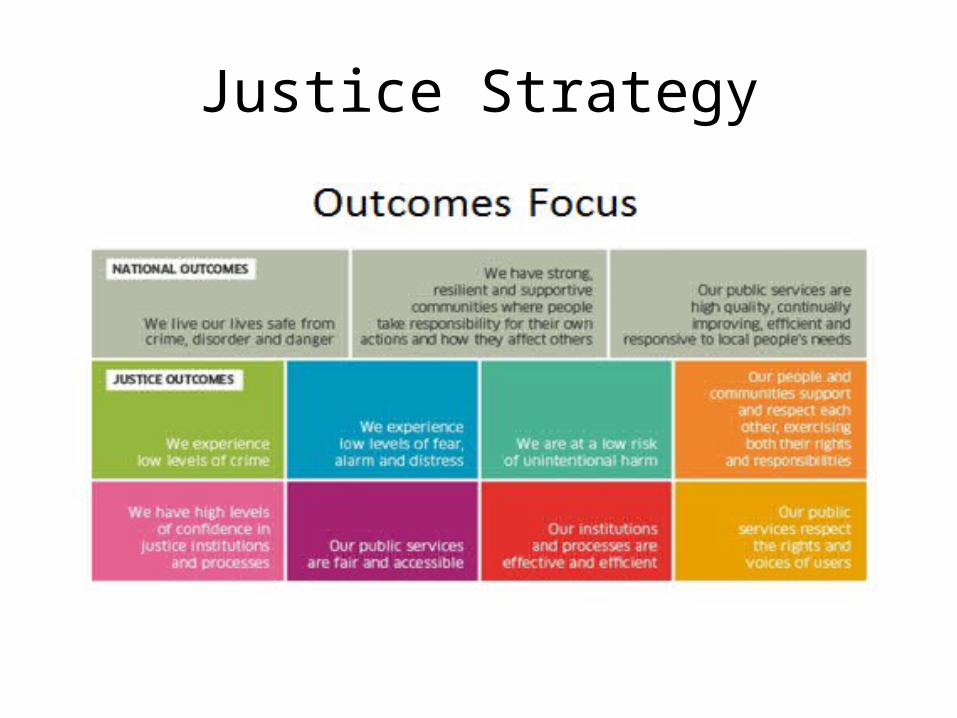
Justice Strategy

Policy context
Priority - to reduce crime, particularly violent crime•Reducing violence•No Knives, Better LivesThe No Knives Better Lives campaign informsyoung people about the dangers of carrying knives.
•Scottish Index of Multiple DeprivationPolice recorded crime data used inthe creation of the crime domain

Police Recorded Crime
Background:
•Scottish Crime Recording Standard
•Around 470 crime codes
•Seven crime groups
•Crimes and offences
•Independently audited by HMICS

Police Recorded Crime
• What do we know?
• What are the longer term trends?
• What are the most recent changes?


Number of crimes recorded by the police
0
100,000
200,000
300,000
400,000
500,000
600,000
1995-96 1997-98 1999-00 2001-02 2003-04 2005-06 2007-08 2009-10 2011-12
Nu
mb
er o
f cr
imes
rec
ord
ed
Financial year
Introduction of SCRS
1 April 2004

Crimes broken down by group
3%
3%
50%
22%
23%
0% 10% 20% 30% 40% 50% 60%
Non-sexual crimes of violence
Sexual offences
Crimes of dishonesty
Fire-raising, vandalism etc.
Other crimes
Percentage of crimes recorded, 2012-13
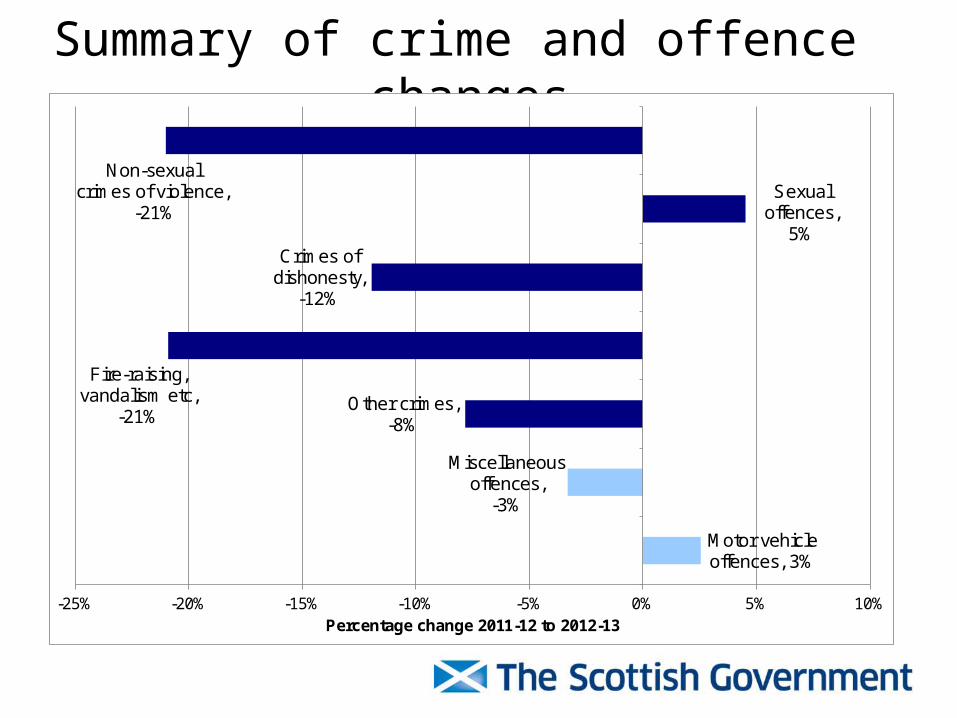
Summary of crime and offence changes
Motor vehicle offences, 3%
Miscellaneous offences,
-3%
Other crimes, -8%
Fire-raising, vandalism etc,
-21%
Crimes of dishonesty,
-12%
Sexual offences,
5%
Non-sexual crimes of violence,
-21%
-25% -20% -15% -10% -5% 0% 5% 10%Percentage change 2011-12 to 2012-13
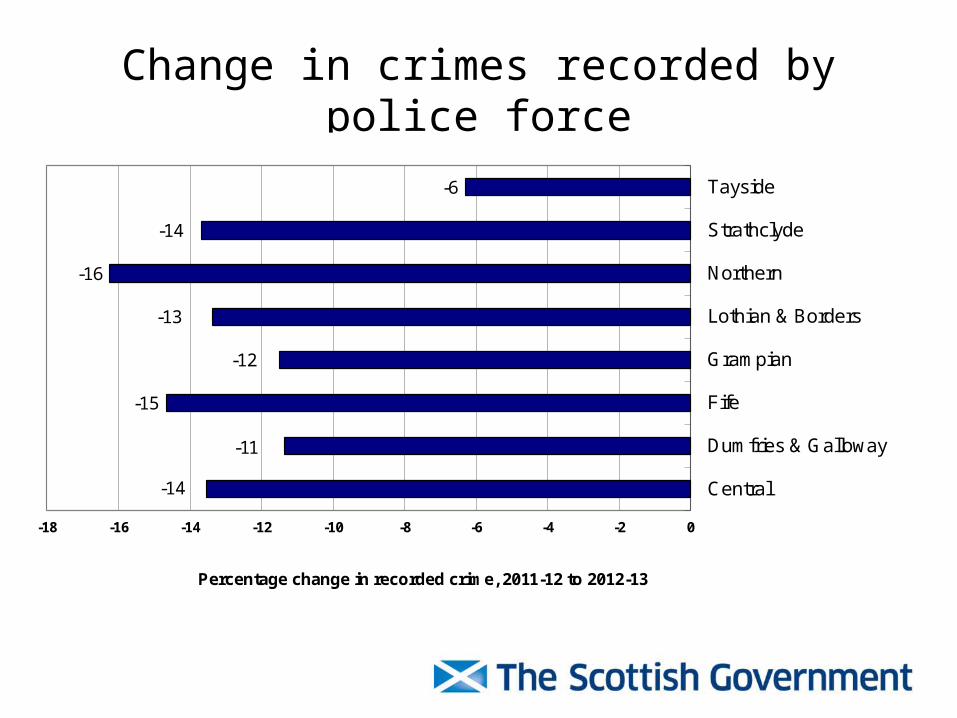
Change in crimes recorded by police force
-14
-11
-15
-12
-13
-16
-14
-6
-18 -16 -14 -12 -10 -8 -6 -4 -2 0
Central
Dumfries & Galloway
Fife
Grampian
Lothian & Borders
Northern
Strathclyde
Tayside
Percentage change in recorded crime, 2011-12 to 2012-13

Group 1 - Non-sexual crimes of violence
0
1,000
2,000
3,000
4,000
5,000
6,000
7,000
8,000
2003-04 2004-05 2005-06 2006-07 2007-08 2008-09 2009-10 2010-11 2011-12 2012-13
Nu
mb
er
Financial Year
Homicide Attempted murder & serious assault Robbery Other

Group 2 - Sexual offences
0
500
1,000
1,500
2,000
2,500
3,000
3,500
4,000
2003-04 2004-05 2005-06 2006-07 2007-08 2008-09 2009-10 2010-11 2011-12 2012-13
Nu
mb
er
Financial year
Rape & attempted rape Sexual assault Offences associated with prostitution Other

Group 3 - Number of crimes of dishonesty
0
10,000
20,000
30,000
40,000
50,000
60,000
70,000
80,000
2003-04 2004-05 2005-06 2006-07 2007-08 2008-09 2009-10 2010-11 2011-12 2012-13
Nu
mb
er
Financial year
Housebreaking Theft by opening a lockfast place (OLP) Theft from a motor vehicle by OLP Theft of a motor vehicle Shoplifting Other theft Fraud Other
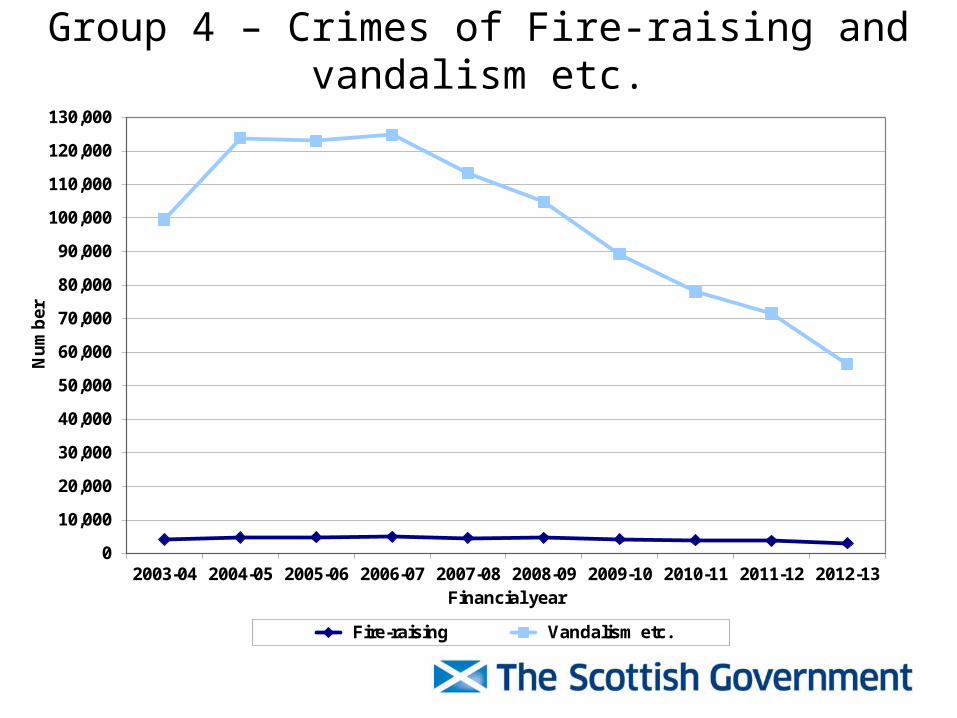
Group 4 – Crimes of Fire-raising and vandalism etc.
0
10,000
20,000
30,000
40,000
50,000
60,000
70,000
80,000
90,000
100,000
110,000
120,000
130,000
2003-04 2004-05 2005-06 2006-07 2007-08 2008-09 2009-10 2010-11 2011-12 2012-13
Nu
mb
er
Financial year
Fire-raising Vandalism etc.
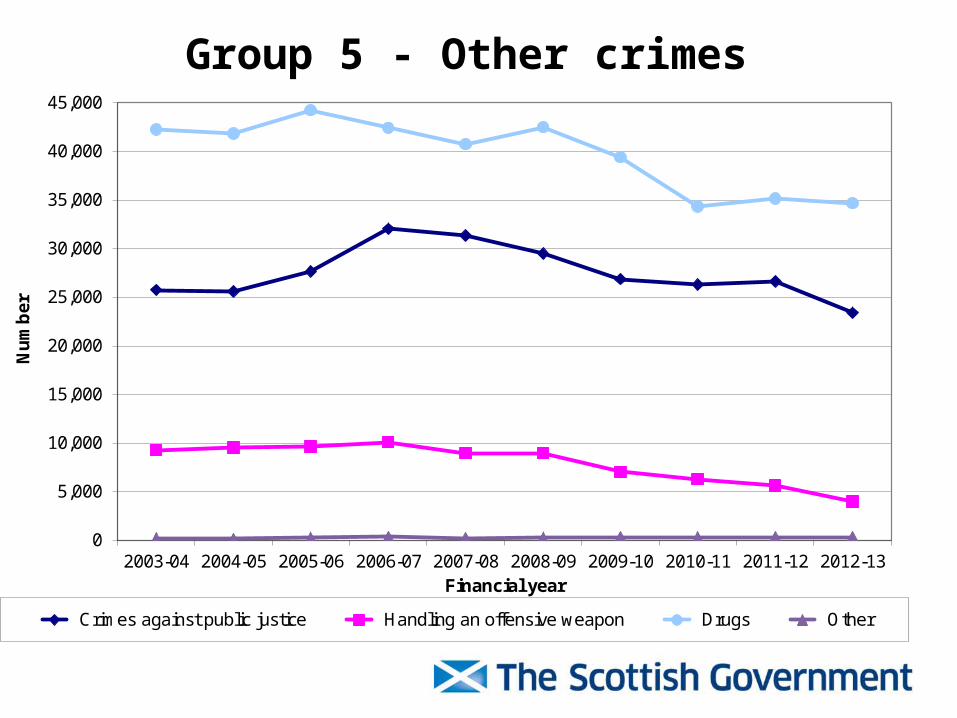
Group 5 - Other crimes
0
5,000
10,000
15,000
20,000
25,000
30,000
35,000
40,000
45,000
2003-04 2004-05 2005-06 2006-07 2007-08 2008-09 2009-10 2010-11 2011-12 2012-13
Nu
mb
er
Financial year
Crimes against public justice Handling an offensive weapon Drugs Other
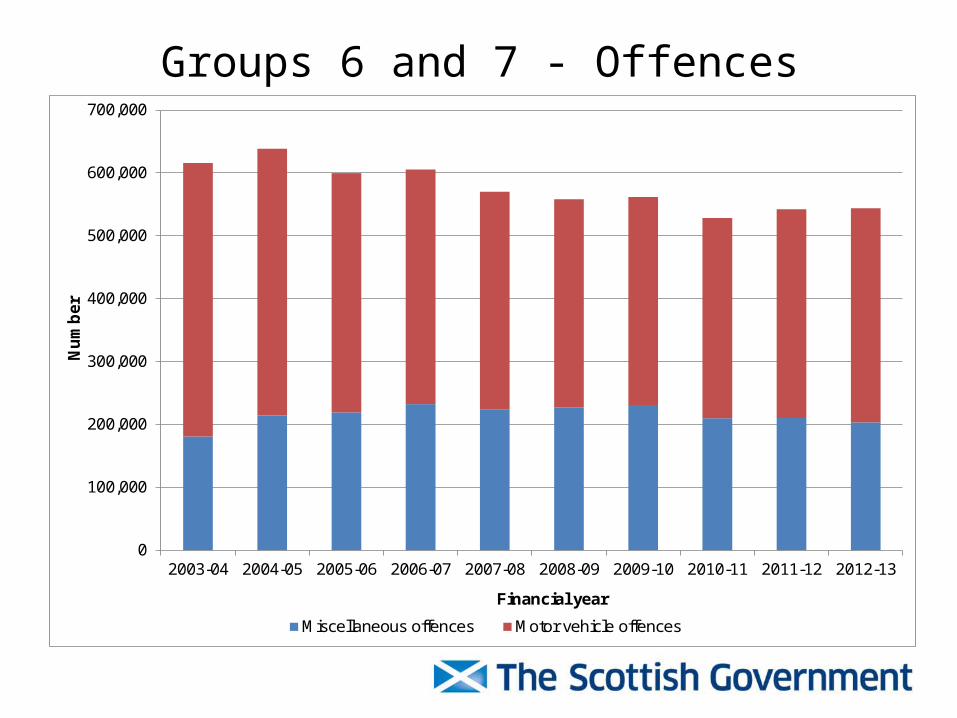
Groups 6 and 7 - Offences
0
100,000
200,000
300,000
400,000
500,000
600,000
700,000
2003-04 2004-05 2005-06 2006-07 2007-08 2008-09 2009-10 2010-11 2011-12 2012-13
Nu
mb
er
Financial year
Miscellaneous offences Motor vehicle offences

Group 6 – Miscellaneous offences
• Miscellaneous offences – down 3%
– Common assault – down 12%– Drunkenness - down 2%– Breach of the peace etc. – down 1%– Other offences – up 4%

Group 7 – Motor vehicle offences
• Motor vehicle offences – up 3%
– Dangerous and careless driving – up 7%– Driving under the influence offences – down 14%– Speeding offences – up 3%– Unlawful use of vehicle – down 1%– Vehicle defect offences – up 1%– Other motor vehicle offence – up 5%

Summary
• Overall, number of recorded crimes down 13% between 2011-12 and 2012-13 – just over 41,000 fewer crimes
– Non-sexual crimes of violence – down 21%– Sexual offences – up 5%– Crimes of dishonesty – down 12%– Crimes of fire-raising, vandalism – down 21%– Other crimes (including drug crimes) – down 8%
Police Reform
The Police and Fire Reform (Scotland) Act 2012 Prior to 1 April 2013:
•Eight police forces•Scottish Police Services Authority •Scottish Crime and Drug Enforcement Agency
From 1 April 2013 onwards:
•Police Scotland •Scottish Police Authority
Statistics from 2013-14 onwards
First set of statistics since establishment of Police Scotland following police reform.
Main changes:
•Geography – police force areas not presented
•Time series – local authority information for the past ten years

User Guide
• Scottish Crime Recording Standard and Counting Rules – summary
• Roles of organisations
• Data quality and QA procedures
• Classification of crimes and offences
• Changes to classifications/new legislation
• HMICS audits
• Comparability across the UK

Next steps - future consultation
Presentation of information in the forthcoming statistical bulletin
Recorded Crime in Scotland, 2013-14
•Focus on crime groups
•Interactive web tables
•Ten year trend information for local authorities
….as well as potential future considerations


![[David Campbell, David Campbell] Promoting Participation](https://img.pdfslide.net/doc/110x75/577c83a61a28abe054b5a6fa/david-campbell-david-campbell-promoting-participation.jpg)
