Embed Size (px)
Citation preview
Listening. Learning. Leading.®
Criterion-Related Validity of the TOEFL iBT Listening Section
Yasuyo Sawaki
Susan Nissan
ISSN 1930-9317
TOEFL iBT Research ReportTOEFLiBT-08February 2009
Criterion-Related Validity of the TOEFL® iBT Listening Section
Yasuyo Sawaki and Susan Nissan
ETS, Princeton, New Jersey
RR-09-02

ETS is an Equal Opportunity/Affirmative Action Employer.
As part of its educational and social mission and in fulfilling the organization's non-profit Charter and Bylaws, ETS has and continues to learn from and also to lead research that furthers educational and measurement research to advance quality and equity in education and assessment for all users of the organization's products and services.
Copyright © 2009 by ETS. All rights reserved.
No part of this report may be reproduced or transmitted in any form or by any means, electronic or mechanical, including photocopy, recording, or any information storage and retrieval system, without permission in writing from the publisher. Violators will be prosecuted in accordance with both U.S. and international copyright laws.
ETS, the ETS logos, GRADUATE RECORD EXAMINATIONS, GRE, TOEFL, and the TOEFL logo are registered trademarks of Educational Testing Service (ETS). The TEST OF ENGLISH AS A FOREIGN LANGUAGE is a trademark of ETS.
College Board is a registered trademark of the College Board.
i
Abstract
The study investigated the criterion-related validity of the Test of English as a Foreign
Language™ Internet-based test (TOEFL® iBT) Listening section by examining its relationship to
a criterion measure designed to reflect language-use tasks that university students encounter in
everyday academic life: listening to academic lectures. The design of the criterion measure was
informed by students’ responses to a survey on the frequency and importance of various
classroom tasks that require academic listening, and the relationship of these tasks to successful
course completion. The criterion measure consisted of three videotaped lectures (in physics,
history, and psychology) and included tasks created by content experts who are former university
professors of the relevant content area. These tasks reflected what the content experts expected
students to have comprehended during the lecture.
The criterion measure and the TOEFL iBT Listening section were administered to
nonnative speakers of English who were enrolled in undergraduate and graduate programs. Data
from 221 participants were analyzed. Substantial correlations were observed between the
criterion measure and the TOEFL iBT Listening section score for the entire sample and for
subgroups (Pearson correlation coefficients ranging from .56 to .74 and disattenuated
correlations ranging from .62 to .82). Moreover, the analysis of the mean scores on the criterion
measure for different ability groups indicated that participants who scored at or above typical cut
scores for international student admission to academic programs (i.e., TOEFL iBT Listening
section score of 14 or above) scored, on average, nearly 50% or more on the criterion measure,
demonstrating reasonable comprehension of the academic lectures.
Key words: Academic lecture comprehension, academic listening, corpus analysis, criterion-
related validity, TOEFL iBT Listening, university student survey
ii
The Test of English as a Foreign Language™ (TOEFL®) was developed in 1963 by the National Council on the Testing of English as a Foreign Language. The Council was formed through the cooperative effort of more than 30 public and private organizations concerned with testing the English proficiency of nonnative speakers of the language applying for admission to institutions in the United States. In 1965, Educational Testing Service (ETS) and the College Board® assumed joint responsibility for the program. In 1973, a cooperative arrangement for the operation of the program was entered into by ETS, the College Board, and the Graduate Record Examinations® (GRE®) Board. The membership of the College Board is composed of schools, colleges, school systems, and educational associations; GRE Board members are associated with graduate education. The test is now wholly owned and operated by ETS.
ETS administers the TOEFL program under the general direction of a policy board that was established by, and is affiliated with, the sponsoring organizations. Members of the TOEFL Board (previously the Policy Council) represent the College Board, the GRE Board, and such institutions and agencies as graduate schools of business, two-year colleges, and nonprofit educational exchange agencies.
Since its inception in 1963, the TOEFL has evolved from a paper-based test to a computer-based test and, in 2005, to an Internet-based test, TOEFL iBT. One constant throughout this evolution has been a continuing program of research related to the TOEFL test. From 1977 to 2005, nearly 100 research and technical reports on the early versions of TOEFL were published. In 1997, a monograph series that laid the groundwork for the development of TOEFL iBT was launched. With the release of TOEFL iBT, a TOEFL iBT report series has been introduced.
Currently this research is carried out in consultation with the TOEFL Committee of Examiners. Its members include representatives of the TOEFL Board and distinguished English as a second language specialists from the academic community. The Committee advises the TOEFL program about research needs and, through the research subcommittee, solicits, reviews, and approves proposals for funding and reports for publication. Members of the Committee of Examiners serve four-year terms at the invitation of the Board; the chair of the committee serves on the Board.
Current (2008-2009) members of the TOEFL Committee of Examiners are:
Alister Cumming (Chair) University of Toronto Geoffrey Brindley Macquarie University Frances A. Butler Language Testing Consultant Carol A. Chapelle Iowa State University John Hedgcock Monterey Institute of International Studies Barbara Hoekje Drexel University John M. Norris University of Hawaii at Manoa Pauline Rea-Dickins University of Bristol Steve Ross Kwansei Gakuin University Mikyuki Sasaki Nagoya Gakuin University Robert Schoonen University of Amsterdam Steven Shaw University of Buffalo
To obtain more information about the TOEFL programs and services, use one of the following:
E-mail: [email protected] Web site: www.ets.org/toefl
iii
Acknowledgments
This project could not have been completed without the help of many individuals. The authors are
thankful to those faculty members and students who participated in this study at 12 institutions in
the United States and Canada: California State University Fullerton, California State University
Los Angeles, Central Michigan University, Concordia University, Georgia State University,
Indiana University, Purdue University, University of California, Los Angeles, University of Iowa,
University of Toronto, University of Wisconsin at Madison, and Wesleyan University. Our special
thanks go to the faculty advisor, site coordinators, and proctors at each site:
California State University, Fullerton: Nathan Carr, Jillanne Thomas, Maggie Liu
California State University, Los Angeles: Alyse Breitbach, Juan Camarena, Antony J.
Kunnan
Central Michigan University: Leslie Grant, Brenda Seifi
Concordia University: Viphavee Vongpumivitch, Nina Padden
Georgia State University: Sharon Cavusgil, Jennifer Murphy Burke, Sara Cushing Weigle
Indiana University: Beverly Lynn Rolfs Ruiz, Paul Russell
Purdue University: April Ginther, Slobodanka Dimova
University of California, Los Angeles: Lyle Bachman, Zsuzsa Londe
University of Iowa: Micheline Chalhoub-Deville, Lia Plakans
University of Toronto: Alister Cumming, Khaled Barkaoui
University of Wisconsin, Madison: Kemtong Sinwongsuwat
Wesleyan University: Alice Hadler, Danielle Lemone, Emmanuel Paris-Bouvret, Mohammed Omar Sarwar
The validation of the criterion measure based on a corpus analysis employed in this study
was done with the assistance of Sheryl Bendheim and Wayne Lanciano at RegInfo, who
transcribed the video lectures, and Douglas Biber at Northern Arizona University, who tagged
the transcripts and ran a computer program to conduct the corpus data analyses.
iv
The ETS staff members below were instrumental in providing support in various ways to
coordinate the data collection, data entry, developing/reviewing study materials, and scoring
participant responses:
Paul Borysewicz Insook Chung Brian Feliciano
Pablo Garcia-Gomez Matthew Herbster Hae-Jin Kim
Teresa King Carol Kuc Regina Mercadante
Emily Midouhas William Monaghan Aris Noah
Susan Obetz Sarah Ohls Tony Ostrander
Mimi Perez George W. Pfeiffenberger Xiaoming Xi
Ann Marie Zolandz
Finally, the authors are grateful to Brent Bridgeman, Daniel Eignor, Mary Enright, John
Flowerdew, Robert French, and Larry Vandergrift for their careful reviews and insightful
comments on a previous version of this report.
v
Table of Contents
Page
Introduction..................................................................................................................................... 1
Review of Literature ....................................................................................................................... 2
Initial University Student Survey and Development of the Criterion Measure.............................. 8
University Student Survey....................................................................................................... 8
Method.............................................................................................................................. 8
Results ............................................................................................................................ 10
Development and Pilot Testing of the Criterion Measures ................................................... 17
Stimulus Material Selection ........................................................................................... 17
Item Writing ................................................................................................................... 19
Validation of the Selected Listening Stimuli.................................................................. 22
Pilot and Main Studies .................................................................................................................. 26
Pilot Study ............................................................................................................................. 26
Method............................................................................................................................ 27
Results ............................................................................................................................ 30
Main Study............................................................................................................................. 31
Method............................................................................................................................ 31
Results ............................................................................................................................ 36
Discussion and Conclusions ......................................................................................................... 42
References..................................................................................................................................... 48
Notes ............................................................................................................................................. 53
List of Appendixes........................................................................................................................ 55
vi
List of Tables
Page
Table 1. Tasks Requiring Academic Listening Included in the Survey.................................... 13
Table 2. Description of the Criterion Measure ......................................................................... 21
Table 3. LXMDCompare Analysis Results (Analysis 1): Comparison of Selected
Lectures With Undergraduate- and Graduate-Level Spoken Academic Texts
in the T2K SWAL Corpus .......................................................................................... 24
Table 4. LXMDCompare Analysis Results (Analysis 2): Comparison of Selected
Lectures With Undergraduate-Level Spoken Academic Texts in the
T2K SWAL Corpus .................................................................................................... 25
Table 5. Study Participant Demographic Data.......................................................................... 27
Table 6. Main Study Research Design...................................................................................... 33
Table 7. Descriptive Statistics (TOEFL iBT Listening Scaled Score) ..................................... 37
Table 8. Correlations Among the Video Exercises and the TOEFL iBT Listeninga ................ 40
Table 9. Descriptive Statistics on the Criterion Measure for High-, Intermediate-, and
Low-Scoring Groups on the TOEFL iBT Listening Section ...................................... 41
vii
List of Figures
Page
Figure 1. Subject areas of the courses reported by study participants......................................... 11
Figure 2. Formats of the courses reported by study participants................................................. 12
Figure 3. Frequency of various activities requiring student listening in the classroom. ............. 14
Figure 4. Importance of various activities requiring student listening in the classroom............. 14
Figure 5. Mean frequency of course assignments per course. ..................................................... 16
Figure 6. Mean percentage of final grade that course assignments contribute............................ 16
Figure 7. Information source for completing course assignments............................................... 17
Figure 8. Scatter plots and Pearson correlations for video sets and TOEFL Listening scores.... 39

1
Introduction
The Test of English as a Foreign Language™ Internet-based test (TOEFL® iBT) is
designed as a measure of English-language ability necessary for university academic studies in
North America (Jamieson, Jones, Kirsch, Mosenthal, & Taylor, 2000). This design reflects the
test designers’ claim that TOEFL iBT scores can be interpreted as a measure of academic
English ability. In order to support this claim, it is essential to demonstrate a relationship
between nonnative English speakers’ performance on the TOEFL iBT test and their performance
on criterion measures in the real world of academia. The criterion-relatedness of the TOEFL iBT
was one of the major foci of the test design. During the design phase, empirical studies were
conducted to investigate the relationship between scores on a prototype of the TOEFL iBT
(LanguEdge Courseware) and external measures of English-language ability. The results
demonstrated significant relationships between LanguEdge scores and learners’ self-assessments
and their teachers’ ratings of students’ language ability (Powers, Roever, Huff, & Trapani, 2003;
Roever & Powers, 2005).
The purpose of the present study is to provide empirical evidence on the criterion-related
validity of the TOEFL iBT, focusing specifically on the Listening section. The Listening section
is designed to assess academic listening ability in the context of academic lectures and
conversations that take place in various situations on campus. Given that an important goal of the
design of TOEFL iBT is to devise a measure that well represents the construct of academic
listening (Bejar, Douglas, Jamieson, Nissan, & Turner, 2000), an important step in building the
validity argument for the TOEFL iBT Listening section is to gather empirical evidence about its
relationship with an appropriate criterion measure of academic listening. As an attempt to
address this issue, this study employed a concurrent study design, where the relationship between
nonnative English speakers’ performance on the TOEFL iBT Listening section and their
performance on a criterion measure administered at the same time was investigated. Unique
characteristics of this study can be summarized as follows.
First, the design of the criterion measure in this study was informed by a survey
administered to university students about the types of in-class tasks that require academic
listening, as well as the types of course assignments that are frequent and important for success
in their academic courses. This was done because, although no one would argue against the
importance of academic lecture listening in undergraduate- and graduate-level courses, little
2
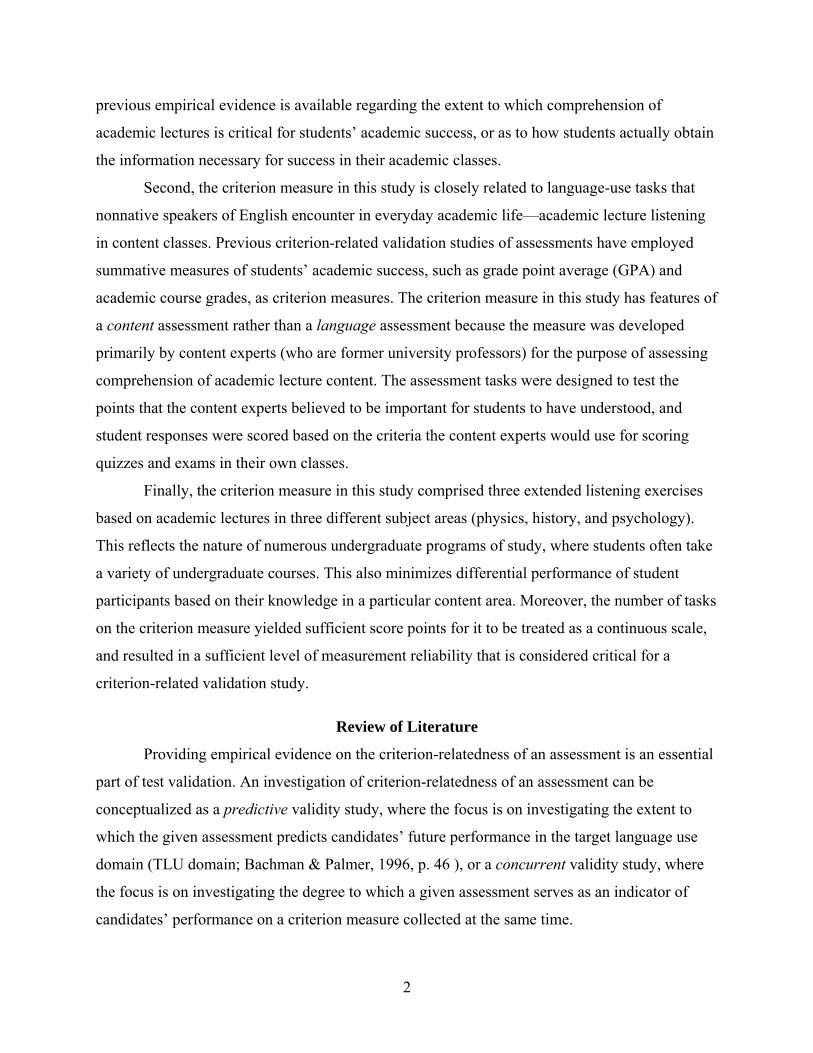
previous empirical evidence is available regarding the extent to which comprehension of
academic lectures is critical for students’ academic success, or as to how students actually obtain
the information necessary for success in their academic classes.
Second, the criterion measure in this study is closely related to language-use tasks that
nonnative speakers of English encounter in everyday academic life—academic lecture listening
in content classes. Previous criterion-related validation studies of assessments have employed
summative measures of students’ academic success, such as grade point average (GPA) and
academic course grades, as criterion measures. The criterion measure in this study has features of
a content assessment rather than a language assessment because the measure was developed
primarily by content experts (who are former university professors) for the purpose of assessing
comprehension of academic lecture content. The assessment tasks were designed to test the
points that the content experts believed to be important for students to have understood, and
student responses were scored based on the criteria the content experts would use for scoring
quizzes and exams in their own classes.
Finally, the criterion measure in this study comprised three extended listening exercises
based on academic lectures in three different subject areas (physics, history, and psychology).
This reflects the nature of numerous undergraduate programs of study, where students often take
a variety of undergraduate courses. This also minimizes differential performance of student
participants based on their knowledge in a particular content area. Moreover, the number of tasks
on the criterion measure yielded sufficient score points for it to be treated as a continuous scale,
and resulted in a sufficient level of measurement reliability that is considered critical for a
criterion-related validation study.
Review of Literature
Providing empirical evidence on the criterion-relatedness of an assessment is an essential
part of test validation. An investigation of criterion-relatedness of an assessment can be
conceptualized as a predictive validity study, where the focus is on investigating the extent to
which the given assessment predicts candidates’ future performance in the target language use
domain (TLU domain; Bachman & Palmer, 1996, p. 46 ), or a concurrent validity study, where
the focus is on investigating the degree to which a given assessment serves as an indicator of
candidates’ performance on a criterion measure collected at the same time.

3
Although limited in number, compared to the sheer volume of studies addressing
criterion-related validity of assessments in educational measurement (e.g., see a recent meta-
analysis of predictive validity studies of GRE® by Kuncel, Hezlett, & Ones, 2001), there are
some published studies of criterion-related validity of language assessments. Previous predictive
validity studies involving language assessments investigated the effectiveness of language
measures in predicting academic success among nonnative English speakers. Various measures
were employed in these studies. For example, among the 19 studies reviewed by Graham (1987),
a majority employed TOEFL scores as the measures of language ability, while others used scores
on English-language placement tests developed at institutions for placing freshman into remedial
and regular English courses. The most frequently used measure of academic success in these
studies was grade-point average (GPA), while others operationalized academic success in terms
of course grades; obtaining a degree, certificate, or a credential; and permission to continue at
higher levels. The results of these studies are mixed. About half of the studies reviewed by
Graham (1987), for instance, found nonsignificant correlations between measures of language
ability and academic success, leading the authors to conclude that the language ability measures
were not useful predictors of academic success. In contrast, the other half concluded the opposite
because of significant correlations found between measures of language ability and academic
success, although they were low to moderate.
Compared to moderate effect sizes for predictive validity coefficients typically reported
in educational measurement (Kuncel et al., 2001), the validity coefficients reported in the
predictive validity studies of language assessments above are not encouraging. One reason for
these findings could be the mismatch between the constructs tapped into by the assessments
being validated (i.e., measures of language ability) and those targeted by the criterion measures
(i.e., academic success). Previous studies investigated the relative effectiveness of aptitude tests
and language-ability measures for predicting GPA. For example, Sharon (1972) studied the
extent to which measures of these two conceptually distinct dimensions of international
graduate-student ability, the GRE Verbal and Quantitative subtests (GRE-V and GRE-Q,
respectively) and the TOEFL test, contribute to prediction of GPA. Results showed that the best
predictor of GPA was the GRE-Q subtest, while the validity coefficients for the GRE-V subtest
and the TOEFL test were lower. Moreover, linear combinations of the GRE-V or GRE-Q scores
with the TOEFL scores did not add significantly to the prediction of GPA compared to when
4
either the GRE-V subtest score or the GRE-Q subtest score was used as the single predictor. As
Sharon (1972) indicated, these results seem to suggest that students’ aptitude may be more
closely related to an indicator of academic success such as GPA, while language ability is rather
“a necessary, although not sufficient, prerequisite for graduate school success” (p. 425).
Statistical reasons also explain the generally weak correlations found between measures of
language ability and criterion measures of academic success. Effects of restriction of range on
correlation coefficients are an often-mentioned limitation of predictive validity studies, while
other statistical issues must also be carefully considered in order to appropriately interpret study
findings. For example, in a recent study conducted in Australia, Hill, Storch, and Lynch (1999)
investigated predictive validity of the TOEFL test and the International English Language
Testing System (IELTS) when GPA was used as the criterion measure of academic success. Hill
et al. reported a moderate Pearson correlation coefficient between the total score on the IELTS
and GPA among international students at the University of Melbourne (r = .540), while that
between the TOEFL score and GPAs was weak (r = .287). However, the extremely small sample
sizes on which these statistics are based (N = 35 for IELTS and N = 27 for TOEFL scores) may
make the results unstable. Moreover, the lower correlation found for TOEFL scores was partly
due to a curvilinear relationship between TOEFL scores and GPA.
A more fundamental issue, however, is the quality of criterion measures employed, on
which the interpretability of results of criterion-related validity studies hinges. It has been
suggested in the previous literature that criterion measures must be validated like any other tests
in terms of their construct representativeness, susceptibility to construct-irrelevant sources of
variance, and reliability (American Educational Research Association [AERA], American
Psychological Association [APA], & National Council on Measurement in Education [NCME],
1999; Messick, 1989). Commonly used criterion measures in predictive validity studies such as
GPA and course grades are certainly important measures of academic success. However, GPA
and course grades can be difficult to interpret for various reasons. For example, Hartnett and
Willingham (1980) listed three difficulties of using these measures as a criterion of academic
success: (a) lack of variability of grades assigned, particularly in graduate schools, which leads to
attenuation of validity coefficients; (b) dramatically different and sometimes arbitrary grading
standards employed across disciplines as well as within disciplines across institutions; and (c)
reflection of differential values faculty assign to different types of achievements in grades.
5
In addition, the previously discussed criterion measures of academic success are
summative in nature. The aggregated nature of those measures masks how nonnative speakers
of English actually perform in classroom. In order to address this issue, it is worth seeking an
alternative measure of academic success that is more reflective of what nonnative speakers of
English actually have to do with the language in the academic domain. One reasonable TLU
task would be listening to academic lectures because students in higher education spend
considerable amount of time attending classes. Although academic lecture listening has not
been employed as a criterion measure in previous criterion-related validity studies of language
assessments, to the best of the authors’ knowledge, there is a rich body of literature in applied
linguistics on the nature of academic lecture listening and factors affecting nonnative English
speakers’ performance on their comprehension of academic lectures. For example, the
distinctness of academic listening skills compared to listening skills associated with
conversations was originally pointed out by Richards (1983) in his taxonomy of academic
listening skills. Powers’ (1985) survey of university faculty and students sheds further light on
the relative importance and frequency of various listening skills in academic contexts.
Subsequent empirical studies conducted in the 1980s through the present have focused on
various aspects of listening comprehension of academic lectures and have advanced our
understanding on this topic in some key areas including: (a) the discourse patterns of academic
lectures (DeCarrico & Nattinger, 1988; Dudley-Evans, 1994) and the effects of discourse
markers on listener comprehension (Chaudron & Richards, 1986; Dunkel & Davis, 1994;
Flowerdew & Tauroza, 1995), (b) the importance of deployment of appropriate listening
strategies in academic listening (e.g., Olson & Huckin, 1990; Rost, 1994; Tauroza & Allison,
1994), and (c) the role of note taking in academic listening (e.g., Carrell, 2007; Carrell, Dunkel,
& Mollaun, 2002; Chaudron, Loschky, & Cook, 1994).
In order for academic lecture listening to be useful as a measure of academic success in a
criterion-related validity of a language assessment, a few issues must be addressed. First,
although the considerable amount of time that students devote to attending classes makes it seem
reasonable to consider that understanding academic lectures is an important criterion for
nonnative English speakers’ success, the extent to which such lectures are actually perceived as
important by faculty and students needs to be fully investigated.
6
Second, the tasks used in previous studies specifically designed to address particular
questions in applied linguistics may not represent the features of actual lecture-listening tasks
that students perform in the TLU domain. For example, as pointed out by Flowerdew (1994),
the ability to listen to a long stretch of discourse without opportunities to facilitate
comprehension by asking questions or requesting repetition or clarification of information is an
important aspect of academic listening. However, lecture segments employed in previous
empirical studies were rather short. Many studies employed lecture segments of 3 to 16 minutes,
while a relatively smaller number of studies employed lectures of 20 minutes or longer (e.g.,
Chaudron & Richards, 1986; Flowerdew & Tauroza, 1995; Khuwaileh, 1999). Furthermore,
many previous studies included only one lecture as the stimulus material. Considerable
variability of examinee performance across tasks has been reported in previous language
performance assessment studies in different modalities (e.g., Brennan, Gao, & Colton, 1995;
Lee, 2005, Lee & Kantor, 2005; Sawaki, 2005; Xi & Mollaun, 2006). Thus, a validation study
would require multiple tasks of considerable length to address the generalizability of the results
to various lectures. Moreover, previous research has shown that various features of listening
stimuli affect task difficulty (e.g., Brindley & Slatyer, 2002; Buck & Tatsuoka, 1998; Freedle &
Kostin, 1999; Nissan, DeVincenzi, & Tang, 1996; Rupp, Garcia, & Jamieson, 2001). Thus,
stimulus materials for such tasks should be selected with careful consideration of key variables
such as topics, subject areas, and lecture styles, as well as information load, which is affected by
professor lecture style and by subject area.
Finally, and most important, the task types employed for the measures of listening
comprehension of academic lectures in criterion-related validity studies must be well aligned
with important task types in the TLU domain. In terms of the task types, many previous studies
employed extended-response task types such as oral and written summaries (e.g., Flowerdew &
Tauroza, 1995; Olson & Huckin, 1990; Rost, 1994) and immediate free recall (e.g., Dunkel &
Davis, 1994; Tauroza & Allison, 1994), while relatively few others (e.g., Chaudron et al., 1994;
Chaudron & Richards, 1986; Flowerdew & Tauroza, 1995; Hansen & Jensen, 1994) employed
selected-response or short-answer item types. Few previous researchers mentioned the rationale
for the selection of these task types. A notable exception, however, is Hansen and Jensen’s
(1994) study. In that study the authors explicitly stated that the importance of short-answer
7
questions as reported by university faculty and students in Powers’ (1986) study provided the
rationale for employing that task type in their study.
Equally important is the alignment of the scoring criteria with those in the TLU domain.
A majority of previous studies on academic lecture comprehension deployed tasks and scoring
guidelines developed by the investigators (i.e., English as a second language [ESL] specialists or
applied linguists) for assessing listening comprehension; there are only a few instances where
measures of academic success employed in actual content courses are utilized. For example,
Khuwaileh (1999) employed study participants’ grades on a quiz that instructors of an
engineering course administered to assess their students’ understanding of the lecture content.
Recent literature on language performance assessment for specific purposes emphasizes,
however, that the criteria used by specialists of a content domain can be quite different from
those of English teachers, suggesting the importance of employing indigenous assessment
criteria to make results of language assessment useful in a particular domain (e.g., Douglas,
2000; Jacoby & McNamara, 1999; McNamara, 1996). Thus, in a criterion-related validity study,
it is important to test the content covered in a lecture that a course instructor believes is
important enough for testing, and the scoring criteria must also reflect the actual criteria used for
assessment of students’ successful performance in academic courses.
The present study employs a research design that addresses some of the potential
limitations of the previous approaches discussed above. First, the feasibility of using a criterion
measure that focuses more on nonnative English speakers’ performance in class—academic
lecture comprehension in this case—was explored in a small-scale survey to which a small
sample of university students responded. This survey also informed the appropriate task types to
be employed in the lecture-comprehension tasks. Second, the present study employed multiple,
relatively long lectures as the measure of the academic language ability to enhance
generalizability of the study findings. Finally, the lecture-comprehension tasks and the scoring
criteria were developed by the authors in collaboration with experts in the three content areas of
the lectures employed in this study in order to reflect the content experts’ viewpoints in the task
design. These experts were involved in the entire process of developing the exercises and scoring
criteria. By taking this approach, the present study addressed the following research questions:
1. What is the relationship between nonnative English speakers’ performance on the
TOEFL iBT Listening items and their performance on tasks that assess

8
comprehension of content of videotaped academic lectures? Are there differences in
the correlations between the measures across gender, academic status, and major field
of study subgroups?
2. To what extent do nonnative speakers of English in high-, intermediate-, and low-
scoring groups on the TOEFL iBT Listening section comprehend the content of
academic lectures as measured by the criterion measure?
Initial University Student Survey and Development of the Criterion Measure
As discussed in the previous section, the present study employed academic lecture
comprehension exercises as the criterion measure. The design of the measure was informed by a
university-student survey on frequency and importance of various tasks requiring listening in the
classroom. As part of this survey, frequency and importance of various course assignments that
require listening at different degrees were investigated as well. Collecting information about
these course assignments is important because performance on course assignments are typically
the basis for obtaining students’ course grades, an important criterion of academic success.
University Student Survey
The survey study was conducted at four universities in the United States (Central
Michigan University; University of California, Los Angeles [UCLA]; University of Iowa; and
University of Wisconsin at Madison) in April and May 2004. The purpose of the survey was to
collect information regarding (a) the types of activities involving listening comprehension that
students engage in while participating in lower-division undergraduate and first-
year/introductory graduate academic courses and (b) the relationship of various class activities
and assignments to the successful completion of academic courses.
Method
Participants. The participants were native and nonnative speakers of English enrolled in
undergraduate and graduate academic courses at the four participating institutions. Site
coordinators at the institutions recruited student participants locally by giving five-minute
recruitment announcements before and after upper-division undergraduate and introductory
graduate courses. The recruitment announcements were given in various courses in six target
subject areas, which were selected as the focus of investigation based on an academic English

9
job-analysis study by Rosenfeld, Leung, and Oltman (2001). The following disciplines were
chosen because they have large numbers of foreign students: chemistry, computer and
information sciences, electrical engineering, psychology, business management, and history.
Usable data were returned from 145 undergraduate and graduate students in the four
participating institutions.1 There were 39 participants at Central Michigan University, 23 at
UCLA, 55 at the University of Iowa, and 28 at the University of Wisconsin at Madison. Among
the 145 participants, 84 (57.9%) were male and 58 (40.0%) were female (data for 3 students
were missing). Eighty-six students (59.3%) were undergraduate students, while 58 (40.0%) were
graduate students enrolled in a master’s or doctoral degree program or in a professional school.
The number of years in the academic program at the time of the survey was 1 year or less for 45
(31.0%), 2 years for 53 (36.6%), 3 years for 27 (18.6%), and 4 years or more for 19 (13.1%).
Survey instrument and the procedure. The survey instrument employed in this study is
presented in Appendix A. The list of academic listening activities included as part of the survey
questions were informed by taxonomies of academic listening skills (Buck, 2001; Richards,
1983), a university faculty and student survey conducted by Powers (1985), and previous job
analyses of language tasks in the academic domain (Rosenfeld et al., 2001). The development of
the items related to course assignments was informed by previous studies on this topic as well
(Ginther & Grant, 1996; Hale et al., 1996; Waters, 1996). It is worth noting that such taxonomies
are not often validated empirically. However, the listening skills and tasks identified in these
taxonomies were deemed appropriate for the purpose of describing different classroom contexts
that involve academic listening in the survey.
In the introduction section of the survey, each participant was instructed to think about a
specific lower-division undergraduate course or a first-year/introductory graduate course that
enrolled nonnative speakers of English and use his or her experience with that class to answer
various questions in the survey. Section 1 asked questions regarding the frequency and
importance of various classroom tasks that require listening. This section required the participant
to provide two ratings on each of the 17 academic tasks in response to the statement, “Please
indicate how often you engage in various activities requiring listening while in class and how
important it is for you to understand the spoken materials presented in order to perform well in
the course.” The participant was required to answer the question about frequency of the given
academic listening task on a 4-point scale: 0 (Never), 1 (Once or a few times a term), 2 (Once a
10
week), and 3 (Almost every class session). Another 4-point rating scale was used for the
importance rating: 0 (Not relevant), 1 (Somewhat important), 2 (Important), and 3 (Extremely
important). The Cronbach’s alpha values for the frequency and importance ratings across the 17
items were .85 and .83, respectively (based on listwise deletion on all measures within each
category; N = 128).
Sections 2 and 3 addressed the frequency and importance of various class activities and
course assignments. These sections required the participant to provide answers to three questions
for each of the 13 different class activities and assignments: “For the following list of activities
please indicate how many times during the term of the course you are required to complete the
activity and what percentage of the final course grade is comprised of each” (section 2), and
“Please indicate from where you obtain the information required to complete the activities listed
below” (section 3). To assign two ratings for each of the assignments included in section 2, the
participant wrote down, for each activity or assignment, the number of times per course and
percentage of final grade. Means of participant responses to these items were used for
subsequent analyses. For section 3, the participant indicated the information source used to
complete the assignments included in section 2. The instruction given to the participant was
“Please indicate from where you obtain the information required to complete the activities listed
below,” and the participant selected the most appropriate option among three, Information
ONLY presented ORALLY in class; Some information presented orally in class, and other
information obtained in OTHER ways; and Information ONLY presented in OTHER ways (e.g.,
reading text books). The Cronbach’s alpha for the 13 items on the information source in section
3 was .75 (based on listwise deletion on all measures; N = 90).
Each participant completed a consent form and the survey on paper on their own and
returned the completed forms to the site coordinator of the given institution. Each participant
received a $10 gift certificate upon completion.
Results
Course demographics. As part of the survey the participants provided information about
the characteristics of the courses on which they completed the survey. Among the 145
participants, 70 (48.3%) responded based on lower-division undergraduate-level courses, while
66 (45.5%) responded based on first-year or introductory graduate-level courses. The remaining
11
9 (6.2%) did not provide course-level information and thus were excluded from subsequent
analyses. This resulted in a final sample size of 136.
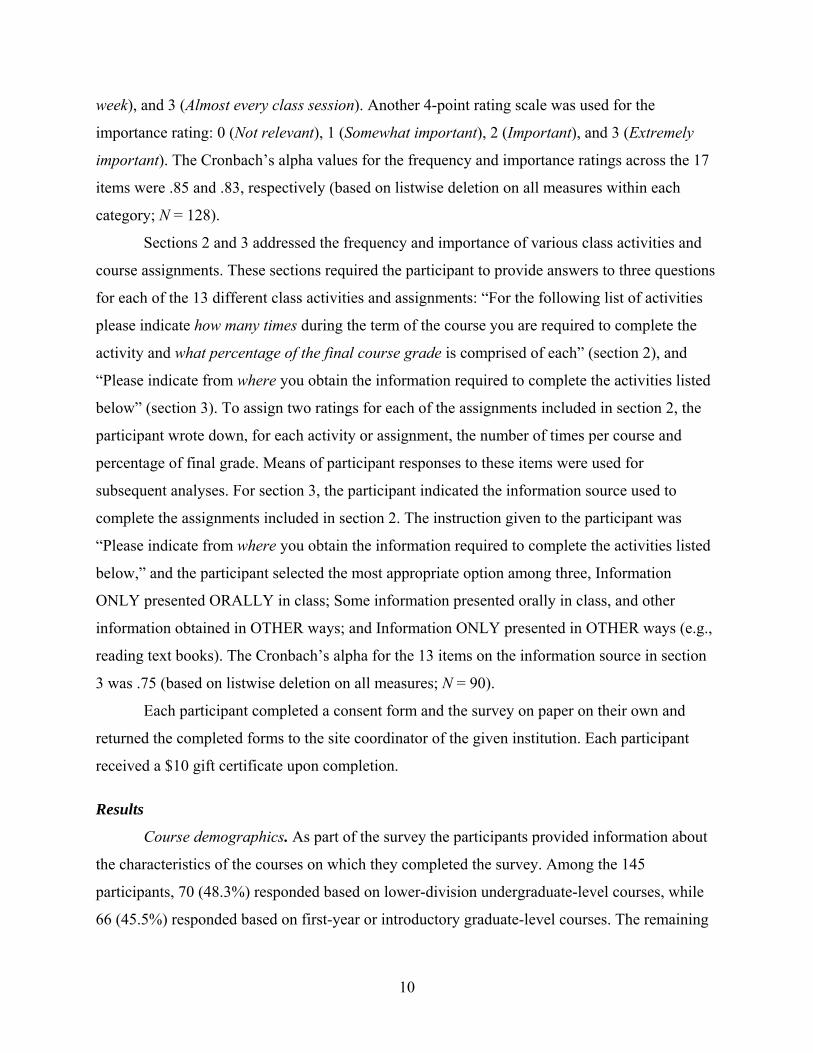
A rough estimate of the number of undergraduate and graduate courses represented in the
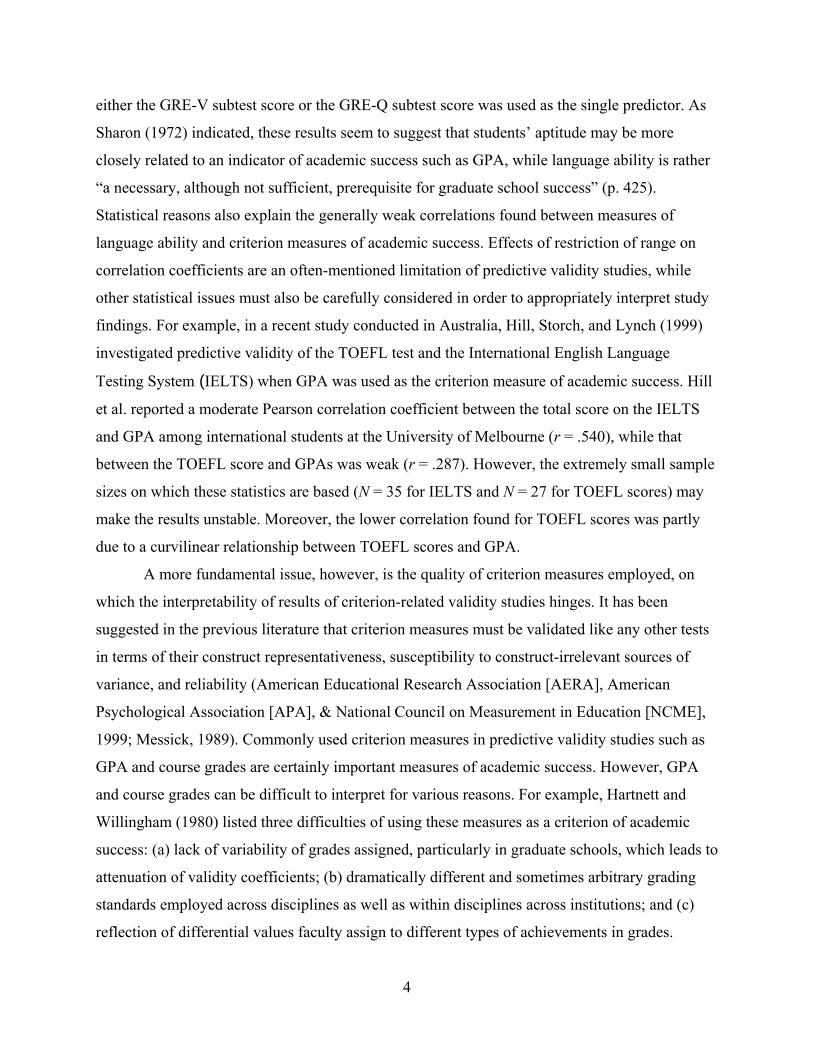
data ranged from 89 to 115.2 There were some differences in the distributions of the subject areas
and formats of the courses reported across the undergraduate- and graduate-level courses (see
Figures 1 and 2). In terms of subject area, social science courses were the majority of the courses
being reported on for undergraduate courses (39, or 55.7%), followed by 13 (18.6%) physical
science courses and 17 (24.3%) courses in other disciplines.3 In contrast, physical science
courses were the majority for the graduate-level courses (35, or 53.0%), followed by 23 (34.8%)
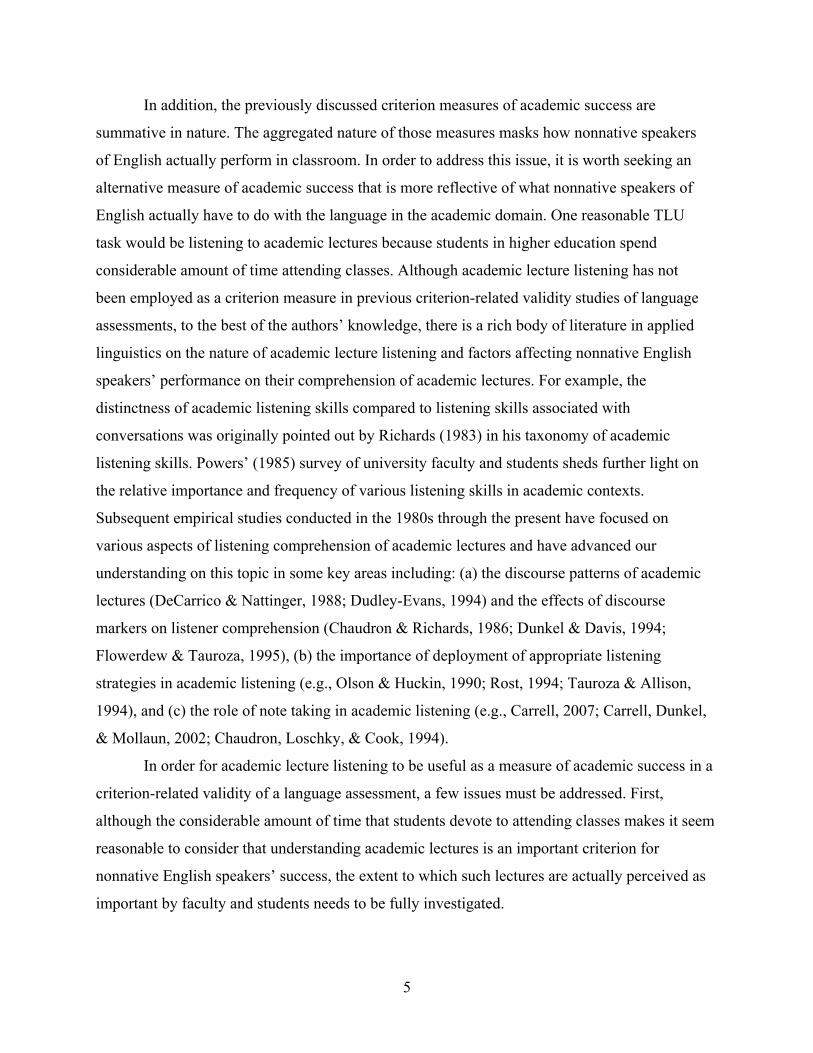
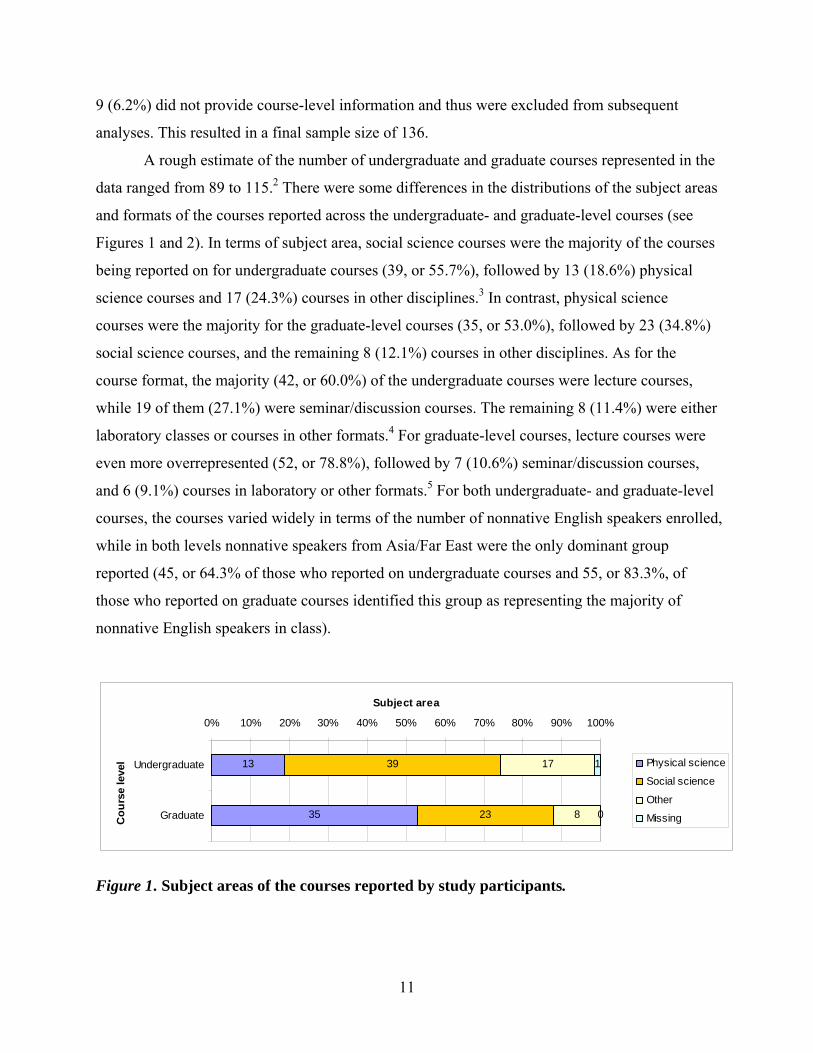
social science courses, and the remaining 8 (12.1%) courses in other disciplines. As for the
course format, the majority (42, or 60.0%) of the undergraduate courses were lecture courses,
while 19 of them (27.1%) were seminar/discussion courses. The remaining 8 (11.4%) were either
laboratory classes or courses in other formats.4 For graduate-level courses, lecture courses were
even more overrepresented (52, or 78.8%), followed by 7 (10.6%) seminar/discussion courses,
and 6 (9.1%) courses in laboratory or other formats.5 For both undergraduate- and graduate-level
courses, the courses varied widely in terms of the number of nonnative English speakers enrolled,
while in both levels nonnative speakers from Asia/Far East were the only dominant group
reported (45, or 64.3% of those who reported on undergraduate courses and 55, or 83.3%, of
those who reported on graduate courses identified this group as representing the majority of
nonnative English speakers in class).
13
35
39
23
17
8
1
0
0% 10% 20% 30% 40% 50% 60% 70% 80% 90% 100%
Undergraduate
GraduateCou
rse
leve
l
Subject area
Physical science
Social science
Other
Missing
Figure 1. Subject areas of the courses reported by study participants.
12
42
52
19
7
8
6
1
1
0% 10% 20% 30% 40% 50% 60% 70% 80% 90% 100%
Undergraduate
Graduate Cou
rse
leve
lCourse format
Lecture Seminar/discussionOtherMissing
Figure 2. Formats of the courses reported by study participants.
Initially the participant responses on the three major sections of the survey were analyzed
for the undergraduate- and graduate-level courses separately. However, because the patterns
observed on the survey results were highly similar across the two levels, only the results based
on the aggregated data (N = 136) will be reported below.
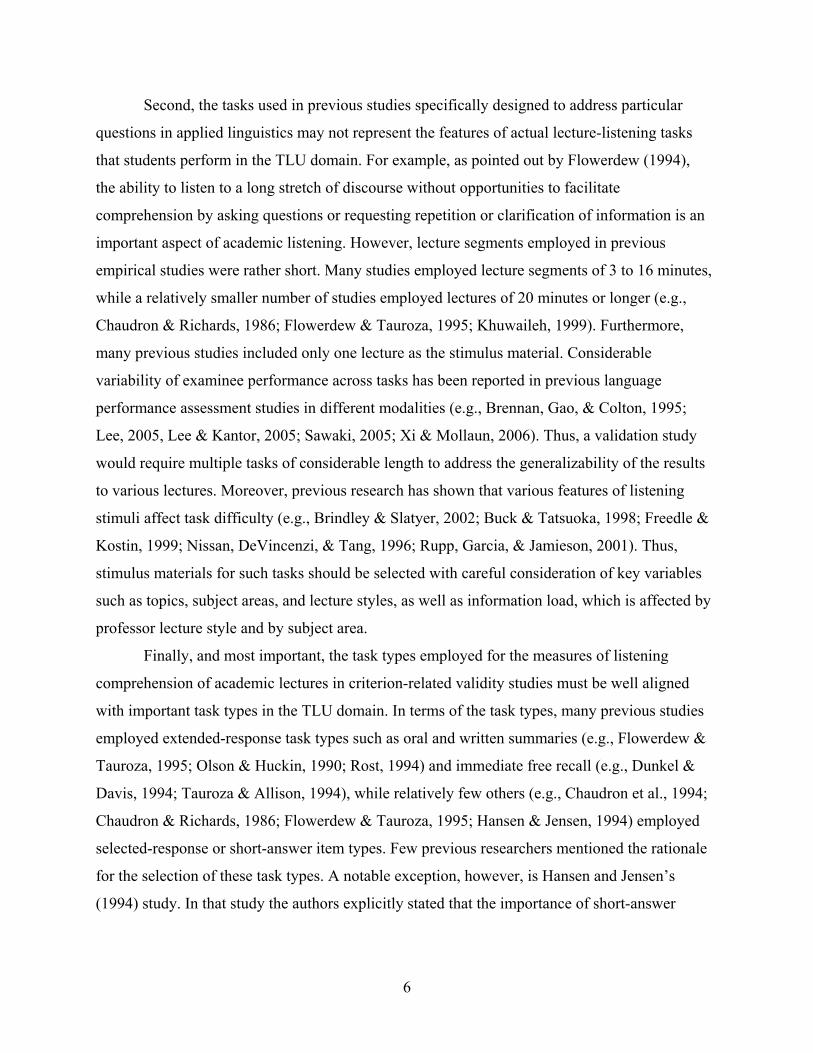
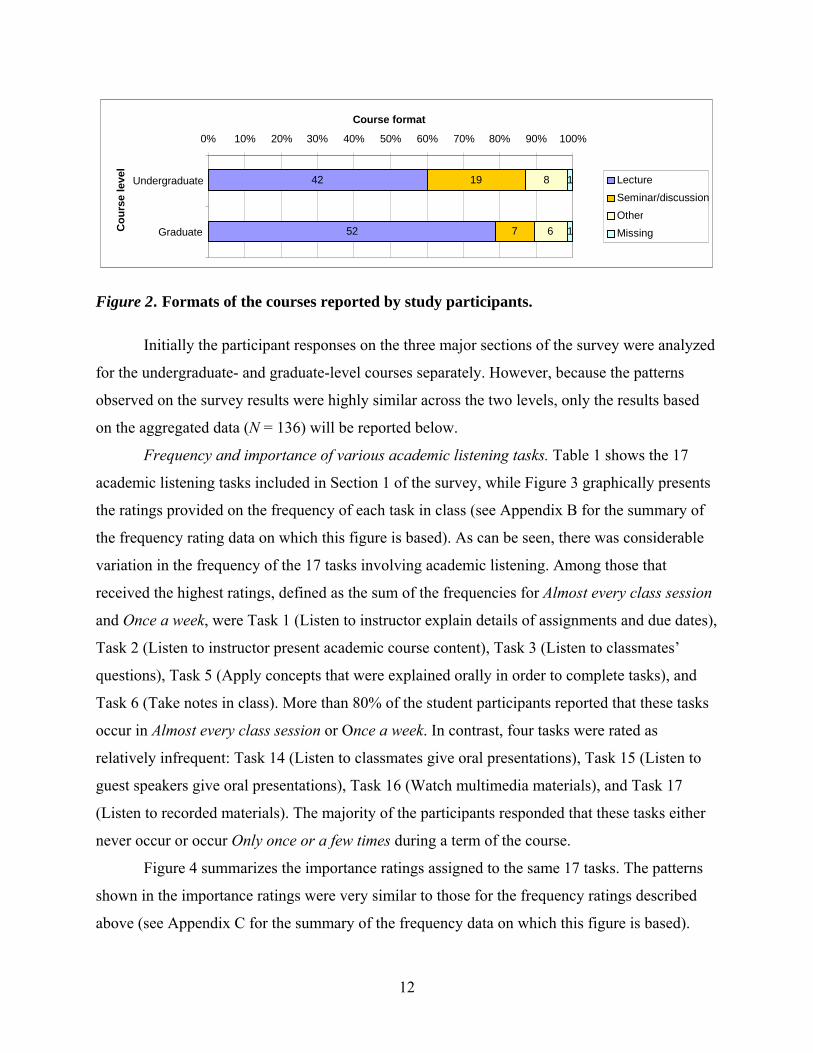
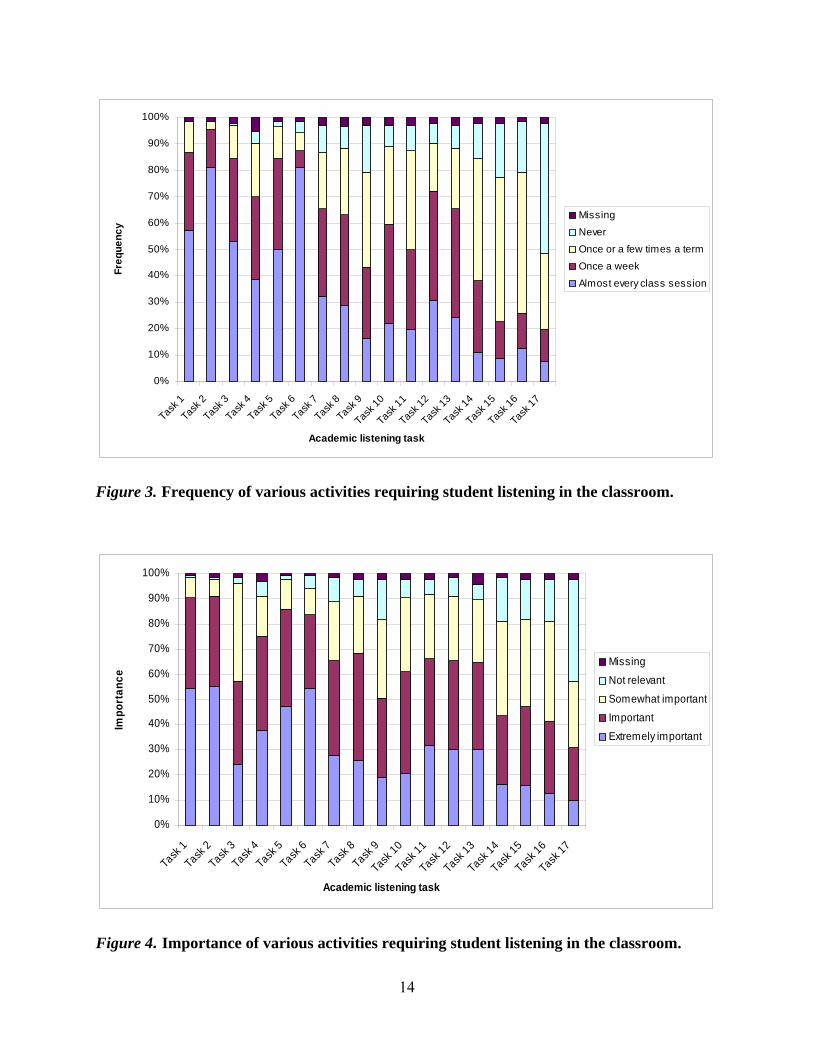
Frequency and importance of various academic listening tasks. Table 1 shows the 17
academic listening tasks included in Section 1 of the survey, while Figure 3 graphically presents
the ratings provided on the frequency of each task in class (see Appendix B for the summary of
the frequency rating data on which this figure is based). As can be seen, there was considerable
variation in the frequency of the 17 tasks involving academic listening. Among those that
received the highest ratings, defined as the sum of the frequencies for Almost every class session
and Once a week, were Task 1 (Listen to instructor explain details of assignments and due dates),
Task 2 (Listen to instructor present academic course content), Task 3 (Listen to classmates’
questions), Task 5 (Apply concepts that were explained orally in order to complete tasks), and
Task 6 (Take notes in class). More than 80% of the student participants reported that these tasks
occur in Almost every class session or Once a week. In contrast, four tasks were rated as
relatively infrequent: Task 14 (Listen to classmates give oral presentations), Task 15 (Listen to
guest speakers give oral presentations), Task 16 (Watch multimedia materials), and Task 17
(Listen to recorded materials). The majority of the participants responded that these tasks either
never occur or occur Only once or a few times during a term of the course.
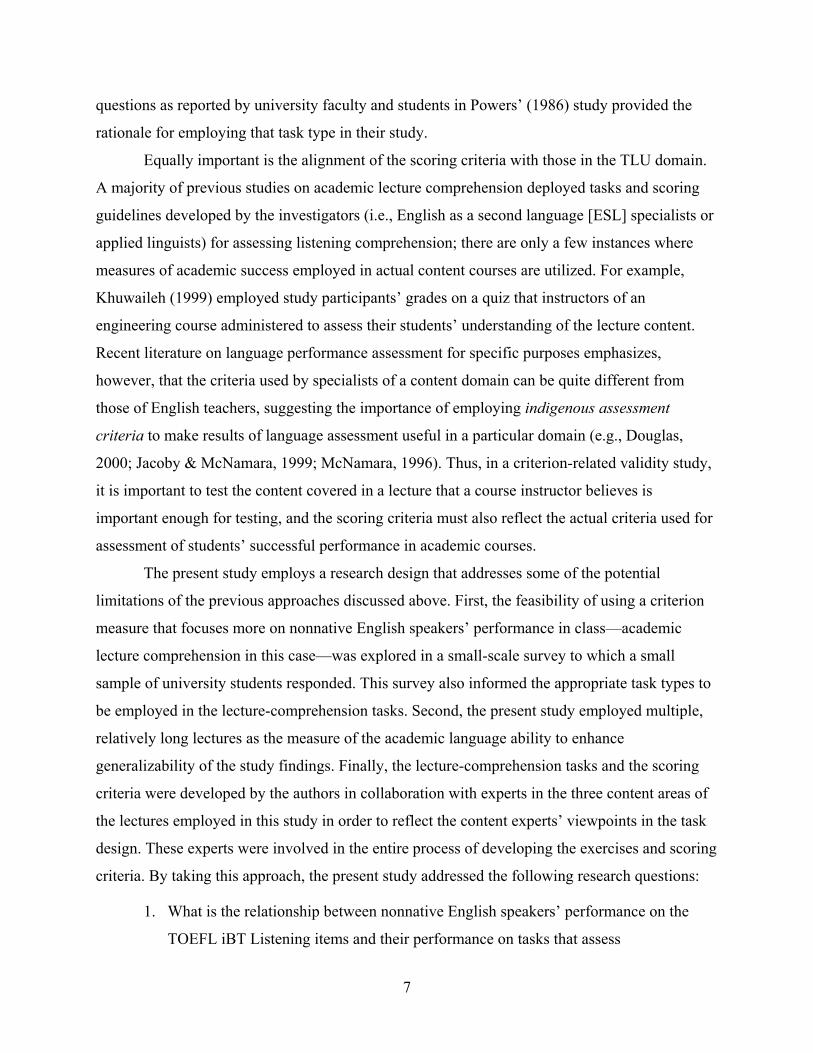
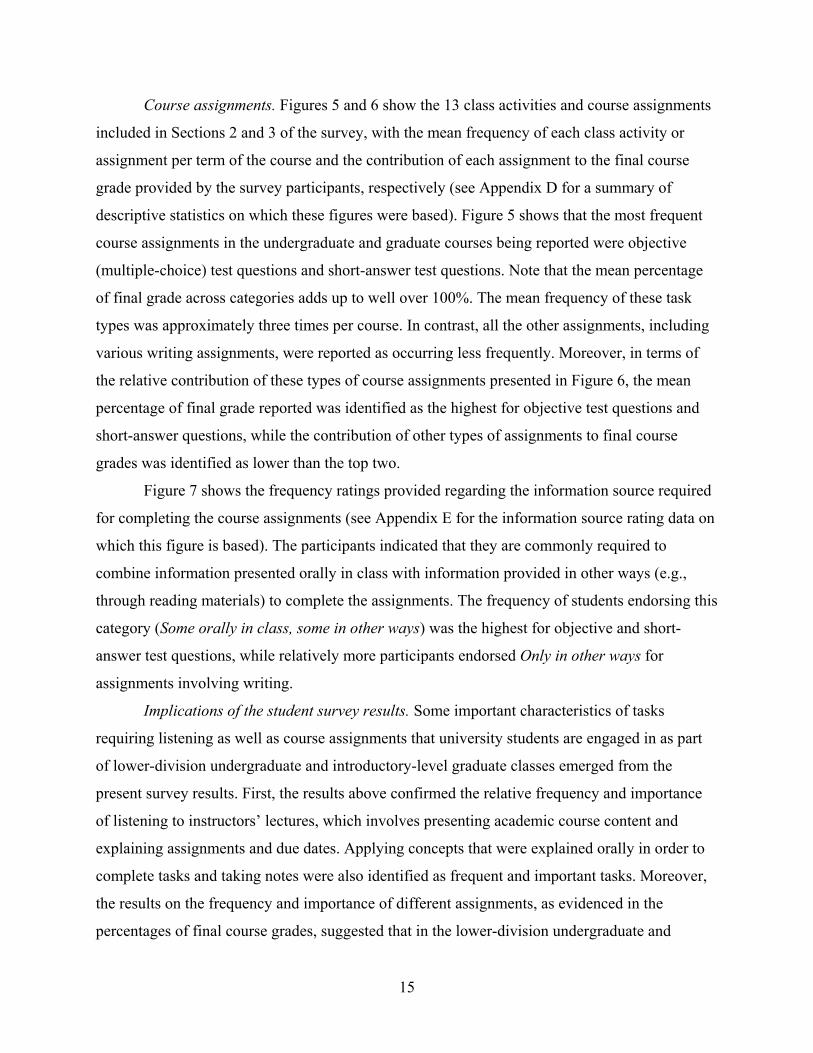
Figure 4 summarizes the importance ratings assigned to the same 17 tasks. The patterns
shown in the importance ratings were very similar to those for the frequency ratings described
above (see Appendix C for the summary of the frequency data on which this figure is based).
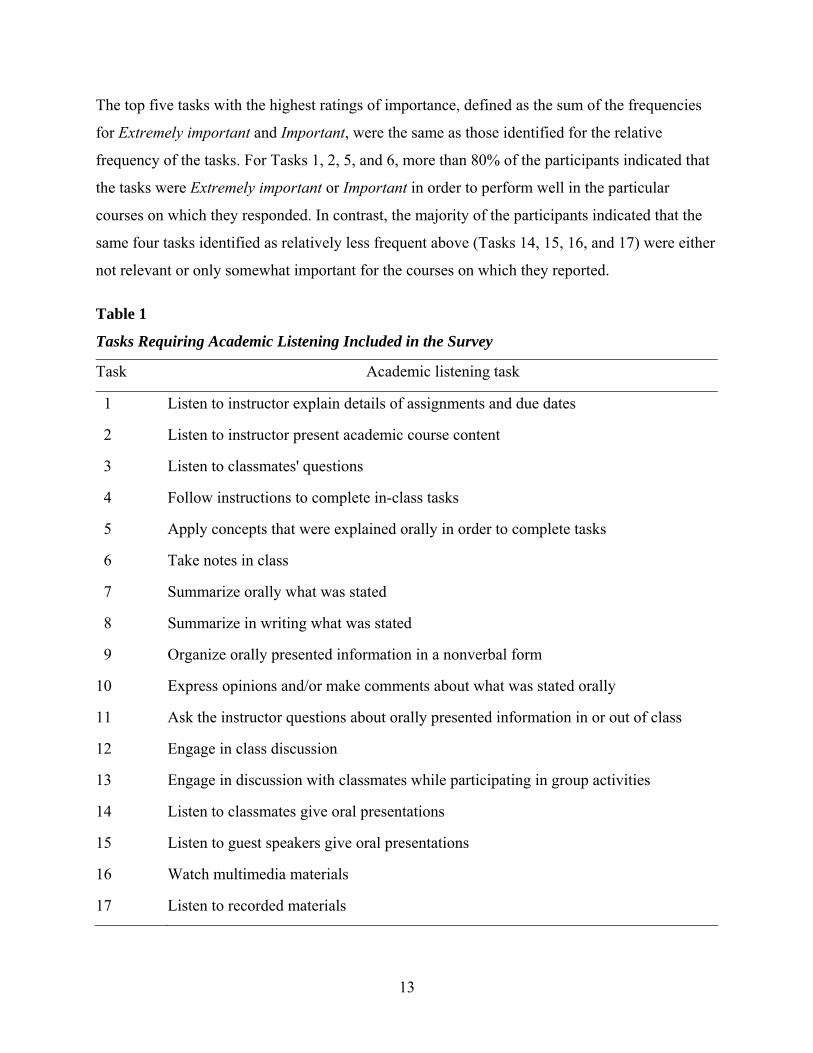
13
The top five tasks with the highest ratings of importance, defined as the sum of the frequencies
for Extremely important and Important, were the same as those identified for the relative
frequency of the tasks. For Tasks 1, 2, 5, and 6, more than 80% of the participants indicated that
the tasks were Extremely important or Important in order to perform well in the particular
courses on which they responded. In contrast, the majority of the participants indicated that the
same four tasks identified as relatively less frequent above (Tasks 14, 15, 16, and 17) were either
not relevant or only somewhat important for the courses on which they reported.
Table 1
Tasks Requiring Academic Listening Included in the Survey
Task Academic listening task
1 Listen to instructor explain details of assignments and due dates
2 Listen to instructor present academic course content
3 Listen to classmates' questions
4 Follow instructions to complete in-class tasks
5 Apply concepts that were explained orally in order to complete tasks
6 Take notes in class
7 Summarize orally what was stated
8 Summarize in writing what was stated
9 Organize orally presented information in a nonverbal form
10 Express opinions and/or make comments about what was stated orally
11 Ask the instructor questions about orally presented information in or out of class
12 Engage in class discussion
13 Engage in discussion with classmates while participating in group activities
14 Listen to classmates give oral presentations
15 Listen to guest speakers give oral presentations
16 Watch multimedia materials
17 Listen to recorded materials
14
0%
10%
20%
30%
40%
50%
60%
70%
80%
90%
100%
Task
1
Task
2
Task
3
Task
4
Task
5
Task
6
Task
7
Task
8
Task
9
Task
10
Task
11
Task
12
Task
13
Task
14
Task
15
Task
16
Task
17
Academic listening task
Freq
uenc
y
Missing
Never
Once or a few times a term
Once a week
Almost every class session
Figure 3. Frequency of various activities requiring student listening in the classroom.
0%
10%
20%
30%
40%
50%
60%
70%
80%
90%
100%
Task 1
Task 2
Task 3
Task 4
Task 5
Task 6
Task 7
Task 8
Task 9
Task 10
Task 11
Task 12
Task 13
Task 14
Task 15
Task 16
Task 17
Academic listening task
Impo
rtan
ce
MissingNot relevant
Somewhat importantImportantExtremely important
Figure 4. Importance of various activities requiring student listening in the classroom.
15
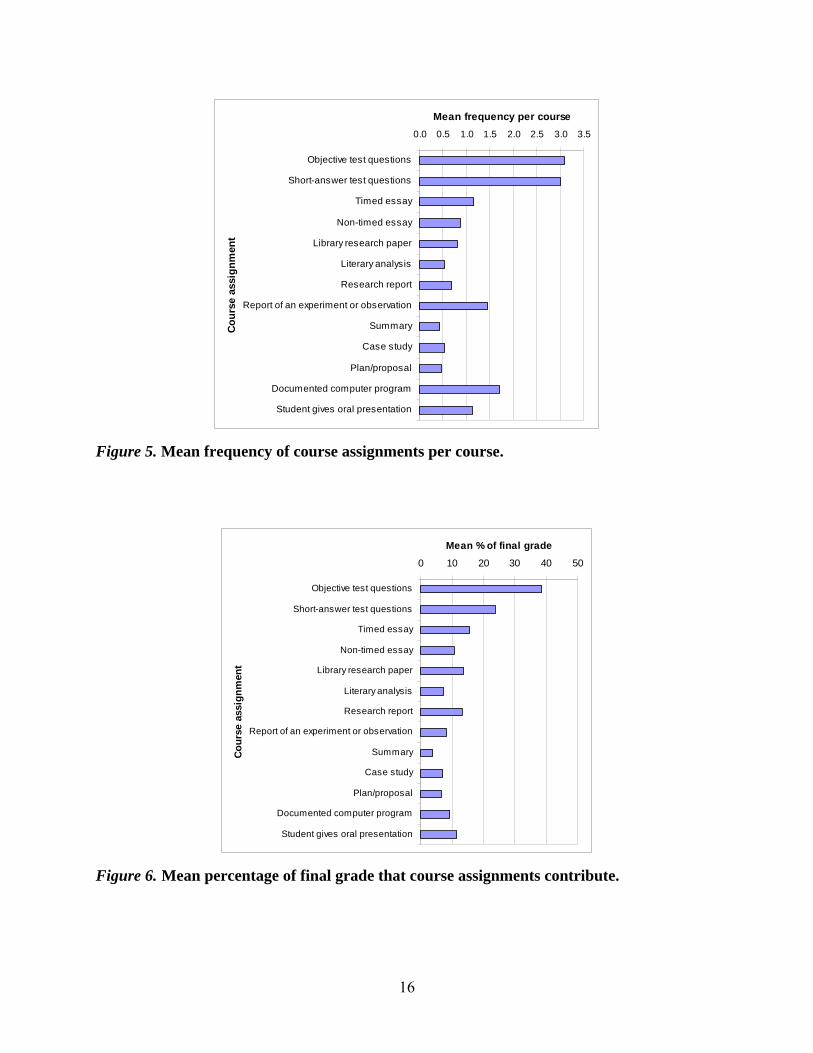
Course assignments. Figures 5 and 6 show the 13 class activities and course assignments
included in Sections 2 and 3 of the survey, with the mean frequency of each class activity or
assignment per term of the course and the contribution of each assignment to the final course
grade provided by the survey participants, respectively (see Appendix D for a summary of
descriptive statistics on which these figures were based). Figure 5 shows that the most frequent
course assignments in the undergraduate and graduate courses being reported were objective
(multiple-choice) test questions and short-answer test questions. Note that the mean percentage
of final grade across categories adds up to well over 100%. The mean frequency of these task
types was approximately three times per course. In contrast, all the other assignments, including
various writing assignments, were reported as occurring less frequently. Moreover, in terms of
the relative contribution of these types of course assignments presented in Figure 6, the mean
percentage of final grade reported was identified as the highest for objective test questions and
short-answer questions, while the contribution of other types of assignments to final course
grades was identified as lower than the top two.
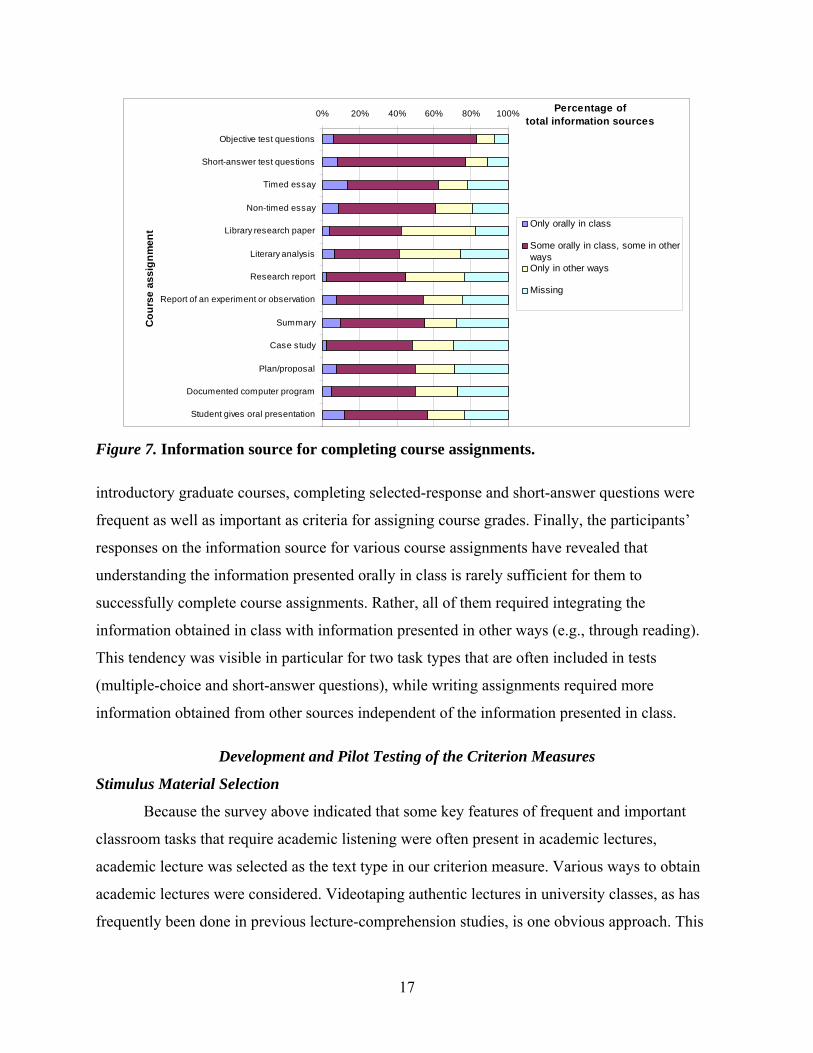
Figure 7 shows the frequency ratings provided regarding the information source required
for completing the course assignments (see Appendix E for the information source rating data on
which this figure is based). The participants indicated that they are commonly required to
combine information presented orally in class with information provided in other ways (e.g.,
through reading materials) to complete the assignments. The frequency of students endorsing this
category (Some orally in class, some in other ways) was the highest for objective and short-
answer test questions, while relatively more participants endorsed Only in other ways for
assignments involving writing.
Implications of the student survey results. Some important characteristics of tasks
requiring listening as well as course assignments that university students are engaged in as part
of lower-division undergraduate and introductory-level graduate classes emerged from the
present survey results. First, the results above confirmed the relative frequency and importance
of listening to instructors’ lectures, which involves presenting academic course content and
explaining assignments and due dates. Applying concepts that were explained orally in order to
complete tasks and taking notes were also identified as frequent and important tasks. Moreover,
the results on the frequency and importance of different assignments, as evidenced in the
percentages of final course grades, suggested that in the lower-division undergraduate and
16
0.0 0.5 1.0 1.5 2.0 2.5 3.0 3.5
Objective test questions
Short-answer test questions
Timed essay
Non-timed essay
Library research paper
Literary analysis
Research report
Report of an experiment or observation
Summary
Case study
Plan/proposal
Documented computer program
Student gives oral presentation
Cou
rse
assi
gnm
ent
Mean frequency per course
Figure 5. Mean frequency of course assignments per course.
0 10 20 30 40 50
Objective test questions
Short-answer test questions
Timed essay
Non-timed essay
Library research paper
Literary analysis
Research report
Report of an experiment or observation
Summary
Case study
Plan/proposal
Documented computer program
Student gives oral presentation
Cour
se a
ssig
nmen
t
Mean % of final grade
Figure 6. Mean percentage of final grade that course assignments contribute.
17
0% 20% 40% 60% 80% 100%
Objective test questions
Short-answer test questions
Timed essay
Non-timed essay
Library research paper
Literary analysis
Research report
Report of an experiment or observation
Summary
Case study
Plan/proposal
Documented computer program
Student gives oral presentation
Cou
rse
assi
gnm
ent
Percentage of total information sources
Only orally in class
Some orally in class, some in otherwaysOnly in other ways
Missing
Figure 7. Information source for completing course assignments.
introductory graduate courses, completing selected-response and short-answer questions were
frequent as well as important as criteria for assigning course grades. Finally, the participants’
responses on the information source for various course assignments have revealed that
understanding the information presented orally in class is rarely sufficient for them to
successfully complete course assignments. Rather, all of them required integrating the
information obtained in class with information presented in other ways (e.g., through reading).
This tendency was visible in particular for two task types that are often included in tests
(multiple-choice and short-answer questions), while writing assignments required more
information obtained from other sources independent of the information presented in class.
Development and Pilot Testing of the Criterion Measures
Stimulus Material Selection
Because the survey above indicated that some key features of frequent and important
classroom tasks that require academic listening were often present in academic lectures,
academic lecture was selected as the text type in our criterion measure. Various ways to obtain
academic lectures were considered. Videotaping authentic lectures in university classes, as has
frequently been done in previous lecture-comprehension studies, is one obvious approach. This
18
option was not pursued, however, primarily because of the possibility of the lecture content
being dependent on previous lectures and reading materials, quality of recording, and the
sparseness of the academic content covered. (See Douglas & Nissan, 2001, for a discussion of
sources of difficulty in adapting authentic lectures for assessment purposes.)
This decision necessitated that we turn to academic lectures available to the public
through commercial sources and university distance-education programs. After a review of the
available materials, video-based academic lectures produced by The Teaching Company
(http://www.teac23.com) were selected for use. These lectures had some ideal characteristics.
For example, each lecture was 30 minutes long, which was ideal when considering the need to
develop a criterion measure based on multiple, long-enough lectures that can be administered
within a reasonable amount of time. The lectures were available in a wide range of subject areas,
each with excellent recording quality.
The authors and a research assistant reviewed more than 60 lectures in five science and
nonscience lecture courses produced by The Teaching Company. Each lecture was rated on a set
of criteria, which were informed by some of the listening stimulus selection criteria in the
TOEFL Listening section test specifications. Lectures that met the following three key criteria,
according to all three raters, were selected for further consideration:
• Clarity of the speech of the lecturer: Presence of no noticeable accent; clear
articulation with the delivery speed within an acceptable range suggested in a
previous study for TOEFL 2000
• Nontechnical nature of the content: Appropriate for introductory undergraduate-level
courses (i.e., not requiring technical knowledge of the content; technical terms, if any,
are explained in simple terms)
• Self-contained content: The lecture content is not dependent on concepts introduced
in previous lectures
Three lectures, one each from the physics, history, and psychology lecture series, were
selected for use as the stimulus materials for the criterion measure. These lectures were varied in
terms of the gender of the speaker (male vs. female), type of information (declarative vs.
procedural), subject area (science vs. nonscience), rhetorical types (e.g., definition, description,
classification), type of visuals used (e.g., presentation of keywords at the bottom of the screen,
19
full-screen slides with text, full-screen photos), and the function of the content visuals employed
(e.g., replicate, illustrate, organize, supplement).
The speech rates of the selected lectures were defined by recording the number of words
in the first 4 minutes, and then in 1-minute intervals for the first 15 minutes. The resulting range
of the speech rate was 176–211 words per minute (wpm) with a mean of 191.9 wpm for the
physics lecture, 111–163 wpm with a mean of 141.5 for the history lecture, and 127–181 wpm
with the mean of 151.1 for the psychology lecture. In an unpublished TOEFL 2000 internal
document that defined acceptable speech rates for conversations and lectures and investigated the
effect of speech rate and sentence structure on task difficulty, fast speech was defined as 195
wpm or above. Thus, the delivery speeds for all lectures were within the acceptable range.
Although the speech rate for the physics lecture was on the faster side, the reviewers felt that the
physics concepts were well explained and the lecture was easy to follow.
One point to note about the three lectures, however, is that they were all monologic (i.e.,
there was no interaction between the lecturer and the students). This is worth noting because the
TOEFL iBT Listening section includes both monologic and interactive lectures, as discussed
later in this report. For a detailed comparison of the lecture stimuli employed in the criterion
measure along these task features, see Appendix F.
Another issue of consideration was whether the lectures should be presented via video or
audio. A decision was made to present the lectures via video, so that the student could see the
speakers’ body language and the content visuals presented as part of the lectures. The availability
of both audio and visual elements was particularly important for the present study because both
elements are essential parts of the language-use task in the TLU domain: listening to academic
lectures. Thus, the video presentation mode allowed us to better tap into the target construct,
which is somewhat broader than the listening ability that is assessed only via audio (Gruba,
1997; Wagner, 2007).
Item Writing
Four ETS subject-matter assessment-development specialists developed the tasks to
accompany the three video-based academic lectures included in the criterion measure. Two of
them were specialists in physics, and one each was a specialist in history and in psychology. All
of them had previous university-level teaching experience in the respective subject areas.
20
Prior to the initial instrument-development meeting, each content specialist reviewed the
stimulus lecture of his/her own subject area. During the planning session, the authors and the
content specialists discussed the purpose of the instrument development, the key findings from
the university student survey, and the content covered in the video lectures. First, they confirmed
the appropriateness of the topic and difficulty of the content for lower-division undergraduate
courses of the corresponding disciplines, and presence of sufficient key points worth testing.
Then, the approach to the development of the listening exercises was explained. Each
assessment-development specialist was instructed to imagine that he or she were the professor
giving the relevant lecture as part of his or her own lower-division undergraduate-level course.
Then, the specialists were asked to draft questions that they might actually develop for use in in-
class quizzes or exams to evaluate understanding of the information presented in the lectures,
along with the scoring criteria. Given the relative frequency and importance of assignments
based on multiple-choice and short-answer questions identified in the survey study described
above, the specialists were instructed to adopt these task types to the extent to which they were
appropriate for testing the particular content in the three lectures.
One observation made in this initial meeting had to do with the potential dependency of
the content of the physics lecture, which was the sixth in the particular physics academic lecture
series, on previous lectures. Although the content was fairly self-contained, this lecture required
knowledge about a substance presented in previous lectures, the ether (a substance that 19th-
century physicists hypothesized to fill space as the medium for transmission of light and other
electromagnetic waves). For this reason, a decision was made to present a brief reading passage
to introduce this concept before playing the video. No background reading texts were used for
the history and psychology lectures.
The instrument development proceeded in an iterative manner, where the assessment-
development content specialists drafted questions and scoring criteria, which were discussed
with the authors. This process of draft revision and group discussion was repeated a few times
for each subject area. After the exercises were developed, six ETS assessment specialists and
researchers specializing in English-language assessment (ELA) reviewed the listening tasks to
ensure that the items developed by the content specialists were appropriate for testing nonnative
speakers of English. Suggestions given by the ELA specialists were shared with the developers
of the items, who then made further revisions. Considering the number of items included and the
21
estimated time required to answer each, the time limit for completing the exercise was set at 50
minutes (30 minutes for listening to the video lecture, and 20 minutes for answering questions)
for physics, and 60 minutes for history and psychology each (30 minutes for listening to the
video lecture, and 30 minutes for answering questions).
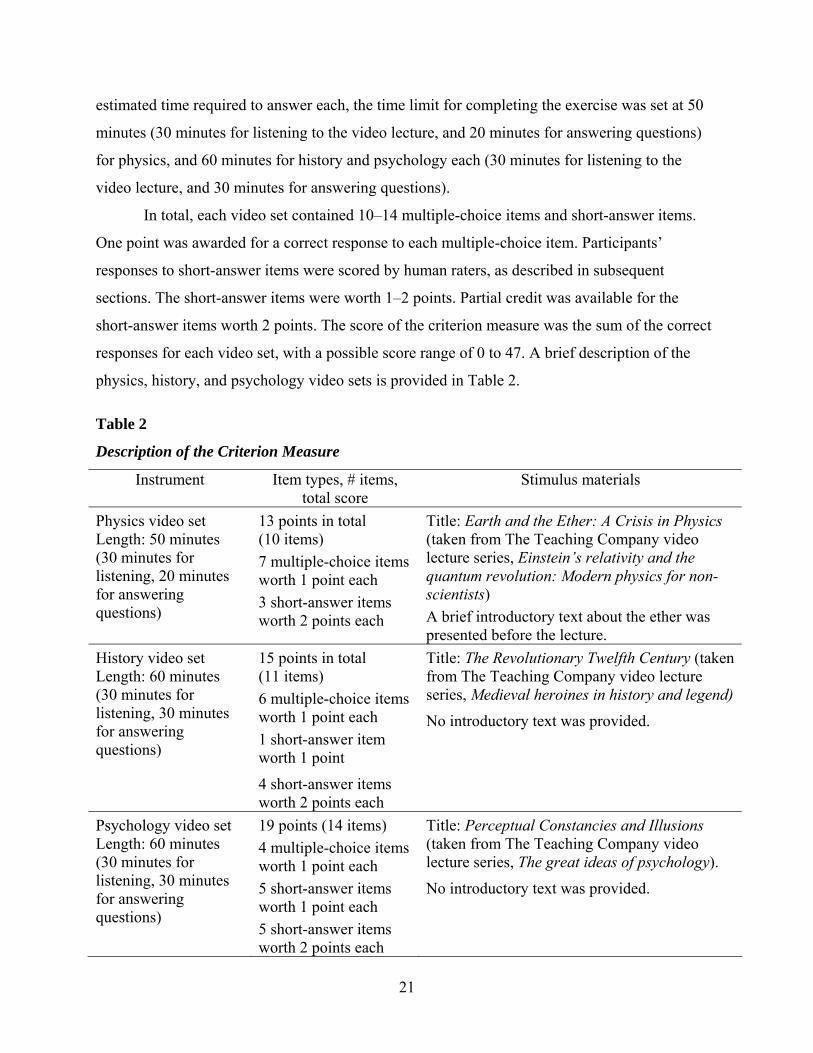
In total, each video set contained 10–14 multiple-choice items and short-answer items.
One point was awarded for a correct response to each multiple-choice item. Participants’
responses to short-answer items were scored by human raters, as described in subsequent
sections. The short-answer items were worth 1–2 points. Partial credit was available for the
short-answer items worth 2 points. The score of the criterion measure was the sum of the correct
responses for each video set, with a possible score range of 0 to 47. A brief description of the
physics, history, and psychology video sets is provided in Table 2.
Table 2
Description of the Criterion Measure
Instrument Item types, # items, total score
Stimulus materials
Physics video set Length: 50 minutes (30 minutes for listening, 20 minutes for answering questions)
13 points in total (10 items) 7 multiple-choice items worth 1 point each 3 short-answer items worth 2 points each
Title: Earth and the Ether: A Crisis in Physics (taken from The Teaching Company video lecture series, Einstein’s relativity and the quantum revolution: Modern physics for non-scientists) A brief introductory text about the ether was presented before the lecture.
History video set Length: 60 minutes (30 minutes for listening, 30 minutes for answering questions)
15 points in total (11 items) 6 multiple-choice items worth 1 point each 1 short-answer item worth 1 point
4 short-answer items worth 2 points each
Title: The Revolutionary Twelfth Century (taken from The Teaching Company video lecture series, Medieval heroines in history and legend)
No introductory text was provided.
Psychology video set Length: 60 minutes (30 minutes for listening, 30 minutes for answering questions)
19 points (14 items) 4 multiple-choice items worth 1 point each 5 short-answer items worth 1 point each 5 short-answer items worth 2 points each
Title: Perceptual Constancies and Illusions (taken from The Teaching Company video lecture series, The great ideas of psychology).
No introductory text was provided.
22
Validation of the Selected Listening Stimuli
Because the commercially available lecture stimuli employed for the criterion measure
were not specifically designed for use in undergraduate or graduate programs in academic
settings, the extent to which these lectures are representative of authentic lectures given in
contexts of university academic courses was investigated further by taking a linguistic-analysis
approach. Although linguistic features of video lectures were not among the primary criteria for
the stimuli selection, this analysis was conducted in a post hoc manner in order to provide
descriptive information about the stimuli that would aid interpretation of study results.
In this analysis, the linguistic characteristics of the three lectures were compared against
those of spoken classroom-session texts in Biber et al.’s (2004) T2K-SWAL Corpus, a corpus of
university spoken and written texts developed as part of TOEFL iBT development. The
diagnostic analysis procedure, LXMDCompare analysis, developed by Biber et al. (2004), was
employed. In this analysis, linguistic features of a target text are compared against a range of
reference texts in the corpus that a user specifies (the 2.7-million-word corpus contains
1,665,500 spoken words and 1,071,700 written words). This analysis is based on the assumption
that texts in different registers are characterized by co-occurrence of particular linguistic features.
Each target text and all reference texts in the corpus specified by a user are analyzed in terms of
five linguistic dimensions identified in Biber’s (1988) factor analysis of spoken and written texts
in two corpora of contemporary British English: Lancaster-Oslo-Bergen Corpus and the London-
Lund Corpus. Each text analyzed receives scores on five dimensions. Following is a description
of each dimension based on results of Biber et al. (2002), who analyzed the university spoken
and written texts in the T2K-SWAL Corpus by using Biber’s factor analysis (1988) procedure.6
1. Involved versus information production. A positive score on this dimension indicates
a highly involved nature of the text, while a text with a negative score is “extremely
informational in purpose and produced under highly controlled and edited
circumstances (Biber et al., 2004, p. 67).” In the Biber et al. (2002) analysis, all
spoken text categories had large positive scores, while all written text categories had
large negative scores.
2. Narrative versus nonnarrative discourse. A positive score on this dimension indicates
presence of narrative features (e.g., frequent use of past tense verbs and third-person
23
pronouns). The Biber et al. (2002) analysis showed that all university spoken and
written texts were characterized by absence of these features.
3. Situation-dependent versus elaborated reference. A positive score indicates the
situation-dependent nature of the text by frequent use of time and place adverbials,
while a negative score indicates presence of elaborate reference in the text by
frequent use of constructions such as WH relative clauses, phrasal coordination, and
nominalization. In Biber et al. (2002), university spoken texts were associated with
positive scores, while written texts were associated with negative scores.
4. Overt expression of persuasion. A positive score indicates frequent use of several
types of modals and suasive verbs, indicating an overtly persuasive style. Biber et al.
(2002) found that all university spoken texts tended to have higher scores on this
dimension than written texts. In particular, classroom management and office hour
texts had particularly high scores, suggesting the “behavior modification” (Biber et al.,
2002) nature of these types of texts.
5. Nonimpersonal versus impersonal style. A positive score on this dimension indicates
the nonimpersonal nature of the text, often characterized by the absence of passive
constructions, while a negative score on this dimension indicates the relatively
frequent use of these features. Biber et al. (2002) found that university spoken and
written texts were distinct from each other on this dimension, where spoken texts
were associated with positive scores and written texts with negative scores.
The information provided in the program output includes dimension scores for the target
text as well as means and standard deviations of the dimension scores for all the reference texts.
Then, for each dimension, the program indicates whether the dimension score for the target text
falls within the 95% confidence interval of the mean dimension score for the reference texts in the
T2K-SWAL Corpus. This helps the user determine whether the target text’s linguistic features, as
defined by the five dimensions, are typical or atypical compared to the specific reference texts.
The procedure of the LXMDCompare analysis conducted in this study is as follows.7 The
target texts were the three video lectures used as the stimuli for the criterion measure. Written
transcripts of the three stimulus video lectures served as the source texts for the analysis. The
Teaching Company provided a written transcript for the physics lecture only. Paid professional
transcribers developed word-level transcripts of the history and psychology lectures, and a
24
research assistant at ETS verified the content for accuracy. The total number of words included
in the lectures were 6,248 for physics, 4,210 for history, and 4,577 for psychology. These
transcripts were then tagged for the linguistic features analyzed in the LXMDCompare analyses.
Two LXMDCompare analyses were run for each of the three lectures. Analysis 1
compared each lecture to the entire corpus of spoken classroom texts. However, Analysis 2
compared each lecture only to the undergraduate spoken classroom texts in the corpus because
the focus of the criterion measure was on lower-level undergraduate courses. Because of the
small number of texts in the corpus, texts with all degrees of interactivity (low, medium, and
high) were included in these analyses.
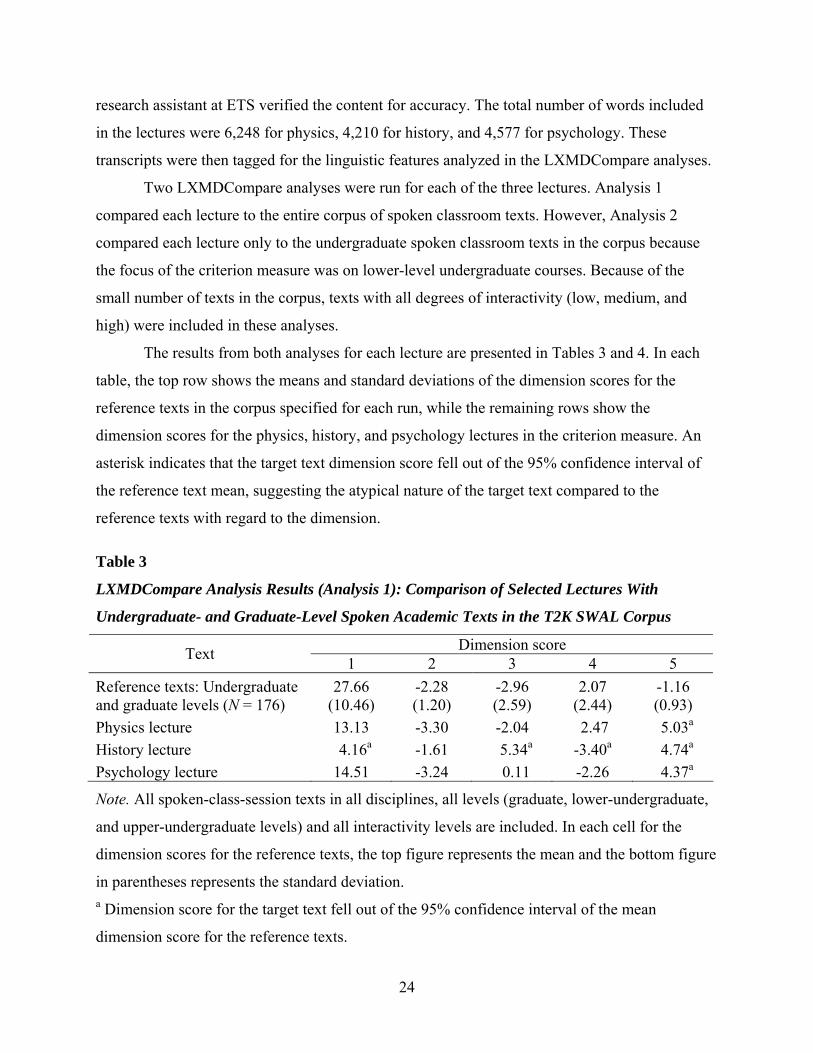
The results from both analyses for each lecture are presented in Tables 3 and 4. In each
table, the top row shows the means and standard deviations of the dimension scores for the
reference texts in the corpus specified for each run, while the remaining rows show the
dimension scores for the physics, history, and psychology lectures in the criterion measure. An
asterisk indicates that the target text dimension score fell out of the 95% confidence interval of
the reference text mean, suggesting the atypical nature of the target text compared to the
reference texts with regard to the dimension.
Table 3
LXMDCompare Analysis Results (Analysis 1): Comparison of Selected Lectures With
Undergraduate- and Graduate-Level Spoken Academic Texts in the T2K SWAL Corpus
Dimension score Text 1 2 3 4 5 Reference texts: Undergraduate and graduate levels (N = 176)
27.66 (10.46)
-2.28 (1.20)
-2.96 (2.59)
2.07 (2.44)
-1.16 (0.93)
Physics lecture 13.13 -3.30 -2.04 2.47 5.03a History lecture 4.16a -1.61 5.34a -3.40a 4.74a Psychology lecture 14.51 -3.24 0.11 -2.26 4.37a
Note. All spoken-class-session texts in all disciplines, all levels (graduate, lower-undergraduate,
and upper-undergraduate levels) and all interactivity levels are included. In each cell for the
dimension scores for the reference texts, the top figure represents the mean and the bottom figure
in parentheses represents the standard deviation. a Dimension score for the target text fell out of the 95% confidence interval of the mean
dimension score for the reference texts.

25
Table 4 LXMDCompare Analysis Results (Analysis 2): Comparison of Selected Lectures With
Undergraduate-Level Spoken Academic Texts in the T2K SWAL Corpus
Dimension score Text 1 2 3 4 5 Reference texts: Undergraduate levels (N = 126)
27.40 (10.98)
-2.24 (1.20)
-3.08 (2.72)
1.96 (2.35)
-1.12 (0.94)
Physics lecture 13.13 -3.30 -2.04 2.47 5.03a History lecture 4.16a -1.61 5.34a -3.40a 4.74a Psychology lecture 14.51 -3.24 0.11 -2.26 4.37a
Note. All spoken-class-session texts in all disciplines, undergraduate levels (lower-undergraduate
and upper-undergraduate levels), and all interactivity levels are included. In each cell for the
dimension scores for the reference texts, the top figure represents the mean and the bottom figure
in parentheses represents the standard deviation. a Dimension score for the target text fell out of the 95% confidence interval of the mean
dimension score for the reference texts.
In both analyses, the results for the physics and psychology texts were similar. In all runs,
these texts fell within the 95% confidence intervals of the mean dimension score for all
dimensions except Dimension 5, nonimpersonal vs. impersonal style. This suggests that these
two texts were similar to the reference classroom-session spoken texts at undergraduate and
graduate levels in all disciplines in the corpus in terms of their highly involved/interactive and
less scripted nature (Dimension 1); absence of narrative features (Dimension 2); relatively
infrequent occurrence of situation-dependent language such as time and place adverbials
(Dimension 3); and use of overt expressions of persuasion (Dimension 4). However, both texts
were identified as atypically nonimpersonal in nature (Dimension 5).
The history lecture was identified as atypical on all five dimensions except Dimension 2
in both analyses. Relatively speaking, this text was characterized by the information-production
orientation (Dimension 1), the frequent use of time/place adverbials for direct reference to
time/place of events (Dimension 3), lack of overt expression of persuasion (Dimension 4), and
absence of passive construction (Dimension 5). In contrast, this text was similar to the reference
texts in the corpus in terms of the absence of narrative features (Dimension 2). The information-
production orientation of this text (Dimension 1) may be attributed to the highly scripted nature
26
of the lecturer’s delivery. The topic of the lecture, the events that took place in 12th-century
France as an introduction to the lives of women of significance, may also have played a role for
the frequent use of time/place adverbials (Dimension 3). For instance, the time adverb now,
which appeared quite frequently in this lecture, was used in two ways: (a) to refer to the modern
time for comparison with the 12th century, and (b) to refer to the 12th century for comparison
with prior to the 12th century. Moreover, because the focus was on the description of past events
related to these women and changes in women’s lives in 12th-century Europe, this seems to
explain the lack of overt expression of persuasion captured by Dimension 4 as well.
To sum up, there were considerable differences between the chosen history text and
university spoken texts of various types included in the T2K-SWAL Corpus. This seems to be at
least partially attributable to the highly scripted nature of the lecturer’s delivery style as well as
the particular topic of the history lecture. The authors believe that using this lecture is still
reasonable, however, because the content expert judged that this type of lecture is quite common
in undergraduate history classes. It may also be the case that the lecturer’s individual style of
presenting information has more impact on the dimension values than the topic or discipline that
he or she is lecturing on. Moreover, in general, the number of spoken academic texts included in
T2K-SWAL Corpus is fairly modest, where the number of texts representing various
subdisciplines reported by Biber et al. (2004) ranged from 1 to 17 (mean = 7.5, standard
deviation = 5.1). Thus, the corpus itself may be too small to sufficiently represent various
linguistic characteristics of specific disciplines.
Pilot and Main Studies
Two studies were conducted consecutively in 2005: a pilot study, followed by the main
study. In both studies, the criterion measure and the TOEFL iBT Listening section were
administered to nonnative speakers of English who were enrolled in undergraduate and graduate
programs. The data from the two study were combined for analysis.
Pilot Study
The criterion measure was pilot tested with other study instruments from January through
March 2005. The primary purposes of this pilot test were to investigate the usability and
psychometric characteristics of the criterion measure and to refine the scoring guidelines.
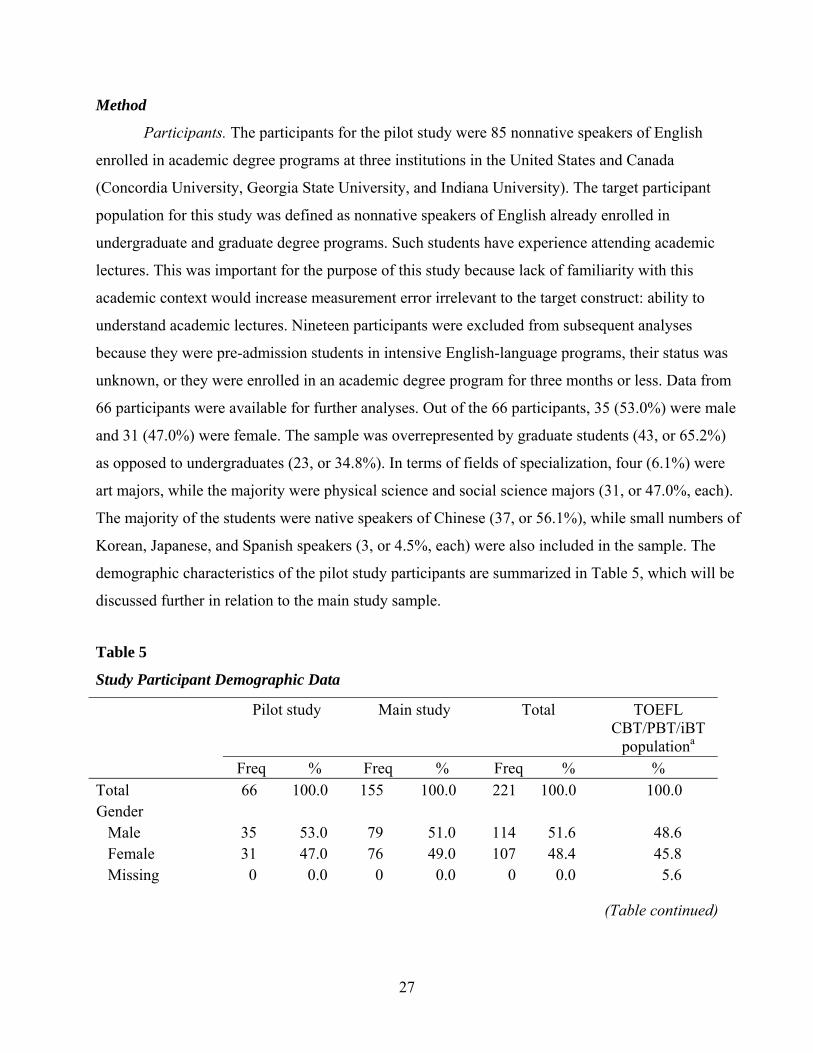
27
Method
Participants. The participants for the pilot study were 85 nonnative speakers of English
enrolled in academic degree programs at three institutions in the United States and Canada
(Concordia University, Georgia State University, and Indiana University). The target participant
population for this study was defined as nonnative speakers of English already enrolled in
undergraduate and graduate degree programs. Such students have experience attending academic
lectures. This was important for the purpose of this study because lack of familiarity with this
academic context would increase measurement error irrelevant to the target construct: ability to
understand academic lectures. Nineteen participants were excluded from subsequent analyses
because they were pre-admission students in intensive English-language programs, their status was
unknown, or they were enrolled in an academic degree program for three months or less. Data from
66 participants were available for further analyses. Out of the 66 participants, 35 (53.0%) were male
and 31 (47.0%) were female. The sample was overrepresented by graduate students (43, or 65.2%)
as opposed to undergraduates (23, or 34.8%). In terms of fields of specialization, four (6.1%) were
art majors, while the majority were physical science and social science majors (31, or 47.0%, each).
The majority of the students were native speakers of Chinese (37, or 56.1%), while small numbers of
Korean, Japanese, and Spanish speakers (3, or 4.5%, each) were also included in the sample. The
demographic characteristics of the pilot study participants are summarized in Table 5, which will be
discussed further in relation to the main study sample.
Table 5
Study Participant Demographic Data
Pilot study Main study Total TOEFL CBT/PBT/iBT
populationa Freq % Freq % Freq % % Total 66 100.0 155 100.0 221 100.0 100.0 Gender
Male 35 53.0 79 51.0 114 51.6 48.6 Female 31 47.0 76 49.0 107 48.4 45.8 Missing 0 0.0 0 0.0 0 0.0 5.6
(Table continued)

28
Table 5 (continued)
Pilot study Main study Total TOEFL CBT/PBT/iBT
populationa Freq % Freq % Freq % %
Academic status Undergraduate 23 34.8 62 40.0 85 38.5 24.1 Graduate 43 65.2 93 60.0 136 61.5 43.2
Field of study Arts 4 6.1 18 11.6 22 10.0 - Life science 0 0.0 18 11.6 18 8.1 - Physical science 31 47.0 59 38.1 90 40.7 - Social science 31 47.0 52 33.5 83 37.6 - Missing 0 0.0 8 5.2 8 3.6 -
Native language Chinese 37 56.1 56 36.1 93 42.1 18.7 Korean 3 4.5 14 9.0 17 7.7 17.0 Japanese 3 4.5 11 7.1 14 6.3 10.3 Spanish 3 4.5 6 3.9 9 4.1 5.3 Thai 1 1.5 7 4.5 8 3.6 3.0 Vietnamese 0 0.0 6 3.9 6 2.7 0.8 Arabic 1 1.5 2 1.3 3 1.4 4.6 French 0 0.0 3 1.9 3 1.4 2.2 Other 15 22.7 46 29.7 61 27.6 30.0 Missing 3 4.5 4 2.6 7 3.2 8.1
aBased on 968,245 examinees who took TOEFL CBT and PBT between July 2005 and June
2006, and those who took TOEFL iBT between September 2005 and December 2006 (ETS,
2007a, 2007b).
Instruments. The pilot study instruments included the criterion measure consisting of the
three video-based sets in physics, history, and psychology; a TOEFL iBT Listening section; and
a post-test questionnaire. Each of the video sets in the criterion measure included a video with
the lecture stimulus, a booklet containing general directions, test questions, and a short survey on
the lecture content. The TOEFL iBT Listening section administered was from TOEFL Practice
Online (TPO), a TOEFL test-preparation package available from ETS. The TOEFL iBT test
form will be described more fully in the description of the instruments for the main study. The
29
post-test questionnaire, administered on paper, included questions about participant
demographics and usability of the criterion measure format and content.
Procedure. Due to logistical challenges, the procedure and the instruments completed by
the pilot study participants varied across the three sites. The participants at Georgia State
University and Indiana University completed all the study instruments. The Georgia State
University participants completed all study instruments in a 4.5-hour session (with a 5-minute
break between the second and third video sets and a 10-minute break between the third video set
and the TOEFL iBT Listening section), while the Indiana University participants completed the
video sets in a 3-hour session on Day 1 (with a 5-minute break between the second and third
video sets) and came back to complete the TOEFL iBT Listening section in a 1-hour session on
Day 2, which was held within a week of Day 1. The participants at Concordia University
completed only the criterion measure and the post-test questionnaire in a 3-hour session, with a
5-minute break between the second and third video sets. At each site the participants were
randomly assigned to two groups; the order of the three video sets was randomly determined for
each group.
At the beginning of each video set, the participants received the test booklets. After they
reviewed the general directions on the cover page of the booklet, they watched the video lecture
on television. They were allowed, but not required, to take notes on scratch paper attached to the
test booklet while listening. They then completed the test questions contained in the booklet and
provided information regarding their level of familiarity with the content covered in the lecture
(see Appendix J for a sample of content-familiarity questions included at the end of each
booklet). Upon completion of the video sets, the Concordia University participants filled out the
post-test questionnaire to complete the session. The Georgia State University and Indiana
University participants continued with the TOEFL iBT Listening section at computer labs. The
participants logged onto the TPO Web site to complete the TOEFL iBT Listening section
individually, following the standard timed-testing procedure. Upon completion of the TOEFL
iBT Listening section, they filled out the post-test questionnaire. Each participant received a gift
certificate worth $50 after completing all study materials.
Scoring pilot participant responses to the criterion measure. The selected-response items
in the criterion measure were scored by using the answer keys devised by the content specialists
who developed the items. Student responses to the short-answer items in the measure were each
30
scored by two raters. The raters were seven ETS staff. For the physics set, the two content
specialists themselves scored pilot student responses. Participant responses to each of the history
and psychology sets were scored by three applied linguists. One rater scored all the history and
psychology responses, while the other two served as the second rater of each set.
At the outset, the scoring team for each video set met and discussed the scoring criteria. For
physics, the two content specialists were the only attendees in the meeting. For history and
psychology, the content specialists attended the meetings for the respective subject areas to train
the applied linguists who served as the raters. During each meeting, five sample responses were
scored individually first, followed by a group discussion of the scoring results. Questions and
issues related to the scoring criteria were resolved, and necessary changes were made to the
scoring guidelines. Then, each rater scored randomly assigned batches of student responses
individually.
Among the 66 pilot study participants, scores for both the TOEFL iBT Listening section
and the criterion measure were available for 37 participants. As for the remaining 29, TOEFL
Listening scores were not available for 24 Concordia University participants (the TOEFL
Listening section was not administered at this site) and for another participant who experienced a
database error for the TOEFL portion. Of the remaining four, data for either one or both measures
were unavailable because the participant did not complete some portions of the study materials.
Results
The ratings for the short-answer items given by the first rater were combined with the
scored item responses for the multiple-choice items for analyses of score distribution, scale
reliability (Cronbach’s α), item difficulty (p-value), and item discrimination (item-total
correlation). Based on the results of this analysis, content of three selected-response items in the
physics sets with low item discrimination were revised, and minor wording and format changes
were made to two history and six psychology items in order to improve clarity of the item
content and the information to be elicited. The Cronbach’s alpha estimates for the entire criterion
measure and the TOEFL iBT Listening section were .85 and .81, respectively.
As part of the rater-training session for the main study to be described, minor
modifications were made to the scoring rules for the short-answer items in the criterion measure.
The rates of exact agreement between the raters after re-scoring based on the new scoring rules
31
ranged from 86.4% to 95.8%, and those for exact plus adjacent ratings ranged from 98.9% to
100.0% across different pairs of raters.
Main Study
The main study was conducted between April and November 2005. During this phase,
additional data were collected by administering study instruments that had been revised based on
the results of the pilot study.
Method
Participants. Participants for the main study were recruited from the same participant
population as defined in the pilot study. Participants were adult nonnative speakers of English
enrolled in undergraduate and graduate programs in five universities and colleges in the United
States and Canada (California State University at Fullerton, California State University at Los
Angeles, Purdue University, University of Toronto, and Wesleyan University). A total of 169
students were recruited from these institutions.
Based on the participants’ responses to the language-background questionnaire, 14
participants were excluded from subsequent analyses because they were pre-admission students
in intensive English-language programs, their status was unknown, or they had been enrolled in
an academic degree program for three months or less. As a result, data from 155 main-study
participants were available for further analyses.
In the subsequent analyses, the data from the pilot study and the main study were
combined, as described in the following section, resulting in a total sample size of 221. The
demographic characteristics of the students included in the subsequent analyses are summarized
in terms of gender, academic status, field of study, and native language background in Table 5.
The right-most column of the table also includes the comparable demographic data for the
combined population for the TOEFL computer-based test (CBT) and paper-based test (PBT)
between July 2004 and June 2005, and the TOEFL iBT between September 2005 and December
2006, for purposes of comparison. As can be seen in the table, both the pilot and main study
samples included slightly more males than females and were overrepresented by graduate
students over undergraduate students. As for the major fields of study, the majority of the
participants in this study were either physical science or social science majors (94.0% in the pilot
study sample and 71.6% in the main study sample), while only a small portion of the participants
32
were arts or life science majors. In terms of the native-language background, the largest language
groups represented in the present study were Chinese, Korean, and Japanese. The relative
representation of these native-language groups in the present sample was consistent with that of
these groups in the combined operational TOEFL CBT, PBT, and iBT population.
Instruments. The main study employed three instruments: (a) a participant questionnaire;
(b) the criterion measure consisting of the video-based listening sets in physics, history, and
psychology; and (c) the TOEFL iBT Listening section.
Participant questionnaire. A revised version of the survey administered as part of the
preliminary survey study discussed earlier (Appendix A) was employed.8
Video-based listening sets. A revised version of the three video sets on physics, history,
and psychology in the pilot study were employed. The final versions of the physics, history, and
psychology sets are presented in Appendixes G, H, and I, respectively. The content-familiarity
questions administered in the pilot study (Appendix J) were included at the end of each booklet
as well.
TOEFL iBT Listening section. The same test form as the one used in the pilot study, taken
from TOEFL Practice Online (TPO), was employed. There were 34 listening-comprehension items
on the test form, grouped in six sets. Each of two sets was based on a three-minute conversation on
a campus situation, followed by 5 listening-comprehension items. Each of the other four sets was
based on a five-minute academic lecture, followed by 6 items. All the listening-comprehension
items were scored dichotomously. Four items were multiple-choice items requiring two or more
responses to receive 1 point, while the other 30 items were in standard four-option multiple-choice
formats requiring one response to receive credit. In total there were 34 score points available. Each
examinee’s raw score was converted to a scaled score of 0–30.
The TOEFL iBT test form used in the study was representative of the content and format
of an operational TOEFL iBT Listening section, though there are some differences. In the
operational TOEFL iBT, examinees may receive additional Listening sets. In the test form
employed in the present study, the six Listening sets were administered consecutively, first the
two conversation sets, then the four lecture sets. In contrast, the sets in the operational TOEFL
iBT Listening section are administered in two separately timed subparts; the sets are presented in
the order of Conversation-Lecture-Lecture in each subpart.
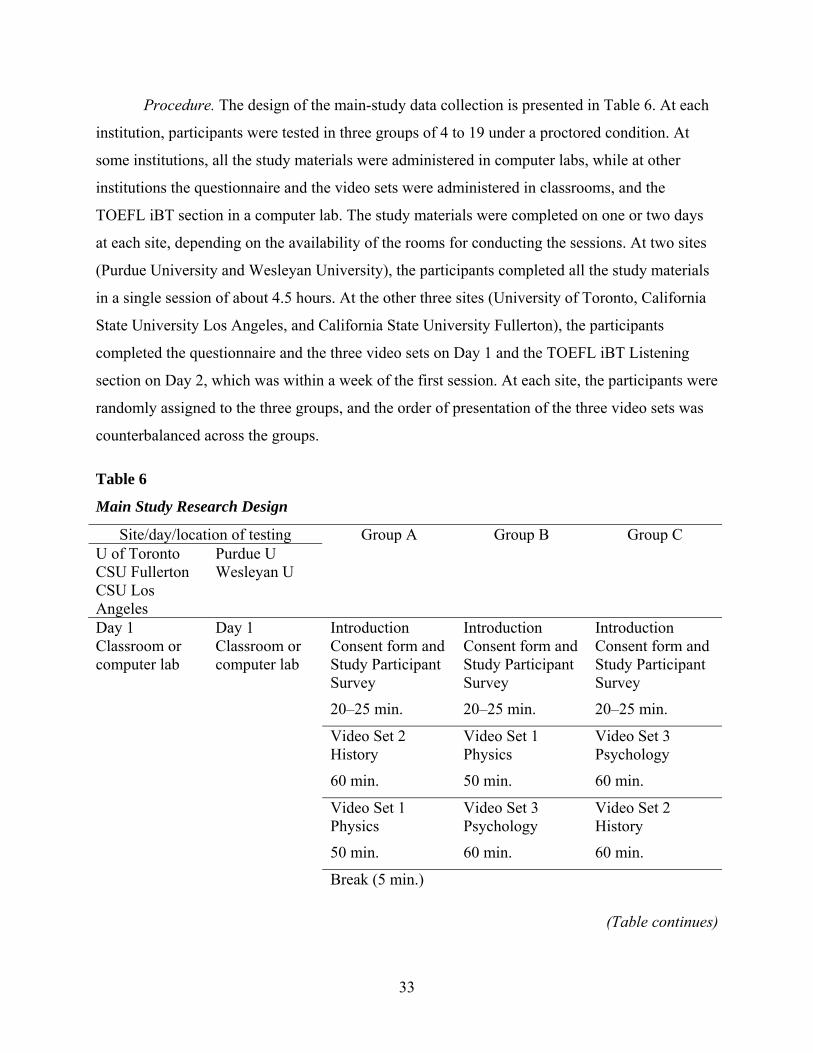
33
Procedure. The design of the main-study data collection is presented in Table 6. At each
institution, participants were tested in three groups of 4 to 19 under a proctored condition. At
some institutions, all the study materials were administered in computer labs, while at other
institutions the questionnaire and the video sets were administered in classrooms, and the
TOEFL iBT section in a computer lab. The study materials were completed on one or two days
at each site, depending on the availability of the rooms for conducting the sessions. At two sites
(Purdue University and Wesleyan University), the participants completed all the study materials
in a single session of about 4.5 hours. At the other three sites (University of Toronto, California
State University Los Angeles, and California State University Fullerton), the participants
completed the questionnaire and the three video sets on Day 1 and the TOEFL iBT Listening
section on Day 2, which was within a week of the first session. At each site, the participants were
randomly assigned to the three groups, and the order of presentation of the three video sets was
counterbalanced across the groups.
Table 6 Main Study Research Design
Site/day/location of testing U of Toronto CSU Fullerton CSU Los Angeles
Purdue U Wesleyan U
Group A Group B Group C
Day 1 Classroom or computer lab
Day 1 Classroom or computer lab
Introduction Consent form and Study Participant Survey
20–25 min.
Introduction Consent form and Study Participant Survey
20–25 min.
Introduction Consent form and Study Participant Survey
20–25 min.
Video Set 2 History
60 min.
Video Set 1 Physics
50 min.
Video Set 3 Psychology
60 min.
Video Set 1 Physics
50 min.
Video Set 3 Psychology
60 min.
Video Set 2 History
60 min.
Break (5 min.)
(Table continues)
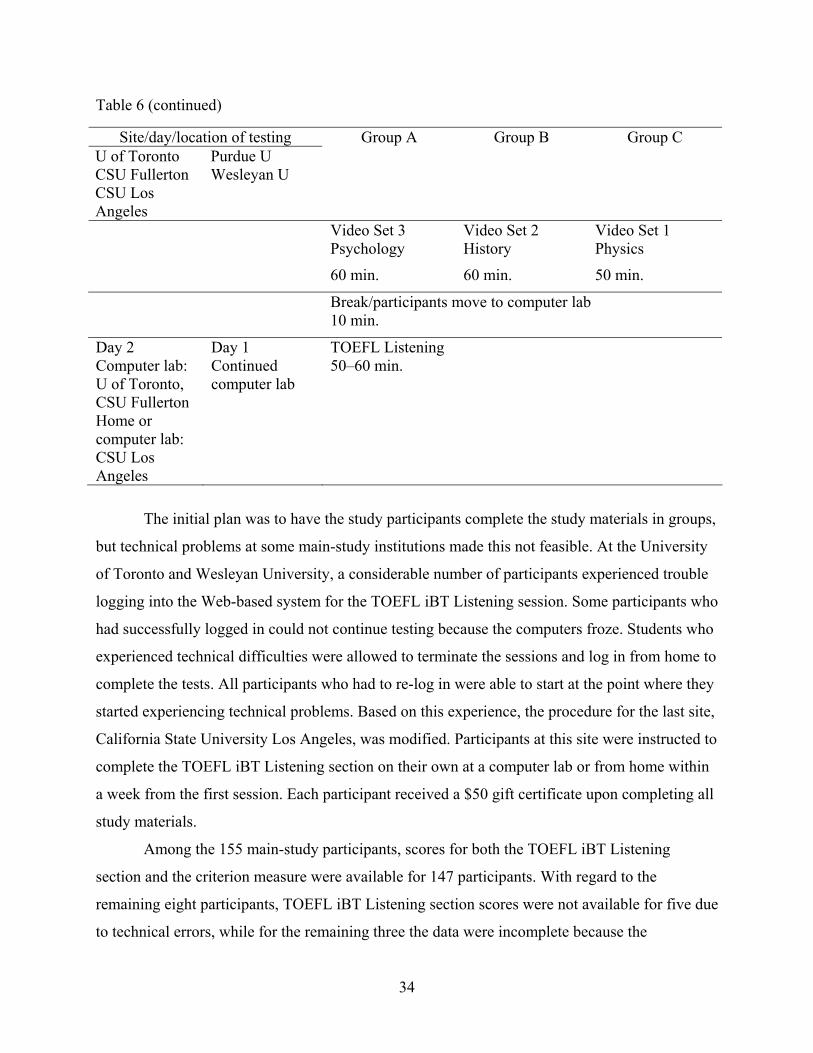
34
Table 6 (continued)
Site/day/location of testing U of Toronto CSU Fullerton CSU Los Angeles
Purdue U Wesleyan U
Group A Group B Group C
Video Set 3 Psychology
60 min.
Video Set 2 History
60 min.
Video Set 1 Physics
50 min.
Break/participants move to computer lab 10 min.
Day 2 Computer lab: U of Toronto, CSU Fullerton Home or computer lab: CSU Los Angeles
Day 1 Continued computer lab
TOEFL Listening 50–60 min.
The initial plan was to have the study participants complete the study materials in groups,
but technical problems at some main-study institutions made this not feasible. At the University
of Toronto and Wesleyan University, a considerable number of participants experienced trouble
logging into the Web-based system for the TOEFL iBT Listening session. Some participants who
had successfully logged in could not continue testing because the computers froze. Students who
experienced technical difficulties were allowed to terminate the sessions and log in from home to
complete the tests. All participants who had to re-log in were able to start at the point where they
started experiencing technical problems. Based on this experience, the procedure for the last site,
California State University Los Angeles, was modified. Participants at this site were instructed to
complete the TOEFL iBT Listening section on their own at a computer lab or from home within
a week from the first session. Each participant received a $50 gift certificate upon completing all
study materials.
Among the 155 main-study participants, scores for both the TOEFL iBT Listening
section and the criterion measure were available for 147 participants. With regard to the
remaining eight participants, TOEFL iBT Listening section scores were not available for five due
to technical errors, while for the remaining three the data were incomplete because the
35
participants had not finished one or more video sets and/or the TOEFL Listening section. In the
analyses to be presented in the subsequent sections, the data from the pilot and main study were
combined. The data from the two studies were aggregated in this way for two reasons. First, the
participants were recruited from the same population with the same recruitment criteria.
Moreover, the revisions made to the study instruments after the pilot test were minimal. Thus the
data collected in the two studies were comparable if the three physics items revised after piloting
were excluded from further analyses. 9 In total, the TOEFL iBT scores were available for 185
participants (38 from the pilot study and 147 from the main study), and the criterion measure
scores for 216 participants (62 from the pilot study and 154 from the main study).
Scoring. Scoring the participants’ responses to the short-answer questions in the criterion
measure followed the same procedure as in the pilot test. This time approximately 20% of the
student responses to the short-answer items were double-scored for calculation of agreement
between all possible pairs of raters involved in ratings of a video set for each subject. The rater
agreement was excellent, where exact agreement between the rater pairs ranged from 78.9% to
90.7%, and exact plus adjacent agreement from 98.9% to 100.0%. In nine instances the ratings
provided by two raters differed by 2 score points. These cases were resolved by discussions
between the relevant raters.
The data for the selected-response and short-answer items were combined to obtain the
total score for the criterion measure and the TOEFL iBT Listening section. The reliability
estimate (Cronbach’s alpha) was .75 for the TOEFL iBT Listening section (based on the data
from 185 pilot and main-study participants), and .83 for the criterion measure (based on the data
from 216 pilot and main-study participants).
Analysis. As part of preliminary analyses, descriptive statistics were obtained for the
TOEFL iBT Listening section and the criterion measure for the total group and the subgroups for
gender, academic status, and field of study. Where appropriate, analyses of variance (ANOVA)
were conducted to explore the mean differences across some subgroups.
Then, two types of analyses were conducted in order to shed light on the relationship
between performance on the video sets and the TOEFL iBT Listening section for the total group
and the groups. Among the 185 participants for whom the TOEFL iBT Listening section scores
were available, one did not complete the criterion measure. Thus, these analyses are based on the
data from 184 students for whom both the video set and TOEFL iBT Listening section scores
36
were available. First, bivariate scatter plots for the video sets and the TOEFL iBT Listening
section scores and Pearson product-moment correlations between these measures were obtained
for the total group and for the different subgroups. The sample sizes for two fields of study (20
for arts majors and 17 for life science majors) were too small for calculating correlations
separately. Thus, this analysis was conducted only for the physical science and social science
majors. These groups were of most interest as the video lectures were about physics (physical
science), history, and psychology (social science).
Second, in order to investigate learners’ comprehension level of the lectures as measured
by the criterion measure, the mean scores for the criterion measure and the TOEFL Listening
section scaled scores were obtained for high-, intermediate-, and low-scoring groups on the
TOEFL iBT Listening scaled section score as currently reported in the TOEFL iBT Examinee
Score Report. These three ability score ranges were determined by dividing the sample from the
TOEFL iBT field study (conducted in 2003–04 to establish the score scale for the new test) into
three roughly equal percentiles. The TOEFL iBT Listening scaled score ranges for these three
groups were 22–30, 14–21, and 0–13, respectively. Because of the small sample size for the
gender, academic status, and major field of study subgroups, this analysis was conducted only
for the total group.
Results
Preliminary analysis. The descriptive statistics for the performance of the total group and
different subgroups on the TOEFL iBT Listening section and the criterion measure are presented
in Table 7. The TOEFL iBT Listening section scaled score was on a scale of 0–30. The mean
TOEFL iBT Listening scaled score for the total group was 22.59 (SD = 4.96). The mean score
for all the candidates who took TOEFL iBT between September 2005 and December 2006 (ETS,
2007a) was 20.5 (SD = 6.9). A one-sample t-test showed that the mean for the sample for the
present study was significantly higher than that of the TOEFL iBT population (t (184) = 5.74,
p < .05), with a small effect size (Cohen’s d = .30). The standard deviation for this group was
smaller than that for the operational TOEFL iBT population. Thus, the sample for the present
study represents a higher-listening-ability group with a narrow ability range. This is expected
because the study participants were drawn from a pool of nonnative speakers of English who
were already enrolled in academic degree programs, representing the high end of the TOEFL
population.
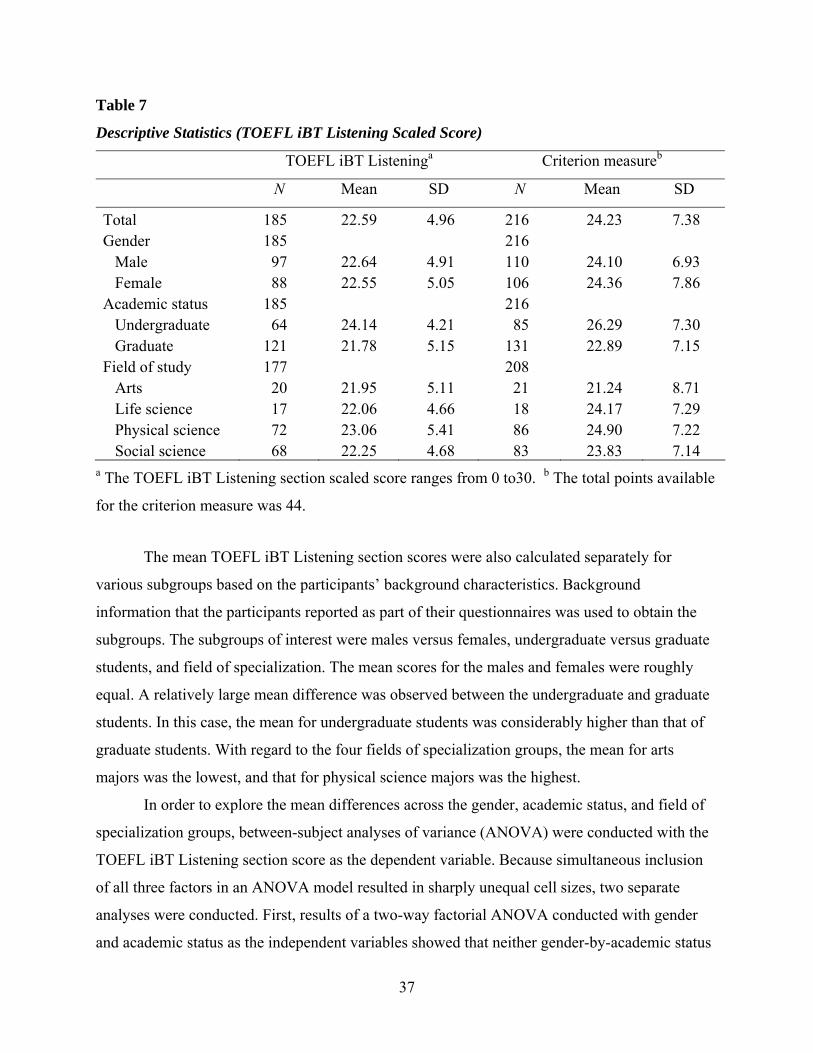
37
Table 7
Descriptive Statistics (TOEFL iBT Listening Scaled Score)
TOEFL iBT Listeninga Criterion measureb
N Mean SD N Mean SD
Total 185 22.59 4.96 216 24.23 7.38 Gender 185 216 Male 97 22.64 4.91 110 24.10 6.93 Female 88 22.55 5.05 106 24.36 7.86 Academic status 185 216 Undergraduate 64 24.14 4.21 85 26.29 7.30 Graduate 121 21.78 5.15 131 22.89 7.15 Field of study 177 208 Arts 20 21.95 5.11 21 21.24 8.71 Life science 17 22.06 4.66 18 24.17 7.29 Physical science 72 23.06 5.41 86 24.90 7.22 Social science 68 22.25 4.68 83 23.83 7.14
a The TOEFL iBT Listening section scaled score ranges from 0 to30. b The total points available
for the criterion measure was 44.
The mean TOEFL iBT Listening section scores were also calculated separately for
various subgroups based on the participants’ background characteristics. Background
information that the participants reported as part of their questionnaires was used to obtain the
subgroups. The subgroups of interest were males versus females, undergraduate versus graduate
students, and field of specialization. The mean scores for the males and females were roughly
equal. A relatively large mean difference was observed between the undergraduate and graduate
students. In this case, the mean for undergraduate students was considerably higher than that of
graduate students. With regard to the four fields of specialization groups, the mean for arts
majors was the lowest, and that for physical science majors was the highest.
In order to explore the mean differences across the gender, academic status, and field of
specialization groups, between-subject analyses of variance (ANOVA) were conducted with the
TOEFL iBT Listening section score as the dependent variable. Because simultaneous inclusion
of all three factors in an ANOVA model resulted in sharply unequal cell sizes, two separate
analyses were conducted. First, results of a two-way factorial ANOVA conducted with gender
and academic status as the independent variables showed that neither gender-by-academic status
38
interaction effect nor the gender main effect was statistically significant (Gender x Status
interaction: F (1, 184) = .26, p > .05; gender main effect: F (1, 184) = .02, p > .05). The
academic status main effect was statistically significant (F (1, 184) = 9.99, p < .05; partial η2
= .05), suggesting that the undergraduate students in the present sample outperformed the
graduate students on the TOEFL iBT Listening section. Second, a separate one-way ANOVA
with the field of study as the independent variable showed that the field of study main effect was
nonsignificant, F (3, 173) = .47, p>.05. 10
Table 7 also shows descriptive statistics for the criterion measure for the total group and
the subgroups. The total score for the criterion measure was the sum of item scores across all
three video sets. Note that the three physics items that were revised after the piloting were
excluded from the subsequent analyses, resulting in 44 total points available for the criterion
measure. The total group mean was 24.23 with a standard deviation of 7.38. The results for the
subgroups were highly similar to those for the TOEFL iBT Listening section in terms of the
patterns observed in the results of the statistical tests of significance. The male and female
groups performed similarly. The means for undergraduate and graduate students were again
considerably different.
Variations in the means across the four groups in different fields of specialization was
observed again, where the mean for arts majors was the lowest and that for the physical science
majors was again the highest. To explore the group mean differences, two separate ANOVAs
were conducted with the criterion measure score as the dependent variable. A two-way factorial
ANOVA with gender and academic status as the independent variables showed that the academic
status was the only statistically significant effect (F (1, 215) = 11.29; p < .05, partial η2 = .05),
while the gender-by-academic status and academic status main effects were not significant
(gender-by-academic status interaction effect: F (1, 215) = .77; p > .05; gender main effect: F (1,
215) = .03, p > .05). This again suggests that the undergraduate students did significantly better
than the graduate students on the criterion measure. A separate one-way ANOVA conducted
with the field of specialization as the independent variable showed that the group means were not
statistically significantly different across the four disciplines, F (3, 204) = 1.43, p > .05.11
Correlations between the video sets and TOEFL iBT Listening section scores. The
bivariate scatter plots for the entire group and the subgroups are presented in Figure 8. The
observed Pearson correlation coefficients associated with the scatter plots are also included in
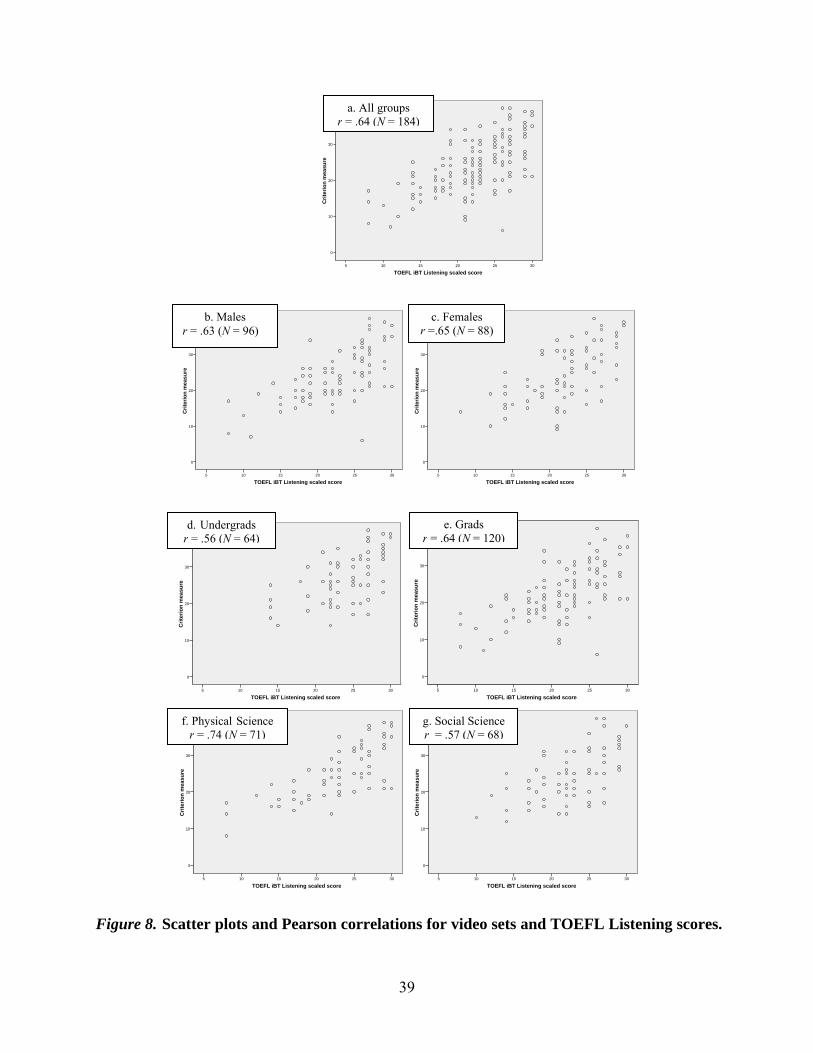
39
TOEFL iBT Listening scaled score30252015105
Crit
erio
n m
easu
re
40
30
20
10
0
TOEFL iBT Listening scaled score30252015105
Crit
erio
n m
easu
re
40
30
20
10
0
TOEFL iBT Listening scaled score30252015105
Crit
erio
n m
easu
re
40
30
20
10
0
TOEFL iBT Listening scaled score30252015105
Crit
erio
n m
easu
re
40
30
20
10
0
TOEFL iBT Listening scaled score30252015105
Crit
erio
n m
easu
re
40
30
20
10
0
TOEFL iBT Listening scaled score30252015105
Crit
erio
n m
easu
re
40
30
20
10
0
TOEFL iBT Listening scaled score30252015105
Crit
erio
n m
easu
re
40
30
20
10
0
Figure 8. Scatter plots and Pearson correlations for video sets and TOEFL Listening scores.
a. All groups r = .64 (N = 184)
b. Males r = .63 (N = 96)
c. Females r =.65 (N = 88)
d. Undergrads r = .56 (N = 64)
e. Grads r = .64 (N = 120)
f. Physical Science r = .74 (N = 71)
g. Social Science r = .57 (N = 68)
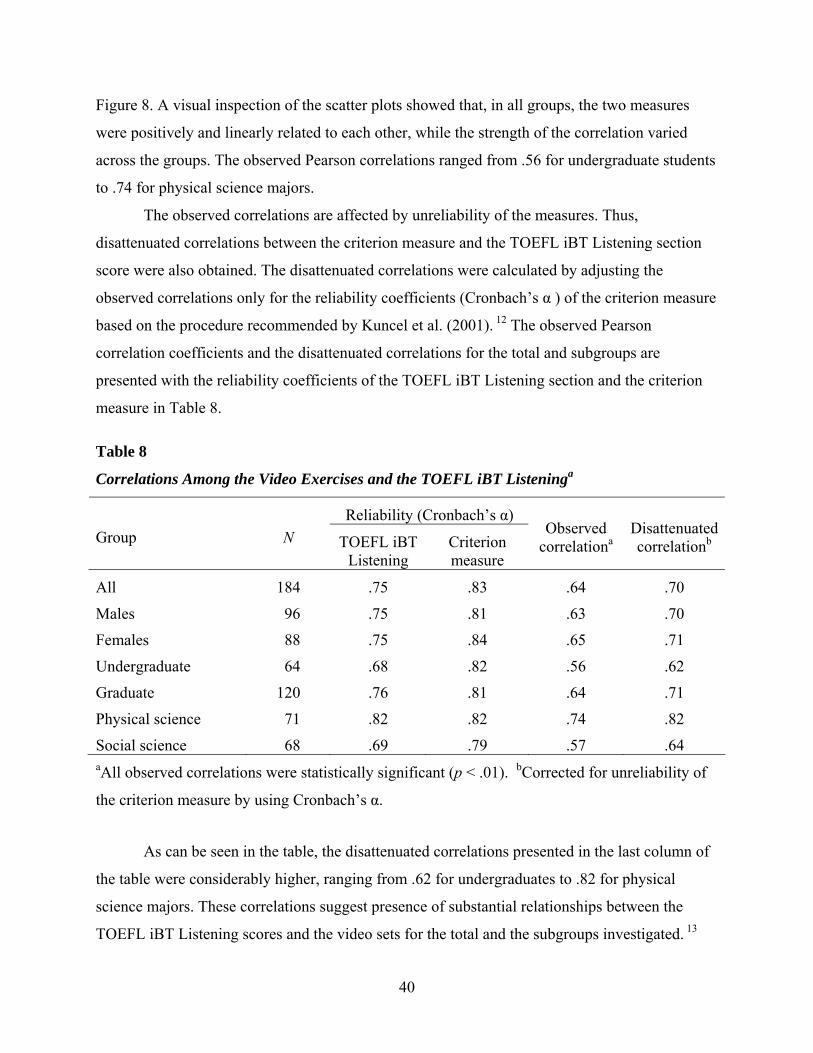
40
Figure 8. A visual inspection of the scatter plots showed that, in all groups, the two measures
were positively and linearly related to each other, while the strength of the correlation varied
across the groups. The observed Pearson correlations ranged from .56 for undergraduate students
to .74 for physical science majors.
The observed correlations are affected by unreliability of the measures. Thus,
disattenuated correlations between the criterion measure and the TOEFL iBT Listening section
score were also obtained. The disattenuated correlations were calculated by adjusting the
observed correlations only for the reliability coefficients (Cronbach’s α ) of the criterion measure
based on the procedure recommended by Kuncel et al. (2001). 12 The observed Pearson
correlation coefficients and the disattenuated correlations for the total and subgroups are
presented with the reliability coefficients of the TOEFL iBT Listening section and the criterion
measure in Table 8.
Table 8
Correlations Among the Video Exercises and the TOEFL iBT Listeninga
Reliability (Cronbach’s α) Group N TOEFL iBT
Listening Criterion measure
Observed correlationa
Disattenuated correlationb
All 184 .75 .83 .64 .70
Males 96 .75 .81 .63 .70
Females 88 .75 .84 .65 .71
Undergraduate 64 .68 .82 .56 .62
Graduate 120 .76 .81 .64 .71
Physical science 71 .82 .82 .74 .82
Social science 68 .69 .79 .57 .64 aAll observed correlations were statistically significant (p < .01). bCorrected for unreliability of
the criterion measure by using Cronbach’s α.
As can be seen in the table, the disattenuated correlations presented in the last column of
the table were considerably higher, ranging from .62 for undergraduates to .82 for physical
science majors. These correlations suggest presence of substantial relationships between the
TOEFL iBT Listening scores and the video sets for the total and the subgroups investigated. 13

41
Level of comprehension of academic lectures by high-, intermediate-, and low-scoring
groups on the TOEFL iBT Listening section. The mean scores for the criterion measure and the
TOEFL Listening section scaled scores for the high-, intermediate- and low-scoring groups are
summarized in Table 9. The second column in the table shows that the majority of the
participants were classified as the high- (65.2%) or intermediate- (30.4%) scoring groups, while
only eight students (4.3%) were classified as the low-scoring group. The overrepresentation of
the high and intermediate groups by the study participants is another piece of evidence that the
present sample represented a relatively high-ability group. The body of the table shows the mean
scores on the TOEFL iBT Listening section and the criterion measure for the three ability groups
in terms of raw score points along with mean percent correct scores in brackets. As expected, for
both the TOEFL Listening section and the criterion measure, the highest means were observed
for the high-scoring group, and the lowest for the low-scoring group. The relatively large
standard deviations for the video exercises for all ability groups indicate that there was
considerable variability across the participants in terms of their scores on the video exercises.
Table 9
Descriptive Statistics on the Criterion Measure for High-, Intermediate-, and Low-Scoring
Groups on the TOEFL iBT Listening Section
TOEFL iBT Listening section
raw scoreb
Criterion measurec TOEFL iBT Listening skill level (scaled score rangea)
Sample size
Mean (% correct)
SD Mean (% correct)
SD
High (22–30) 120 (65.2%)
30.68 (90.2%)
1.78 27.34 (62.1%)
6.55
Intermediate (14–21) 56 (30.4%)
24.96 (73.4%)
1.86 20.32 (46.2%)
5.33
Low (0–13) 8 (4.3%)
17.88 (52.6%)
2.23 13.38 (30.4%)
4.75
All (0–30) 184 (100.0%)
28.38 (83.5%)
3.89 24.60 (55.9%)
7.30
a The TOEFL iBT Listening section scaled score is on a scale of 0–30. b The total points
available for the TOEFL iBT Listening section was 34. c The total points available for the
criterion measure was 44.
42
The mean TOEFL iBT Listening and criterion measure scores for the three scoring groups
are also expressed in percentages in Table 9. In terms of the TOEFL iBT Listening raw score, the
high-, intermediate-, and low-skill groups scored 90.2%, 73.4%, and 52.6% of the raw total score
points, respectively. Regarding the criterion measure, the high-, intermediate-, and low-skill
groups scored 62.1%, 46.2%, and 30.4% of the raw total score points, respectively. The fairly large
differences in the percentages of the scores earned on the TOEFL iBT Listening section and the
criterion measure is an indication that the criterion measure was considerably more difficult for the
study participants. Moreover, on average, those participants classified in the high- and
intermediate-scoring groups were able to score nearly half or more on the video exercises.
Discussion and Conclusions
The present study investigated the criterion-related validity of the TOEFL iBT Listening
section by examining the strength of the relationship between the performance of nonnative
speakers of English (already enrolled in undergraduate and graduate degree programs) on the
TOEFL iBT Listening section and the criterion measure designed to reflect language-use tasks
that nonnative speakers of English would encounter in everyday academic life: academic lecture
listening. The participants’ performance on these two measures was investigated in terms of
mean scores, the correlation coefficients obtained between the two measures, and the level of
comprehension of academic lectures as measured by the criterion measure by high-,
intermediate-, and low-scoring groups on the TOEFL iBT Listening section as currently reported
in the TOEFL iBT Examinee Score Report. Because the results may be affected by the
participants’ background characteristics, these analyses were conducted, where appropriate, for
both the entire sample and for subgroups by gender, academic level, and major field of study.
The results showed, as expected, that the study sample was a significantly more able
group than the operational TOEFL test-taker population in terms of the TOEFL iBT Listening
mean scores. Regarding the subgroup analysis of the TOEFL iBT Listening and criterion
measure mean scores, statistically reliable performance differences were found only between the
undergraduate versus graduate students. The relationship between the TOEFL iBT Listening and
the criterion measures was investigated in two ways. First, the observed Pearson correlation
coefficients and the disattenuated correlations of the TOEFL iBT Listening section revealed
substantial relationships between the two measures for the entire sample and all the subgroups
analyzed, with the observed correlations ranging from .56 to .74, and the disattenuated

43
correlations ranging from .62 and .82. Second, the analysis of the mean scores on the criterion
measure for the high-, intermediate-, and low-scoring groups as currently reported in the TOEFL
iBT Examinee Score Report suggested that those participants who were classified in the high- or
intermediate-scoring groups (i.e., those scoring above 14 on the TOEFL iBT Listening section)
were able to score, on average, nearly 50% or more on the criterion measure to demonstrate their
comprehension of the academic lectures employed.
The superior performance of the undergraduate students over the graduate students on the
TOEFL iBT Listening section is surprising because, on operational TOEFL tests, mean scores
for graduate school applicants are higher than those for undergraduate school applicants (see
ETS, 2007a, 2007b). Further analyses of the participant background data based on their survey
responses showed that the undergraduate and graduate students in the present sample were
comparable regarding various background variables of potential relevance, including the mean
length of residence in the United States/Canada, the mean length of enrollment in the academic
degree programs, and the familiarity with the content of the three academic lectures. In addition,
none of these variables were found to be significant predictors of the TOEFL iBT Listening or
the criterion measure in multiple regression analyses. Thus, the significantly better performance
of the undergraduate students on the TOEFL iBT Listening section seems to be due to a
sampling variation, where students with relatively high English-language proficiency levels
happened to volunteer to participate in this study. The undergraduates’ generally higher English-
language proficiency level may account for their superior performance on the criterion measure
as well. Another possible explanation for this finding may be undergraduate students’ exposure
to academic lectures on a wide range of academic disciplines (such variety is typically part of
undergraduate coursework to fulfill their general education requirements). This is in contrast to
typical graduate students, who tend to take courses primarily in their area of specialization.
Two additional key findings related to the relationship between the TOEFL iBT Listening
section and the criterion measure deserve further discussion. First, the substantial correlations
between the TOEFL iBT Listening section and the criterion measure obtained for the entire
sample and the subgroups in this study are generally higher than the validity coefficients reported
in the previous predictive validity studies reviewed in the literature review section. One
explanation for this finding includes the concurrent study design employed in this study. Taking
both the language ability and criterion measures at the same time minimizes the amount of error
44
(e.g., learner growth), which is more pronounced in predictive validity studies where the two
measures are taken at different points in time (e.g., taking the measure of language ability before
admission to the academic program, and taking the measure of academic success after a year of
academic work in the degree program). Another would be the nature of the construct that the
criterion measure in this study assessed. Because the focus was on nonnative English speakers’
understanding of academic course materials presented orally in lectures, it has considerable
overlap with the academic listening ability assessed on the TOEFL iBT Listening section.
This second issue also explains the similarity of findings of this study with previous
criterion-related validity studies of language measures (in that case, the criterion measures were
also another measure of language ability). For example, in Ross’s (1998) meta-analysis study, in
which 60 correlations between self-assessments of language ability and criterion measures were
meta-analyzed, the average correlation between self-rating of listening skills and a criterion
measure of listening ability was .65. This value increased to .75 when correlations coming from
the same studies were combined to remove dependency in the data.
At least two explanations seem possible for the slightly lower range of the correlations
found in this study (observed correlations of .56 to .74) compared to the mean correlation found
between self-assessments and other types of listening measures reported by Ross (1998). The
first is the range restriction built into the present study design. Because the decision was made to
limit the study participants to only those who had already been admitted to undergraduate and
graduate programs (and thus had had sufficient prior experience attending academic lectures),
the study sample represented an ability group that was at the higher end of the TOEFL scale with
a narrow ability range. Because correlation coefficients are underestimated when the range is
restricted, this may serve as one reason for the slightly lower correlations found in this study.
The second is the unique nature of the criterion measure employed in this study, which
has features of a content assessment rather than a language assessment. In Ross’s (1998) study,
the focus was on investigating the relationship between two language assessments, one being
language learners’ self-assessment of their listening ability and the other being another form of
listening assessment. Thus, it is expected that, despite the difference in the method of
assessment, the two measures share a considerable amount of score variance. In contrast, the
criterion measure employed in the present study was designed by experts in three content areas
to test the comprehension of important points that they believed students had to take away from a

45
lecture. The student responses were scored using scoring criteria these content experts would use
when scoring student papers for in-class exams as well. Although one might argue that the
criterion measure still closely overlaps with a language assessment because the focus is on
testing the comprehension of the content of the academic lectures, it is interesting to see that
respectable correlations between the TOEFL iBT Listening section and the criterion measure
were found in this context. Moreover, the lectures in the criterion measure were about 30
minutes long. This is much longer than TOEFL iBT lectures, which are typically about five
minutes long. The longer duration of the criterion measure lectures more closely replicates the
listening load in actual university lectures; this length also allows for more detail, elaboration,
explanation, and exemplification of the content. TOEFL iBT lectures are only five minutes long
and need to support six test questions, so their information load is at times rather dense.
Another key finding of the study was the performance level of the three TOEFL iBT
Listening-ability groups on the criterion measure. The results showed that, although there was
considerable variability in their performance, those students who were classified in the high- or
intermediate-scoring groups on the TOEFL iBT Listening section scored, on average, close to
50% or more on the criterion measure, while the figure dropped to 30.4% for the low-scoring
group. The performance level of the intermediate-scoring group is of particular interest because
the TOEFL iBT Listening section scaled-score range for this group (14–21) represents the
listening-ability level required for admission to many undergraduate and graduate programs. In a
series of TOEFL iBT standard-setting studies conducted at five universities in the United States
and Canada in 2004 (ETS, 2005), for example, the cut scores for the TOEFL iBT Listening
section for admission to undergraduate and graduate programs at these institutions recommended
by the standard-setting committees ranged from the scaled scores of 14 to 17. 14 Moreover, most
of the cut scores for the TOEFL iBT Listening section required for admission to undergraduate
and graduate programs reported to ETS by TOEFL score users as of October 2006 range from
the scaled score of 14 to 21. 15
An accurate interpretation of the results of this study—whether scoring close to 50% on
the criterion measure employed in this study is sufficient for a nonnative speaker of English to
succeed in academic programs—requires consideration of the nature of the tasks completed by
the study participants. Although the criterion measure was carefully designed to reflect various
features of language-use tasks that students would encounter while taking an academic course,

46
the design could certainly not accommodate every important feature. Thus, its design should be
considered still far from authentic. First of all, in real life, students’ knowledge about a given
subject area accumulates as they attend lectures and complete various types of assignments.
Thus, when they attend a lecture, they typically have a good idea as to what will be covered in
the lecture. In this study, however, the participants completed the criterion measures with
virtually no preparation. Second, as shown in the results of the university student survey
presented at the beginning of this report, virtually all course assignments that have stakes for
their course grades require at least some degree of integration of content materials orally
presented in class with other sources of information. This also implies that students are usually
tested on their comprehension of course materials not immediately after a lecture but after having
had ample time to review the lecture content in relation to other course materials. Again, this was
not the case in the present study. The third is the speeded nature of the video lectures employed
in the criterion measure compared to lectures students would encounter in real life. For example,
in the post-test questionnaire administered as part of the pilot study, some students pointed out
that they felt that the lecture was “too fast” because the visual materials (pictures, figures, and
text summaries of talking points) in the video lectures were all ready-made and presented one
after another on the screen. These study participants felt that this was considerably different from
what they would experience in real life because a lecturer would often use a board to write down
important points during class, which leaves students more time to take notes and catch up with
their thoughts. Moreover, the video lectures employed in this study were monologic in nature,
which is different from many authentic lectures that have student interaction. For example, in
actual lectures, students typically have the opportunity to ask questions for clarification purposes.
Considering these important differences between the actual lecture-listening task in real
life and what was required of students in the present study, one can see that the video exercises
that the study participants completed were rather challenging tasks. Thus, the authors believe that
the performance level of the TOEFL Listening high- and intermediate-scoring groups on the
criterion measure is respectable. It is likely that these students comprehend the lecture content
better if they listen to academic lectures in a real academic context, where they can work on
familiar content, have opportunities to clarify their understanding during the lecture, or have
ample time to reflect on the lecture content before testing.
47
Although the present study has provided some useful insights into the criterion-related
validity of the TOEFL iBT Listening section, the results must be interpreted carefully because of
various limitations. Besides the limitations of the design of the criterion measure discussed in
detail, the use of lectures that were not specifically designed with a particular undergraduate- or
graduate-student audience in mind is a notable limitation of this study. The corpus analysis
conducted for validation of the criterion measure also showed that the linguistic characteristics of
the chosen lectures were atypical in some respects. Moreover, the present study sample cannot be
considered representative of the current TOEFL test-taker population. The sample size was small
and based on volunteers recruited at a small number of institutions in the United States and
Canada. The motivation level of the participants for completing the TOEFL iBT Listening
section and the criterion measure might also have been different from that of the operational
TOEFL test takers because their performance on the study measures had no stakes for them. For
these reasons, the results of this study should be interpreted with caution, and we recommend a
follow-up study with a larger sample that is more representative of the operational TOEFL test-
taker population.

48
References
American Educational Research Association, American Psychological Association, & National
Council on Measurement in Education. (1999). Standards for educational and
psychological testing. Washington, DC: American Educational Research Association.
Bachman, L. F., & Palmer, A. (1996). Language testing in practice. Oxford, U.K: Oxford
University Press.
Bejar, I., Douglas, D., Jamieson, J., Nissan, S., & Turner, J. (2000). TOEFL 2000 listening
framework: A working paper (TOEFL Monograph Series No. 21). Princeton, NJ: ETS.
Biber, D. (1988). Variations across speech and writing. Cambridge, U.K.: Cambridge University
Press.
Biber, D., Conrad, S., Reppen, R., Byrd, P., & Helt, M. (2002). Speaking and writing in the
university: A multidimensional comparison. TESOL Quarterly, 36(1), 9–48.
Biber, D., Conrad, S. M., Reppen, R., Byrd, P., Helt, M., Clark, V., Cortes, V., Csomay, E., &
Urzua, A. (2004). Representing language use in the university: Analysis of the TOEFL
2000 spoken and written academic language corpus (TOEFL Monograph Series No. 25).
Princeton, NJ: ETS.
Brennan, R. L., Gao, X., & Colton, D. A. (1995). Generalizability analysis of work keys listening
and writing tests. Educational and Psychological Measurement, 55(2), 157–176.
Brindley, G., & Slatyer, H. (2002). Exploring task difficulty in ESL listening assessment.
Language Testing, 19(4), 369–394.
Buck, G. (2001). Assessing listening. Cambridge, U.K.: Cambridge University Press.
Buck, G., & Tatsuoka, K. (1998). Application of the rule-space procedure to language testing:
Examining attributes of a free response listening test. Language Testing, 15, 119–57.
Carrell, P. L. (2007). Notetaking Strategies and their relationship to performance on listening
comprehension and communicative assessment tasks (TOEFL Monograph Series No. 21).
Princeton, NJ: ETS.
Carrell, P. L., Dunkel, P. A., & Mollaun, P. (2002). The effects of notetaking, lecture length and
topic on the listening comprehension of TOEFL 2000 (TOEFL Monograph Series No.
23). Princeton, NJ: ETS.
49
Chaudron, C., Loschky, L., & Cook, J. (1994). Second language listening comprehension and
lecture note-taking. In J. Flowerdew (Ed.), Academic listening: Research perspective (pp.
75–92). Cambridge, U.K.: Cambridge University Press.
Chaudron, C., & Richards, J. (1986). The effects of discourse markers on the comprehension of
lectures. Applied Linguistics, 7(2), 113–127.
Cohen, J. (1988). Statistical power analysis for the behavioral sciences (2nd ed.). Hillsdale, NJ:
Erlbaum.
DeCarrico, J., & Nattinger, J. R. (1988). Lexical phrases for the comprehension of academic
lectures. English for Specific Purposes, 7, 91–102.
Douglas, D. (2000). Assessing language for specific purposes. Cambridge, U.K.: Cambridge
University Press.
Douglas, D., & Nissan, S. (2001, February). Developing listening prototypes using a corpus of
spoken academic English. In S. Briggs (Chair), Using language corpora in language
testing. Symposium conducted at the 23rd Language Testing Research Colloquium, St.
Louis, MO.
Dudley-Evans, T. (1994). Variations in the discourse patterns favored by different disciplines
and their pedagogical implications. In J. Flowerdew (Ed.), Academic listening: Research
perspective (pp. 146–158). Cambridge, U.K.: Cambridge University Press.
Dunkel, P., & Davis, J. N. (1994). The effects of rhetorical signaling cues on the recall of
English lecture information by speakers of English as a native or second language. In J.
Flowerdew (Ed.), Academic listening: Research perspective (pp. 55–74). Cambridge,
U.K.: Cambridge University Press.
ETS. (2005). Results of standard setting at five North American universities. Retrieved
November 10, 2006, from ETS Web site:
http://www.ets.org/Media/Tests/TOEFL/pdf/standardsetting.pdf
ETS. (2007a). Test and score data summary for TOEFL® Internet-based test: September 2005–
December 2006 test data. Princeton, NJ: Author.
ETS. (2007b). Test and score data summary for TOEFL® computer-based and paper-based
tests: July 2005–June 2006 test data. Princeton, NJ: Author.
50
Flowerdew, J. (1994). Research of relevance to second language lecture comprehension—An
overview. In J. Flowerdew (Ed.), Academic listening: Research perspective (pp. 7–29).
Cambridge, U.K.: Cambridge University Press.
Flowerdew, J., & Tauroza, S. (1995). The effects of discourse markers on second language
lecture comprehension. Studies in second language acquisition, 17, 435–458.
Freedle, R., & Kostin, I. (1999). Does the text matter in a multiple-choice test of comprehension?
The case for the construct validity of TOEFL’s minitalks. Language Testing, 16, 2–32.
Ginther, A., & Grant, L. (1996). A review of the academic needs of native English-speaking
college students in the United States (TOEFL Monograph Series No. 1). Princeton, NJ:
ETS.
Graham, J. G., (1987). English language proficiency and the prediction of academic success.
TESOL Quarterly, 21(3), 505–521.
Gruba, P. (1997). The role of video media in listening assessment. System, 25, 335–345.
Hale, G., Taylor, C., Bridgeman, B., Carson, J., Kroll, B., & Kantor, R. (1996). A study of
writing tasks assigned in academic degree programs (TOEFL Research Rep. No. 54).
Princeton, NJ: ETS.
Hansen, C., & Jensen, C. (1994). Evaluating lecture comprehension. In J. Flowerdew (Ed.),
Academic listening: Research perspective (pp. 241–268). Cambridge, U.K.: Cambridge
University Press.
Hartnett, R. T., & Willingham, W. W. (1980). The criterion problem: What measure of success
in graduate education? Applied Psychological Measurement, 4, 281–291.
Hill, K., Storch, N., & Lynch, B. (1999). A comparison of IELTS and TOEFL as predictors of
academic success. International English Language Test System (IELTS) Research
Reports, Vol. 2 (pp. 52–63). Canberra, Australia: IELTS Australia Pty Limited.
Jacoby, S., & McNamara, T. (1999). Locating competence. English for Specific Purposes, 18(3),
213–341.
Jamieson, J., Jones, S., Kirsch, I., Mosenthal, P., & Taylor, C. (2000). TOEFL® 2000
Framework: A working paper (TOEFL Monograph Series No. 16). Princeton, NJ: ETS.
Khuwaileh, A. A. (1999). The role of chunks, phrases and body language in understanding
co-ordinated academic lectures. System, 27, 249–260.
51
Kuncel, N. R., Hezlett, S. A., & Ones, D. S. (2001). A comprehensive meta-analysis of the
predictive validity of the Graduate Record Examinations®: Implications for graduate
student selection and performance. Psychological Bulletin, 127(1), 162–181.
Lee, Y.-W. (2005). Dependability of scores for a new ESL speaking test: Evaluating prototype
tasks (TOEFL Monograph Series No. 28). Princeton, NJ: ETS.
Lee, Y.-W., & Kantor, R. (2005). Dependability of new ESL writing test scores: Evaluating
prototype tasks and alternative rating schemes (TOEFL Monograph Series No. 31).
Princeton, NJ: ETS.
McNamara, T. (1996). Measuring language performance. Essex, U.K.: Longman.
Messick, S. (1989). Validity. In R. L. Linn (Ed.), Educational measurement (3rd ed., pp. 13–
103). New York: American Council on Education and MacMillan.
Nissan, S., DeVincenzi, F., & Tang, K. L. (1996). An analysis of factors affecting the difficulty of
dialogue items in TOEFL listening comprehension (TOEFL Research Rep. No. 51).
Princeton, NJ: ETS.
Olson, L. A., & Huckin, T. N. (1990). Point-driven understanding in engineering lecture
comprehension. English for Specific Purposes, 9, 33–47.
Powers, D. E. (1985). A survey of academic demands related to listening skills (TOEFL
Research Rep. No. 20). Princeton, NJ: ETS.
Powers, D. E. (1986). Academic demands related to listening skills. Language Testing, 3(1),
1–38.
Powers, D. E., Roever, C., Huff, K. L., & Trapani, C. S. (2003). Validating LanguEdge
Courseware scores against faculty ratings and student self-assessments (ETS Research
Rep. No. RR-03–11). Princeton, NJ: ETS.
Richards, J. C. (1983). Listening comprehension: Approach, design, procedure. TESOL
Quarterly, 17(2), 219–240.
Roever, C., & Powers, D. E. (2005). Effects of language of administration on a self-assessment
of language skills (TOEFL Monograph Series No. 27). Princeton, NJ: ETS.
Rosenfeld, M., Leung, S., & Oltman, P.K. (2001). The reading, writing, speaking, and listening
tasks important for academic success at the undergraduate and graduate levels (TOEFL
Monograph Series No. 21). Princeton, NJ: ETS.
52
Ross, S. (1998 ). Self-assessment in second language testing: A meta-analysis and analysis of
experiential factors. Language Testing, 15(1), 1–20.
Rost, M. (1994). On-line summaries as representations of lecture understanding. In
J. Flowerdew (Ed.), Academic listening: Research perspective (pp. 93–27). Cambridge,
U.K.: Cambridge University Press.
Rupp, A. A., Garcia, P., & Jamieson, J. (2001). Combining multiple regression and CART to
understand difficulty in second language reading and listening comprehension test items.
International Journal of Testing, 1, 185–216.
Sawaki, Y. (2005). The generalizability of summarization and free recall ratings in L2 reading
assessment. JLTA Journal, 7, 21–44.
Sharon, A. T. (1972). English proficiency, verbal aptitude and foreign student success in
American graduate school. Educational and Psychological Measurement, 32, 425–431.
Stevens, J. (1990). Intermediate statistics: A modern approach. Hillsdale, NJ: Erlbaum.
Tauroza, S., & Allison, D. (1994). Expectation-driven understanding in information systems
lecture comprehension. In J. Flowerdew (Ed.), Academic listening: Research perspective
(pp. 35–54). Cambridge, U.K.: Cambridge University Press.
Wagner, E. (2007). Are they watching? Test-taker viewing behavior during an L2 video listening
test. Language Learning & Technology, 11, 67–86.
Waters, A. (1996). A review of research into needs in English for academic purposes of
relevance to the North American higher education context (TOEFL Monograph Series
No. 6). Princeton, NJ: ETS.
Xi, X., & Mollaun, P. (2006). Investigating the utility of analytic scoring for the TOEFLⓇ
Academic Speaking Test (TAST) (TOEFL iBT Research Series No. 1). Princeton, NJ: ETS.
53
Notes 1 Survey data were also collected from 22 faculty members at the same institutions, who
responded to the faculty version of the survey instrument. However, the results based on the
faculty survey are not presented here due to the small sample size.
2 Obtaining the exact number of the courses represented in the data was not possible because of
incomplete titles reported by participants.
3 One participant did not provide the subject-area information for the course elected for
reporting.
4 One participant did not provide the course-format information for the undergraduate course.
5 One participant did not provide the course-format information for the graduate course.
6 Biber et al. (2002) analyzed 10 university registers: service encounters, office hours, study
groups, classroom management, labs, classroom teaching for spoken texts and textbooks,
course packs, course management, and institutional writing material for written texts.
7 Douglas Biber tagged the transcript and ran the computer program LXMDCompare for this
analysis.
8 The survey was administered to the main-study participants again in order to confirm the
findings of the survey study, which was based on a rather small sample. Although the results
from the main study are not presented here, the results verified the trends observed in the
frequency and importance of various tasks requiring academic listening and course
assignments in the initial survey study.
9 The three physics items removed from the subsequent analyses were Items 1, 2, and 3 in
Appendix G. An item analysis of the main study data showed that the psychometric quality of
these items was still unsatisfactory. The physics content experts agreed that removing these
three items was acceptable from a content perspective because the remaining seven items in
the set sufficiently covered the key points of the lecture.
10 When the sample sizes for groups being compared are sharply unequal, robustness of an
ANOVA result can be a concern. According to Stevens (1990), however, this is the case only
when (a) the sample sizes of the four groups are sharply unequal (i.e., the sample size for the
largest group divided by that for the smallest group is greater than 1.5) and (b) a statistical test
54
shows that the group variances are unequal (Stevens, 1990, p. 42). For the present sample, a
Levene’s test indicated that the four group variances did not differ significantly.
11 See note 10. A Levene’s test suggested that the group variances did not differ significantly for
the video exercises either.
12 It is worth noting that the reliability coefficients of the criterion measure are inflated due to the
interdependencies among some of the items. For example, Items 8 and 9 in the physics video
set have some content overlap. That is, option C for Item 8 and option C for Item 9 are
incompatible to each other. Thus, a student who has selected the former is unlikely to select
the latter, and vice-versa. A similar content overlap is seen between Items 4 and 7 in the
psychology video set, where the visual presented in Item 4 can function as a clue for Item 7.
13 Based on Cohen (1988; pp. 80-81), where a correlation of equal to or above .5 is considered a
large effect.
14 The cut scores recommended by these committees were further reviewed by the respective
institutions to set final cut scores by considering various factors. Thus, the panel
recommendations may differ from the standards adopted for admission purposes by these
institutions.
15 The statistics here are based on the information available at the TOEFL Web site
(http://www.ets.org, updated in October 2006). The cut scores for the TOEFL iBT Listening
section presented here are for institutions that specified separate cut scores for the Listening
section or those that have indicated a minimum score for each section.

55
List of Appendixes
Page
A - Survey Instrument for the University Student Survey......................................................... 56
B - Incidence of Various Activities Requiring Student Listening in the
Classroom (N = 136)........................................................................................................... 61
C - Importance of Various Activities Requiring Student Listening in the
Classroom (N = 136)............................................................................................................ 63
D - Frequency of Course Assignments and Their Percentages Composed of
Final Course Grade (N = 136).............................................................................................. 65
E - Information Source for Completing Course Assignments (N = 136) .................................. 66
F - Characteristics of Video Lectures........................................................................................ 67
G - Physics Video Exercise........................................................................................................ 70
H - History Video Exercise ........................................................................................................ 73
I - Psychology Video Exercise ................................................................................................. 77
J - Questions on Student Familiarity With Lecture Content (Sample Taken
From the Psychology Video Set) ......................................................................................... 81
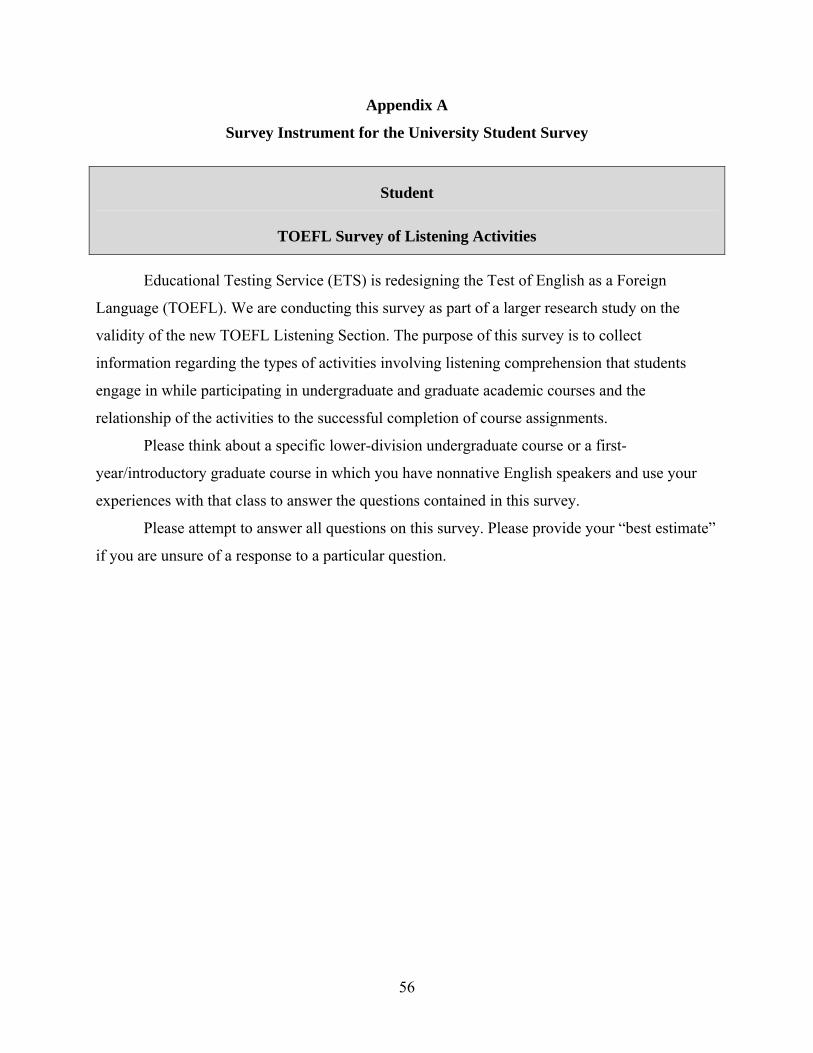
56
Appendix A
Survey Instrument for the University Student Survey
Student
TOEFL Survey of Listening Activities
Educational Testing Service (ETS) is redesigning the Test of English as a Foreign
Language (TOEFL). We are conducting this survey as part of a larger research study on the
validity of the new TOEFL Listening Section. The purpose of this survey is to collect
information regarding the types of activities involving listening comprehension that students
engage in while participating in undergraduate and graduate academic courses and the
relationship of the activities to the successful completion of course assignments.
Please think about a specific lower-division undergraduate course or a first-
year/introductory graduate course in which you have nonnative English speakers and use your
experiences with that class to answer the questions contained in this survey.
Please attempt to answer all questions on this survey. Please provide your “best estimate”
if you are unsure of a response to a particular question.
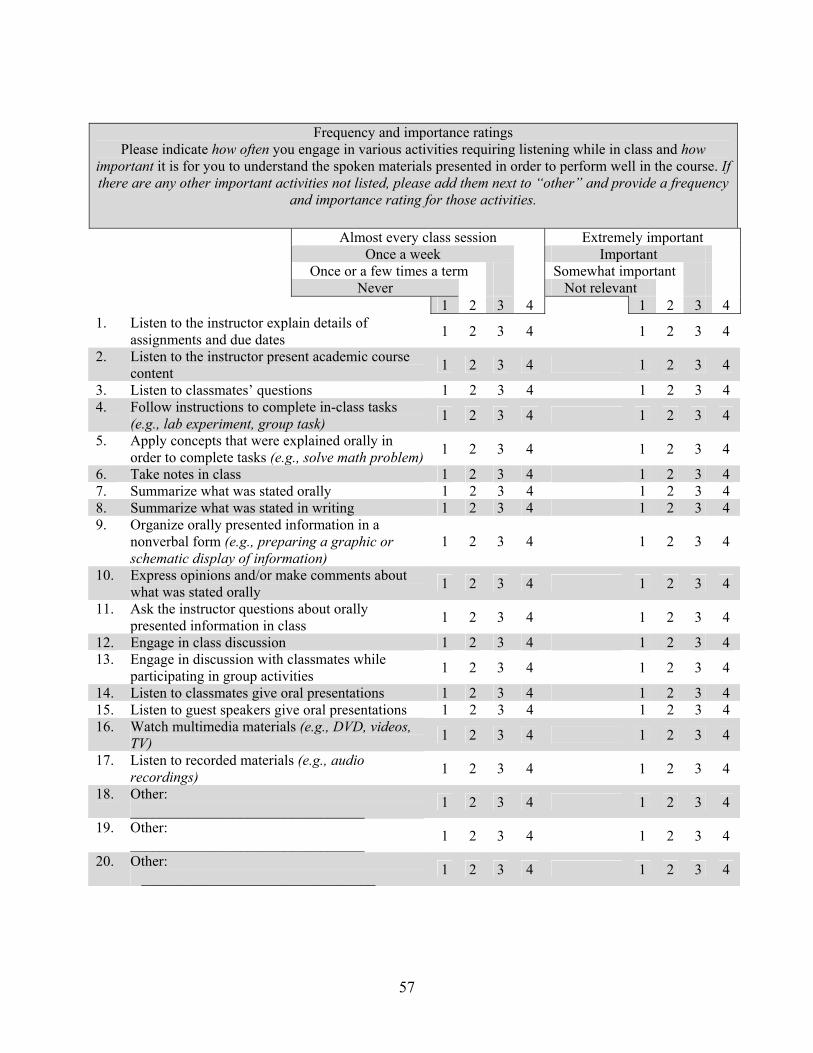
57
Frequency and importance ratings Please indicate how often you engage in various activities requiring listening while in class and how
important it is for you to understand the spoken materials presented in order to perform well in the course. If there are any other important activities not listed, please add them next to “other” and provide a frequency
and importance rating for those activities.
Almost every class session Extremely important Once a week Important Once or a few times a term Somewhat important Never Not relevant
1 2 3 4 1 2 3 4 1. Listen to the instructor explain details of
assignments and due dates 1 2 3 4 1 2 3 4
2. Listen to the instructor present academic course content 1 2 3 4 1 2 3 4
3. Listen to classmates’ questions 1 2 3 4 1 2 3 4 4. Follow instructions to complete in-class tasks
(e.g., lab experiment, group task) 1 2 3 4 1 2 3 4
5. Apply concepts that were explained orally in order to complete tasks (e.g., solve math problem) 1 2 3 4 1 2 3 4
6. Take notes in class 1 2 3 4 1 2 3 4 7. Summarize what was stated orally 1 2 3 4 1 2 3 4 8. Summarize what was stated in writing 1 2 3 4 1 2 3 4 9. Organize orally presented information in a
nonverbal form (e.g., preparing a graphic or schematic display of information)
1 2 3 4 1 2 3 4
10. Express opinions and/or make comments about what was stated orally 1 2 3 4 1 2 3 4
11. Ask the instructor questions about orally presented information in class 1 2 3 4 1 2 3 4
12. Engage in class discussion 1 2 3 4 1 2 3 4 13. Engage in discussion with classmates while
participating in group activities 1 2 3 4 1 2 3 4
14. Listen to classmates give oral presentations 1 2 3 4 1 2 3 4 15. Listen to guest speakers give oral presentations 1 2 3 4 1 2 3 4 16. Watch multimedia materials (e.g., DVD, videos,
TV) 1 2 3 4 1 2 3 4
17. Listen to recorded materials (e.g., audio recordings) 1 2 3 4 1 2 3 4
18. Other: ________________________________ 1 2 3 4 1 2 3 4
19. Other: ________________________________ 1 2 3 4 1 2 3 4
20. Other: ________________________________ 1 2 3 4 1 2 3 4
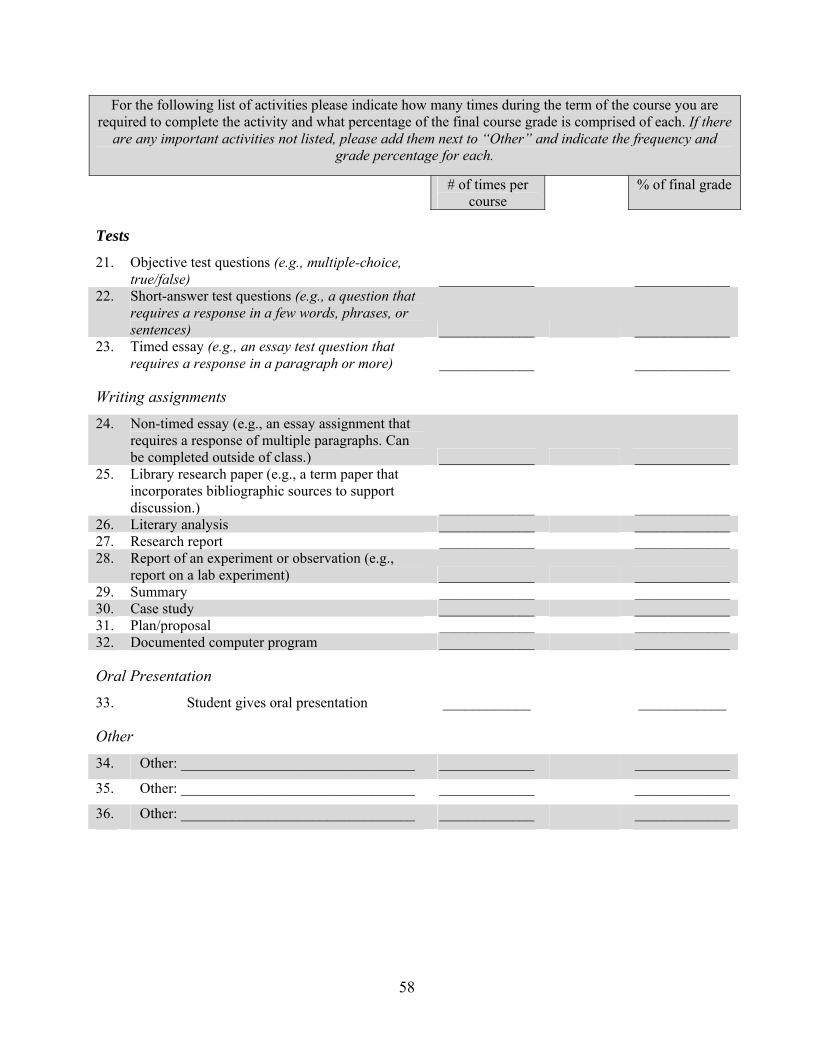
58
For the following list of activities please indicate how many times during the term of the course you are required to complete the activity and what percentage of the final course grade is comprised of each. If there
are any important activities not listed, please add them next to “Other” and indicate the frequency and grade percentage for each.
# of times per course
% of final grade
Tests
21. Objective test questions (e.g., multiple-choice, true/false) _____________ _____________
22. Short-answer test questions (e.g., a question that requires a response in a few words, phrases, or sentences) _____________ _____________
23. Timed essay (e.g., an essay test question that requires a response in a paragraph or more) _____________ _____________
Writing assignments
24. Non-timed essay (e.g., an essay assignment that requires a response of multiple paragraphs. Can be completed outside of class.) _____________ _____________
25. Library research paper (e.g., a term paper that incorporates bibliographic sources to support discussion.) _____________ _____________
26. Literary analysis _____________ _____________ 27. Research report _____________ _____________ 28. Report of an experiment or observation (e.g.,
report on a lab experiment) _____________ _____________ 29. Summary _____________ _____________ 30. Case study _____________ _____________ 31. Plan/proposal _____________ _____________ 32. Documented computer program _____________ _____________
Oral Presentation
33. Student gives oral presentation ____________ ____________
Other
34. Other: ________________________________ _____________ _____________
35. Other: ________________________________ _____________ _____________
36. Other: ________________________________ _____________ _____________
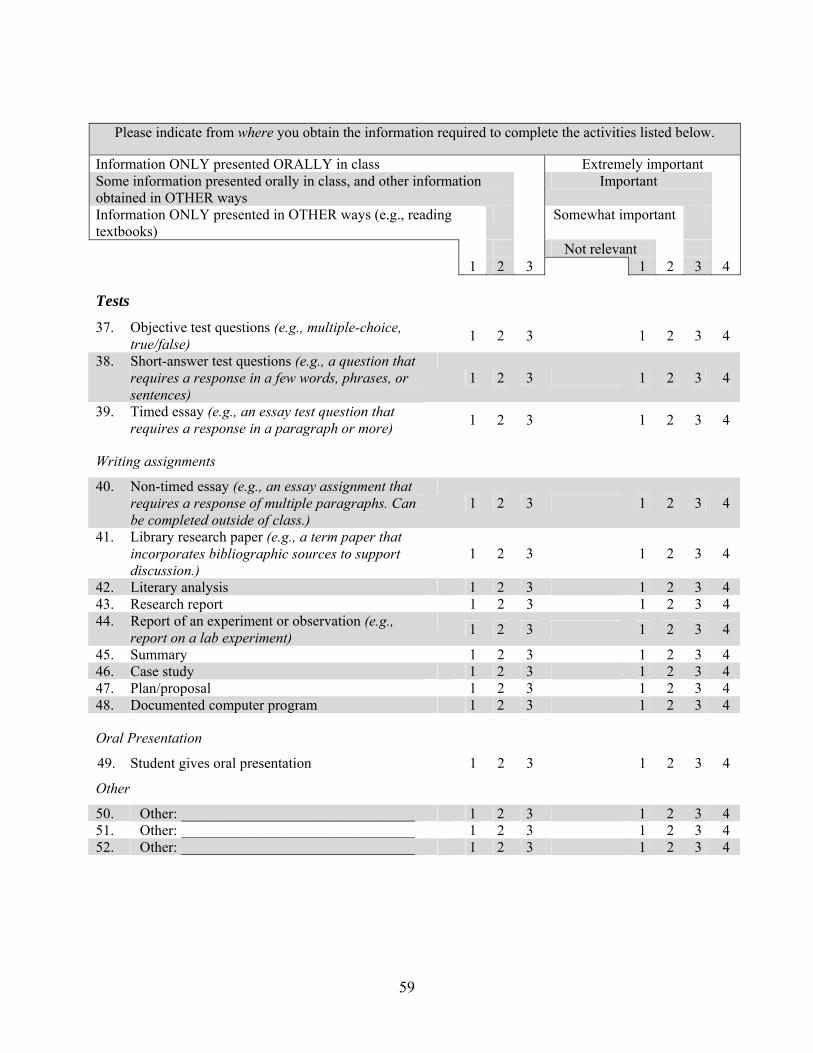
59
Please indicate from where you obtain the information required to complete the activities listed below.
Information ONLY presented ORALLY in class Extremely important Some information presented orally in class, and other information obtained in OTHER ways
Important
Information ONLY presented in OTHER ways (e.g., reading textbooks)
Somewhat important
Not relevant 1 2 3 1 2 3 4
Tests 37. Objective test questions (e.g., multiple-choice,
true/false) 1 2 3 1 2 3 4
38. Short-answer test questions (e.g., a question that requires a response in a few words, phrases, or sentences)
1 2 3 1 2 3 4
39. Timed essay (e.g., an essay test question that requires a response in a paragraph or more)
1 2 3 1 2 3 4
Writing assignments
40. Non-timed essay (e.g., an essay assignment that requires a response of multiple paragraphs. Can be completed outside of class.)
1 2 3 1 2 3 4
41. Library research paper (e.g., a term paper that incorporates bibliographic sources to support discussion.)
1 2 3 1 2 3 4
42. Literary analysis 1 2 3 1 2 3 4 43. Research report 1 2 3 1 2 3 4 44. Report of an experiment or observation (e.g.,
report on a lab experiment) 1 2 3 1 2 3 4
45. Summary 1 2 3 1 2 3 4 46. Case study 1 2 3 1 2 3 4 47. Plan/proposal 1 2 3 1 2 3 4 48. Documented computer program 1 2 3 1 2 3 4
Oral Presentation
49. Student gives oral presentation 1 2 3 1 2 3 4
Other
50. Other: ________________________________ 1 2 3 1 2 3 4 51. Other: ________________________________ 1 2 3 1 2 3 4 52. Other: ________________________________ 1 2 3 1 2 3 4
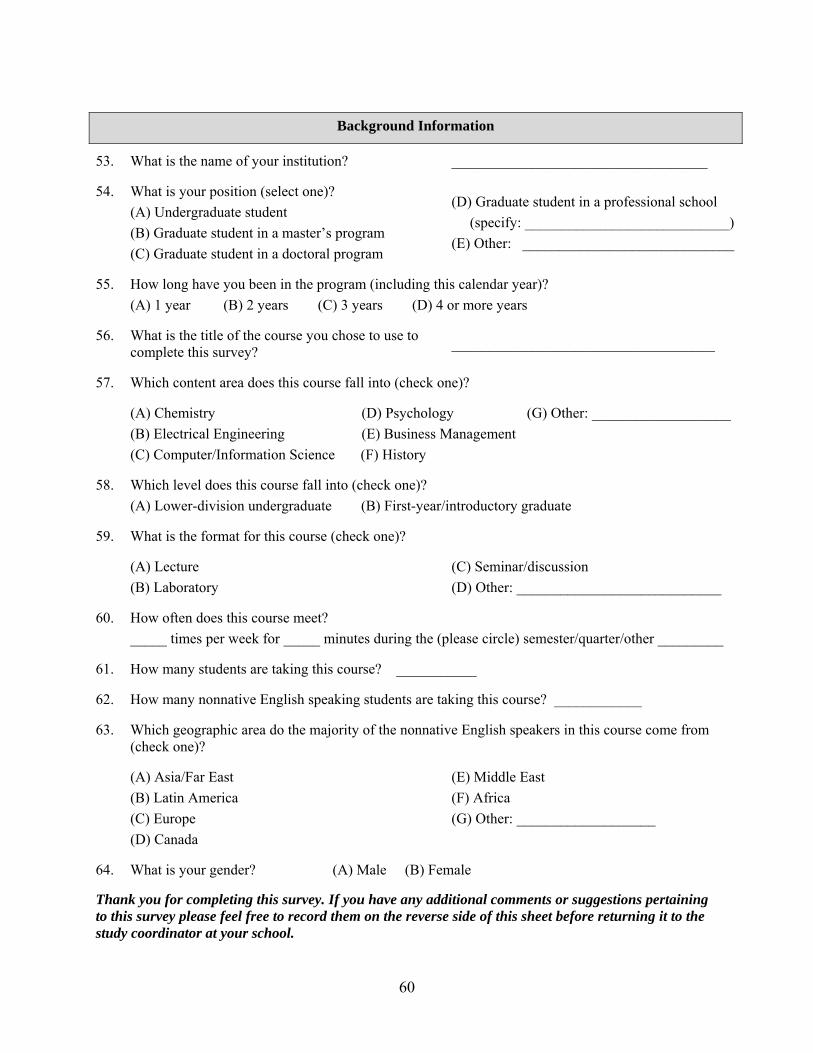
60
Background Information
53. What is the name of your institution? ___________________________________
54. What is your position (select one)? (A) Undergraduate student (B) Graduate student in a master’s program (C) Graduate student in a doctoral program
(D) Graduate student in a professional school (specify: ____________________________) (E) Other: _____________________________
55. How long have you been in the program (including this calendar year)? (A) 1 year (B) 2 years (C) 3 years (D) 4 or more years
56. What is the title of the course you chose to use to complete this survey? ____________________________________
57. Which content area does this course fall into (check one)?
(A) Chemistry (D) Psychology (G) Other: ___________________ (B) Electrical Engineering (E) Business Management (C) Computer/Information Science (F) History
58. Which level does this course fall into (check one)? (A) Lower-division undergraduate (B) First-year/introductory graduate
59. What is the format for this course (check one)?
(A) Lecture (B) Laboratory
(C) Seminar/discussion (D) Other: ____________________________
60. How often does this course meet? _____ times per week for _____ minutes during the (please circle) semester/quarter/other _________
61. How many students are taking this course? ___________
62. How many nonnative English speaking students are taking this course? ____________
63. Which geographic area do the majority of the nonnative English speakers in this course come from (check one)?
(A) Asia/Far East (B) Latin America (C) Europe (D) Canada
(E) Middle East (F) Africa (G) Other: ___________________
64. What is your gender? (A) Male (B) Female
Thank you for completing this survey. If you have any additional comments or suggestions pertaining to this survey please feel free to record them on the reverse side of this sheet before returning it to the study coordinator at your school.
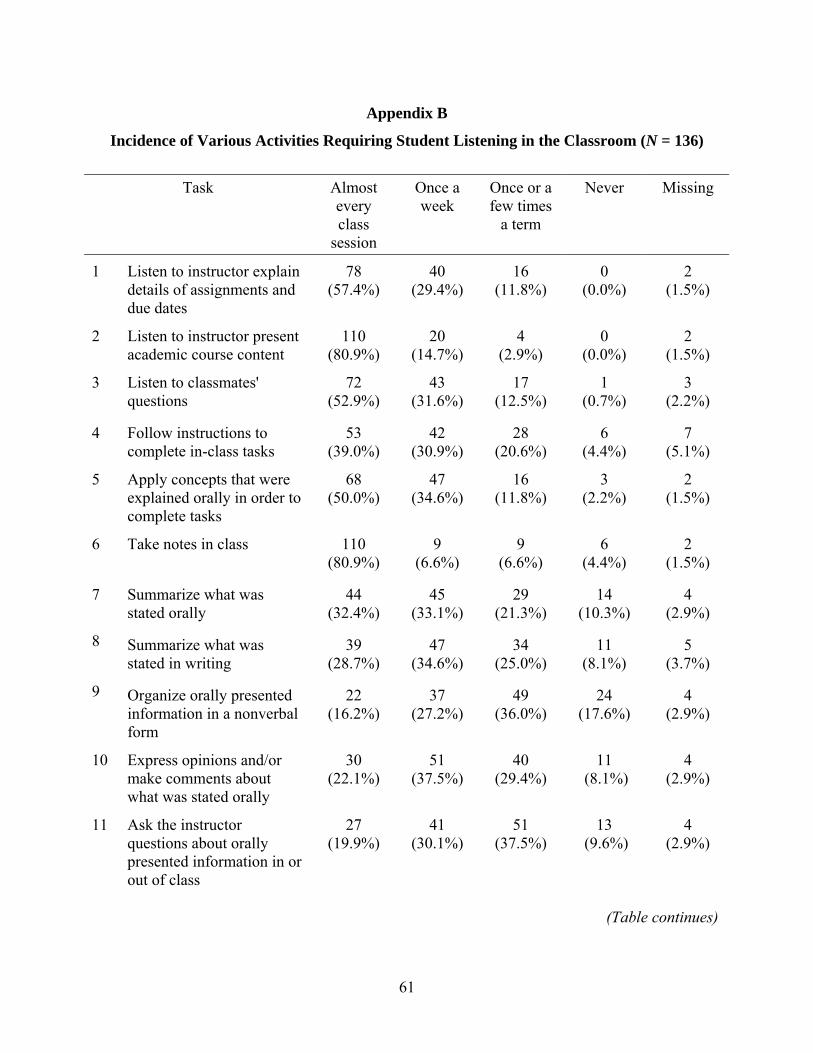
61
Appendix B
Incidence of Various Activities Requiring Student Listening in the Classroom (N = 136)
Task Almost every class
session
Once a week
Once or a few times
a term
Never Missing
1 Listen to instructor explain details of assignments and due dates
78 (57.4%)
40 (29.4%)
16 (11.8%)
0 (0.0%)
2 (1.5%)
2 Listen to instructor present academic course content
110 (80.9%)
20 (14.7%)
4 (2.9%)
0 (0.0%)
2 (1.5%)
3 Listen to classmates' questions
72 (52.9%)
43 (31.6%)
17 (12.5%)
1 (0.7%)
3 (2.2%)
4 Follow instructions to complete in-class tasks
53 (39.0%)
42 (30.9%)
28 (20.6%)
6 (4.4%)
7 (5.1%)
5 Apply concepts that were explained orally in order to complete tasks
68 (50.0%)
47 (34.6%)
16 (11.8%)
3 (2.2%)
2 (1.5%)
6 Take notes in class 110 (80.9%)
9 (6.6%)
9 (6.6%)
6 (4.4%)
2 (1.5%)
7 Summarize what was stated orally
44 (32.4%)
45 (33.1%)
29 (21.3%)
14 (10.3%)
4 (2.9%)
8 Summarize what was stated in writing
39 (28.7%)
47 (34.6%)
34 (25.0%)
11 (8.1%)
5 (3.7%)
9 Organize orally presented information in a nonverbal form
22 (16.2%)
37 (27.2%)
49 (36.0%)
24 (17.6%)
4 (2.9%)
10 Express opinions and/or make comments about what was stated orally
30 (22.1%)
51 (37.5%)
40 (29.4%)
11 (8.1%)
4 (2.9%)
11 Ask the instructor questions about orally presented information in or out of class
27 (19.9%)
41 (30.1%)
51 (37.5%)
13 (9.6%)
4 (2.9%)
(Table continues)
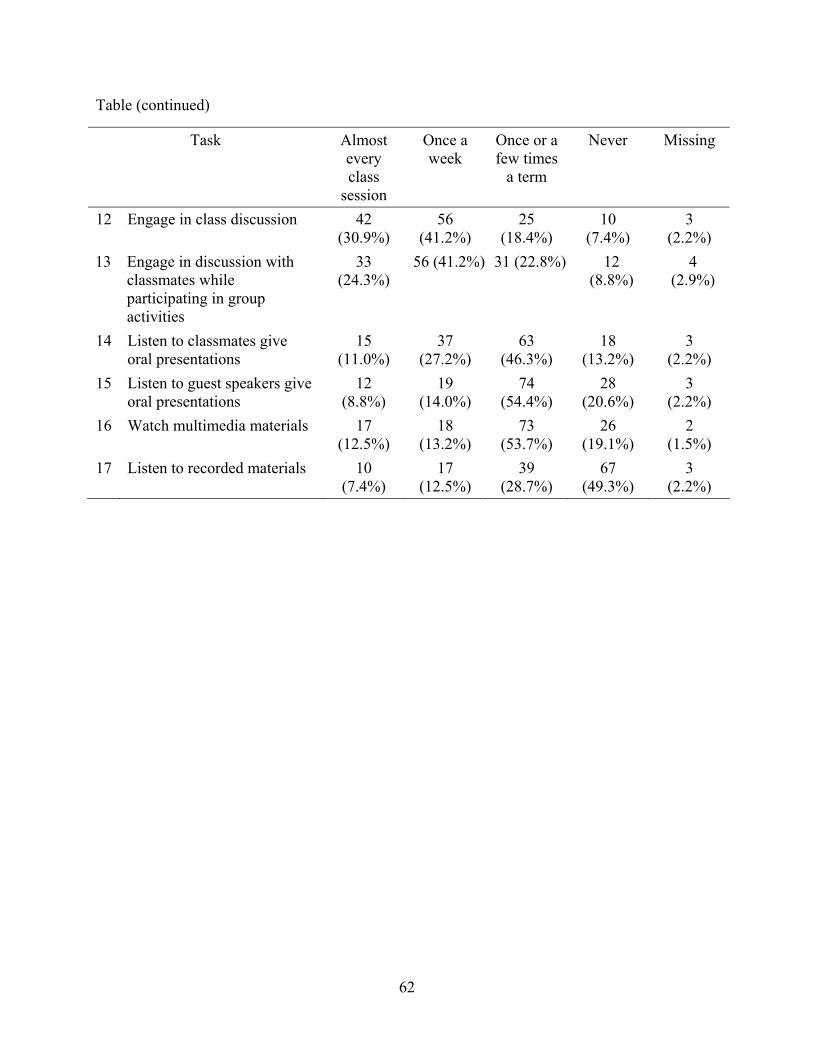
62
Table (continued)
Task Almost every class
session
Once a week
Once or a few times
a term
Never Missing
12 Engage in class discussion 42 (30.9%)
56 (41.2%)
25 (18.4%)
10 (7.4%)
3 (2.2%)
13 Engage in discussion with classmates while participating in group activities
33 (24.3%)
56 (41.2%) 31 (22.8%) 12 (8.8%)
4 (2.9%)
14 Listen to classmates give oral presentations
15 (11.0%)
37 (27.2%)
63 (46.3%)
18 (13.2%)
3 (2.2%)
15 Listen to guest speakers give oral presentations
12 (8.8%)
19 (14.0%)
74 (54.4%)
28 (20.6%)
3 (2.2%)
16 Watch multimedia materials 17 (12.5%)
18 (13.2%)
73 (53.7%)
26 (19.1%)
2 (1.5%)
17 Listen to recorded materials 10 (7.4%)
17 (12.5%)
39 (28.7%)
67 (49.3%)
3 (2.2%)
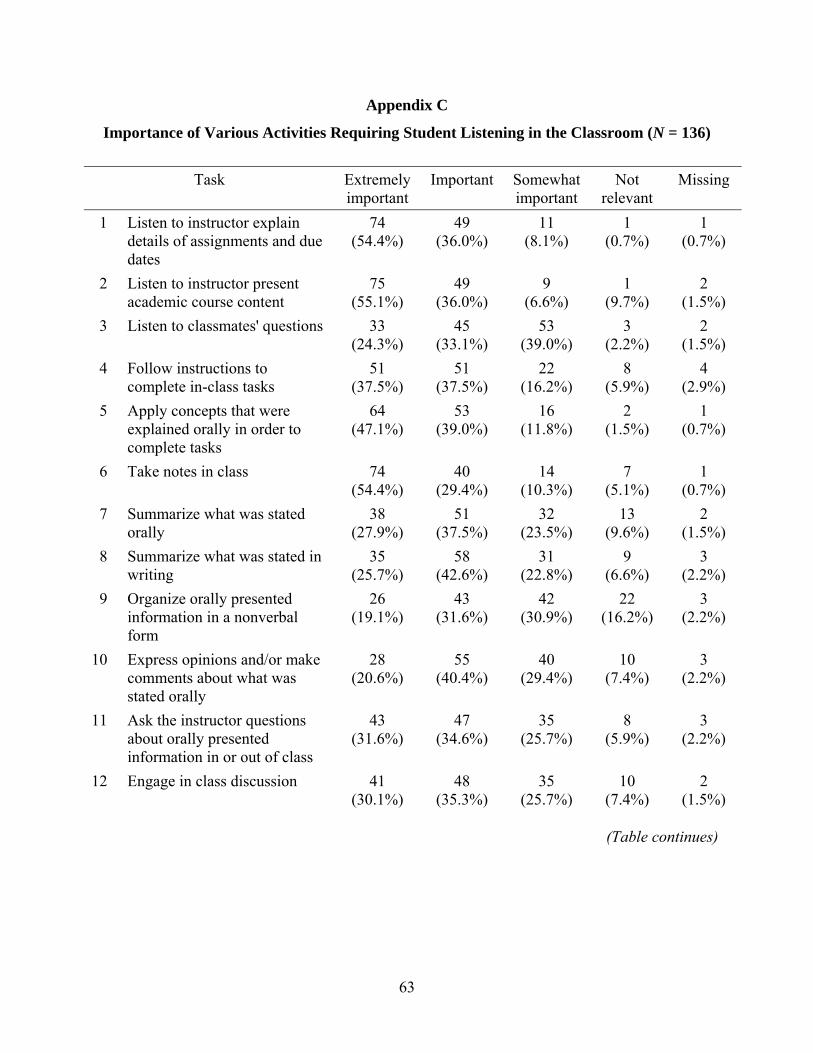
63
Appendix C
Importance of Various Activities Requiring Student Listening in the Classroom (N = 136)
Task Extremely important
Important Somewhat important
Not relevant
Missing
1 Listen to instructor explain details of assignments and due dates
74 (54.4%)
49 (36.0%)
11 (8.1%)
1 (0.7%)
1 (0.7%)
2 Listen to instructor present academic course content
75 (55.1%)
49 (36.0%)
9 (6.6%)
1 (9.7%)
2 (1.5%)
3 Listen to classmates' questions 33 (24.3%)
45 (33.1%)
53 (39.0%)
3 (2.2%)
2 (1.5%)
4 Follow instructions to complete in-class tasks
51 (37.5%)
51 (37.5%)
22 (16.2%)
8 (5.9%)
4 (2.9%)
5 Apply concepts that were explained orally in order to complete tasks
64 (47.1%)
53 (39.0%)
16 (11.8%)
2 (1.5%)
1 (0.7%)
6 Take notes in class 74 (54.4%)
40 (29.4%)
14 (10.3%)
7 (5.1%)
1 (0.7%)
7 Summarize what was stated orally
38 (27.9%)
51 (37.5%)
32 (23.5%)
13 (9.6%)
2 (1.5%)
8 Summarize what was stated in writing
35 (25.7%)
58 (42.6%)
31 (22.8%)
9 (6.6%)
3 (2.2%)
9 Organize orally presented information in a nonverbal form
26 (19.1%)
43 (31.6%)
42 (30.9%)
22 (16.2%)
3 (2.2%)
10 Express opinions and/or make comments about what was stated orally
28 (20.6%)
55 (40.4%)
40 (29.4%)
10 (7.4%)
3 (2.2%)
11 Ask the instructor questions about orally presented information in or out of class
43 (31.6%)
47 (34.6%)
35 (25.7%)
8 (5.9%)
3 (2.2%)
12 Engage in class discussion 41 (30.1%)
48 (35.3%)
35 (25.7%)
10 (7.4%)
2 (1.5%)
(Table continues)
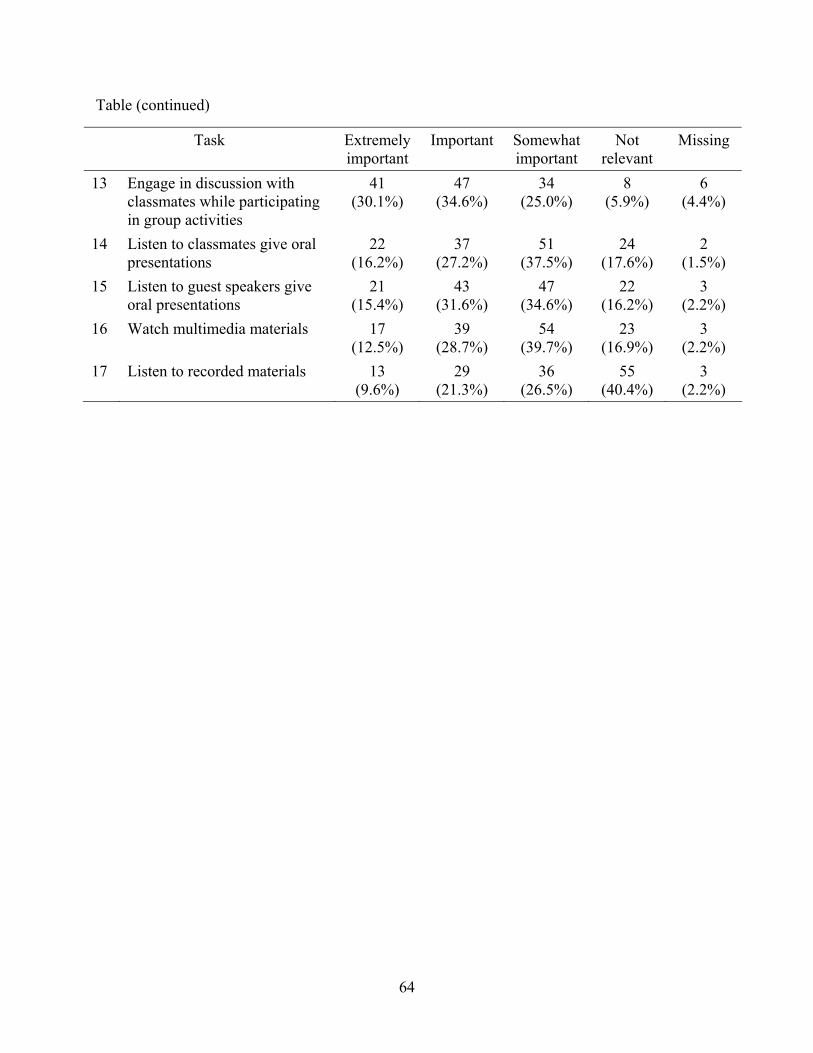
64
Table (continued)
Task Extremely important
Important Somewhat important
Not relevant
Missing
13 Engage in discussion with classmates while participating in group activities
41 (30.1%)
47 (34.6%)
34 (25.0%)
8 (5.9%)
6 (4.4%)
14 Listen to classmates give oral presentations
22 (16.2%)
37 (27.2%)
51 (37.5%)
24 (17.6%)
2 (1.5%)
15 Listen to guest speakers give oral presentations
21 (15.4%)
43 (31.6%)
47 (34.6%)
22 (16.2%)
3 (2.2%)
16 Watch multimedia materials 17 (12.5%)
39 (28.7%)
54 (39.7%)
23 (16.9%)
3 (2.2%)
17 Listen to recorded materials 13 (9.6%)
29 (21.3%)
36 (26.5%)
55 (40.4%)
3 (2.2%)
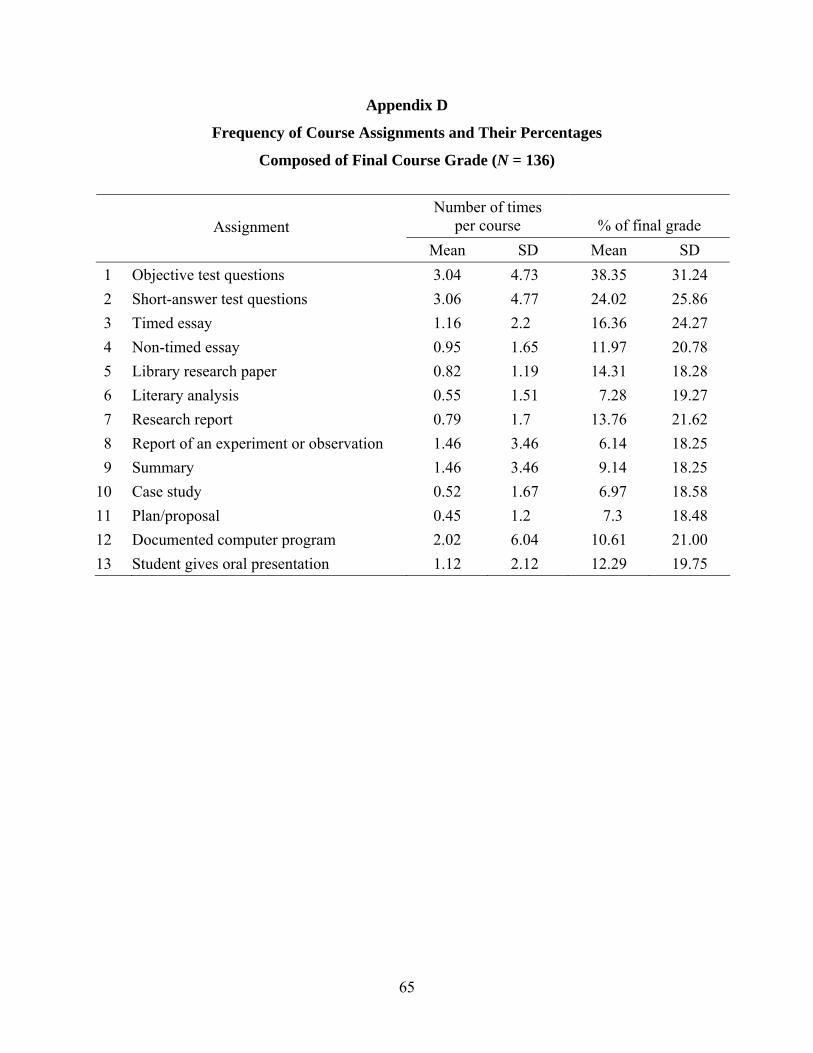
65
Appendix D
Frequency of Course Assignments and Their Percentages
Composed of Final Course Grade (N = 136)
Number of times per course % of final grade Assignment
Mean SD Mean SD 1 Objective test questions 3.04 4.73 38.35 31.24 2 Short-answer test questions 3.06 4.77 24.02 25.86 3 Timed essay 1.16 2.2 16.36 24.27 4 Non-timed essay 0.95 1.65 11.97 20.78 5 Library research paper 0.82 1.19 14.31 18.28 6 Literary analysis 0.55 1.51 7.28 19.27 7 Research report 0.79 1.7 13.76 21.62 8 Report of an experiment or observation 1.46 3.46 6.14 18.25 9 Summary 1.46 3.46 9.14 18.25 10 Case study 0.52 1.67 6.97 18.58 11 Plan/proposal 0.45 1.2 7.3 18.48 12 Documented computer program 2.02 6.04 10.61 21.00 13 Student gives oral presentation 1.12 2.12 12.29 19.75
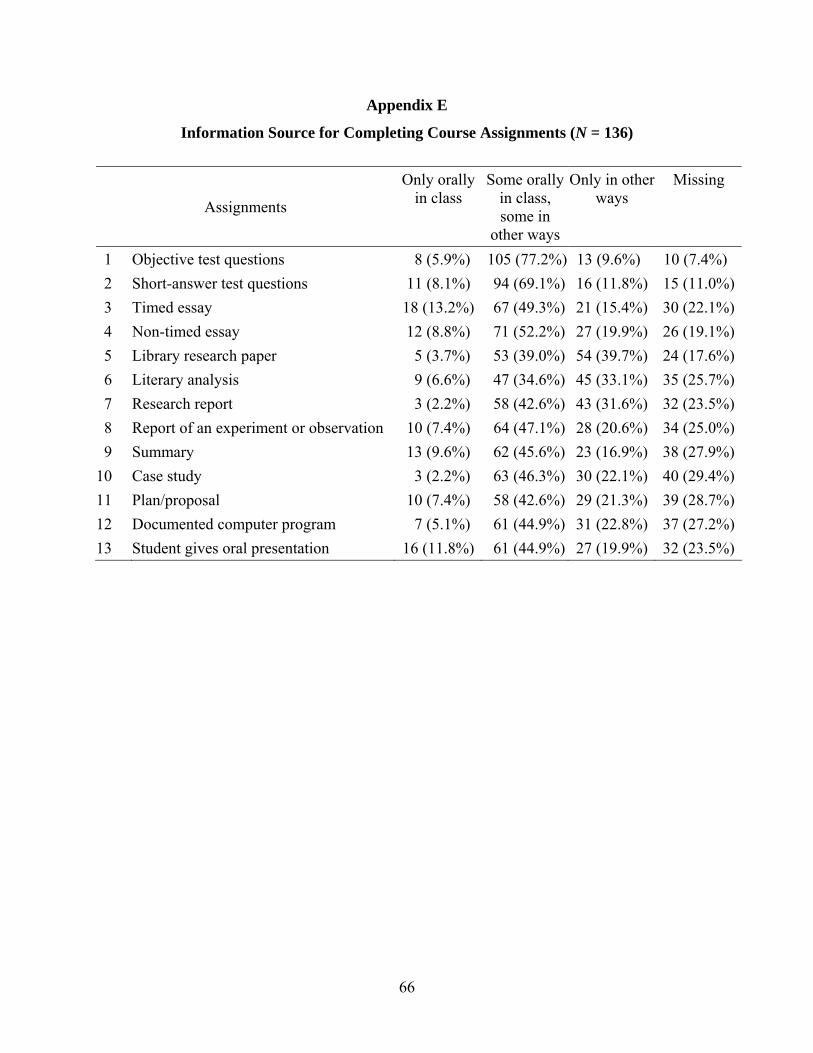
66
Appendix E
Information Source for Completing Course Assignments (N = 136)
Assignments
Only orally in class
Some orally in class, some in
other ways
Only in other ways
Missing
1 Objective test questions 8 (5.9%) 105 (77.2%) 13 (9.6%) 10 (7.4%) 2 Short-answer test questions 11 (8.1%) 94 (69.1%) 16 (11.8%) 15 (11.0%) 3 Timed essay 18 (13.2%) 67 (49.3%) 21 (15.4%) 30 (22.1%) 4 Non-timed essay 12 (8.8%) 71 (52.2%) 27 (19.9%) 26 (19.1%) 5 Library research paper 5 (3.7%) 53 (39.0%) 54 (39.7%) 24 (17.6%) 6 Literary analysis 9 (6.6%) 47 (34.6%) 45 (33.1%) 35 (25.7%) 7 Research report 3 (2.2%) 58 (42.6%) 43 (31.6%) 32 (23.5%) 8 Report of an experiment or observation 10 (7.4%) 64 (47.1%) 28 (20.6%) 34 (25.0%) 9 Summary 13 (9.6%) 62 (45.6%) 23 (16.9%) 38 (27.9%)10 Case study 3 (2.2%) 63 (46.3%) 30 (22.1%) 40 (29.4%)11 Plan/proposal 10 (7.4%) 58 (42.6%) 29 (21.3%) 39 (28.7%)12 Documented computer program 7 (5.1%) 61 (44.9%) 31 (22.8%) 37 (27.2%)13 Student gives oral presentation 16 (11.8%) 61 (44.9%) 27 (19.9%) 32 (23.5%)
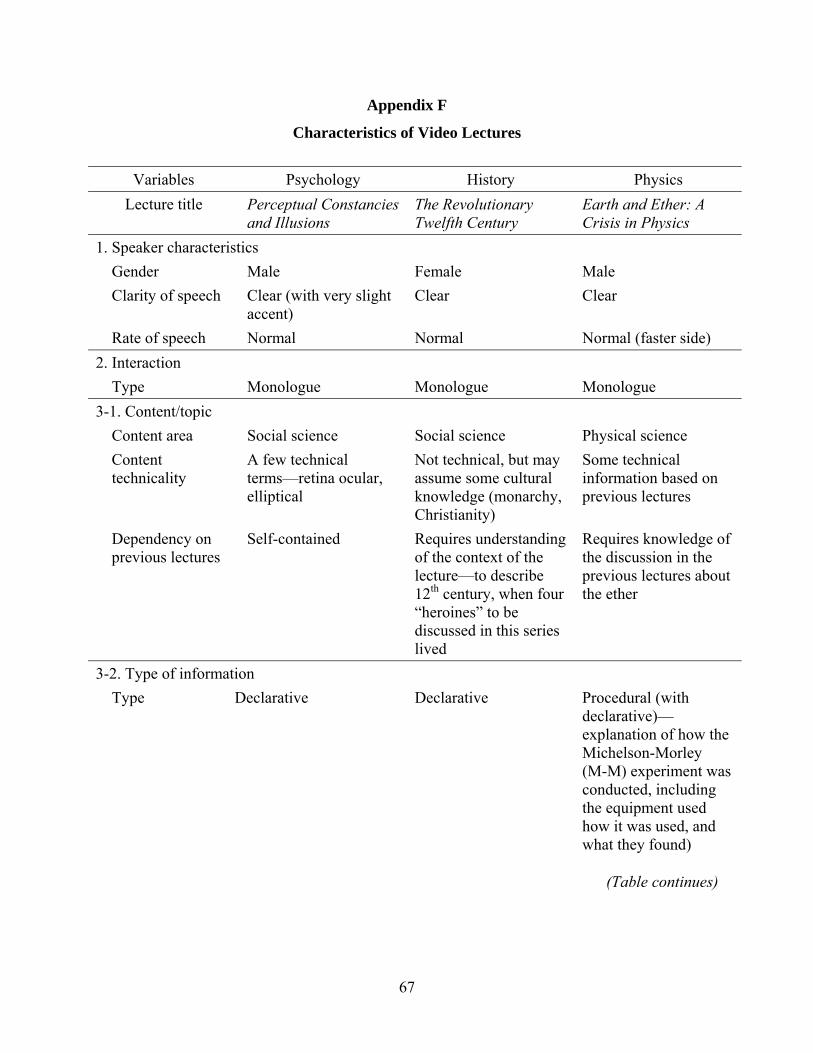
67
Appendix F
Characteristics of Video Lectures
Variables Psychology History Physics Lecture title Perceptual Constancies
and Illusions The Revolutionary Twelfth Century
Earth and Ether: A Crisis in Physics
1. Speaker characteristics Gender Male Female Male Clarity of speech Clear (with very slight
accent) Clear Clear
Rate of speech Normal Normal Normal (faster side) 2. Interaction Type Monologue Monologue Monologue 3-1. Content/topic Content area Social science Social science Physical science Content technicality
A few technical terms—retina ocular, elliptical
Not technical, but may assume some cultural knowledge (monarchy, Christianity)
Some technical information based on previous lectures
Dependency on previous lectures
Self-contained Requires understanding of the context of the lecture—to describe 12th century, when four “heroines” to be discussed in this series lived
Requires knowledge of the discussion in the previous lectures about the ether
3-2. Type of information Type Declarative Declarative Procedural (with
declarative)—explanation of how the Michelson-Morley (M-M) experiment was conducted, including the equipment used how it was used, and what they found)
(Table continues)
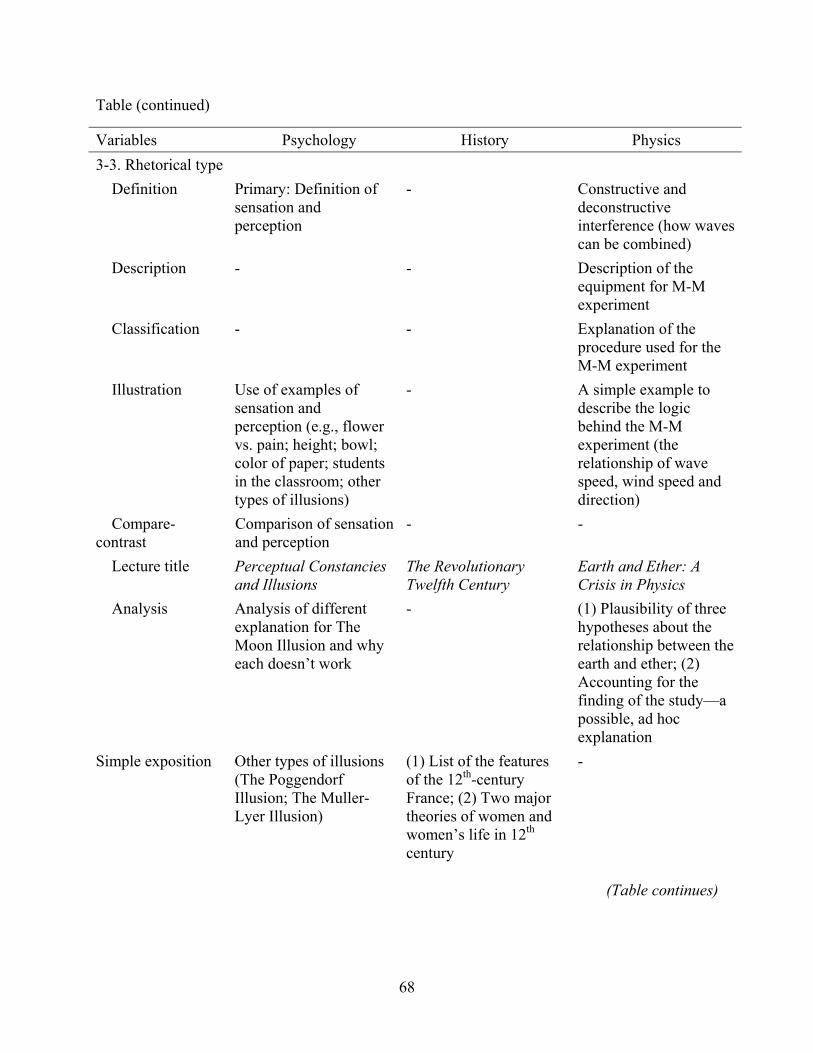
68
Table (continued)
Variables Psychology History Physics 3-3. Rhetorical type Definition Primary: Definition of
sensation and perception
- Constructive and deconstructive interference (how waves can be combined)
Description - - Description of the equipment for M-M experiment
Classification - - Explanation of the procedure used for the M-M experiment
Illustration Use of examples of sensation and perception (e.g., flower vs. pain; height; bowl; color of paper; students in the classroom; other types of illusions)
- A simple example to describe the logic behind the M-M experiment (the relationship of wave speed, wind speed and direction)
Compare-contrast
Comparison of sensation and perception
- -
Lecture title Perceptual Constancies and Illusions
The Revolutionary Twelfth Century
Earth and Ether: A Crisis in Physics
Analysis Analysis of different explanation for The Moon Illusion and why each doesn’t work
- (1) Plausibility of three hypotheses about the relationship between the earth and ether; (2) Accounting for the finding of the study—a possible, ad hoc explanation
Simple exposition Other types of illusions (The Poggendorf Illusion; The Muller-Lyer Illusion)
(1) List of the features of the 12th-century France; (2) Two major theories of women and women’s life in 12th century
-
(Table continues)
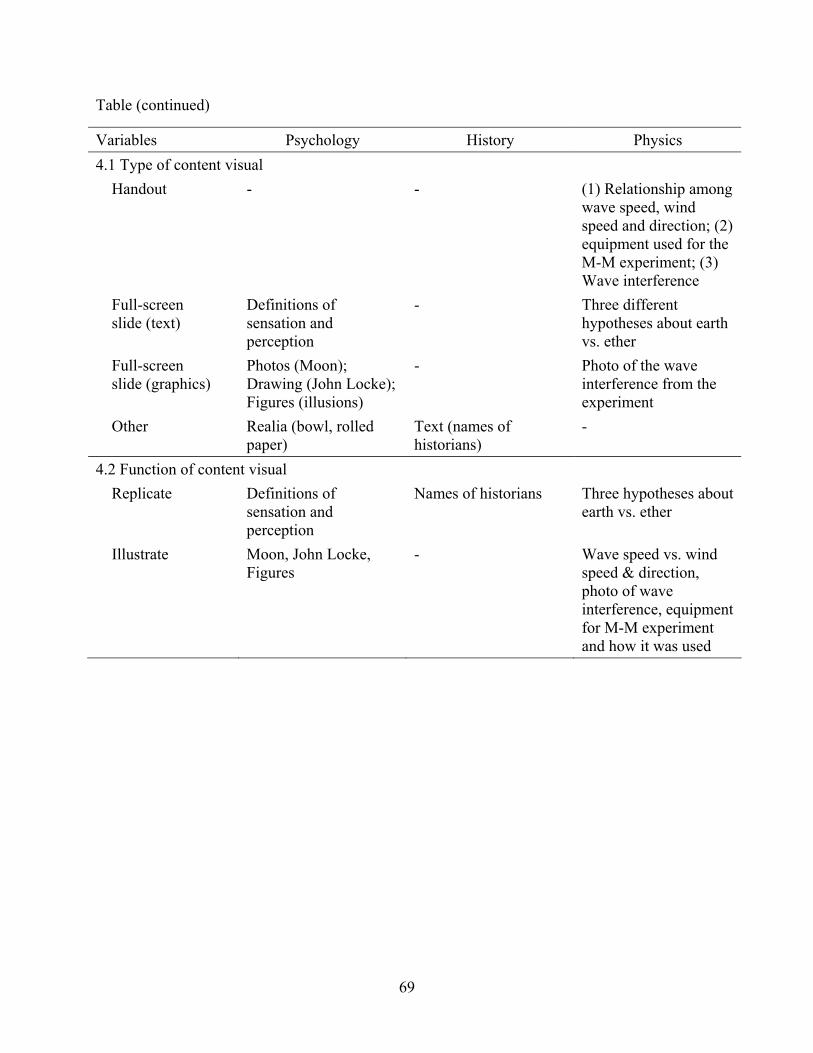
69
Table (continued)
Variables Psychology History Physics 4.1 Type of content visual Handout - - (1) Relationship among
wave speed, wind speed and direction; (2) equipment used for the M-M experiment; (3) Wave interference
Full-screen slide (text)
Definitions of sensation and perception
- Three different hypotheses about earth vs. ether
Full-screen slide (graphics)
Photos (Moon); Drawing (John Locke); Figures (illusions)
- Photo of the wave interference from the experiment
Other Realia (bowl, rolled paper)
Text (names of historians)
-
4.2 Function of content visual Replicate Definitions of
sensation and perception
Names of historians Three hypotheses about earth vs. ether
Illustrate Moon, John Locke, Figures
- Wave speed vs. wind speed & direction, photo of wave interference, equipment for M-M experiment and how it was used
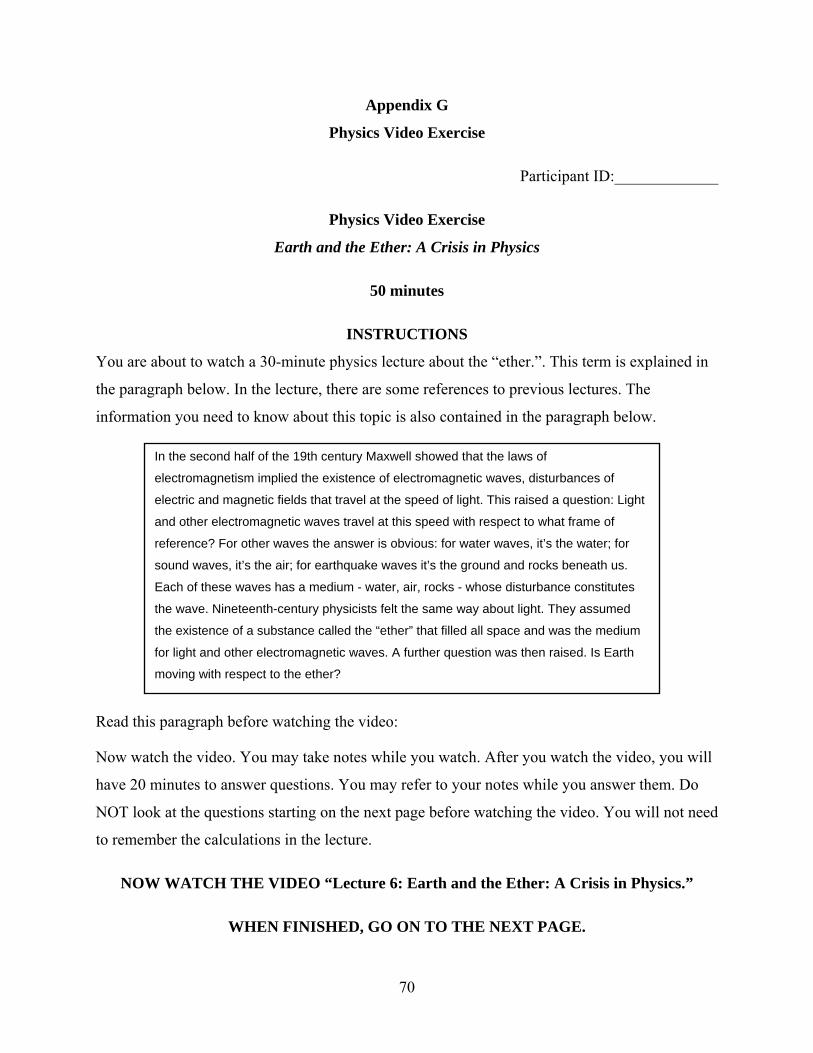
70
Appendix G
Physics Video Exercise
Participant ID:_____________
Physics Video Exercise
Earth and the Ether: A Crisis in Physics
50 minutes
INSTRUCTIONS
You are about to watch a 30-minute physics lecture about the “ether.”. This term is explained in
the paragraph below. In the lecture, there are some references to previous lectures. The
information you need to know about this topic is also contained in the paragraph below.
Read this paragraph before watching the video:
Now watch the video. You may take notes while you watch. After you watch the video, you will
have 20 minutes to answer questions. You may refer to your notes while you answer them. Do
NOT look at the questions starting on the next page before watching the video. You will not need
to remember the calculations in the lecture.
NOW WATCH THE VIDEO “Lecture 6: Earth and the Ether: A Crisis in Physics.”
WHEN FINISHED, GO ON TO THE NEXT PAGE.
In the second half of the 19th century Maxwell showed that the laws of
electromagnetism implied the existence of electromagnetic waves, disturbances of
electric and magnetic fields that travel at the speed of light. This raised a question: Light
and other electromagnetic waves travel at this speed with respect to what frame of
reference? For other waves the answer is obvious: for water waves, it’s the water; for
sound waves, it’s the air; for earthquake waves it’s the ground and rocks beneath us.
Each of these waves has a medium - water, air, rocks - whose disturbance constitutes
the wave. Nineteenth-century physicists felt the same way about light. They assumed
the existence of a substance called the “ether” that filled all space and was the medium
for light and other electromagnetic waves. A further question was then raised. Is Earth
moving with respect to the ether?
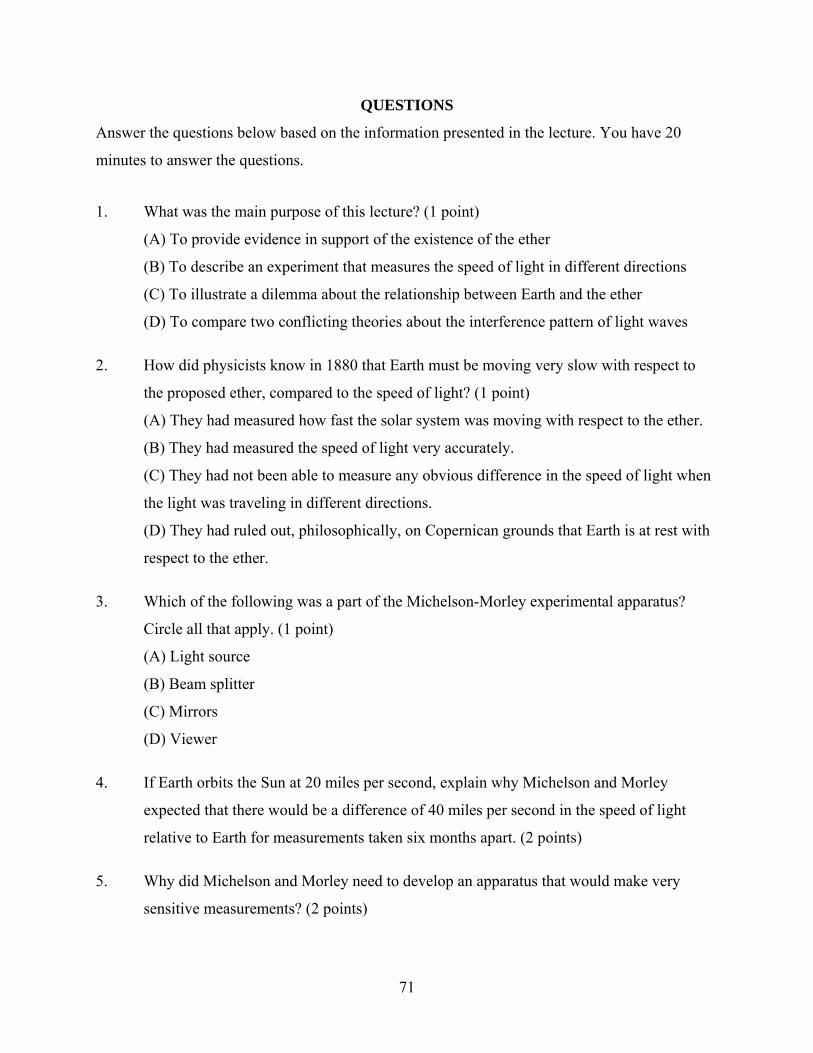
71
QUESTIONS
Answer the questions below based on the information presented in the lecture. You have 20
minutes to answer the questions.
1. What was the main purpose of this lecture? (1 point)
(A) To provide evidence in support of the existence of the ether
(B) To describe an experiment that measures the speed of light in different directions
(C) To illustrate a dilemma about the relationship between Earth and the ether
(D) To compare two conflicting theories about the interference pattern of light waves
2. How did physicists know in 1880 that Earth must be moving very slow with respect to
the proposed ether, compared to the speed of light? (1 point)
(A) They had measured how fast the solar system was moving with respect to the ether.
(B) They had measured the speed of light very accurately.
(C) They had not been able to measure any obvious difference in the speed of light when
the light was traveling in different directions.
(D) They had ruled out, philosophically, on Copernican grounds that Earth is at rest with
respect to the ether.
3. Which of the following was a part of the Michelson-Morley experimental apparatus?
Circle all that apply. (1 point)
(A) Light source
(B) Beam splitter
(C) Mirrors
(D) Viewer
4. If Earth orbits the Sun at 20 miles per second, explain why Michelson and Morley
expected that there would be a difference of 40 miles per second in the speed of light
relative to Earth for measurements taken six months apart. (2 points)
5. Why did Michelson and Morley need to develop an apparatus that would make very
sensitive measurements? (2 points)
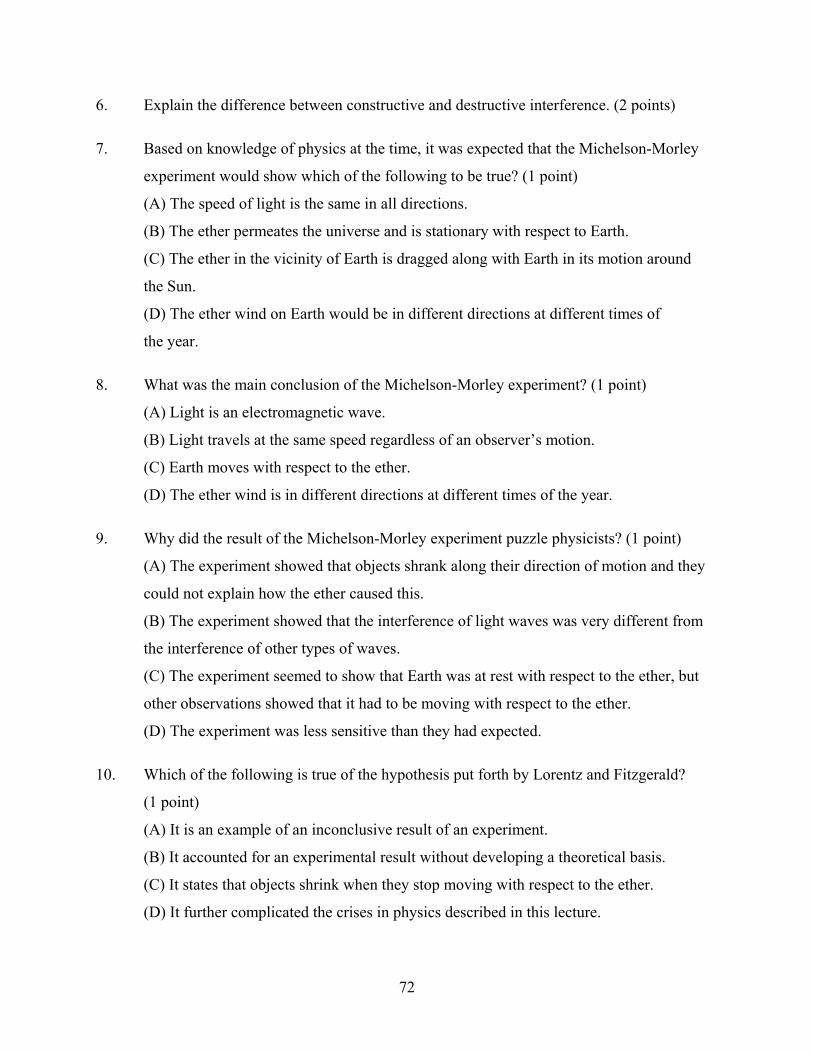
72
6. Explain the difference between constructive and destructive interference. (2 points)
7. Based on knowledge of physics at the time, it was expected that the Michelson-Morley
experiment would show which of the following to be true? (1 point)
(A) The speed of light is the same in all directions.
(B) The ether permeates the universe and is stationary with respect to Earth.
(C) The ether in the vicinity of Earth is dragged along with Earth in its motion around
the Sun.
(D) The ether wind on Earth would be in different directions at different times of
the year.
8. What was the main conclusion of the Michelson-Morley experiment? (1 point)
(A) Light is an electromagnetic wave.
(B) Light travels at the same speed regardless of an observer’s motion.
(C) Earth moves with respect to the ether.
(D) The ether wind is in different directions at different times of the year.
9. Why did the result of the Michelson-Morley experiment puzzle physicists? (1 point)
(A) The experiment showed that objects shrank along their direction of motion and they
could not explain how the ether caused this.
(B) The experiment showed that the interference of light waves was very different from
the interference of other types of waves.
(C) The experiment seemed to show that Earth was at rest with respect to the ether, but
other observations showed that it had to be moving with respect to the ether.
(D) The experiment was less sensitive than they had expected.
10. Which of the following is true of the hypothesis put forth by Lorentz and Fitzgerald?
(1 point)
(A) It is an example of an inconclusive result of an experiment.
(B) It accounted for an experimental result without developing a theoretical basis.
(C) It states that objects shrink when they stop moving with respect to the ether.
(D) It further complicated the crises in physics described in this lecture.
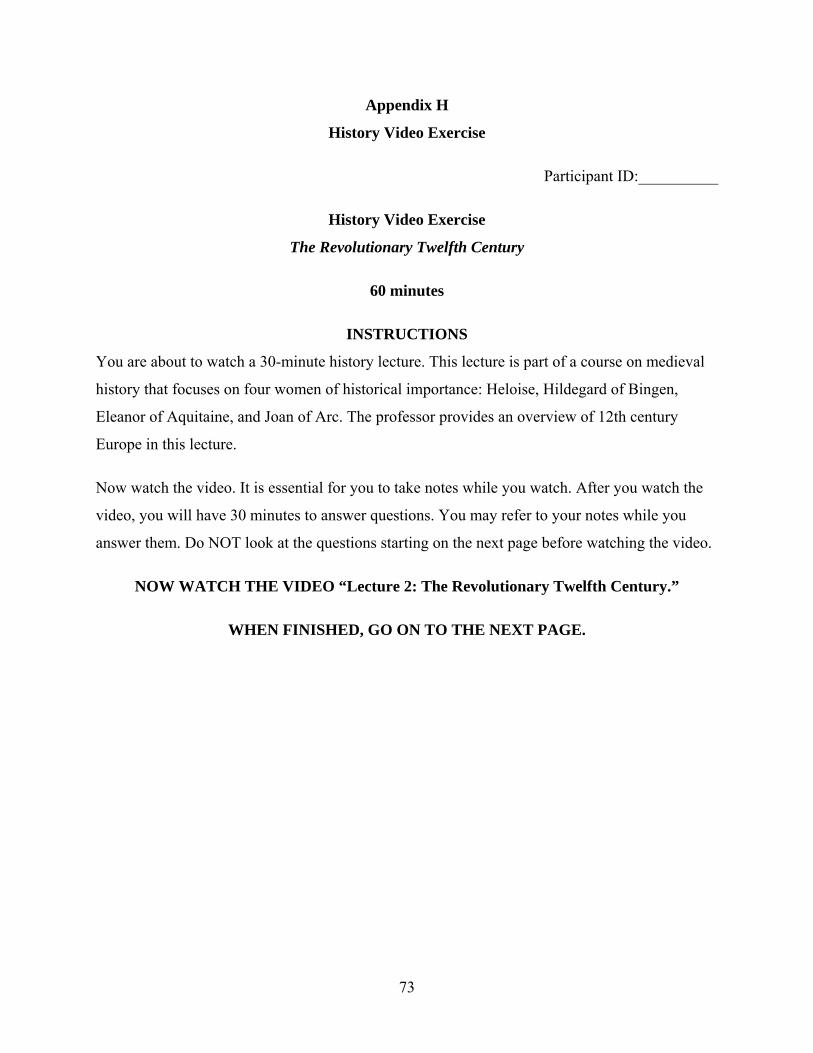
73
Appendix H
History Video Exercise
Participant ID:__________
History Video Exercise
The Revolutionary Twelfth Century
60 minutes
INSTRUCTIONS
You are about to watch a 30-minute history lecture. This lecture is part of a course on medieval
history that focuses on four women of historical importance: Heloise, Hildegard of Bingen,
Eleanor of Aquitaine, and Joan of Arc. The professor provides an overview of 12th century
Europe in this lecture.
Now watch the video. It is essential for you to take notes while you watch. After you watch the
video, you will have 30 minutes to answer questions. You may refer to your notes while you
answer them. Do NOT look at the questions starting on the next page before watching the video.
NOW WATCH THE VIDEO “Lecture 2: The Revolutionary Twelfth Century.”
WHEN FINISHED, GO ON TO THE NEXT PAGE.
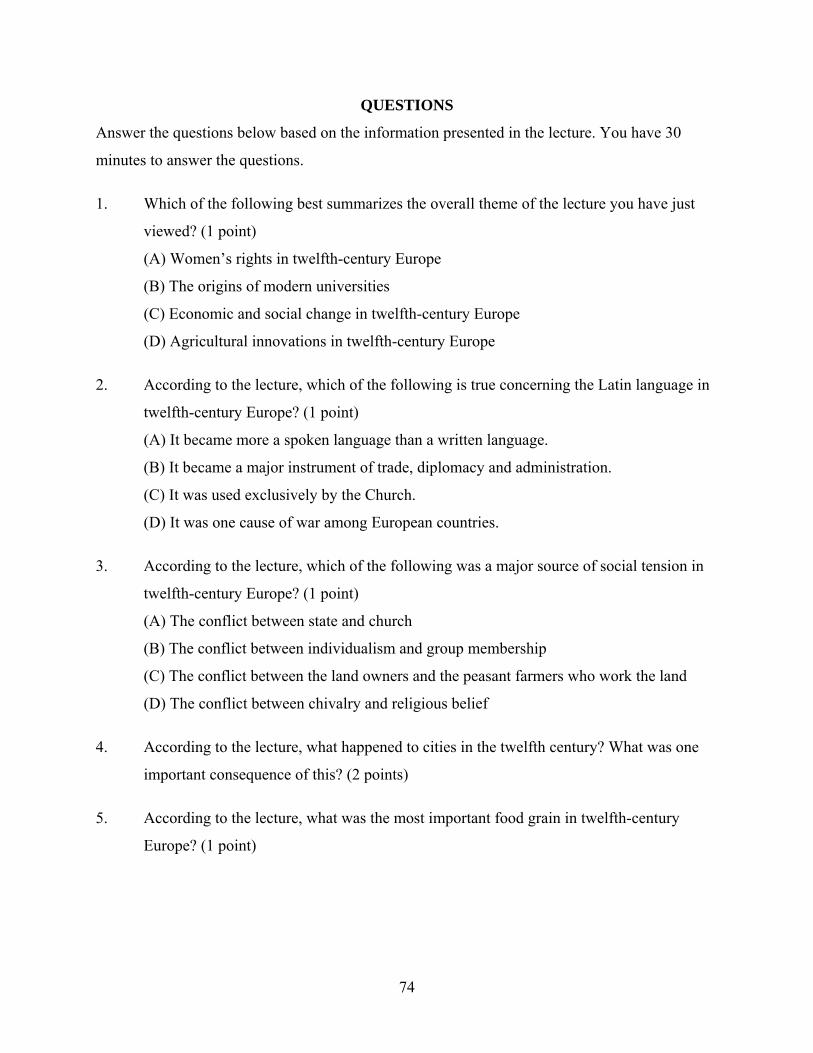
74
QUESTIONS
Answer the questions below based on the information presented in the lecture. You have 30
minutes to answer the questions.
1. Which of the following best summarizes the overall theme of the lecture you have just
viewed? (1 point)
(A) Women’s rights in twelfth-century Europe
(B) The origins of modern universities
(C) Economic and social change in twelfth-century Europe
(D) Agricultural innovations in twelfth-century Europe
2. According to the lecture, which of the following is true concerning the Latin language in
twelfth-century Europe? (1 point)
(A) It became more a spoken language than a written language.
(B) It became a major instrument of trade, diplomacy and administration.
(C) It was used exclusively by the Church.
(D) It was one cause of war among European countries.
3. According to the lecture, which of the following was a major source of social tension in
twelfth-century Europe? (1 point)
(A) The conflict between state and church
(B) The conflict between individualism and group membership
(C) The conflict between the land owners and the peasant farmers who work the land
(D) The conflict between chivalry and religious belief
4. According to the lecture, what happened to cities in the twelfth century? What was one
important consequence of this? (2 points)
5. According to the lecture, what was the most important food grain in twelfth-century
Europe? (1 point)

75
6. According to the lecture, which type of people were most likely to become members of
the “new administrative class” that was developing in twelfth-century Europe? (1 point)
(A) aristocratic women
(B) returning Crusaders
(C) peasant farmers
(D) younger sons
7. According to the lecture, why did the rise of a “new administrative class” in twelfth-
century Europe lead to social change? (1 point)
(A) Its members tended to have more children than other people
(B) Its members were the only literate members of society
(C) Its members were more likely to be loyal to their patron than to their family group
(D) Its members challenged the religious authority of the Church
8. According to the lecture, the city of Paris was an important cultural center in the twelfth
century for which of the following reasons? (1 point)
(A) The city was the site of a university, a cathedral and a royal court.
(B) The city had the highest literacy rate of any city in Europe.
(C) The city was growing more quickly than most other cities in Europe.
(D) The city produced an unusually high number of women writers.
9. What major change in the lives of men in the Church is discussed in the lecture?
(1 point)
10. What was one important consequence of this change? (1 point)
11. According to the lecture, modern scholars disagree about changes in the status of women
in the twelfth century. Name two points of disagreement among modern scholars on this
issue. (2 points)
76
12. According to the lecture, what was the overall trend of women’s rights in the twelfth
century? Give one specific example that the lecture cites as a part of this trend. (2 points)
Overall trend of women’s rights:
Example:
77
Appendix I
Psychology Video Exercise
Participant ID:___________
Psychology Video Exercise
Perceptual Constancies and Illusions
60 minutes
INSTRUCTIONS
You are about to watch a 30-minute psychology lecture about perception and illusion.
Now watch the video. You may take notes while you watch. After you watch the video, you will
have 30 minutes to answer questions. You may refer to your notes while you answer them. Do
NOT look at the questions starting on the next page before watching the video.
NOW WATCH THE VIDEO
“Lecture 10: Perceptual Cnstancies and Ilusions.”
WHEN FINISHED, GO ON TO THE NEXT PAGE.
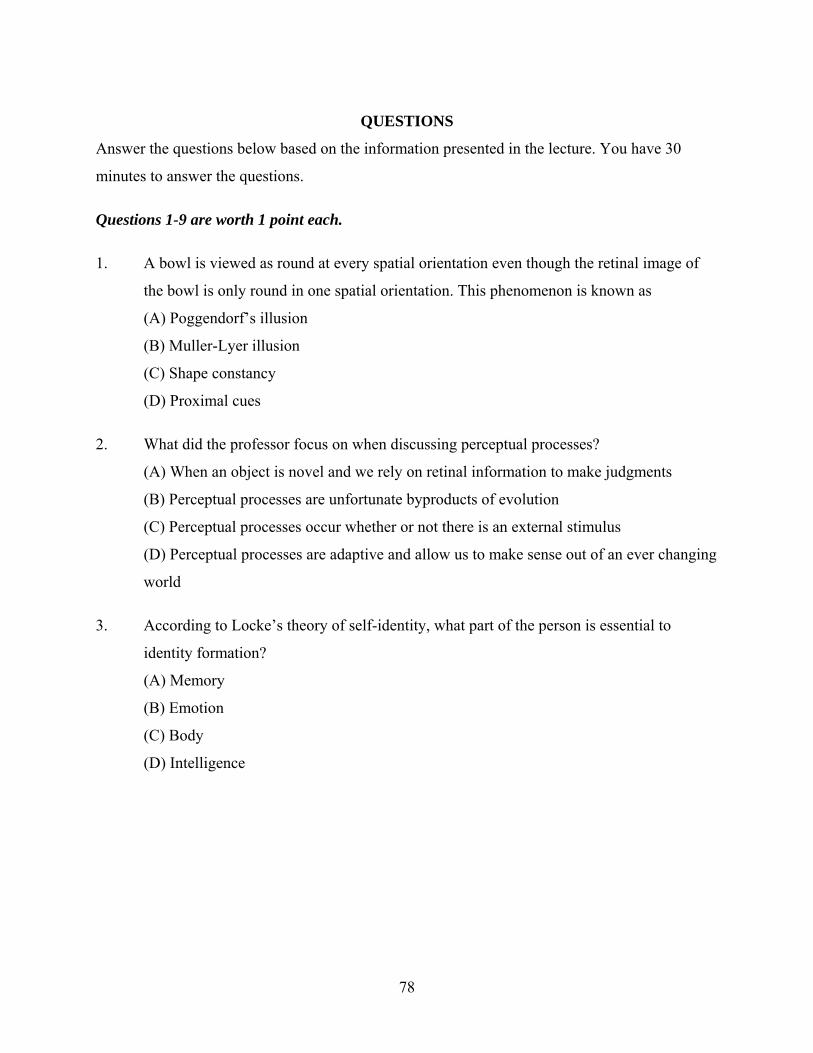
78
QUESTIONS
Answer the questions below based on the information presented in the lecture. You have 30
minutes to answer the questions.
Questions 1-9 are worth 1 point each.
1. A bowl is viewed as round at every spatial orientation even though the retinal image of
the bowl is only round in one spatial orientation. This phenomenon is known as
(A) Poggendorf’s illusion
(B) Muller-Lyer illusion
(C) Shape constancy
(D) Proximal cues
2. What did the professor focus on when discussing perceptual processes?
(A) When an object is novel and we rely on retinal information to make judgments
(B) Perceptual processes are unfortunate byproducts of evolution
(C) Perceptual processes occur whether or not there is an external stimulus
(D) Perceptual processes are adaptive and allow us to make sense out of an ever changing
world
3. According to Locke’s theory of self-identity, what part of the person is essential to
identity formation?
(A) Memory
(B) Emotion
(C) Body
(D) Intelligence
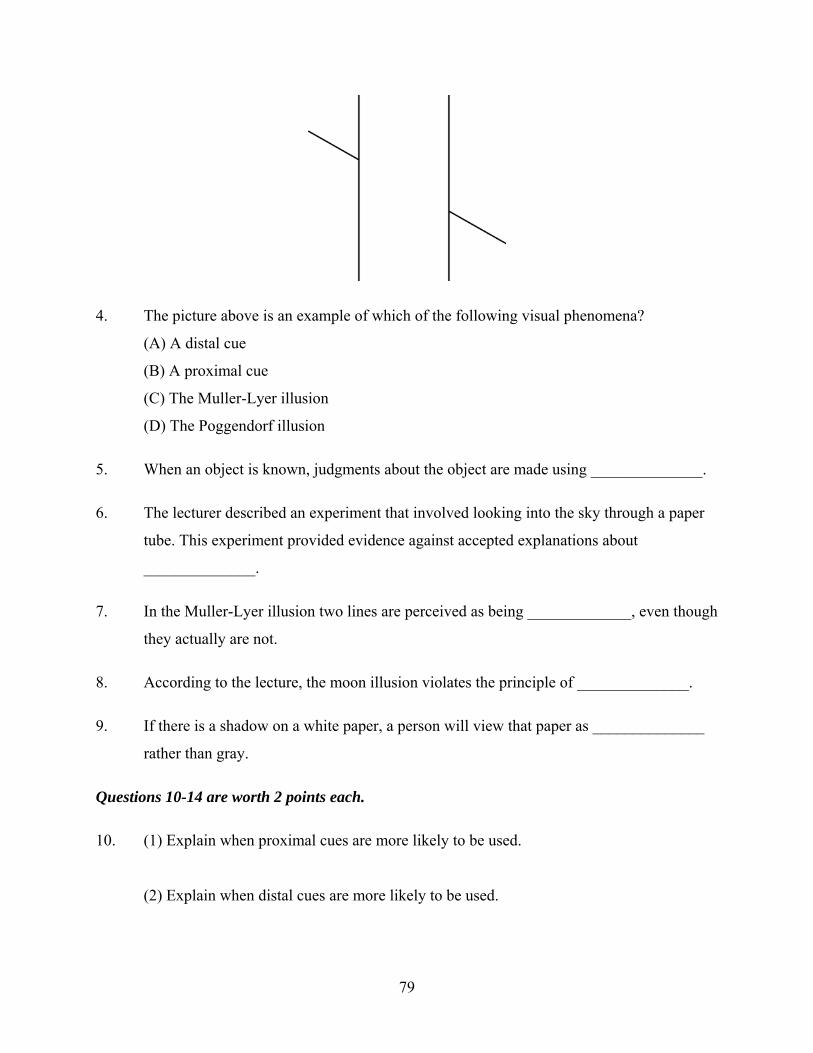
79
4. The picture above is an example of which of the following visual phenomena?
(A) A distal cue
(B) A proximal cue
(C) The Muller-Lyer illusion
(D) The Poggendorf illusion
5. When an object is known, judgments about the object are made using ______________.
6. The lecturer described an experiment that involved looking into the sky through a paper
tube. This experiment provided evidence against accepted explanations about
______________.
7. In the Muller-Lyer illusion two lines are perceived as being _____________, even though
they actually are not.
8. According to the lecture, the moon illusion violates the principle of ______________.
9. If there is a shadow on a white paper, a person will view that paper as ______________
rather than gray.
Questions 10-14 are worth 2 points each.
10. (1) Explain when proximal cues are more likely to be used.
(2) Explain when distal cues are more likely to be used.
80
11. Explain two differences between sensation and perception.
12. Explain why the concept of constancy is adaptive.
13. (1) Define the moon illusion.
(2) Describe one commonly held explanation for this phenomenon.
14. Describe what research has found about the experience of perceptual illusions among
people who live in “an architecturally sparse environment.”
81
Appendix J
Questions on Student Familiarity With Lecture Content
(Sample Taken From the Psychology Video Set)
PLEASE COMPLETE THE QUESTIONS BELOW.
1. How much did you know about the information the lecturer provided in this lecture
before attending today’s session (check one)?
[ ] A. I knew most of the information presented in the lecture.
[ ] B. I knew more than half of the information presented in the lecture.
[ ] C. I knew some, but less than half of the information presented in the lecture.
[ ] D. I knew little about the information presented in the lecture.
If you chose A, B or C above, please answer Questions 2, 3 and 4 below.
If you chose D, skip Questions 2 and 3 and complete Question 4 only.
2. How did you learn about the lecture content that you were familiar with?
(Example: A psychology class that I took in my freshman year covered this topic.) _____________________________________________________
______________________________________________________
3. Were you able to answer any of the questions in this exercise without listening to the
lecture because you were already familiar with the content (check one)?
[ ] Yes
[ ] No
4. If you answered “Yes,” please circle the questions that you were able to answer without
listening to the lecture.
Question 1 Question 2 Question 3 Question 4 Question 5
Question 6 Question 7 Question 8 Question 9 Question 10
Question 11 Question 12 Question 13 Question 14
82
5. How did the amount of notes that you took to complete this listening exercise compare to
the amount of notes that you usually take in a similar lower-division undergraduate or
first-year/introductory graduate class (check one)?
[ ] About the same [ ] Less than usual [ ] More than usual
[ ] Other (please specify): ________________________________
THANK YOU. PLEASE RETURN YOUR BOOKLET TO THE PROCTOR.

To obtain more information about TOEFL programs and services, use one of the following:
Phone: 1-877-863-3546(US, US Territories*, and Canada)
1-609-771-7100(all other locations)
E-mail: [email protected] site: www.ets.org/toefl
*America Samoa, Guam, Puerto Rico, and US Virgin Islands
Test of English as a Foreign LanguagePO Box 6155
Princeton, NJ 08541-6155USA