Embed Size (px)
Citation preview
Critical Design ReviewLeah Crumbaker
Jason FarmerJames Gordon
Matt Lenda
Jeffrey MullenScott TatumTravis SchafhausenKristina Wang
4 December 2008 Critical Design Review
Project CustomerProf. Eric Frew
Project AdvisorsProf. Bill Emery
Prof. Kurt Maute
1
Briefing Overview & Content
Critical Design Review
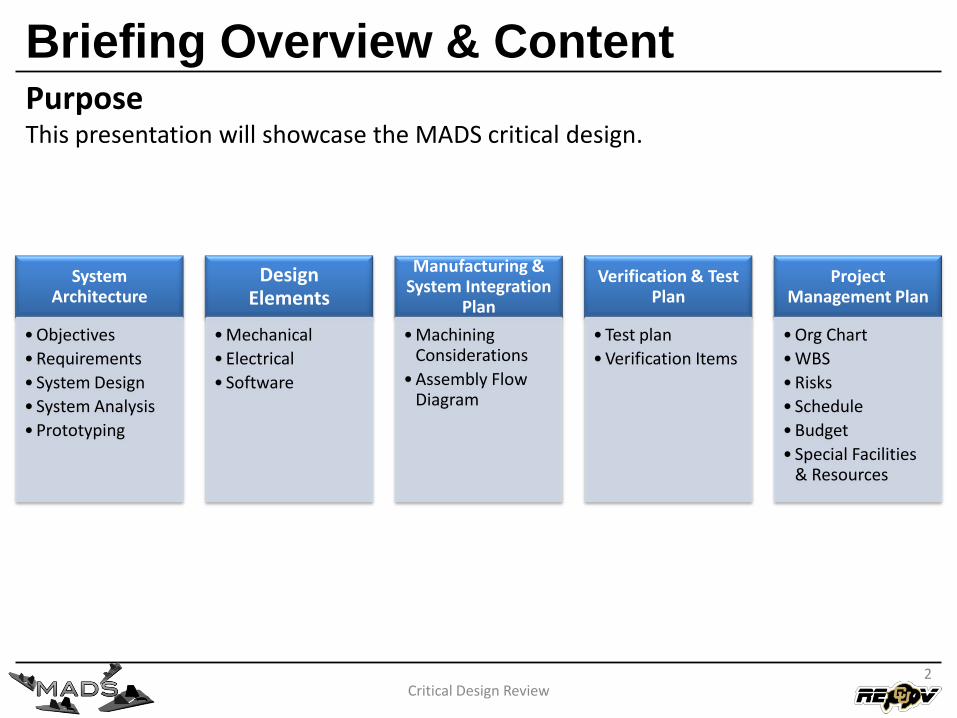
PurposeThis presentation will showcase the MADS critical design.
2
System Architecture
• Objectives
• Requirements
• System Design
• System Analysis
• Prototyping
Design Elements
• Mechanical
• Electrical
• Software
Manufacturing & System Integration
Plan
• Machining Considerations
• Assembly Flow Diagram
Verification & Test Plan
• Test plan
• Verification Items
Project Management Plan
• Org Chart
• WBS
• Risks
• Schedule
• Budget
• Special Facilities & Resources

Critical Design Review3
System Architecture
Design Elements
Manufacturing & System Integration Plan
Verification & Test Plan
Project Management Plan
Overview of Objectives
Critical Design Review
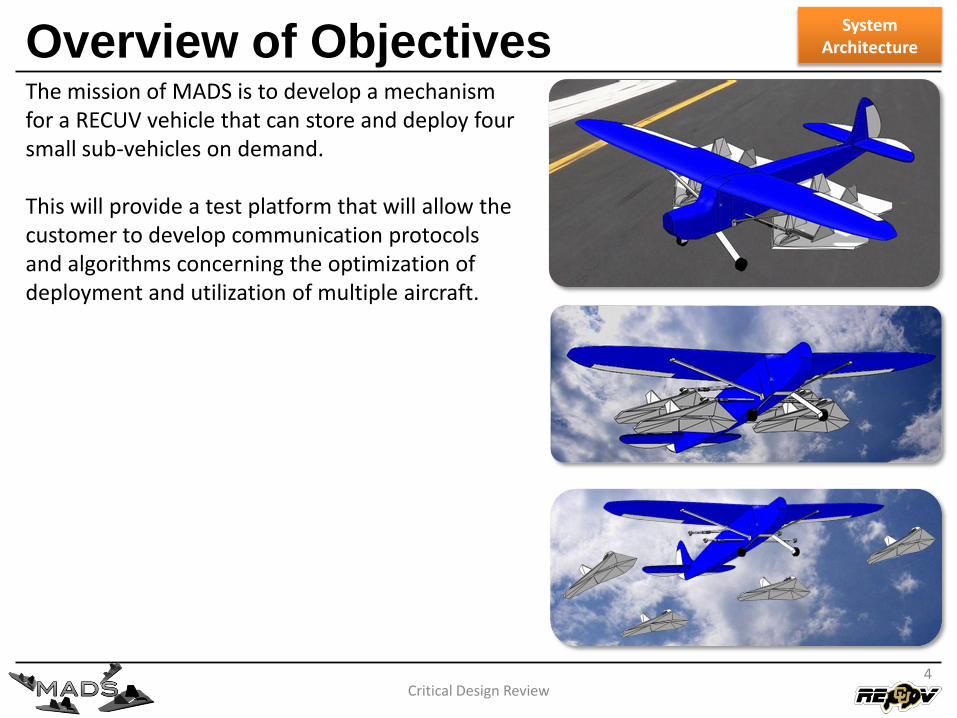
The mission of MADS is to develop a mechanism for a RECUV vehicle that can store and deploy four small sub-vehicles on demand.
This will provide a test platform that will allow the customer to develop communication protocols and algorithms concerning the optimization of deployment and utilization of multiple aircraft.
SystemArchitecture
4
Overview of Requirements
Critical Design Review5
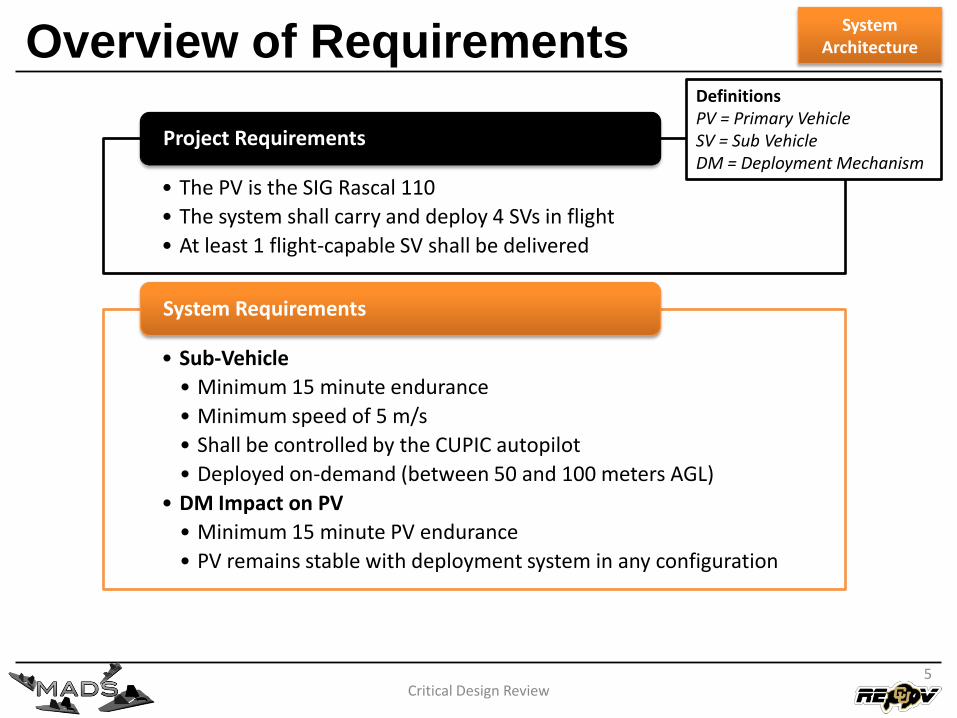
• The PV is the SIG Rascal 110
• The system shall carry and deploy 4 SVs in flight
• At least 1 flight-capable SV shall be delivered
Project Requirements
• Sub-Vehicle
• Minimum 15 minute endurance
• Minimum speed of 5 m/s
• Shall be controlled by the CUPIC autopilot
• Deployed on-demand (between 50 and 100 meters AGL)
• DM Impact on PV
• Minimum 15 minute PV endurance
• PV remains stable with deployment system in any configuration
System Requirements
DefinitionsPV = Primary VehicleSV = Sub VehicleDM = Deployment Mechanism
SystemArchitecture
System Design
Critical Design Review
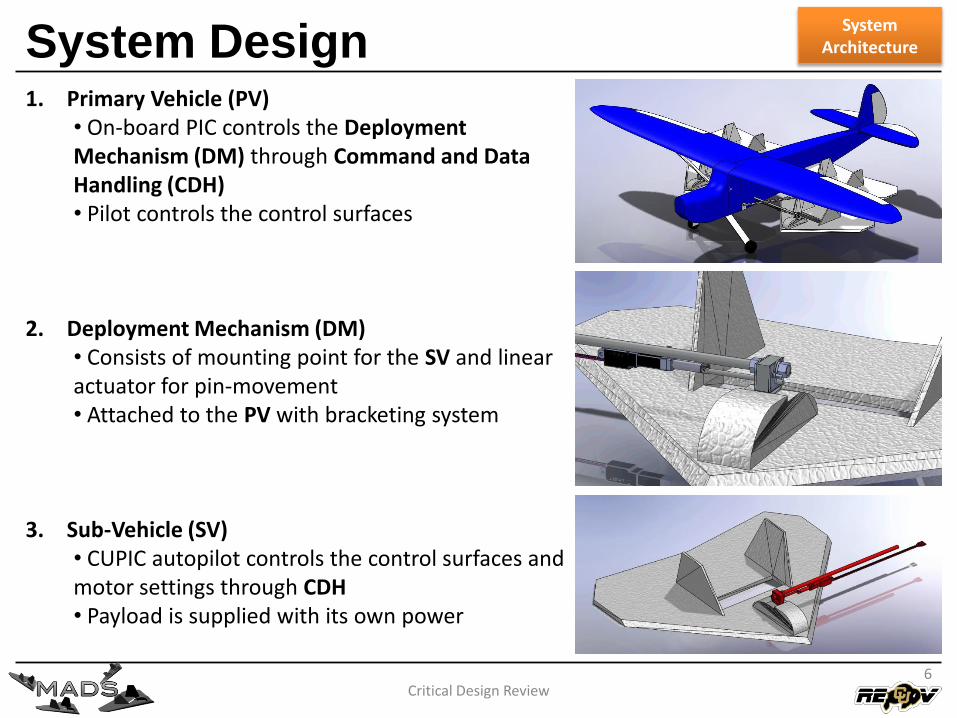
1. Primary Vehicle (PV)• On-board PIC controls the Deployment Mechanism (DM) through Command and Data Handling (CDH) • Pilot controls the control surfaces
2. Deployment Mechanism (DM)• Consists of mounting point for the SV and linear actuator for pin-movement• Attached to the PV with bracketing system
3. Sub-Vehicle (SV)• CUPIC autopilot controls the control surfaces and motor settings through CDH• Payload is supplied with its own power
SystemArchitecture
6
System Flow Diagram
Critical Design Review
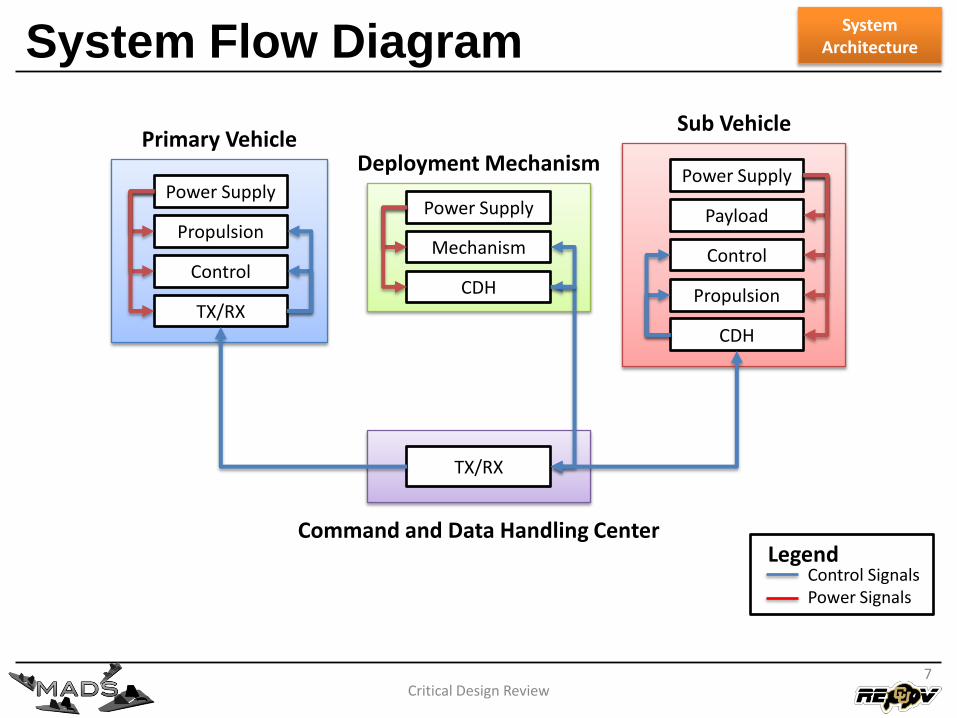
Primary VehicleSub Vehicle
Propulsion
Power Supply
Control
Power Supply
Control
Payload
Mechanism
Power Supply
Deployment Mechanism
CDH
CDHTX/RX
Propulsion
Command and Data Handling Center
TX/RX
Control SignalsPower Signals
Legend
SystemArchitecture
7
System Mass Budget
Critical Design Review8
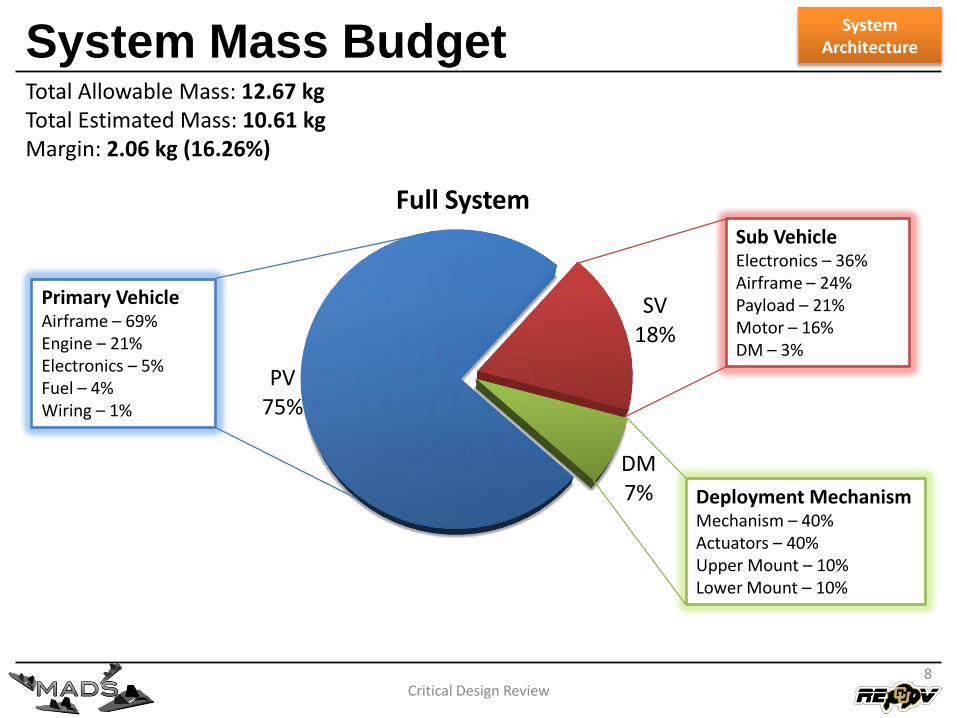
PV75%
SV18%
DM7%
Full System
Total Allowable Mass: 12.67 kgTotal Estimated Mass: 10.61 kgMargin: 2.06 kg (16.26%)
Sub VehicleElectronics – 36%Airframe – 24%Payload – 21%Motor – 16%DM – 3%
Deployment MechanismMechanism – 40%Actuators – 40%Upper Mount – 10%Lower Mount – 10%
Primary VehicleAirframe – 69%Engine – 21%Electronics – 5%Fuel – 4%Wiring – 1%
SystemArchitecture
SV Analysis
Critical Design Review
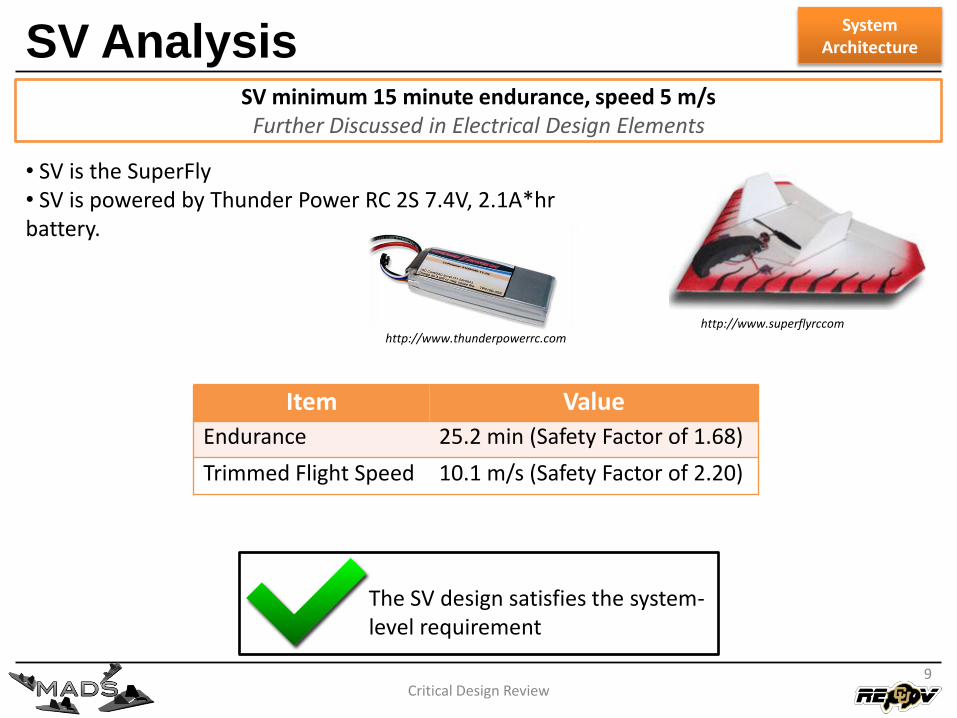
SV minimum 15 minute endurance, speed 5 m/sFurther Discussed in Electrical Design Elements
9
Item Value
Endurance 25.2 min (Safety Factor of 1.68)
Trimmed Flight Speed 10.1 m/s (Safety Factor of 2.20)
The SV design satisfies the system-level requirement
• SV is the SuperFly• SV is powered by Thunder Power RC 2S 7.4V, 2.1A*hr battery.
http://www.thunderpowerrc.com
SystemArchitecture
http://www.superflyrccom
SV & DM Analysis
Critical Design Review
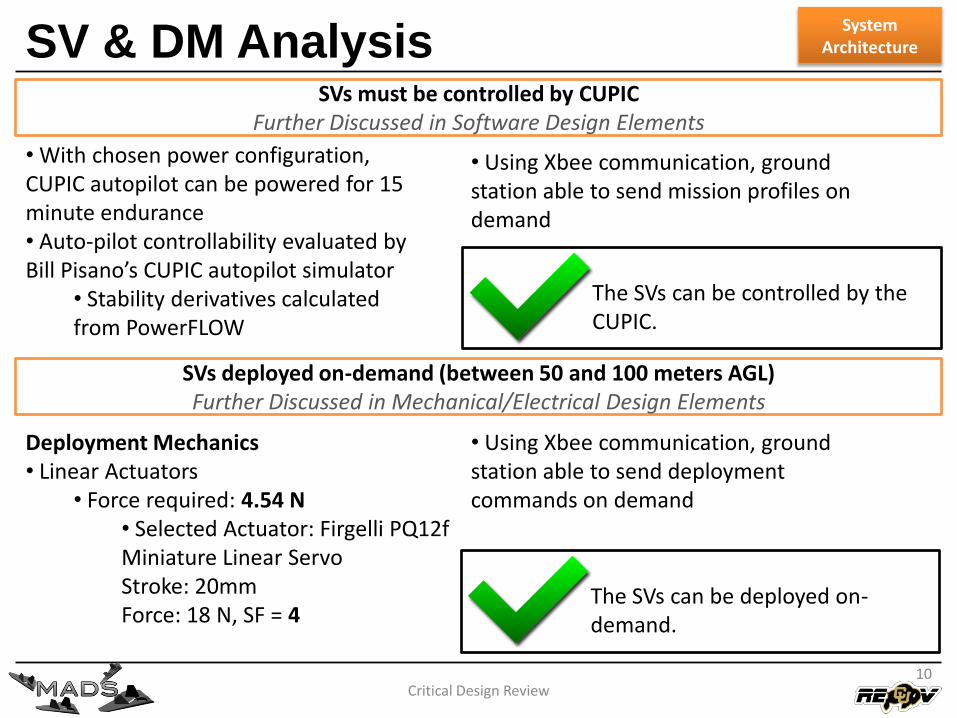
SVs must be controlled by CUPICFurther Discussed in Software Design Elements
10
The SVs can be controlled by the CUPIC.
• With chosen power configuration, CUPIC autopilot can be powered for 15 minute endurance• Auto-pilot controllability evaluated by Bill Pisano’s CUPIC autopilot simulator
• Stability derivatives calculated from PowerFLOW
SystemArchitecture
Deployment Mechanics• Linear Actuators
• Force required: 4.54 N• Selected Actuator: Firgelli PQ12f Miniature Linear ServoStroke: 20mmForce: 18 N, SF = 4
SVs deployed on-demand (between 50 and 100 meters AGL)Further Discussed in Mechanical/Electrical Design Elements
The SVs can be deployed on-demand.
• Using Xbee communication, ground station able to send mission profiles on demand
• Using Xbee communication, ground station able to send deployment commands on demand
System Analysis
Critical Design Review
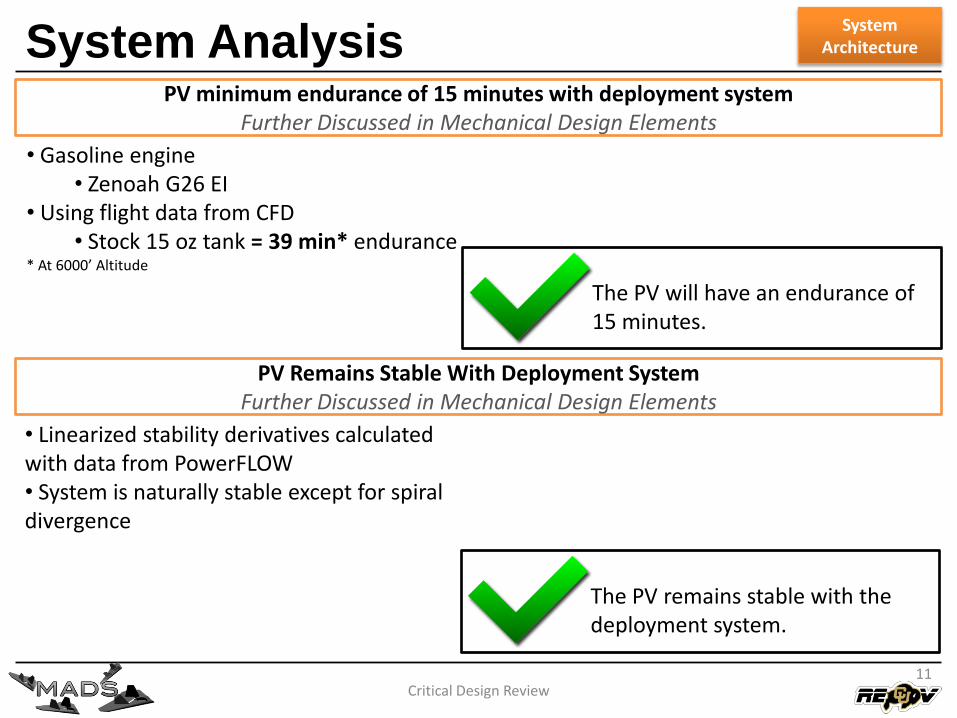
PV minimum endurance of 15 minutes with deployment systemFurther Discussed in Mechanical Design Elements
11
The PV will have an endurance of 15 minutes.
• Gasoline engine• Zenoah G26 EI
• Using flight data from CFD• Stock 15 oz tank = 39 min* endurance
* At 6000’ Altitude
SystemArchitecture
PV Remains Stable With Deployment SystemFurther Discussed in Mechanical Design Elements
• Linearized stability derivatives calculated with data from PowerFLOW• System is naturally stable except for spiral divergence
The PV remains stable with the deployment system.
Requests For Action
Critical Design Review12
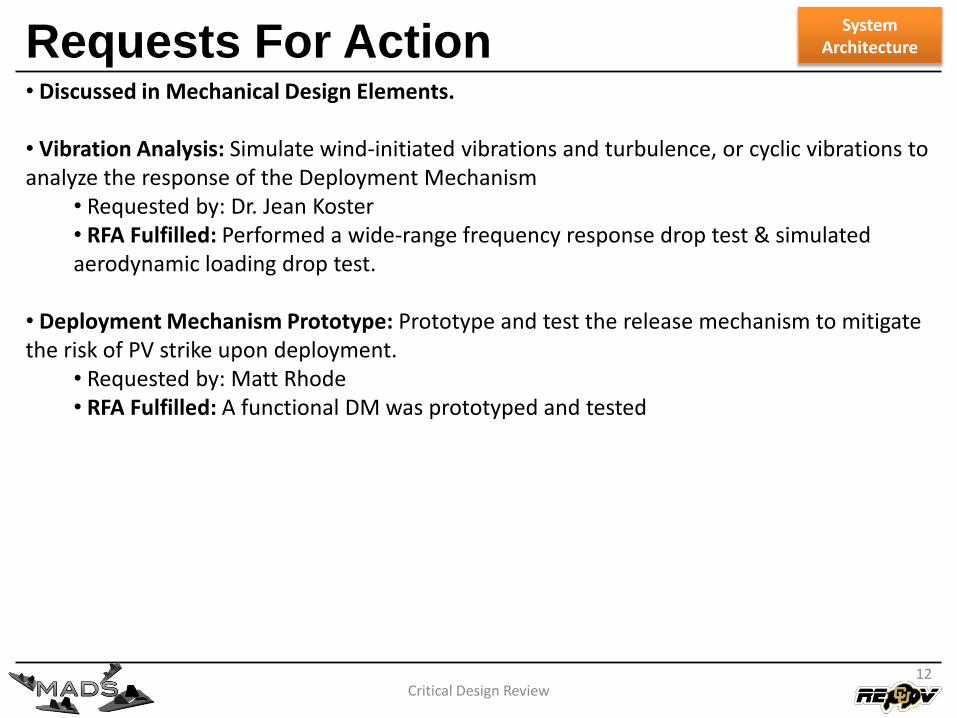
• Discussed in Mechanical Design Elements.
• Vibration Analysis: Simulate wind-initiated vibrations and turbulence, or cyclic vibrations to analyze the response of the Deployment Mechanism
• Requested by: Dr. Jean Koster• RFA Fulfilled: Performed a wide-range frequency response drop test & simulated aerodynamic loading drop test.
• Deployment Mechanism Prototype: Prototype and test the release mechanism to mitigate the risk of PV strike upon deployment.
• Requested by: Matt Rhode• RFA Fulfilled: A functional DM was prototyped and tested
SystemArchitecture

Critical Design Review13
System Architecture
Design Elements
Manufacturing & System Integration Plan
Verification & Test Plan
Project Management Plan
Mechanical Design Elements (MDE)
Design-To Specifications
Critical Design Review
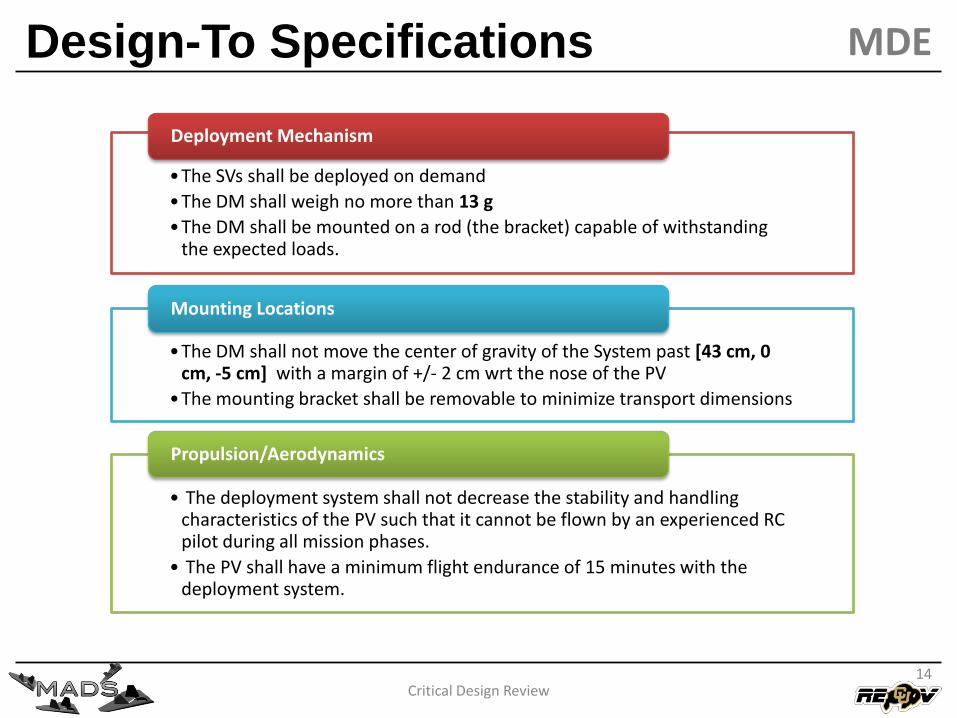
•The SVs shall be deployed on demand
•The DM shall weigh no more than 13 g
•The DM shall be mounted on a rod (the bracket) capable of withstanding the expected loads.
Deployment Mechanism
•The DM shall not move the center of gravity of the System past [43 cm, 0 cm, -5 cm] with a margin of +/- 2 cm wrt the nose of the PV
•The mounting bracket shall be removable to minimize transport dimensions
Mounting Locations
• The deployment system shall not decrease the stability and handling characteristics of the PV such that it cannot be flown by an experienced RC pilot during all mission phases.
• The PV shall have a minimum flight endurance of 15 minutes with the deployment system.
Propulsion/Aerodynamics
MDE
14

Critical Design Review15
Deployment Mechanism
Design
Critical Design Review
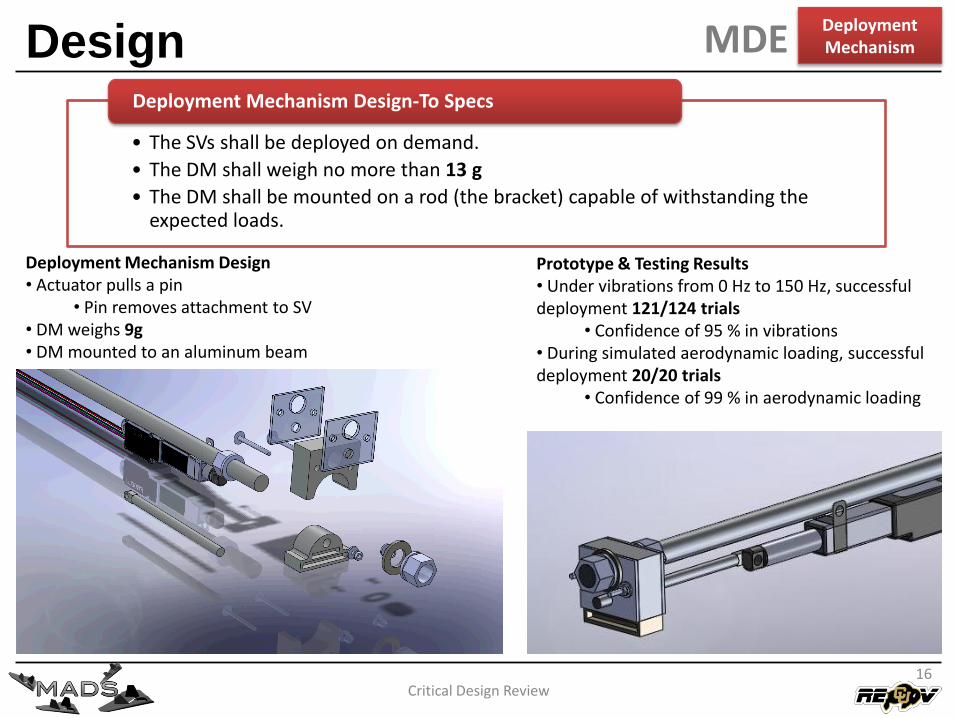
Deployment Mechanism Design• Actuator pulls a pin
• Pin removes attachment to SV• DM weighs 9g• DM mounted to an aluminum beam
Deployment MechanismMDE
• The SVs shall be deployed on demand.
• The DM shall weigh no more than 13 g
• The DM shall be mounted on a rod (the bracket) capable of withstanding the expected loads.
Deployment Mechanism Design-To Specs
Prototype & Testing Results• Under vibrations from 0 Hz to 150 Hz, successful deployment 121/124 trials
• Confidence of 95 % in vibrations• During simulated aerodynamic loading, successful deployment 20/20 trials
• Confidence of 99 % in aerodynamic loading
16
Design Path
Critical Design Review
Deployment MechanismMDE
17
Force Analysis
Critical Design Review
Deployment MechanismMDE
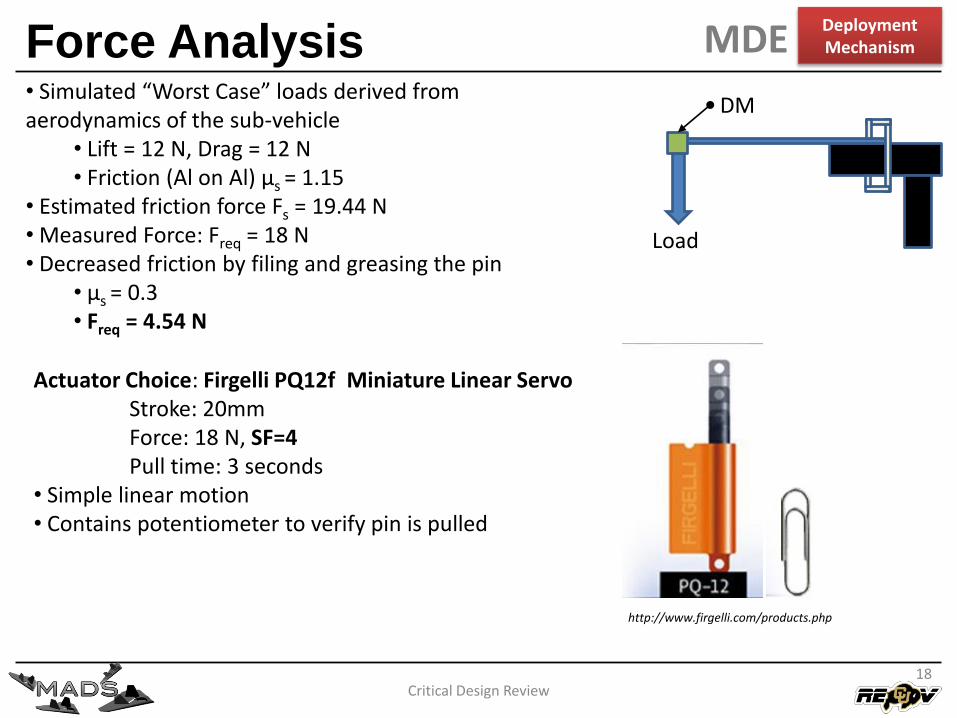
• Simulated “Worst Case” loads derived from aerodynamics of the sub-vehicle
• Lift = 12 N, Drag = 12 N• Friction (Al on Al) μs = 1.15
• Estimated friction force Fs = 19.44 N• Measured Force: Freq = 18 N• Decreased friction by filing and greasing the pin
• μs = 0.3• Freq = 4.54 N
Load
DM
Actuator Choice: Firgelli PQ12f Miniature Linear ServoStroke: 20mmForce: 18 N, SF=4Pull time: 3 seconds
• Simple linear motion• Contains potentiometer to verify pin is pulled
http://www.firgelli.com/products.php
18
Design Evolution
Critical Design Review
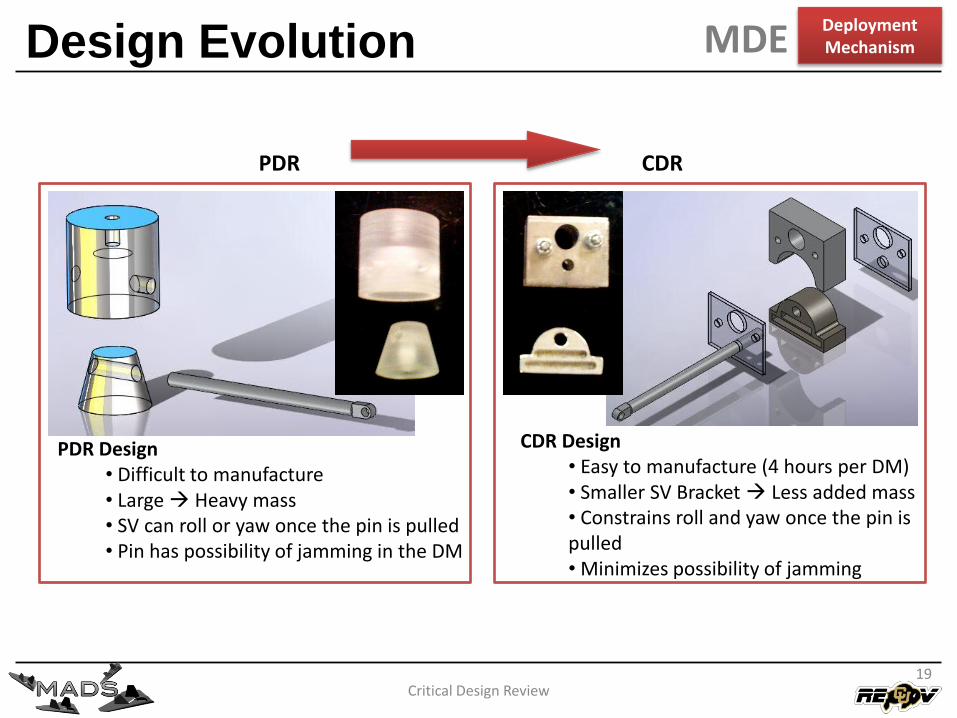
PDR Design• Difficult to manufacture• Large Heavy mass• SV can roll or yaw once the pin is pulled• Pin has possibility of jamming in the DM
PDR
CDR Design• Easy to manufacture (4 hours per DM)• Smaller SV Bracket Less added mass• Constrains roll and yaw once the pin is pulled• Minimizes possibility of jamming
CDR
Deployment MechanismMDE
19
Requests For Action
Critical Design Review
• Vibration Analysis: Simulate wind-initiated vibrations and turbulence, or cyclic vibrations to analyze the response of the Deployment Mechanism
• Requested by: Dr. Jean Koster• RFA Fulfilled: Performed a wide-range frequency response drop test & simulated aerodynamic loading drop test.
• Deployment Mechanism Prototype: Prototype and test the release mechanism to mitigate the risk of PV strike upon deployment.
• Requested by: Matt Rhode• RFA Fulfilled: A functional DM was prototyped and tested
20
Deployment MechanismMDE
101
102
103
5
10
15
Frequency [rad/s]
Fo
rce
[N
]
Maximum Force to Pull the Pin
Experimental Data
Best Fit Line
Vibration Test
Critical Design Review
Deployment MechanismMDE
21
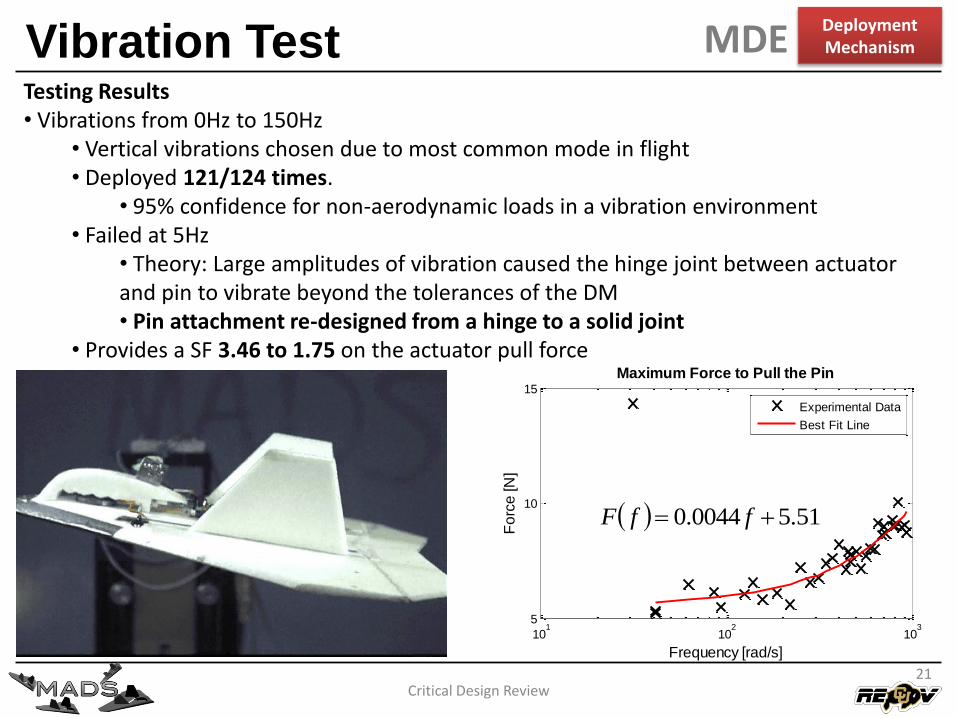
Testing Results• Vibrations from 0Hz to 150Hz
• Vertical vibrations chosen due to most common mode in flight• Deployed 121/124 times.
• 95% confidence for non-aerodynamic loads in a vibration environment • Failed at 5Hz
• Theory: Large amplitudes of vibration caused the hinge joint between actuator and pin to vibrate beyond the tolerances of the DM• Pin attachment re-designed from a hinge to a solid joint
• Provides a SF 3.46 to 1.75 on the actuator pull force
51.50044.0 ffF
Aerodynamic Load Test
Critical Design Review
Deployment MechanismMDE
22
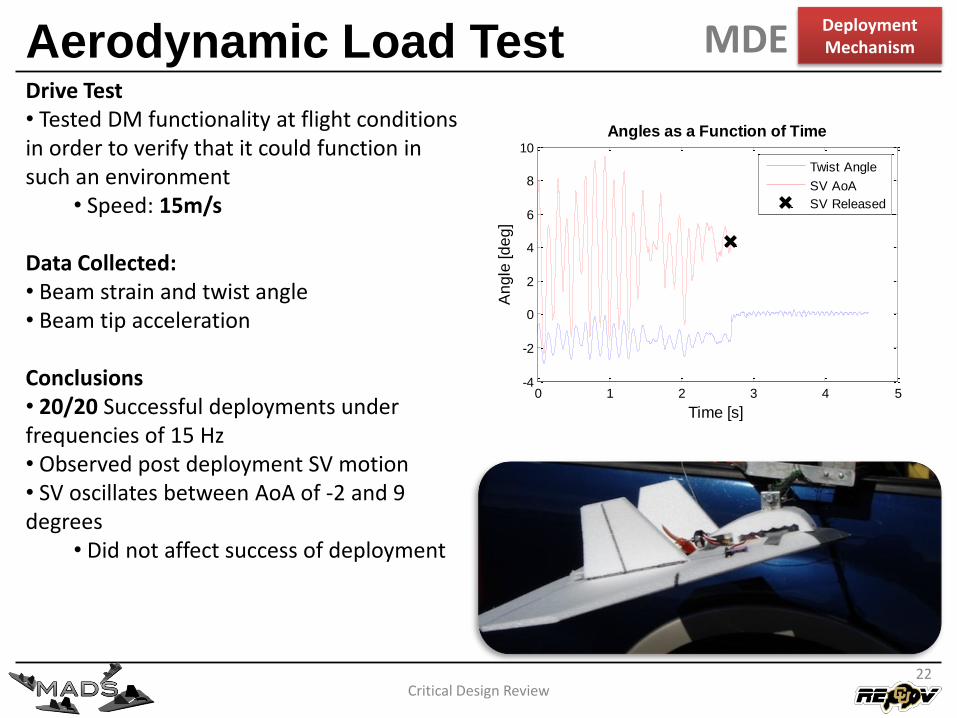
Drive Test• Tested DM functionality at flight conditions in order to verify that it could function in such an environment
• Speed: 15m/s
Data Collected:• Beam strain and twist angle• Beam tip acceleration
Conclusions• 20/20 Successful deployments under frequencies of 15 Hz• Observed post deployment SV motion• SV oscillates between AoA of -2 and 9 degrees
• Did not affect success of deployment
0 1 2 3 4 5-4
-2
0
2
4
6
8
10
Time [s]
An
gle
[d
eg
]
Angles as a Function of Time
Twist Angle
SV AoA
SV Released
Critical Design Review23
Mounting Locations
Mounting Location Design
Critical Design Review
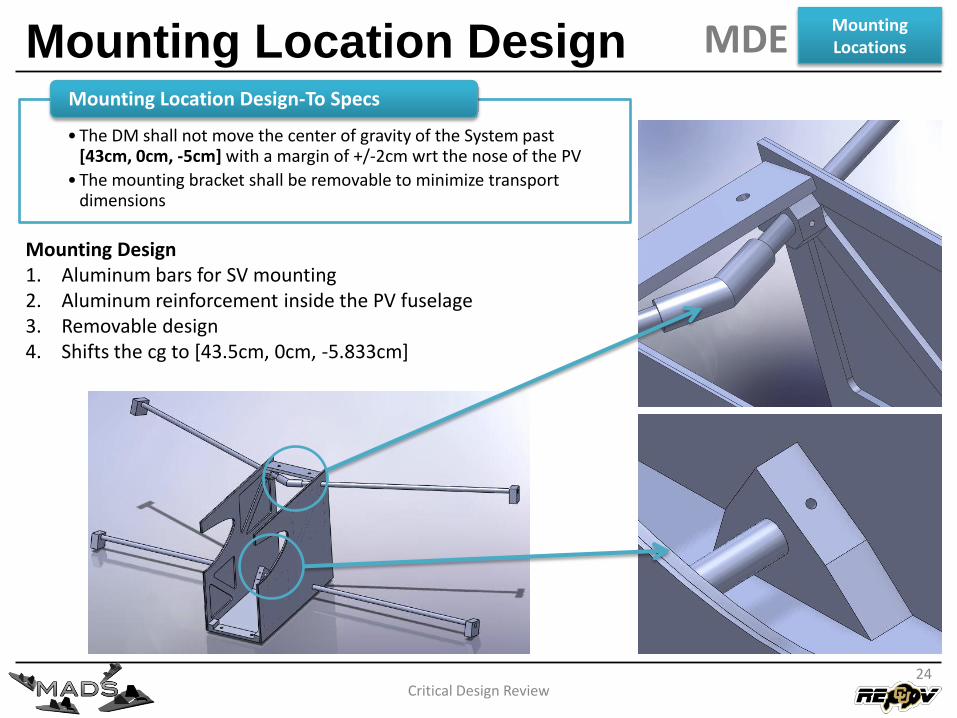
• The DM shall not move the center of gravity of the System past [43cm, 0cm, -5cm] with a margin of +/-2cm wrt the nose of the PV
• The mounting bracket shall be removable to minimize transport dimensions
Mounting Location Design-To Specs
MDEMountingLocations
Mounting Design1. Aluminum bars for SV mounting2. Aluminum reinforcement inside the PV fuselage3. Removable design4. Shifts the cg to [43.5cm, 0cm, -5.833cm]
24
Mounting Design Path
Critical Design Review
MDEMountingLocations
25
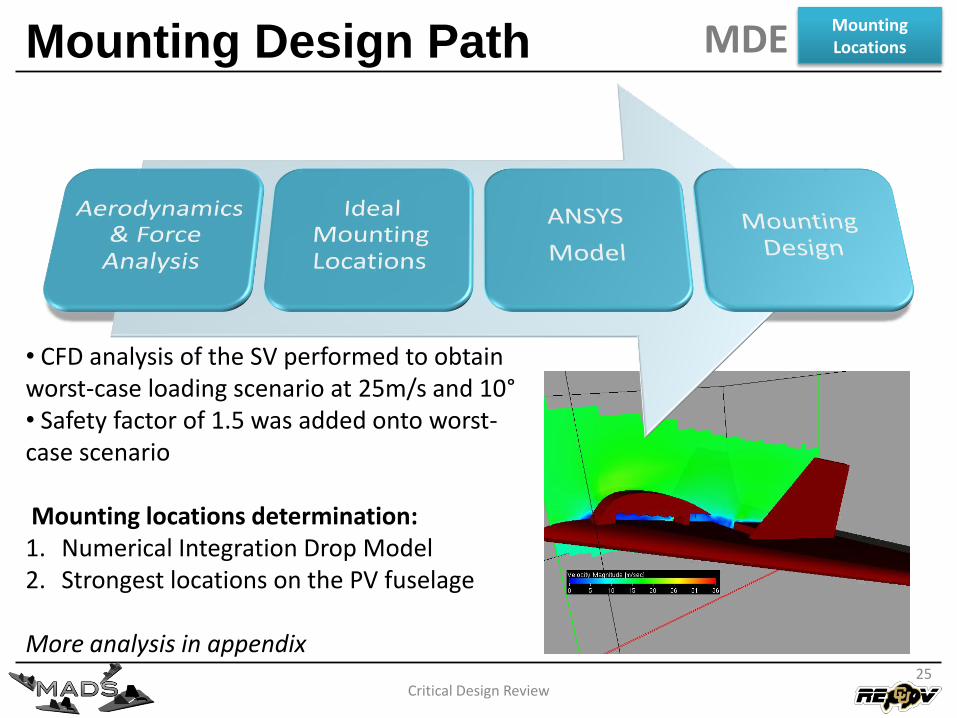
• CFD analysis of the SV performed to obtain worst-case loading scenario at 25m/s and 10°• Safety factor of 1.5 was added onto worst-case scenario
Mounting locations determination:1. Numerical Integration Drop Model2. Strongest locations on the PV fuselage
More analysis in appendix
ANSYS Model
Critical Design Review
MDEMountingLocations
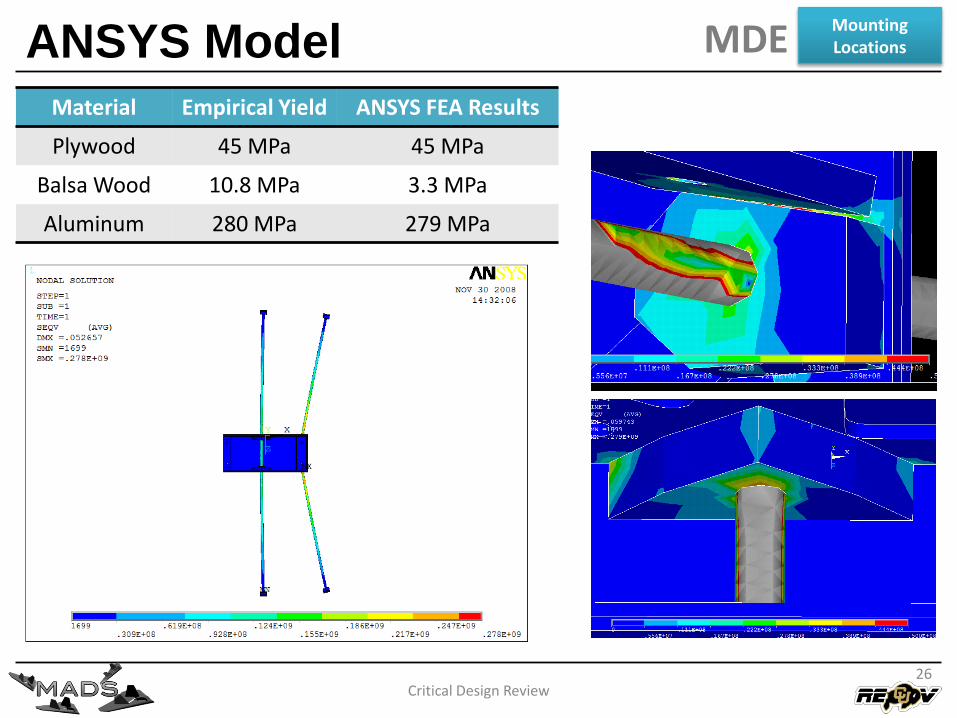
Material Empirical Yield ANSYS FEA Results
Plywood 45 MPa 45 MPa
Balsa Wood 10.8 MPa 3.3 MPa
Aluminum 280 MPa 279 MPa
26

Critical Design Review27
Propulsion and Aerodynamics
Design
Critical Design Review
Propulsion &AerodynamicsMDE
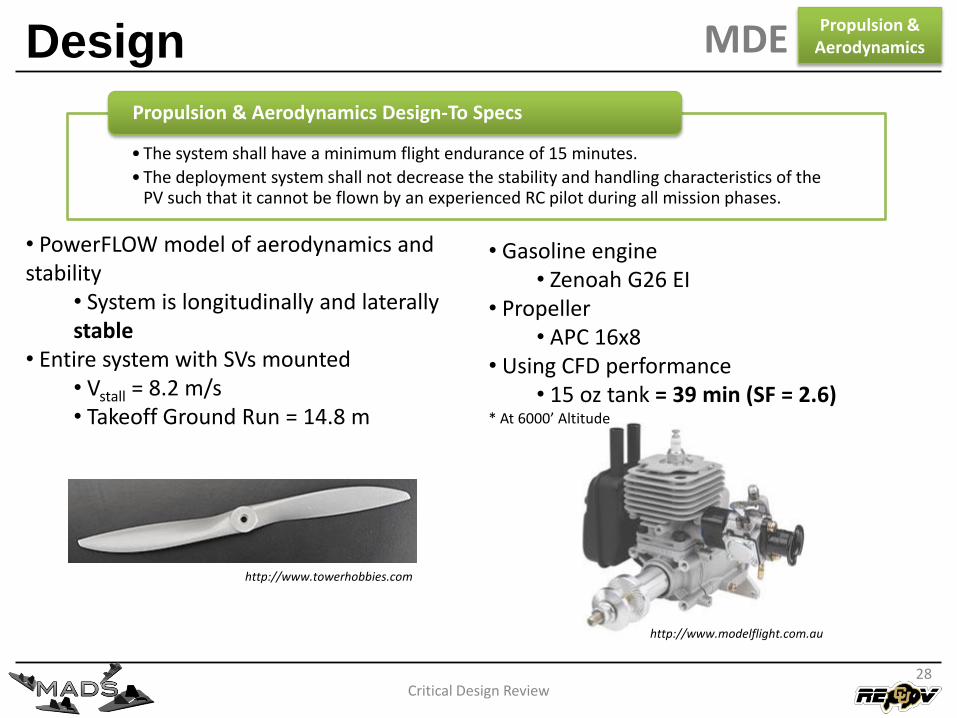
• The system shall have a minimum flight endurance of 15 minutes.
• The deployment system shall not decrease the stability and handling characteristics of the PV such that it cannot be flown by an experienced RC pilot during all mission phases.
Propulsion & Aerodynamics Design-To Specs
• PowerFLOW model of aerodynamics and stability
• System is longitudinally and laterally stable
• Entire system with SVs mounted• Vstall = 8.2 m/s• Takeoff Ground Run = 14.8 m
• Gasoline engine• Zenoah G26 EI
• Propeller• APC 16x8
• Using CFD performance• 15 oz tank = 39 min (SF = 2.6)
* At 6000’ Altitude
28
http://www.towerhobbies.com
http://www.modelflight.com.au
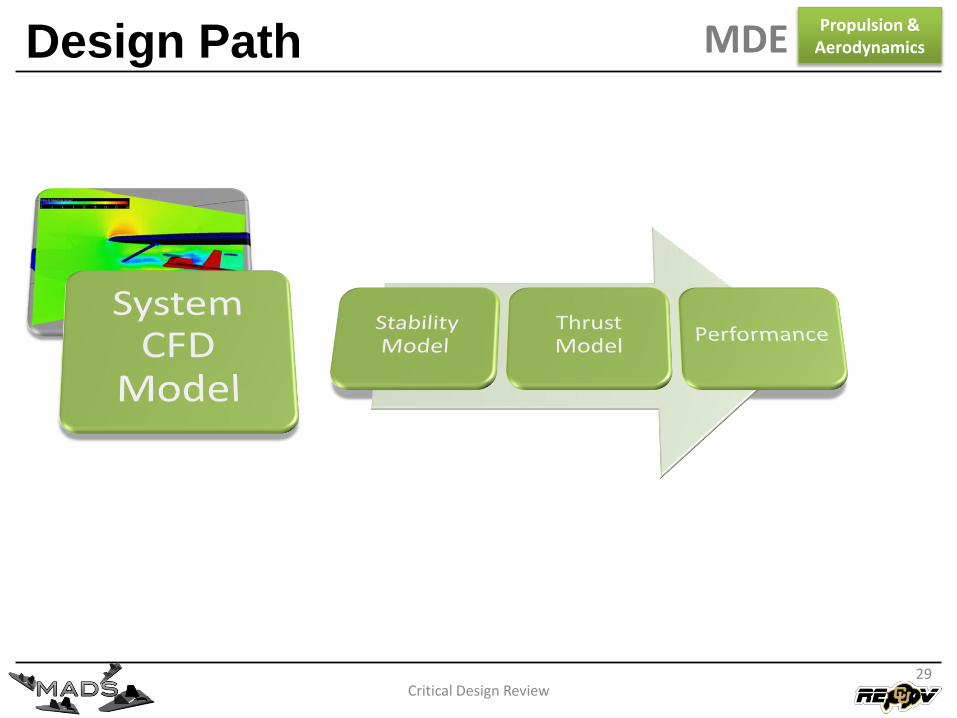
Design Path
Critical Design Review
Propulsion &AerodynamicsMDE
29
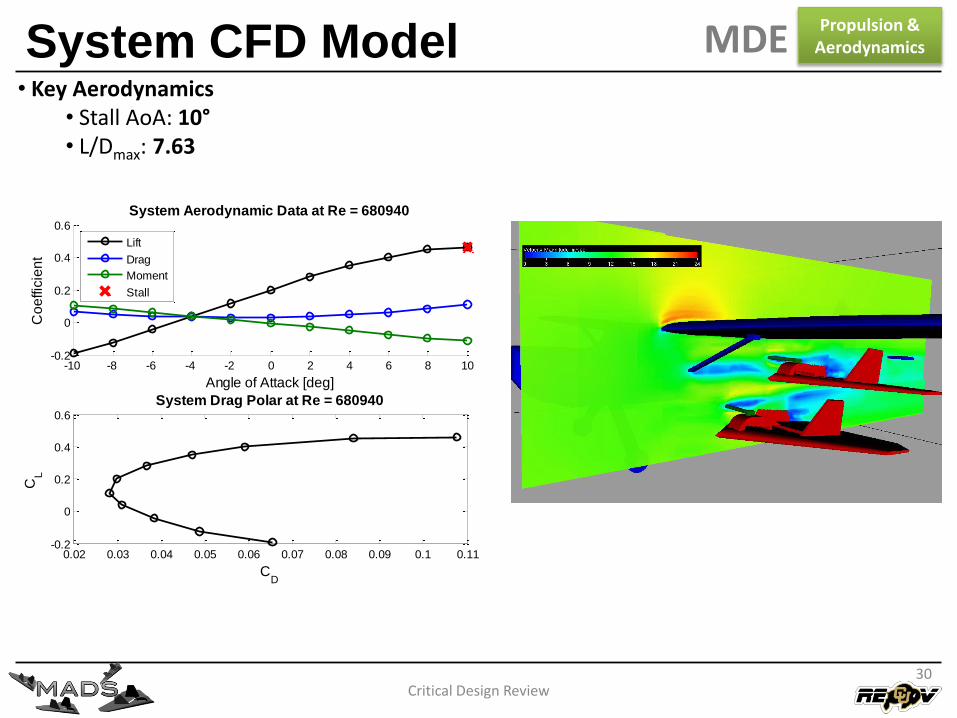
System CFD Model
Critical Design Review
Propulsion &AerodynamicsMDE
-10 -8 -6 -4 -2 0 2 4 6 8 10-0.2
0
0.2
0.4
0.6
System Aerodynamic Data at Re = 680940
Angle of Attack [deg]
Co
effic
ien
t
Lift
Drag
Moment
Stall
0.02 0.03 0.04 0.05 0.06 0.07 0.08 0.09 0.1 0.11-0.2
0
0.2
0.4
0.6
System Drag Polar at Re = 680940
CD
CL
• Key Aerodynamics• Stall AoA: 10°• L/Dmax: 7.63
30
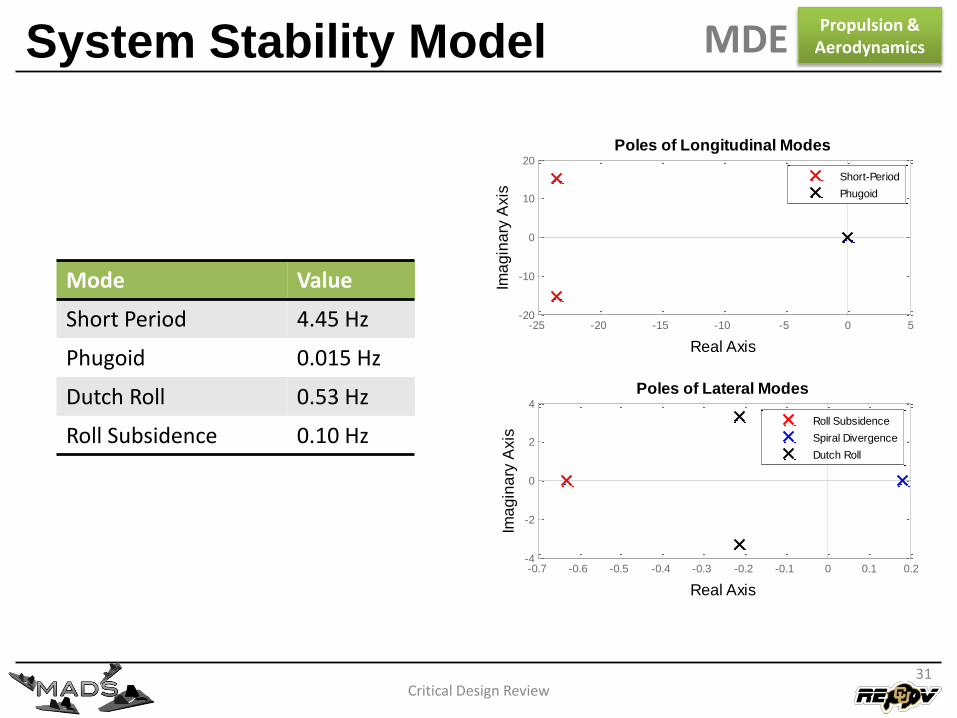
System Stability Model
Critical Design Review
Propulsion &AerodynamicsMDE
31
-25 -20 -15 -10 -5 0 5-20
-10
0
10
20
Poles of Longitudinal Modes
Real Axis
Ima
gin
ary
Axis
Short-Period
Phugoid
-0.7 -0.6 -0.5 -0.4 -0.3 -0.2 -0.1 0 0.1 0.2-4
-2
0
2
4
Poles of Lateral Modes
Real Axis
Ima
gin
ary
Axis
Roll Subsidence
Spiral Divergence
Dutch Roll
Mode Value
Short Period 4.45 Hz
Phugoid 0.015 Hz
Dutch Roll 0.53 Hz
Roll Subsidence 0.10 Hz
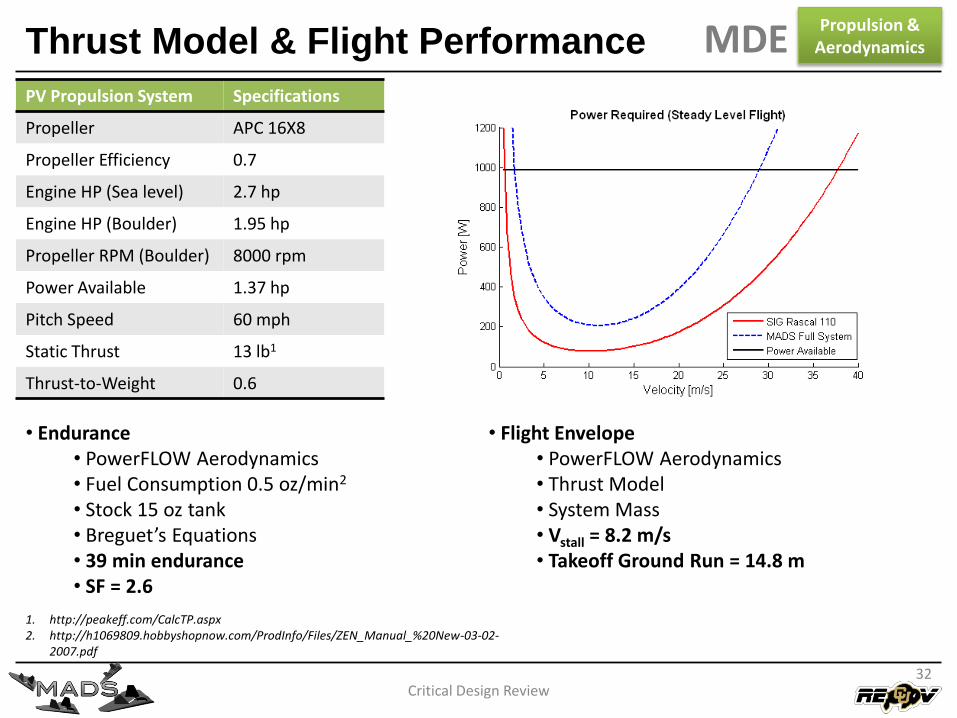
Thrust Model & Flight Performance
Critical Design Review
Propulsion &AerodynamicsMDE
32
PV Propulsion System Specifications
Propeller APC 16X8
Propeller Efficiency 0.7
Engine HP (Sea level) 2.7 hp
Engine HP (Boulder) 1.95 hp
Propeller RPM (Boulder) 8000 rpm
Power Available 1.37 hp
Pitch Speed 60 mph
Static Thrust 13 lb1
Thrust-to-Weight 0.6
1. http://peakeff.com/CalcTP.aspx2. http://h1069809.hobbyshopnow.com/ProdInfo/Files/ZEN_Manual_%20New-03-02-
2007.pdf
• Endurance• PowerFLOW Aerodynamics• Fuel Consumption 0.5 oz/min2
• Stock 15 oz tank• Breguet’s Equations• 39 min endurance• SF = 2.6
• Flight Envelope• PowerFLOW Aerodynamics• Thrust Model• System Mass• Vstall = 8.2 m/s• Takeoff Ground Run = 14.8 m

Critical Design Review33
System Architecture
Design Elements
Manufacturing & System Integration Plan
Verification & Test Plan
Project Management Plan
Electrical Design Elements (EDE)
Design-To Specifications
Critical Design Review
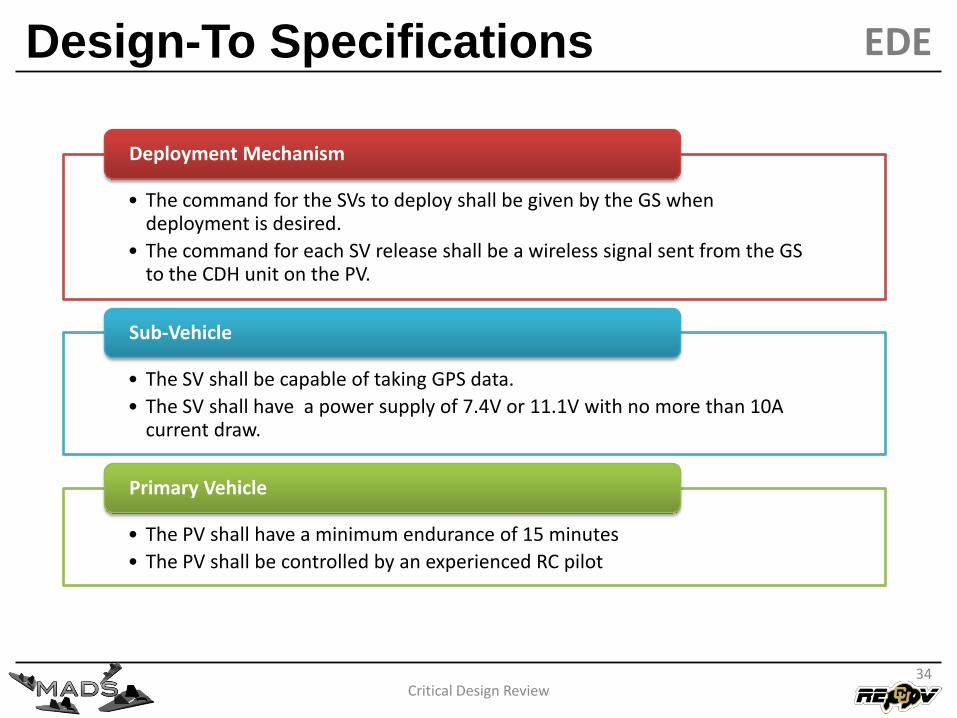
• The command for the SVs to deploy shall be given by the GS when deployment is desired.
• The command for each SV release shall be a wireless signal sent from the GS to the CDH unit on the PV.
Deployment Mechanism
• The SV shall be capable of taking GPS data.
• The SV shall have a power supply of 7.4V or 11.1V with no more than 10A current draw.
Sub-Vehicle
• The PV shall have a minimum endurance of 15 minutes
• The PV shall be controlled by an experienced RC pilot
Primary Vehicle
EDE
34

Critical Design Review35
Deployment MechanismElectrical Design
Design
Critical Design Review
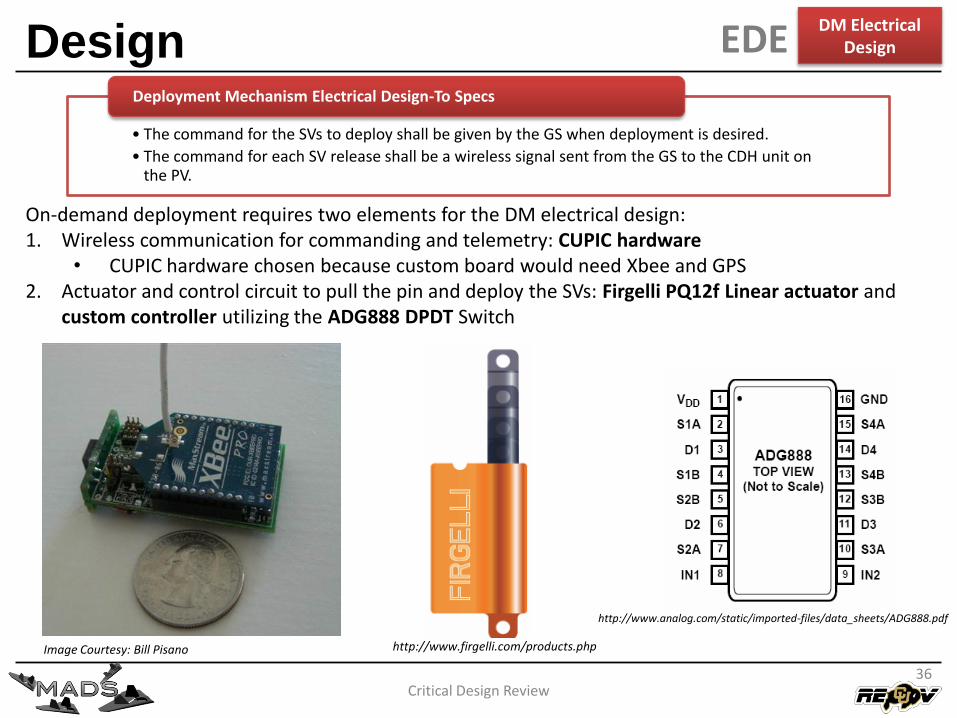
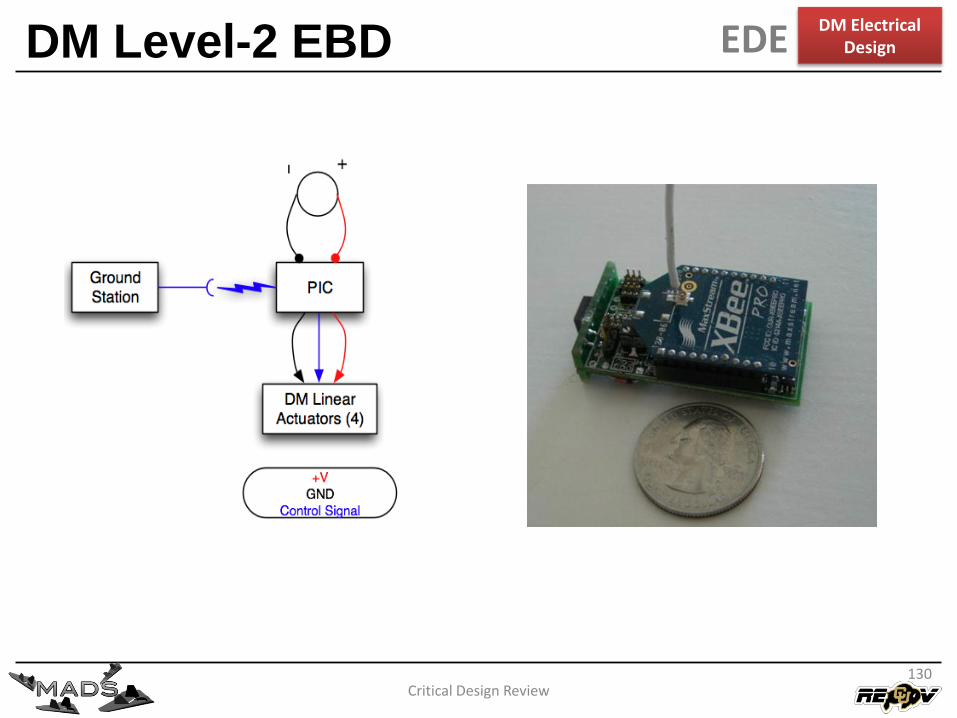
On-demand deployment requires two elements for the DM electrical design:1. Wireless communication for commanding and telemetry: CUPIC hardware
• CUPIC hardware chosen because custom board would need Xbee and GPS2. Actuator and control circuit to pull the pin and deploy the SVs: Firgelli PQ12f Linear actuator and
custom controller utilizing the ADG888 DPDT Switch
Image Courtesy: Bill Pisano http://www.firgelli.com/products.php
http://www.analog.com/static/imported-files/data_sheets/ADG888.pdf
• The command for the SVs to deploy shall be given by the GS when deployment is desired.
• The command for each SV release shall be a wireless signal sent from the GS to the CDH unit on the PV.
Deployment Mechanism Electrical Design-To Specs
36
DM Electrical DesignEDE
DM Design Path
Critical Design Review
DM Electrical DesignEDE
37
Actuator Controller Design
Critical Design Review
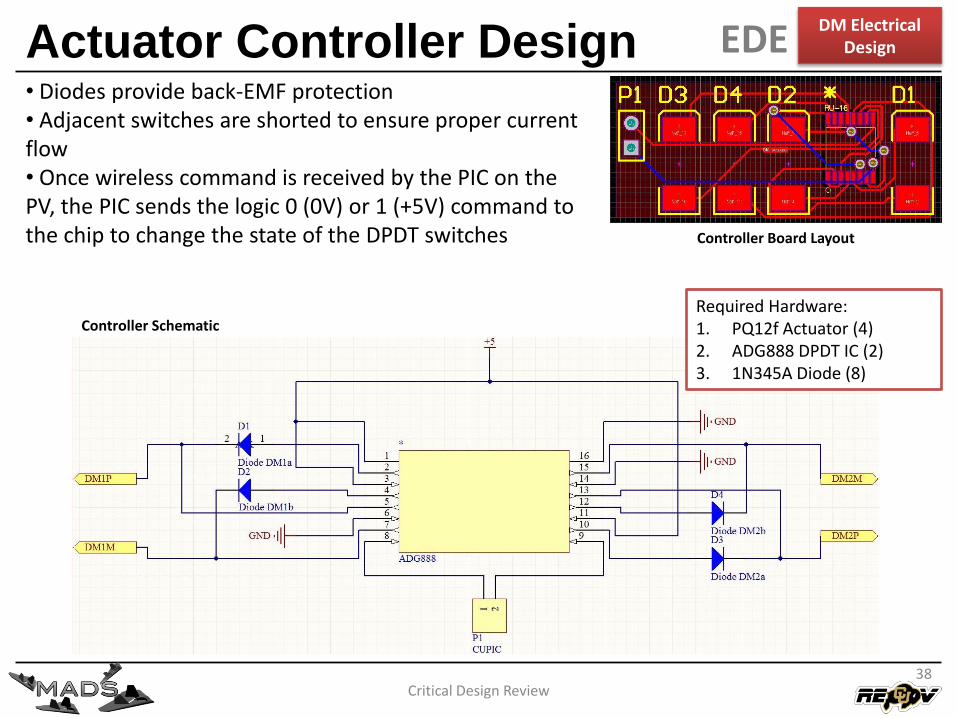
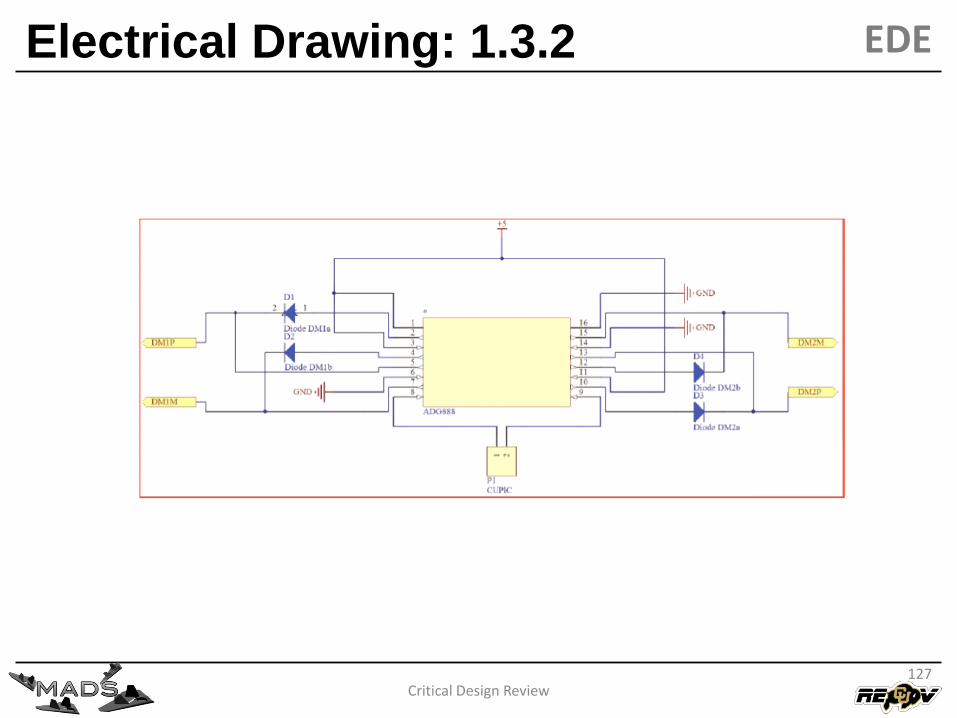
• Diodes provide back-EMF protection• Adjacent switches are shorted to ensure proper current flow• Once wireless command is received by the PIC on the PV, the PIC sends the logic 0 (0V) or 1 (+5V) command to the chip to change the state of the DPDT switches
Required Hardware:1. PQ12f Actuator (4)2. ADG888 DPDT IC (2)3. 1N345A Diode (8)
Controller Schematic
Controller Board Layout
38
DM Electrical DesignEDE

Critical Design Review39
Sub-VehicleElectrical Design
Design
Critical Design Review40
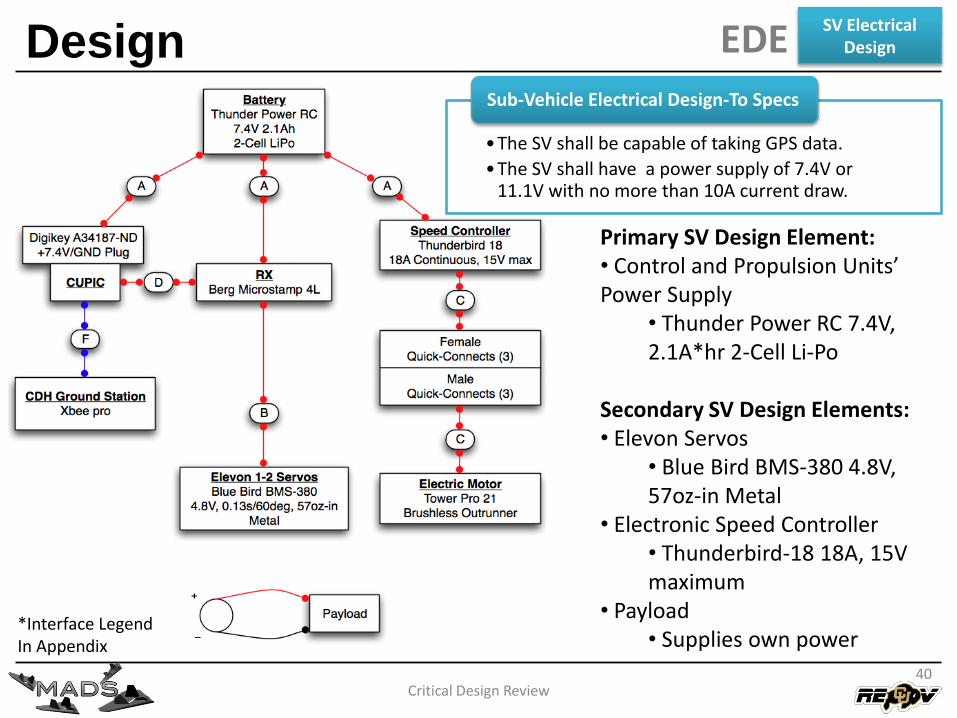
•The SV shall be capable of taking GPS data.
•The SV shall have a power supply of 7.4V or 11.1V with no more than 10A current draw.
Sub-Vehicle Electrical Design-To Specs
Primary SV Design Element: • Control and Propulsion Units’ Power Supply
• Thunder Power RC 7.4V, 2.1A*hr 2-Cell Li-Po
Secondary SV Design Elements:• Elevon Servos
• Blue Bird BMS-380 4.8V, 57oz-in Metal
• Electronic Speed Controller• Thunderbird-18 18A, 15V maximum
• Payload• Supplies own power
SV Electrical DesignEDE
*Interface Legend In Appendix
SV Power Design Path
Critical Design Review
EDESV Electrical
Design
41
SV Thrust Model
Critical Design Review
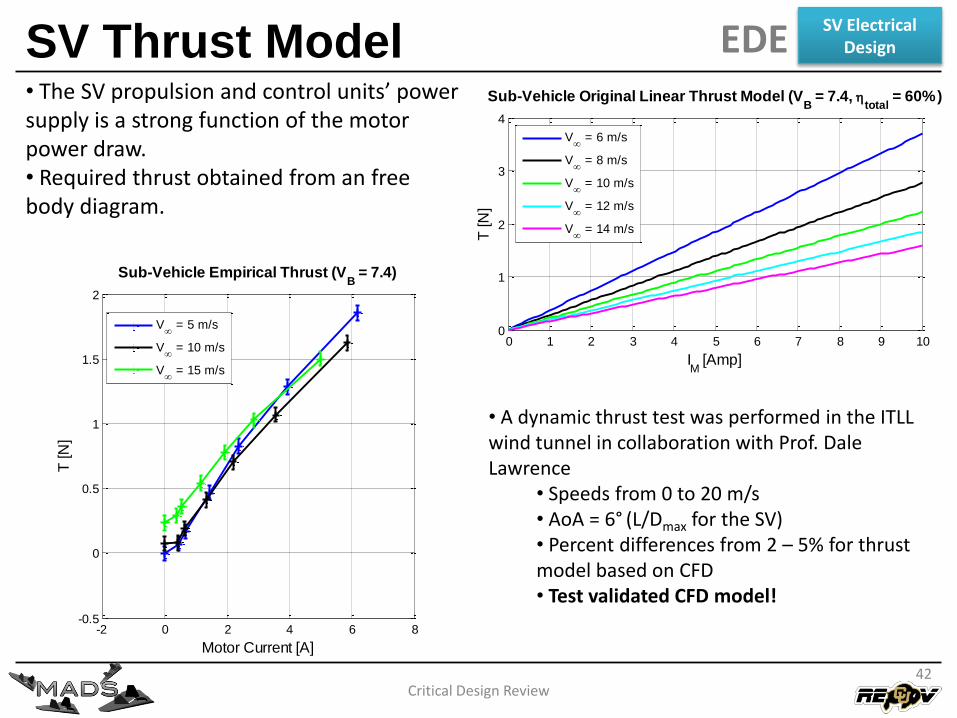
• The SV propulsion and control units’ power supply is a strong function of the motor power draw.• Required thrust obtained from an free body diagram.
EDESV Electrical
Design
-10 -5 0 5 10 15 20 250
2
4
6
8
10
12
[deg]
TR
[N
]
Sub-Vehicle Required Thrust from CFD Model
V
= 5 m/s
V
= 10 m/s
V
= 15 m/s
Superfly Max
0 1 2 3 4 5 6 7 8 9 100
1
2
3
4
Sub-Vehicle Original Linear Thrust Model (VB = 7.4,
total = 60%)
IM
[Amp]
T [N
]
V
= 6 m/s
V
= 8 m/s
V
= 10 m/s
V
= 12 m/s
V
= 14 m/s
42
-2 0 2 4 6 8-2
-1.5
-1
-0.5
0
0.5
1
1.5
2
Sub-Vehicle Forward Force and Motor Current (VB = 7.4V)
Motor Current [A]
Fo
rce
[N
]
V
= <5 m/s
V
= 5 m/s
V
= 10 m/s
V
= 15 m/s
-2 0 2 4 6 8-0.5
0
0.5
1
1.5
2
Sub-Vehicle Empirical Thrust (VB = 7.4)
Motor Current [A]
T [N
]
V
= 5 m/s
V
= 10 m/s
V
= 15 m/s
• A dynamic thrust test was performed in the ITLL wind tunnel in collaboration with Prof. Dale Lawrence
• Speeds from 0 to 20 m/s• AoA = 6° (L/Dmax for the SV)• Percent differences from 2 – 5% for thrust model based on CFD• Test validated CFD model!
SV Flight Configuration
Critical Design Review
EDE
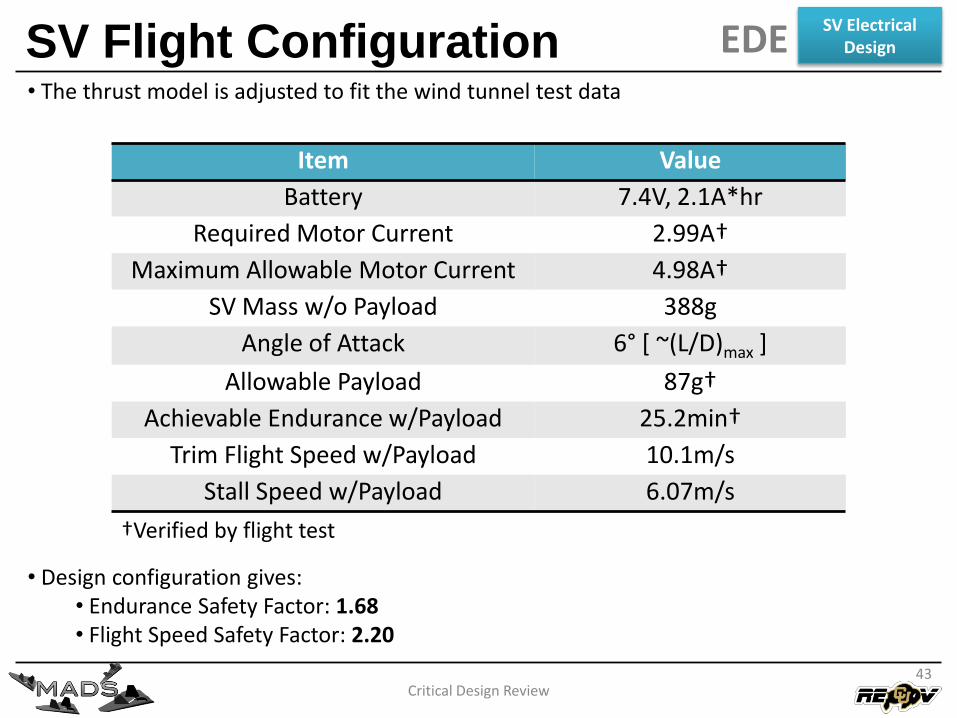
Item Value
Battery 7.4V, 2.1A*hr
Required Motor Current 2.99A†
Maximum Allowable Motor Current 4.98A†
SV Mass w/o Payload 388g
Angle of Attack 6° [ ~(L/D)max ]
Allowable Payload 87g†
Achievable Endurance w/Payload 25.2min†
Trim Flight Speed w/Payload 10.1m/s
Stall Speed w/Payload 6.07m/s
SV Electrical Design
†Verified by flight test
• The thrust model is adjusted to fit the wind tunnel test data
• Design configuration gives:• Endurance Safety Factor: 1.68• Flight Speed Safety Factor: 2.20
43

Critical Design Review44
Primary VehicleElectrical Design
Design
Critical Design Review45
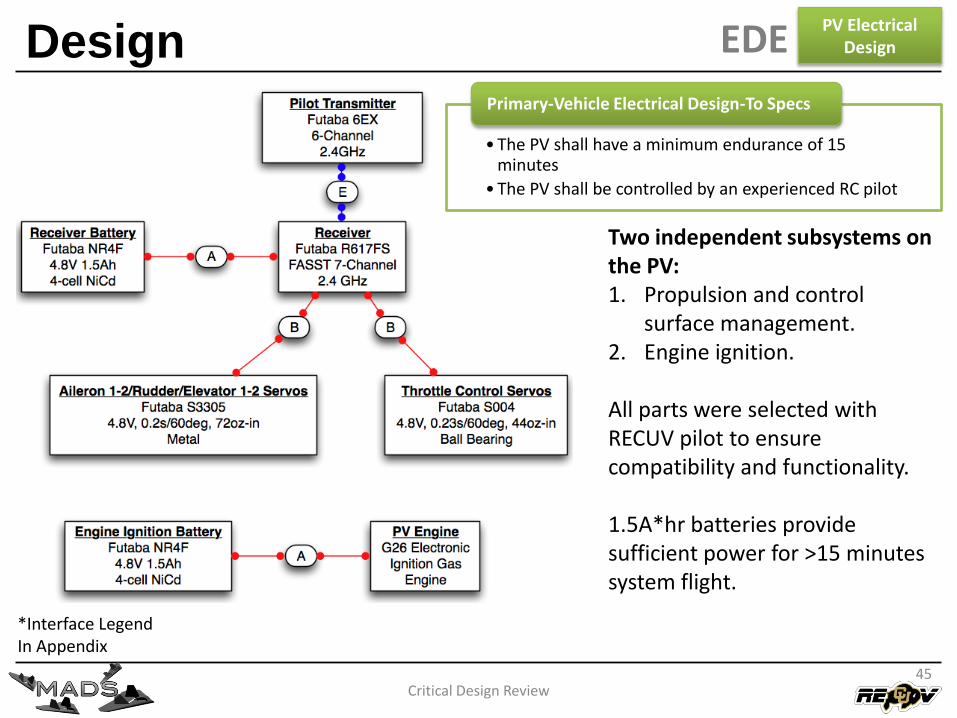
• The PV shall have a minimum endurance of 15 minutes
• The PV shall be controlled by an experienced RC pilot
Primary-Vehicle Electrical Design-To Specs
EDEPV Electrical
Design
Two independent subsystems on the PV:1. Propulsion and control
surface management.2. Engine ignition.
All parts were selected with RECUV pilot to ensure compatibility and functionality.
1.5A*hr batteries provide sufficient power for >15 minutes system flight.
*Interface Legend In Appendix

Critical Design Review46
System Architecture
Design Elements
Manufacturing & System Integration Plan
Verification & Test Plan
Project Management Plan
Software Design Elements (SDE)
Design-To Specifications
Critical Design Review
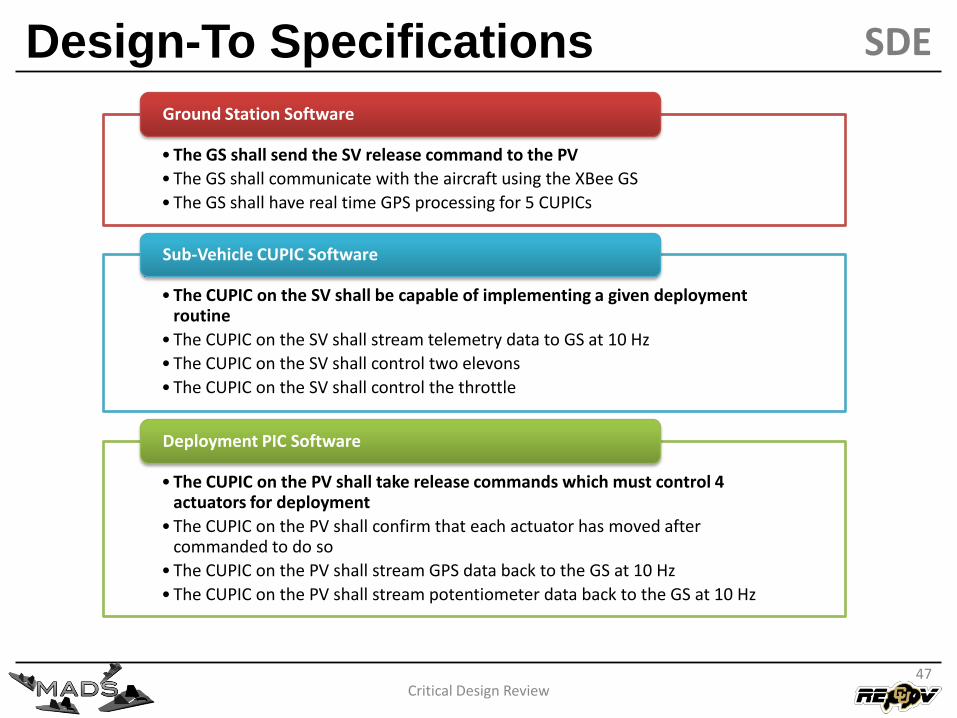
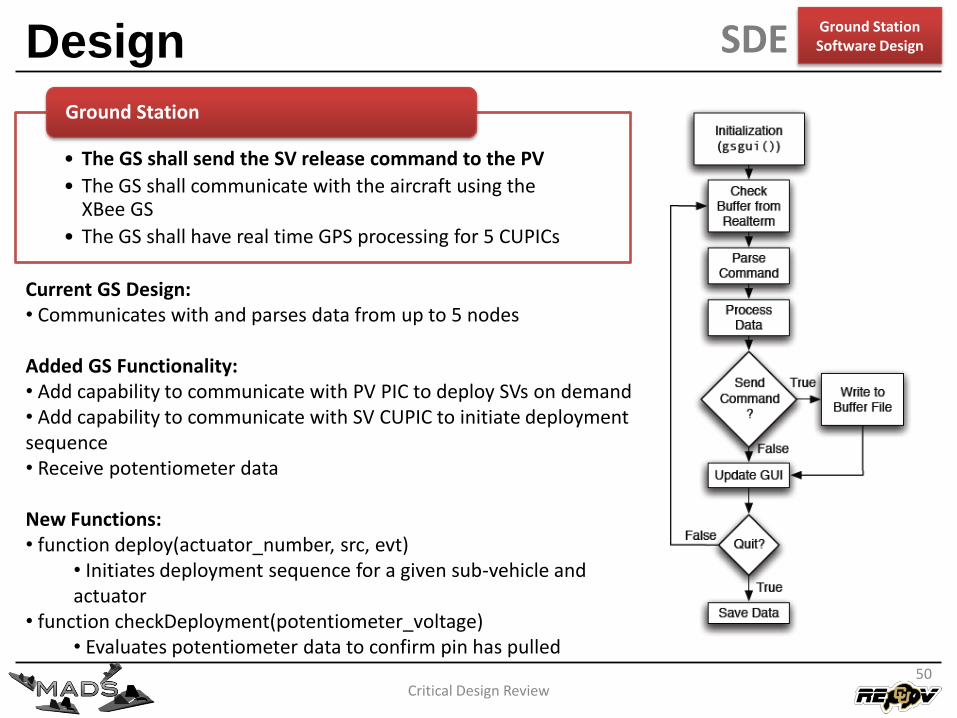
• The GS shall send the SV release command to the PV
• The GS shall communicate with the aircraft using the XBee GS
• The GS shall have real time GPS processing for 5 CUPICs
Ground Station Software
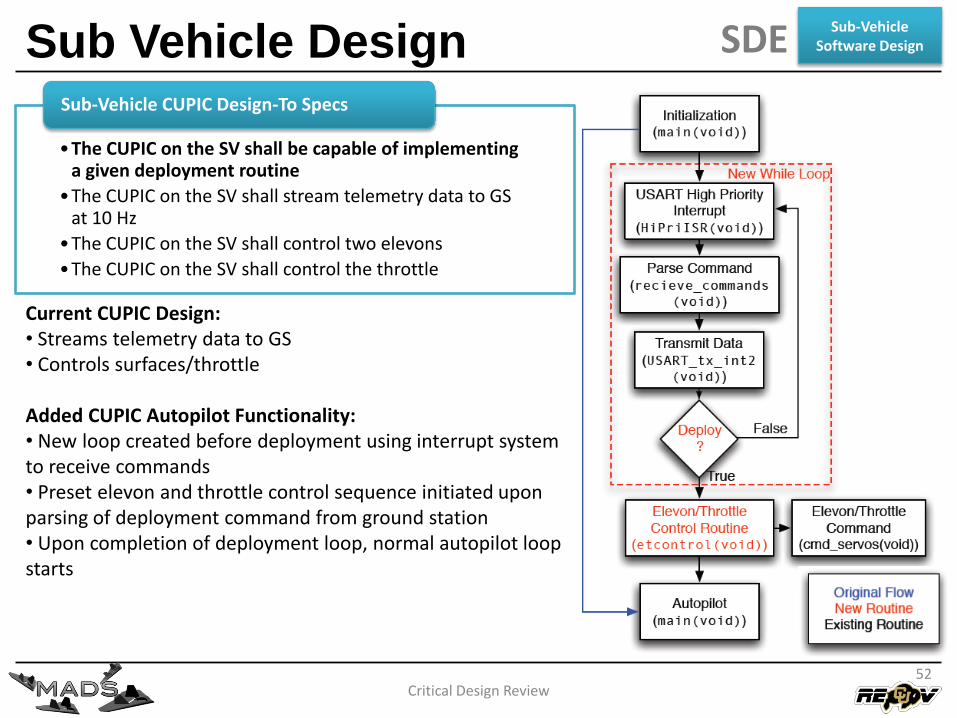
• The CUPIC on the SV shall be capable of implementing a given deployment routine
• The CUPIC on the SV shall stream telemetry data to GS at 10 Hz
• The CUPIC on the SV shall control two elevons
• The CUPIC on the SV shall control the throttle
Sub-Vehicle CUPIC Software
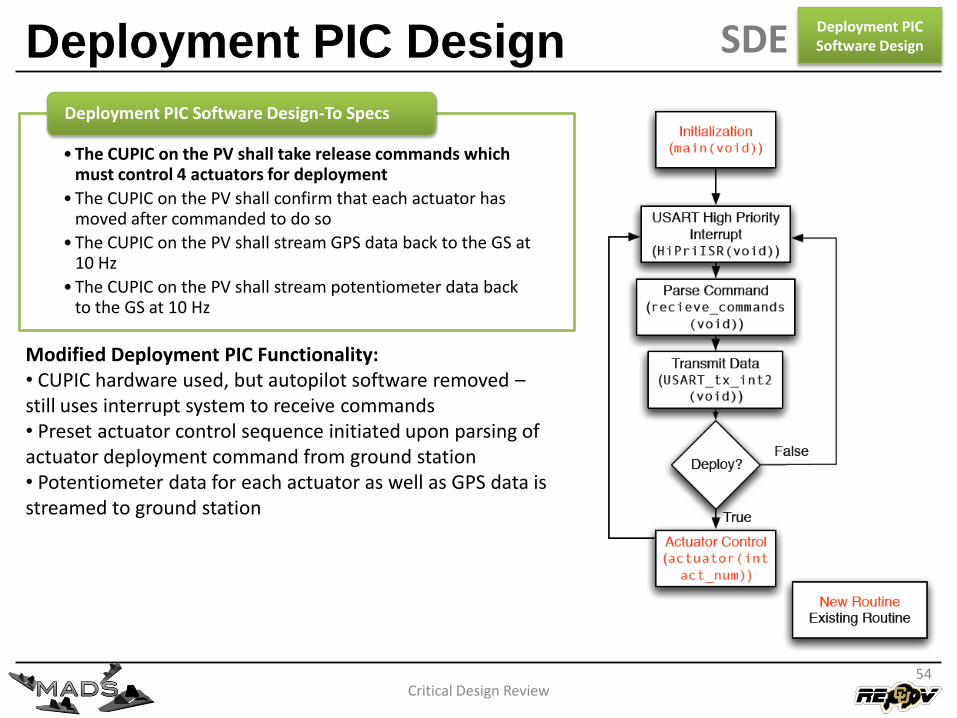
• The CUPIC on the PV shall take release commands which must control 4 actuators for deployment
• The CUPIC on the PV shall confirm that each actuator has moved after commanded to do so
• The CUPIC on the PV shall stream GPS data back to the GS at 10 Hz
• The CUPIC on the PV shall stream potentiometer data back to the GS at 10 Hz
Deployment PIC Software
SDE
47
Communication and Data Flowchart
Critical Design Review
SDE
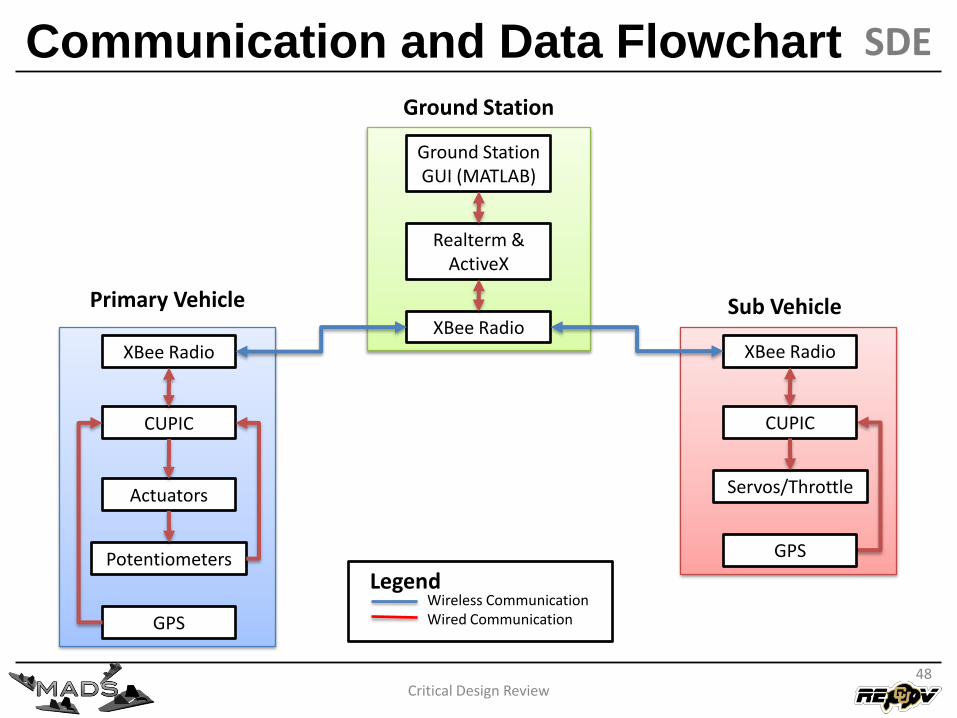
Primary Vehicle
CUPIC
XBee Radio
Actuators
Realterm &ActiveX
Ground Station GUI (MATLAB)
Ground Station
XBee Radio
Potentiometers
Wireless CommunicationWired Communication
Legend
Sub Vehicle
GPS
CUPIC
XBee Radio
Servos/Throttle
GPS
48
Critical Design Review49
Ground Station Software Design
Design
Critical Design Review
Current GS Design:• Communicates with and parses data from up to 5 nodes
Added GS Functionality:• Add capability to communicate with PV PIC to deploy SVs on demand• Add capability to communicate with SV CUPIC to initiate deployment sequence• Receive potentiometer data
New Functions:• function deploy(actuator_number, src, evt)
• Initiates deployment sequence for a given sub-vehicle and actuator
• function checkDeployment(potentiometer_voltage)• Evaluates potentiometer data to confirm pin has pulled
Ground Station Software DesignSDE
• The GS shall send the SV release command to the PV
• The GS shall communicate with the aircraft using the XBee GS
• The GS shall have real time GPS processing for 5 CUPICs
Ground Station
50
Critical Design Review51
Sub-Vehicle Software Design
Sub Vehicle Design
Critical Design Review
SDE Sub-VehicleSoftware Design
•The CUPIC on the SV shall be capable of implementing a given deployment routine
•The CUPIC on the SV shall stream telemetry data to GS at 10 Hz
•The CUPIC on the SV shall control two elevons
•The CUPIC on the SV shall control the throttle
Sub-Vehicle CUPIC Design-To Specs
Current CUPIC Design:• Streams telemetry data to GS• Controls surfaces/throttle
Added CUPIC Autopilot Functionality:• New loop created before deployment using interrupt system to receive commands• Preset elevon and throttle control sequence initiated upon parsing of deployment command from ground station• Upon completion of deployment loop, normal autopilot loop starts
52
Critical Design Review53
Deployment PIC Software Design
Deployment PIC Design
Critical Design Review
Deployment PIC Software DesignSDE
• The CUPIC on the PV shall take release commands which must control 4 actuators for deployment
• The CUPIC on the PV shall confirm that each actuator has moved after commanded to do so
• The CUPIC on the PV shall stream GPS data back to the GS at 10 Hz
• The CUPIC on the PV shall stream potentiometer data back to the GS at 10 Hz
Deployment PIC Software Design-To Specs
Modified Deployment PIC Functionality:• CUPIC hardware used, but autopilot software removed –still uses interrupt system to receive commands• Preset actuator control sequence initiated upon parsing of actuator deployment command from ground station• Potentiometer data for each actuator as well as GPS data is streamed to ground station
54
Fault Protection
Critical Design Review
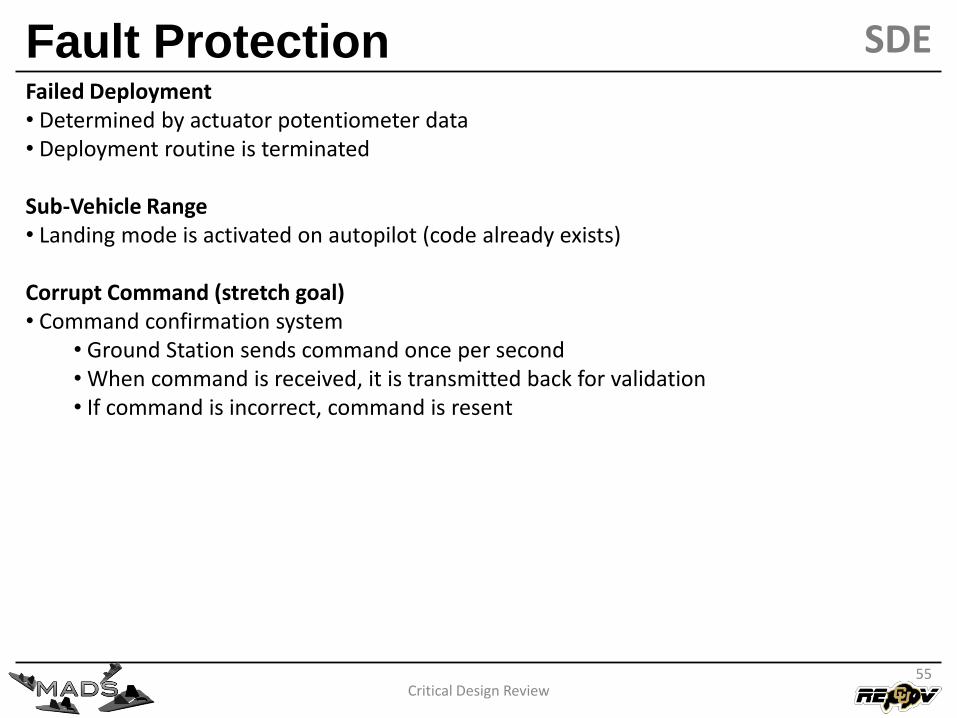
Failed Deployment• Determined by actuator potentiometer data• Deployment routine is terminated
Sub-Vehicle Range• Landing mode is activated on autopilot (code already exists)
Corrupt Command (stretch goal)• Command confirmation system
• Ground Station sends command once per second• When command is received, it is transmitted back for validation• If command is incorrect, command is resent
55
SDE
Critical Design Review56
System Architecture
Design Elements
Manufacturing & System Integration Plan
Verification & Test Plan
Project Management Plan
Manufacturing Considerations
57Critical Design Review
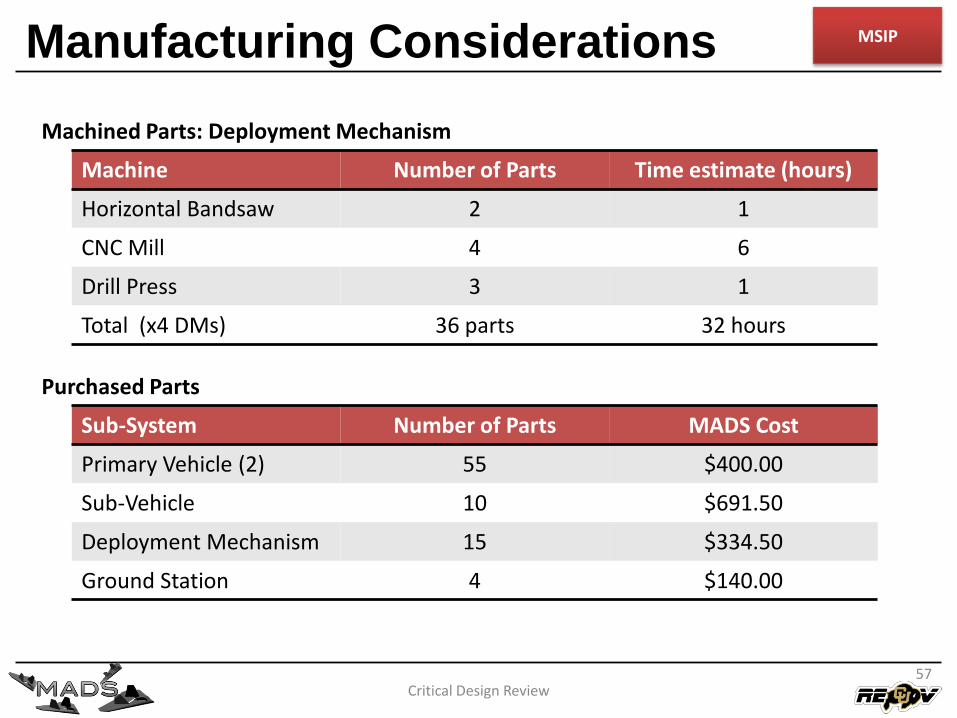
Machined Parts: Deployment Mechanism
Machine Number of Parts Time estimate (hours)
Horizontal Bandsaw 2 1
CNC Mill 4 6
Drill Press 3 1
Total (x4 DMs) 36 parts 32 hours
Purchased Parts
Sub-System Number of Parts MADS Cost
Primary Vehicle (2) 55 $400.00
Sub-Vehicle 10 $691.50
Deployment Mechanism 15 $334.50
Ground Station 4 $140.00
MSIP
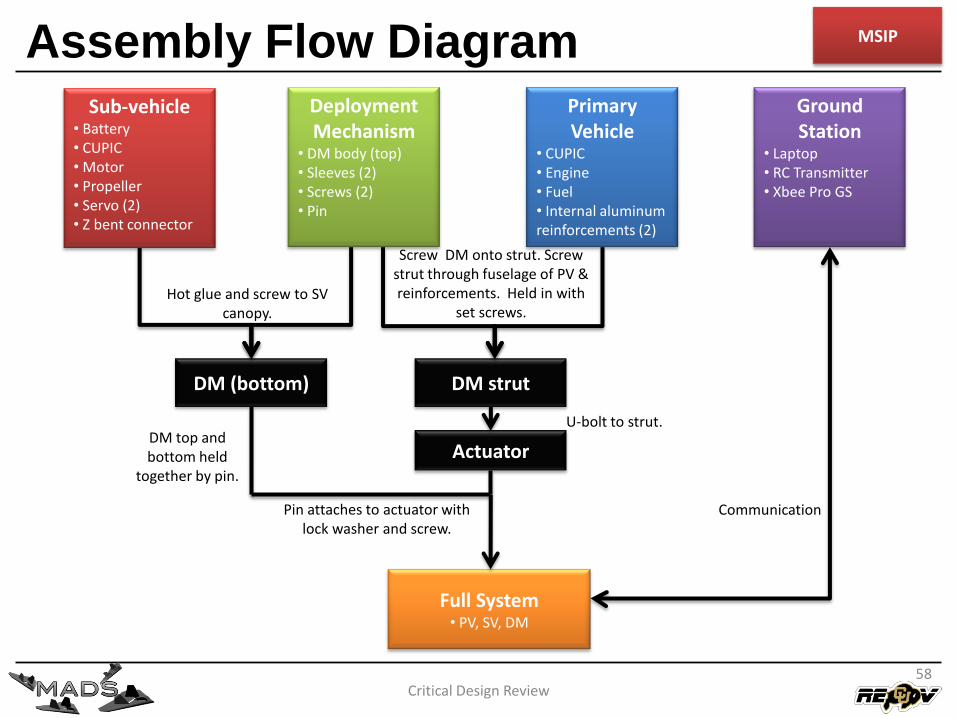
Assembly Flow Diagram
58Critical Design Review
Deployment Mechanism
• DM body (top)• Sleeves (2)• Screws (2)• Pin
DM (bottom) DM strut
Actuator
Hot glue and screw to SVcanopy.
Screw DM onto strut. Screw strut through fuselage of PV & reinforcements. Held in with
set screws.
U-bolt to strut.
Full System• PV, SV, DM
Ground Station
• Laptop• RC Transmitter• Xbee Pro GS
Communication
Sub-vehicle• Battery• CUPIC• Motor• Propeller• Servo (2)• Z bent connector
Primary Vehicle
• CUPIC• Engine• Fuel• Internal aluminum reinforcements (2)
DM top and bottom held
together by pin.
Pin attaches to actuator with lock washer and screw.
MSIP
Critical Design Review59
System Architecture
Design Elements
Manufacturing & System Integration Plan
Verification & Test Plan
Project Management Plan
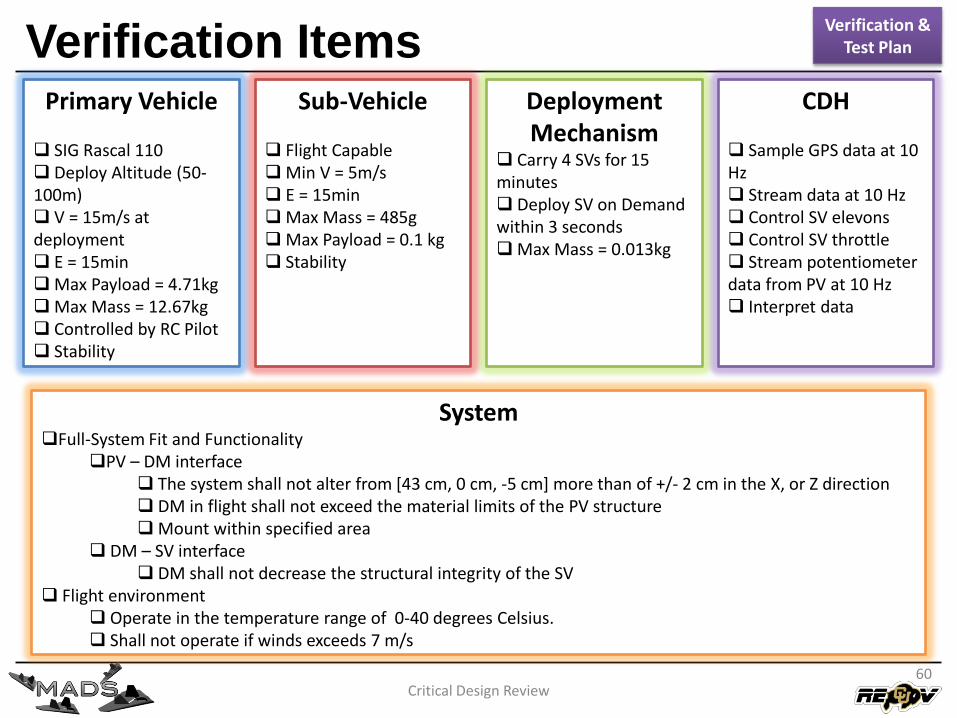
Verification ItemsVerification &
Test Plan
60Critical Design Review
Primary Vehicle
SIG Rascal 110 Deploy Altitude (50-100m) V = 15m/s at deployment E = 15minMax Payload = 4.71kgMax Mass = 12.67kg Controlled by RC Pilot Stability
Sub-Vehicle
Flight CapableMin V = 5m/s E = 15minMax Mass = 485gMax Payload = 0.1 kg Stability
Deployment Mechanism
Carry 4 SVs for 15 minutes Deploy SV on Demand within 3 secondsMax Mass = 0.013kg
CDH
Sample GPS data at 10 Hz Stream data at 10 Hz Control SV elevons Control SV throttle Stream potentiometer data from PV at 10 Hz Interpret data
SystemFull-System Fit and Functionality
PV – DM interface The system shall not alter from [43 cm, 0 cm, -5 cm] more than of +/- 2 cm in the X, or Z direction DM in flight shall not exceed the material limits of the PV structureMount within specified area
DM – SV interface DM shall not decrease the structural integrity of the SV
Flight environment Operate in the temperature range of 0-40 degrees Celsius. Shall not operate if winds exceeds 7 m/s
Velocity & altitude at
drop
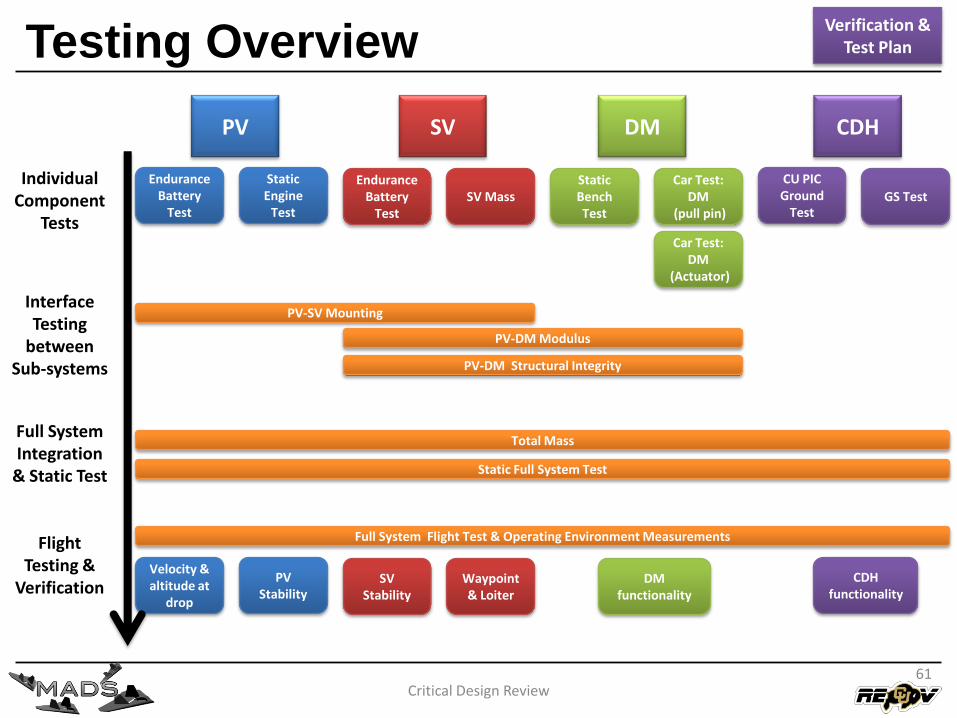
Testing Overview
61Critical Design Review
Individual Component
Tests
Interface Testing
between Sub-systems
Full System Integration
& Static Test
Flight Testing &
Verification
PV SV DM CDH
EnduranceBattery
Test
Static Engine
Test
EnduranceBattery
TestSV Mass
Static Bench Test
Car Test: DM
(pull pin)
CU PIC Ground
TestGS Test
Car Test: DM
(Actuator)
PV-SV Mounting
PV-DM Modulus
PV-DM Structural Integrity
Static Full System Test
Total Mass
Full System Flight Test & Operating Environment Measurements
PV Stability
SV Stability
Waypoint & Loiter
DM functionality
CDHfunctionality
Verification & Test Plan
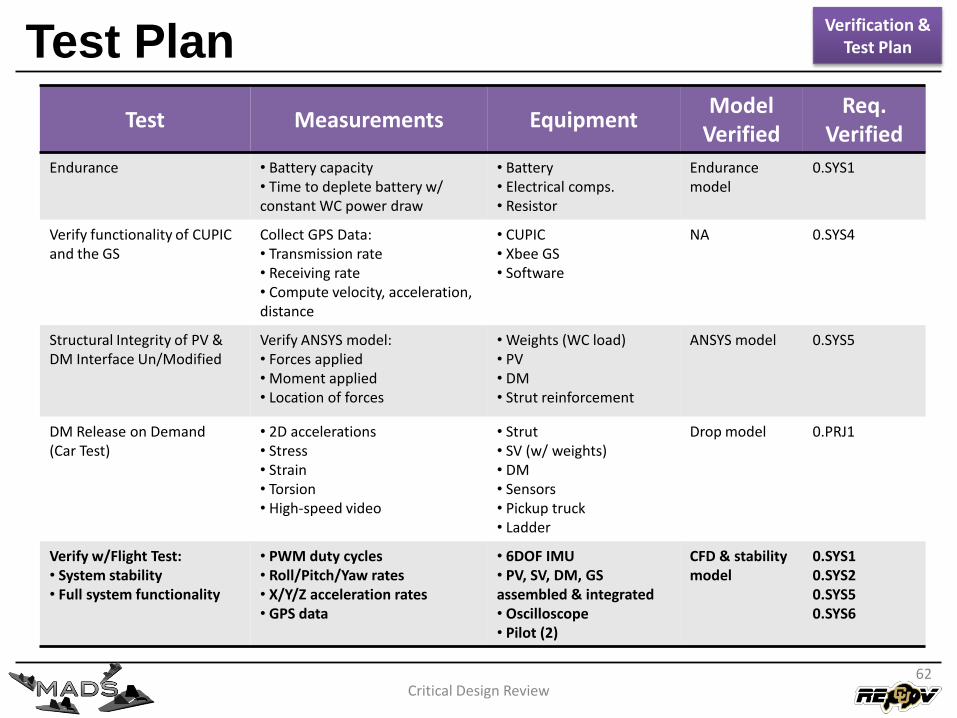
Test Plan
62Critical Design Review
Test Measurements EquipmentModel
VerifiedReq.
Verified
Endurance • Battery capacity• Time to deplete battery w/ constant WC power draw
• Battery• Electrical comps.• Resistor
Endurancemodel
0.SYS1
Verify functionality of CUPIC and the GS
Collect GPS Data:• Transmission rate• Receiving rate• Compute velocity, acceleration,distance
• CUPIC• Xbee GS• Software
NA 0.SYS4
Structural Integrity of PV & DM Interface Un/Modified
Verify ANSYS model:• Forces applied• Moment applied• Location of forces
• Weights (WC load)• PV• DM• Strut reinforcement
ANSYS model 0.SYS5
DM Release on Demand (Car Test)
• 2D accelerations• Stress• Strain• Torsion• High-speed video
• Strut• SV (w/ weights)• DM• Sensors• Pickup truck• Ladder
Drop model 0.PRJ1
Verify w/Flight Test:• System stability• Full system functionality
• PWM duty cycles• Roll/Pitch/Yaw rates• X/Y/Z acceleration rates• GPS data
• 6DOF IMU• PV, SV, DM, GS assembled & integrated• Oscilloscope• Pilot (2)
CFD & stabilitymodel
0.SYS10.SYS20.SYS50.SYS6
Verification & Test Plan
Critical Design Review63
System Architecture
Design Elements
Manufacturing & System Integration Plan
Verification & Test Plan
Project Management Plan
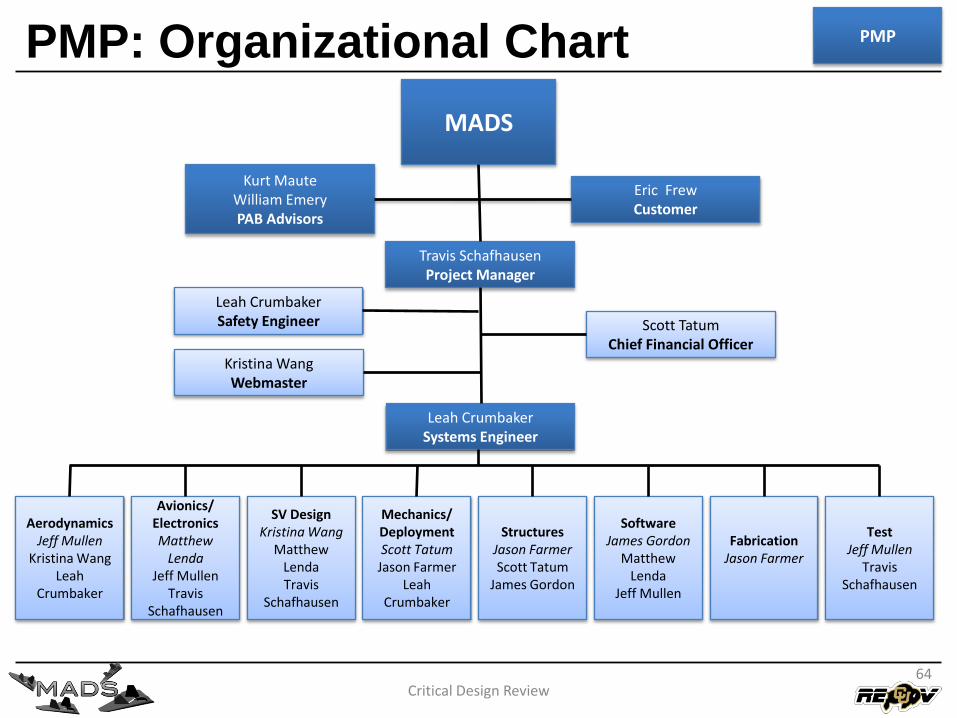
PMP: Organizational Chart
Critical Design Review
MADS
Travis SchafhausenProject Manager
Leah CrumbakerSafety Engineer Scott Tatum
Chief Financial OfficerKristina WangWebmaster
Leah CrumbakerSystems Engineer
AerodynamicsJeff Mullen
Kristina WangLeah
Crumbaker
Avionics/ ElectronicsMatthew
LendaJeff Mullen
Travis Schafhausen
SV DesignKristina Wang
Matthew LendaTravis
Schafhausen
Mechanics/ DeploymentScott Tatum
Jason FarmerLeah
Crumbaker
Software James Gordon
Matthew Lenda
Jeff Mullen
FabricationJason Farmer
TestJeff Mullen
Travis Schafhausen
Structures Jason FarmerScott Tatum
James Gordon
Eric FrewCustomer
Kurt MauteWilliam EmeryPAB Advisors
64
PMP
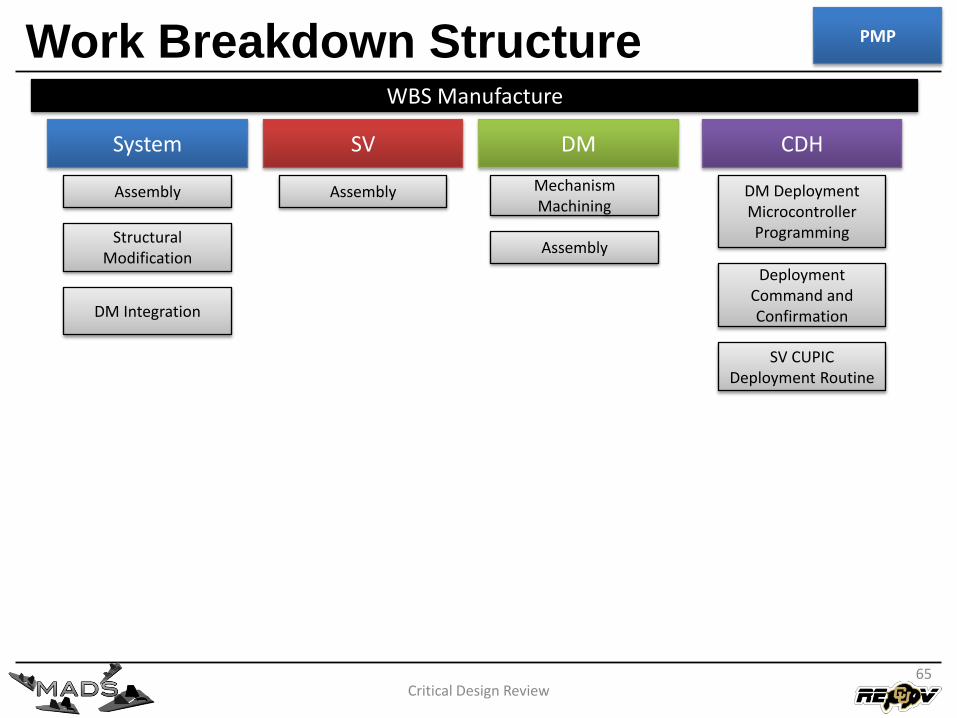
Work Breakdown Structure
Critical Design Review65
WBS Manufacture
System SV DM CDH
Assembly
Structural Modification
DM Integration
Assembly Mechanism Machining
Assembly
DM Deployment Microcontroller Programming
Deployment Command and Confirmation
SV CUPIC Deployment Routine
PMP
Work Breakdown Structure
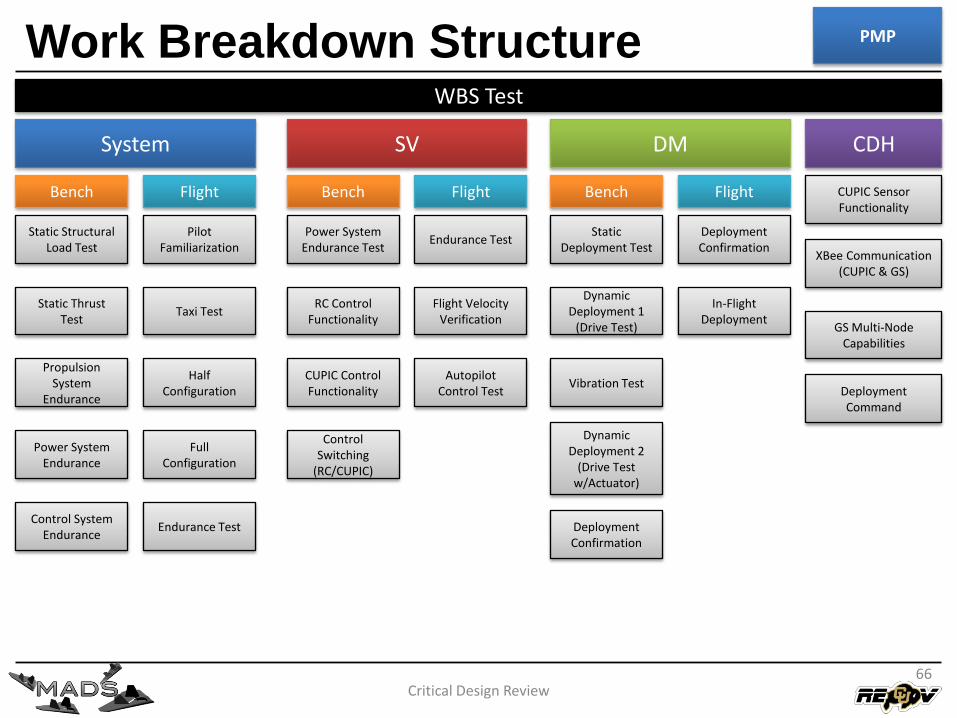
Critical Design Review66
System SV DM CDH
Static Structural Load Test
Static Thrust Test
Propulsion System
Endurance
Power System Endurance
Control System Endurance
Bench Flight
Pilot Familiarization
Taxi Test
Half Configuration
Full Configuration
Endurance Test
PMP
WBS Test
Power System Endurance Test
RC Control Functionality
CUPIC Control Functionality
Control Switching
(RC/CUPIC)
Endurance Test
Flight Velocity Verification
Autopilot Control Test
Static Deployment Test
Dynamic Deployment 1
(Drive Test)
Vibration Test
Dynamic Deployment 2
(Drive Test w/Actuator)
Deployment Confirmation
Deployment Confirmation
In-Flight Deployment
Bench Flight Bench Flight CUPIC Sensor Functionality
XBee Communication (CUPIC & GS)
GS Multi-Node Capabilities
Deployment Command
Risks
Critical Design Review
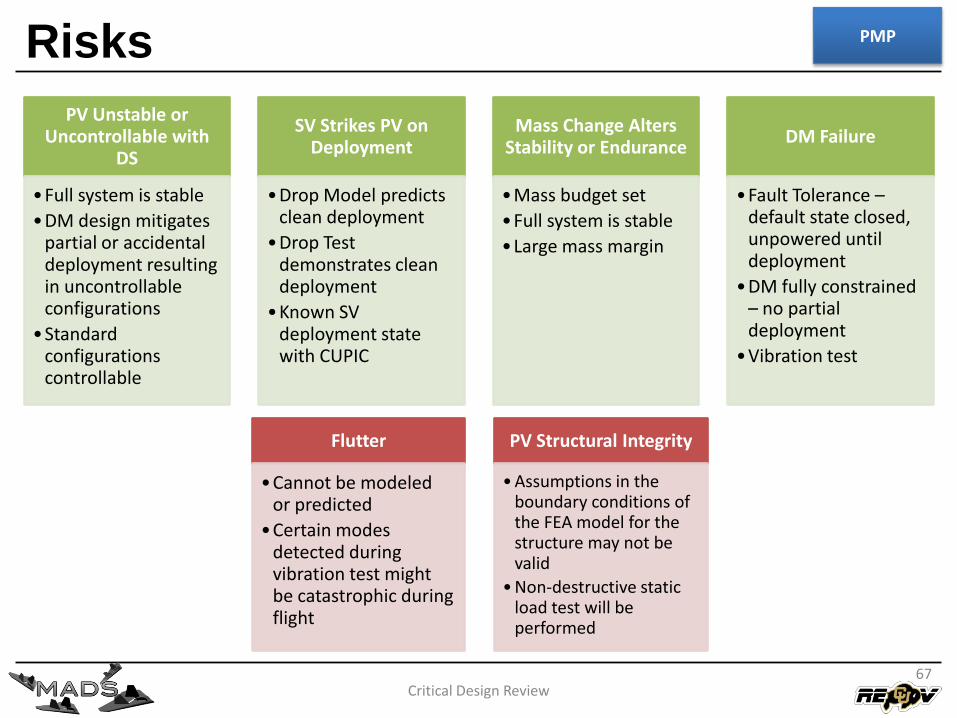
PV Unstable or Uncontrollable with
DS
•Full system is stable
•DM design mitigates partial or accidental deployment resulting in uncontrollable configurations
•Standard configurations controllable
SV Strikes PV on Deployment
•Drop Model predicts clean deployment
•Drop Test demonstrates clean deployment
•Known SV deployment state with CUPIC
Mass Change Alters Stability or Endurance
•Mass budget set
•Full system is stable
•Large mass margin
DM Failure
•Fault Tolerance –default state closed, unpowered until deployment
•DM fully constrained – no partial deployment
•Vibration test
PMP
Flutter
•Cannot be modeled or predicted
•Certain modes detected during vibration test might be catastrophic during flight
PV Structural Integrity
• Assumptions in the boundary conditions of the FEA model for the structure may not be valid
• Non-destructive static load test will be performed
67
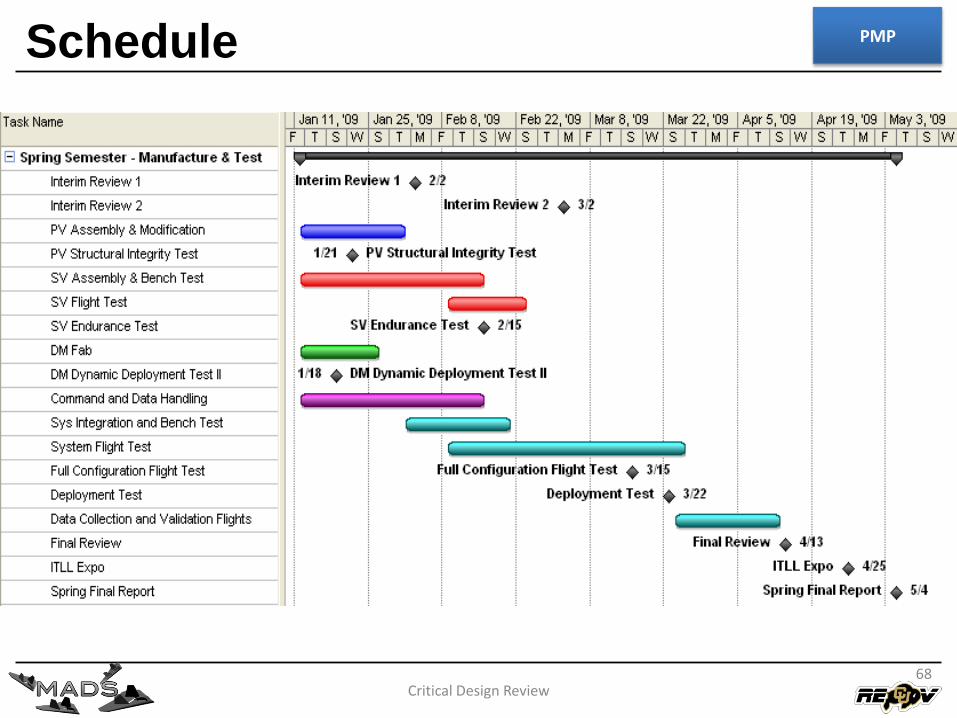
Schedule
Critical Design Review
PMP
68
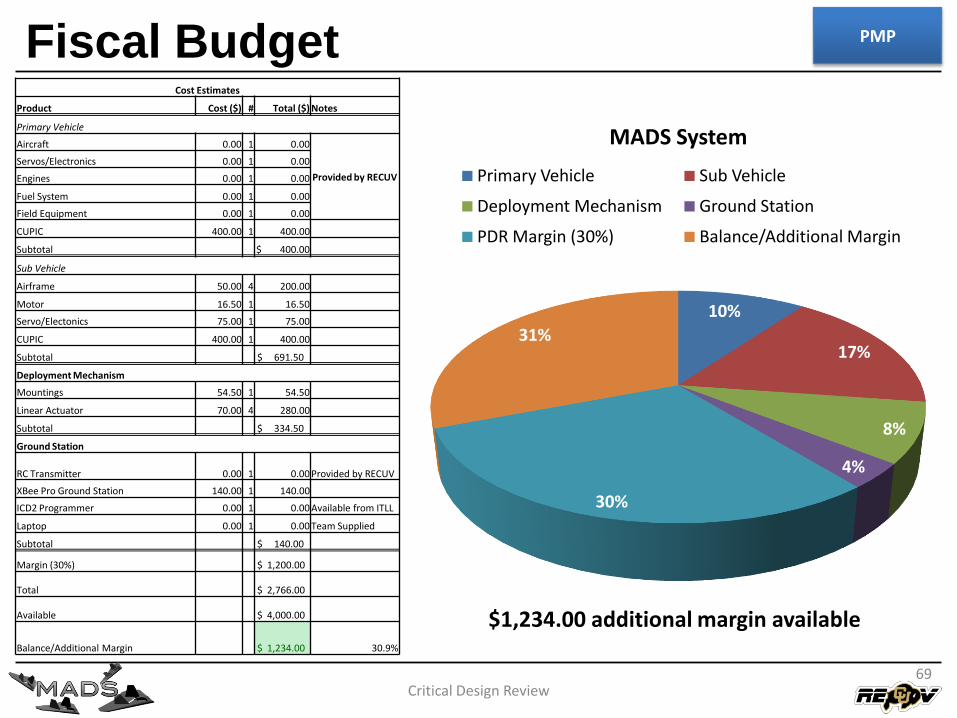
Fiscal Budget
Critical Design Review
Cost Estimates
Product Cost ($) # Total ($) Notes
Primary Vehicle
Aircraft 0.00 1 0.00
Provided by RECUV
Servos/Electronics 0.00 1 0.00
Engines 0.00 1 0.00
Fuel System 0.00 1 0.00
Field Equipment 0.00 1 0.00
CUPIC 400.00 1 400.00
Subtotal $ 400.00
Sub Vehicle
Airframe 50.00 4 200.00
Motor 16.50 1 16.50
Servo/Electonics 75.00 1 75.00
CUPIC 400.00 1 400.00
Subtotal $ 691.50
Deployment Mechanism
Mountings 54.50 1 54.50
Linear Actuator 70.00 4 280.00
Subtotal $ 334.50
Ground Station
RC Transmitter 0.00 1 0.00 Provided by RECUV
XBee Pro Ground Station 140.00 1 140.00
ICD2 Programmer 0.00 1 0.00 Available from ITLL
Laptop 0.00 1 0.00 Team Supplied
Subtotal $ 140.00
Margin (30%) $ 1,200.00
Total $ 2,766.00
Available $ 4,000.00
Balance/Additional Margin $ 1,234.00 30.9%
10%
17%
8%
4%
30%
31%
MADS System
Primary Vehicle Sub Vehicle
Deployment Mechanism Ground Station
PDR Margin (30%) Balance/Additional Margin
69
PMP
$1,234.00 additional margin available
Specialized Facilities & Resources
Critical Design Review
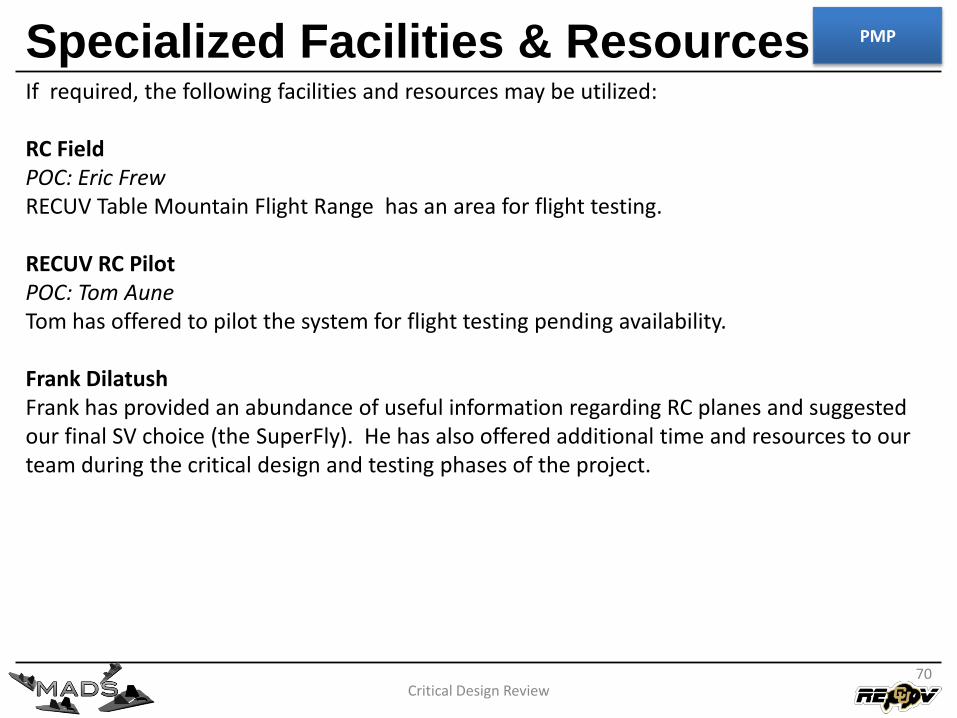
If required, the following facilities and resources may be utilized:
RC FieldPOC: Eric FrewRECUV Table Mountain Flight Range has an area for flight testing.
RECUV RC PilotPOC: Tom AuneTom has offered to pilot the system for flight testing pending availability.
Frank DilatushFrank has provided an abundance of useful information regarding RC planes and suggested our final SV choice (the SuperFly). He has also offered additional time and resources to our team during the critical design and testing phases of the project.
70
PMP
Conclusions
Critical Design Review
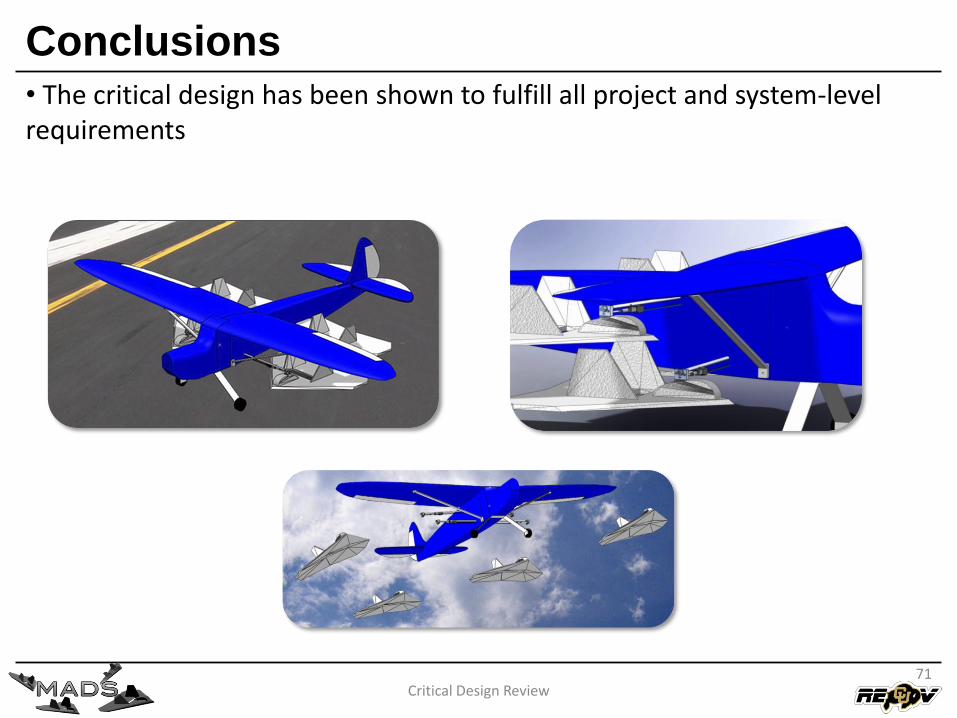
• The critical design has been shown to fulfill all project and system-level requirements
71
Acknowledgements
Critical Design Review
Prof. Bill Emery and Prof. Kurt Maute – Our faculty advisors have given useful feedback throughout the design process.Prof. Dale Lawrence – Dr. Lawrence supervised our wind tunnel testing and allowed us to use his equipment for data collection. Frank Dilatush – Frank has provided an abundance of useful information regarding RC planes and suggested our final SV choice. He has also offered additional time and resources to our team during the critical design and testing phases of the project.Eric Frew – Our customer has offered many hours in helping us develop our project goal and requirements.Georg Pingen – Georg assisted with CFD analysis by offering help with PowerFlow.David Halko– The designer and manufacturer of SuperFly RC planes has provided additional specifications and information about his products and offered future help with the project.Trudy Schwartz – Trudy has been a great help in our consideration of electromagnetic deployment during preliminary design. She has guided us in our calculations and component search. Bill Pisano – Bill has helped a great deal in aiding our understanding of the CUPIC.Tom Aune - Tom has helped with the selection of PV flight componentsPAB – The members of the PAB have provided constructive criticism, feedback, and guidance throughout project definition, development, and design.
72

Critical Design Review73
Questions?
Critical Design Review74
System Architecture
Design Elements
Manufacturing & System Integration Plan
Verification & Test Plan
Project Management Plan
Critical Design Review75
System Architecture
Design Elements
Manufacturing & System Integration Plan
Verification & Test Plan
Project Management Plan
Project Level Requirements
Critical Design Review76
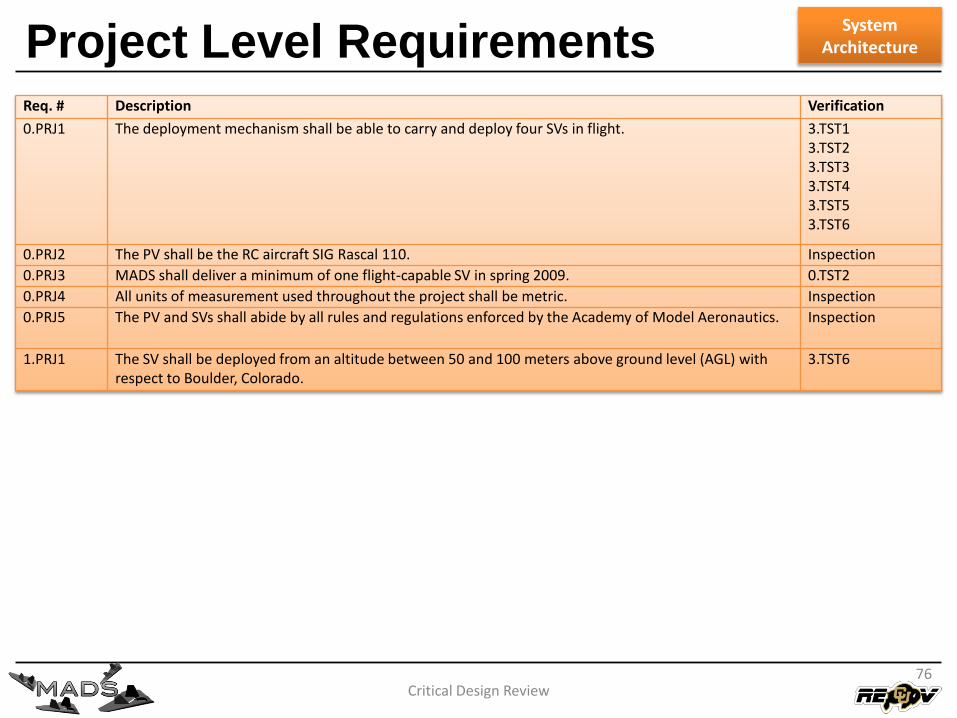
Req. # Description Verification
0.PRJ1 The deployment mechanism shall be able to carry and deploy four SVs in flight. 3.TST13.TST23.TST33.TST43.TST53.TST6
0.PRJ2 The PV shall be the RC aircraft SIG Rascal 110. Inspection
0.PRJ3 MADS shall deliver a minimum of one flight-capable SV in spring 2009. 0.TST2
0.PRJ4 All units of measurement used throughout the project shall be metric. Inspection
0.PRJ5 The PV and SVs shall abide by all rules and regulations enforced by the Academy of Model Aeronautics. Inspection
1.PRJ1 The SV shall be deployed from an altitude between 50 and 100 meters above ground level (AGL) with respect to Boulder, Colorado.
3.TST6
SystemArchitecture
System Level Requirements
Critical Design Review77
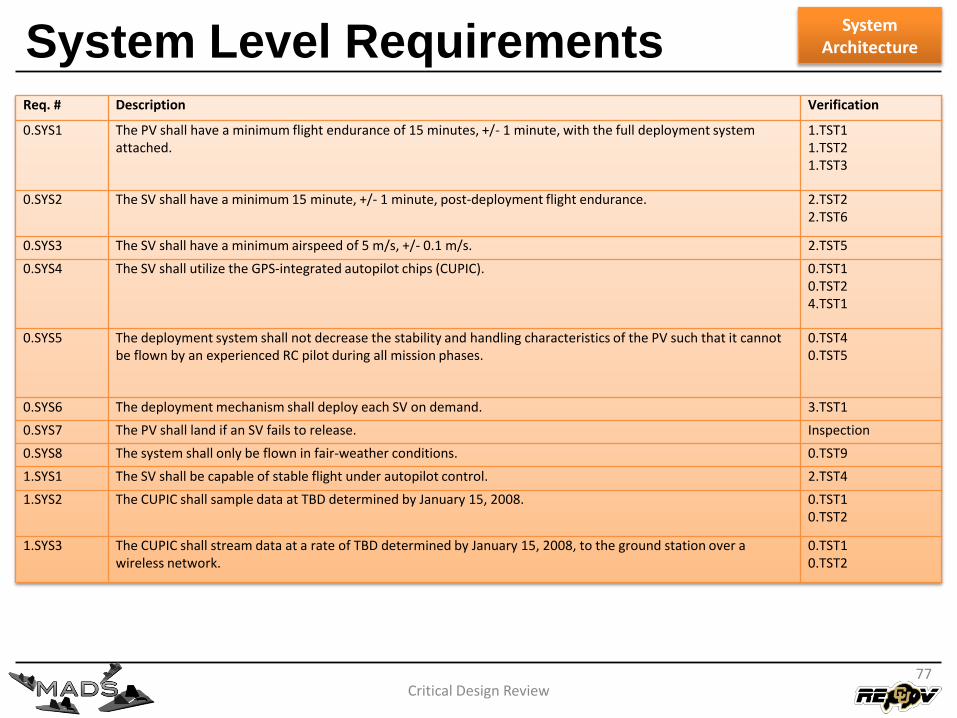
Req. # Description Verification
0.SYS1 The PV shall have a minimum flight endurance of 15 minutes, +/- 1 minute, with the full deployment system attached.
1.TST11.TST21.TST3
0.SYS2 The SV shall have a minimum 15 minute, +/- 1 minute, post-deployment flight endurance. 2.TST22.TST6
0.SYS3 The SV shall have a minimum airspeed of 5 m/s, +/- 0.1 m/s. 2.TST5
0.SYS4 The SV shall utilize the GPS-integrated autopilot chips (CUPIC). 0.TST10.TST24.TST1
0.SYS5 The deployment system shall not decrease the stability and handling characteristics of the PV such that it cannot be flown by an experienced RC pilot during all mission phases.
0.TST40.TST5
0.SYS6 The deployment mechanism shall deploy each SV on demand. 3.TST1
0.SYS7 The PV shall land if an SV fails to release. Inspection
0.SYS8 The system shall only be flown in fair-weather conditions. 0.TST9
1.SYS1 The SV shall be capable of stable flight under autopilot control. 2.TST4
1.SYS2 The CUPIC shall sample data at TBD determined by January 15, 2008. 0.TST10.TST2
1.SYS3 The CUPIC shall stream data at a rate of TBD determined by January 15, 2008, to the ground station over a wireless network.
0.TST10.TST2
SystemArchitecture
System Performance
Critical Design Review
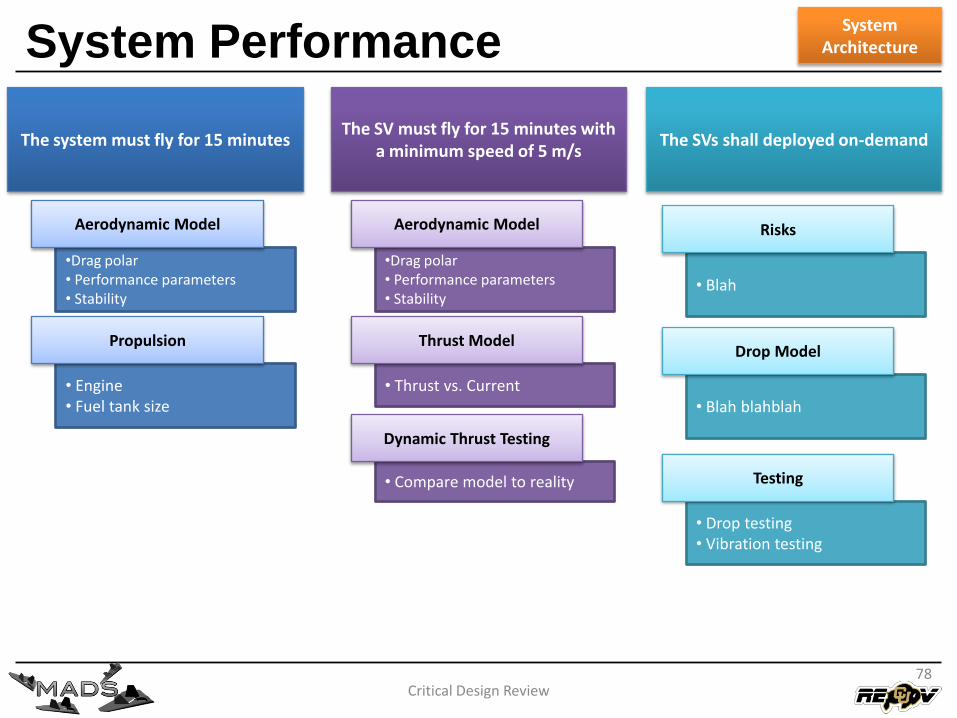
The system must fly for 15 minutesThe SV must fly for 15 minutes with
a minimum speed of 5 m/sThe SVs shall deployed on-demand
•Drag polar• Performance parameters• Stability
Aerodynamic Model
• Engine• Fuel tank size
Propulsion
•Drag polar• Performance parameters• Stability
Aerodynamic Model
• Thrust vs. Current
Thrust Model
• Compare model to reality
Dynamic Thrust Testing
• Blah
Risks
• Blah blahblah
Drop Model
• Drop testing• Vibration testing
Testing
78
SystemArchitecture
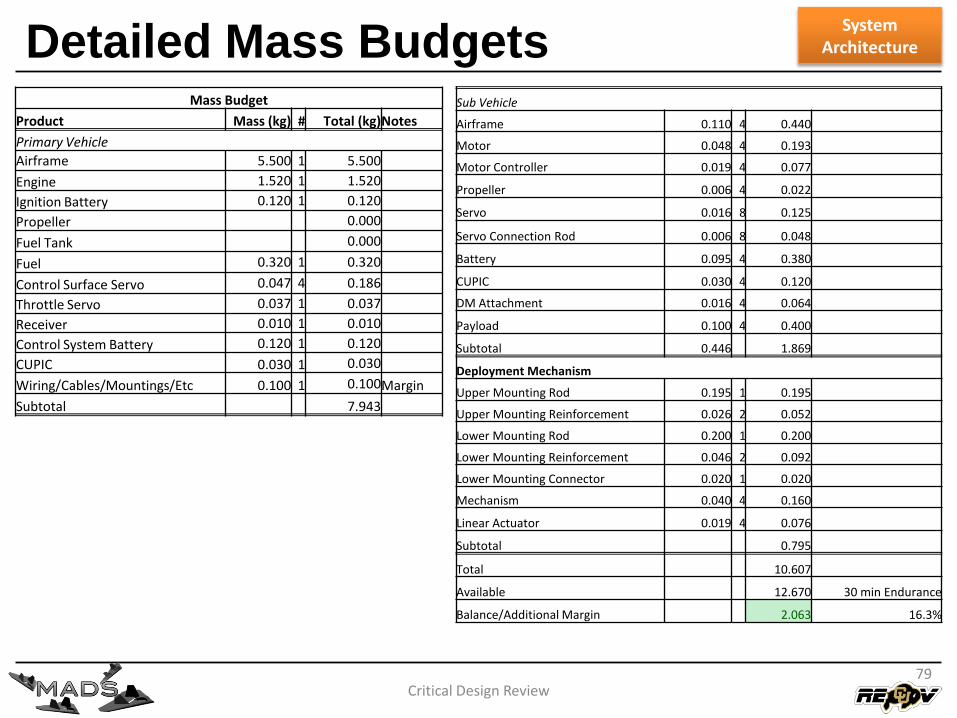
Detailed Mass Budgets
Critical Design Review
Mass Budget
Product Mass (kg) # Total (kg)Notes
Primary Vehicle
Airframe 5.500 1 5.500
Engine 1.520 1 1.520
Ignition Battery 0.120 1 0.120
Propeller 0.000
Fuel Tank 0.000
Fuel 0.320 1 0.320
Control Surface Servo 0.047 4 0.186
Throttle Servo 0.037 1 0.037
Receiver 0.010 1 0.010
Control System Battery 0.120 1 0.120
CUPIC 0.030 1 0.030
Wiring/Cables/Mountings/Etc 0.100 1 0.100Margin
Subtotal 7.943
Sub Vehicle
Airframe 0.110 4 0.440
Motor 0.048 4 0.193
Motor Controller 0.019 4 0.077
Propeller 0.006 4 0.022
Servo 0.016 8 0.125
Servo Connection Rod 0.006 8 0.048
Battery 0.095 4 0.380
CUPIC 0.030 4 0.120
DM Attachment 0.016 4 0.064
Payload 0.100 4 0.400
Subtotal 0.446 1.869
Deployment Mechanism
Upper Mounting Rod 0.195 1 0.195
Upper Mounting Reinforcement 0.026 2 0.052
Lower Mounting Rod 0.200 1 0.200
Lower Mounting Reinforcement 0.046 2 0.092
Lower Mounting Connector 0.020 1 0.020
Mechanism 0.040 4 0.160
Linear Actuator 0.019 4 0.076
Subtotal 0.795
Total 10.607
Available 12.670 30 min Endurance
Balance/Additional Margin 2.063 16.3%
79
SystemArchitecture
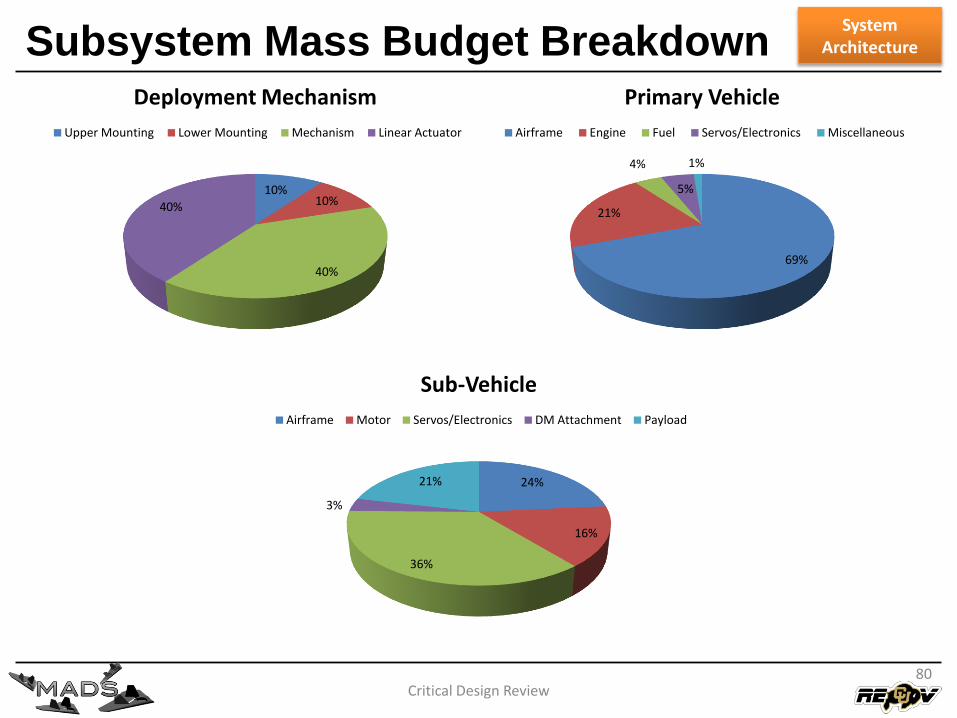
Subsystem Mass Budget Breakdown
Critical Design Review
10%10%
40%
40%
Deployment Mechanism
Upper Mounting Lower Mounting Mechanism Linear Actuator
69%
21%
4%
5%
1%
Primary Vehicle
Airframe Engine Fuel Servos/Electronics Miscellaneous
24%
16%
36%
3%
21%
Sub-Vehicle
Airframe Motor Servos/Electronics DM Attachment Payload
80
SystemArchitecture
Critical Design Review81
System Architecture
Design Elements
Manufacturing & System Integration Plan
Verification & Test Plan
Project Management Plan
Mechanical Design Elements (MDE)
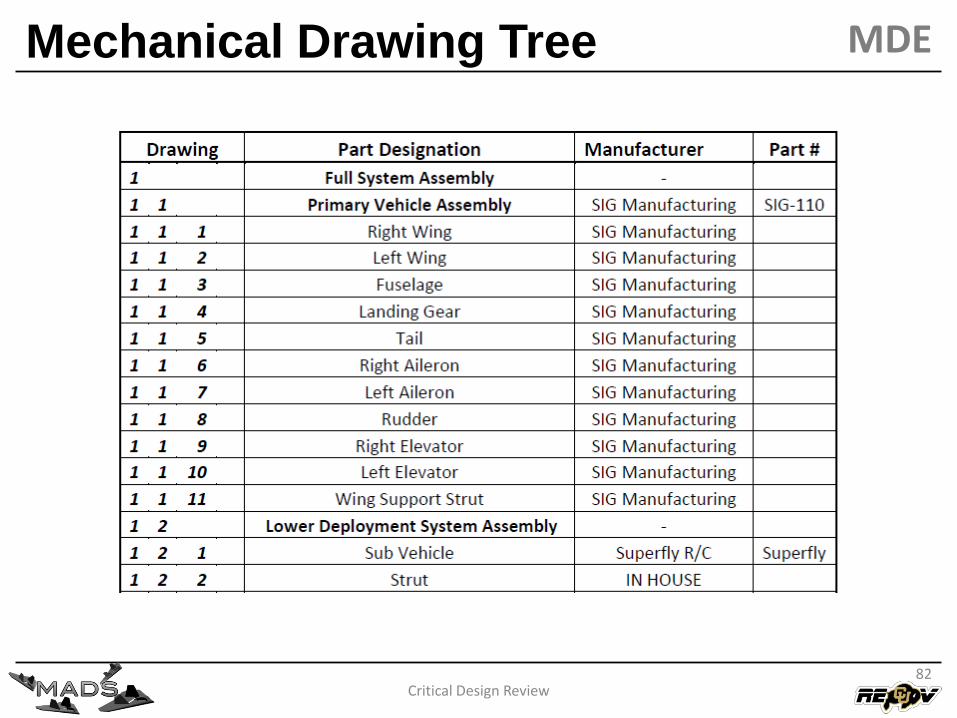
Mechanical Drawing Tree
Critical Design Review82
MDE
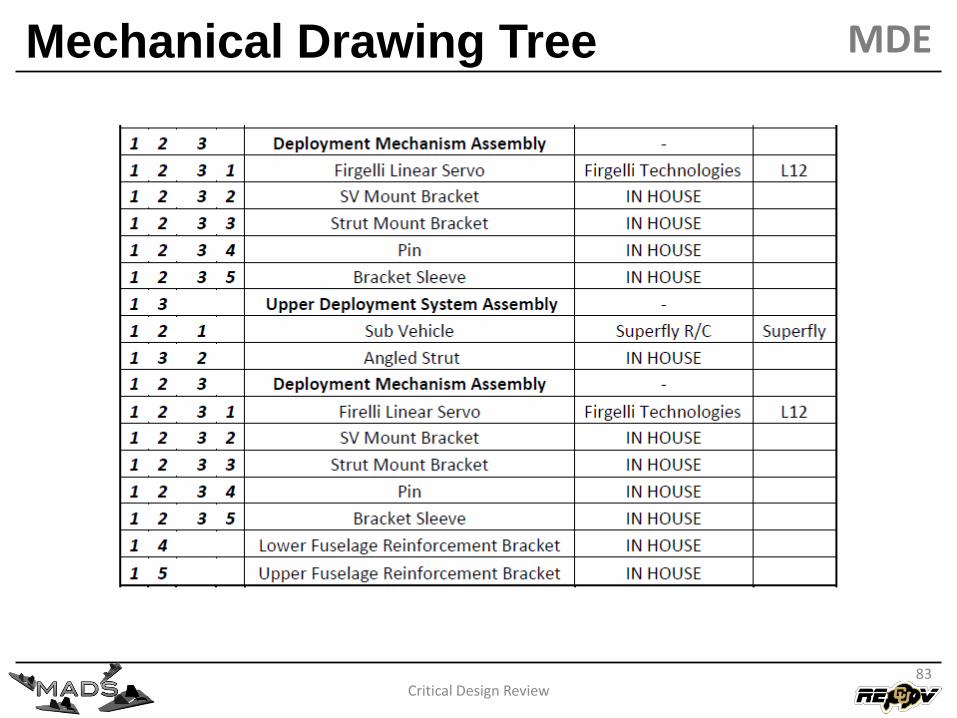
Mechanical Drawing Tree
Critical Design Review83
MDE
Critical Design Review84
Deployment Mechanism
SV Mounting Bracket
Critical Design Review
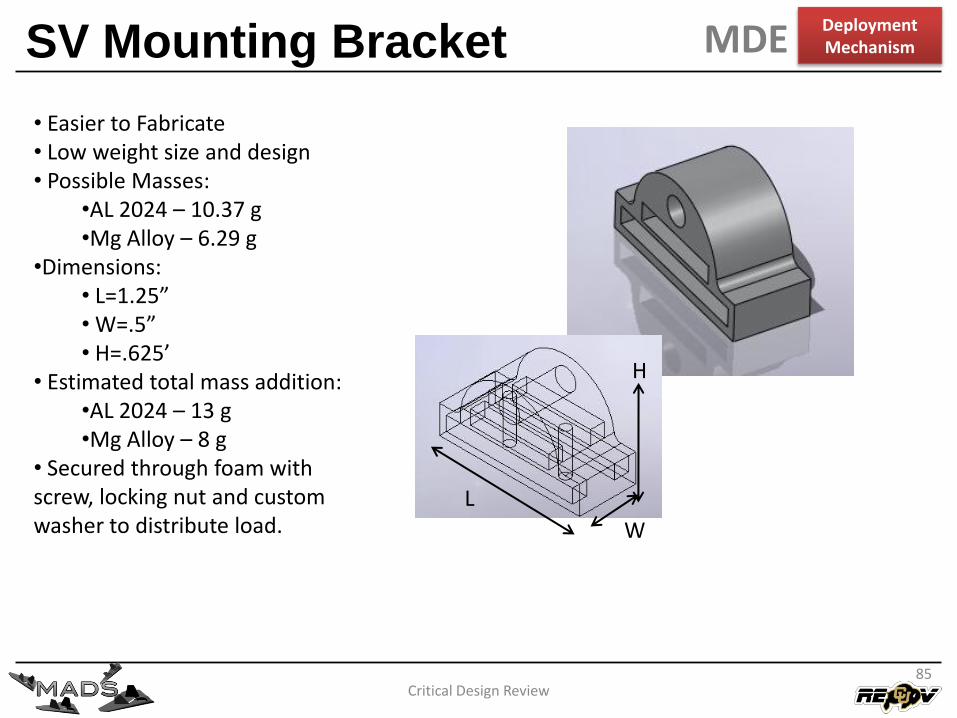
• Easier to Fabricate• Low weight size and design• Possible Masses:
•AL 2024 – 10.37 g•Mg Alloy – 6.29 g
•Dimensions:• L=1.25”• W=.5”• H=.625’
• Estimated total mass addition:•AL 2024 – 13 g•Mg Alloy – 8 g
• Secured through foam with screw, locking nut and custom washer to distribute load.
L
W
H
85
Deployment MechanismMDE
Material Trade Study
Critical Design Review
MaterialDensity
(lbs/in^3)Elastic
Modulus (ksi)Specific Modulus
(in)Compressive Yield
Strength(ksi)
Magnesium 0.067 6380 94813.49 21.176
Aluminum Alloy 0.102 10400 102362.20 33.214
High Density PE 0.035 120 3458.21 -
ABS Plastic 0.034 300 8875.74 -
Acrylic 0.042 230 5418.14 13.927
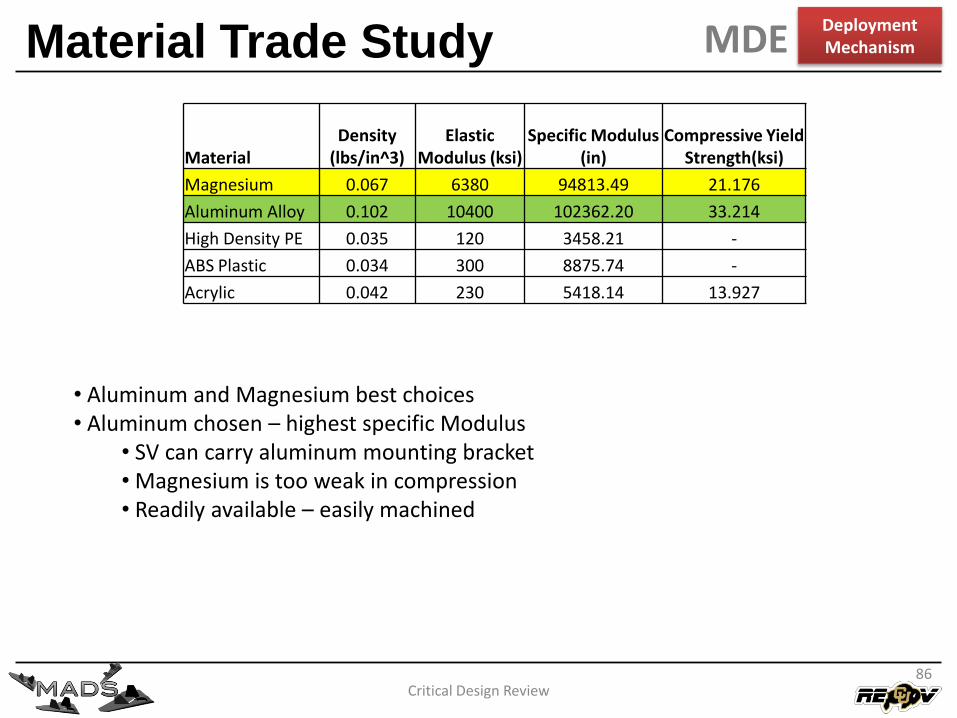
• Aluminum and Magnesium best choices • Aluminum chosen – highest specific Modulus
• SV can carry aluminum mounting bracket• Magnesium is too weak in compression• Readily available – easily machined
86
Deployment MechanismMDE
Deployment: Static Test
Critical Design Review
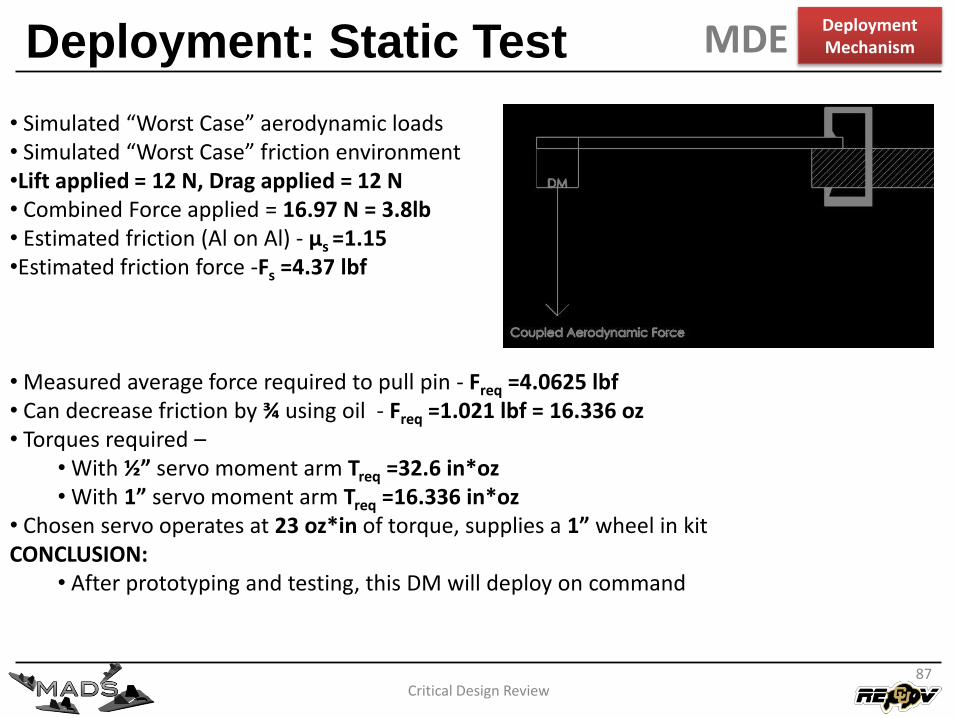
• Simulated “Worst Case” aerodynamic loads • Simulated “Worst Case” friction environment•Lift applied = 12 N, Drag applied = 12 N• Combined Force applied = 16.97 N = 3.8lb• Estimated friction (Al on Al) - μs =1.15•Estimated friction force -Fs =4.37 lbf
• Measured average force required to pull pin - Freq =4.0625 lbf• Can decrease friction by ¾ using oil - Freq =1.021 lbf = 16.336 oz• Torques required –
• With ½” servo moment arm Treq =32.6 in*oz• With 1” servo moment arm Treq =16.336 in*oz
• Chosen servo operates at 23 oz*in of torque, supplies a 1” wheel in kitCONCLUSION:
• After prototyping and testing, this DM will deploy on command
87
Deployment MechanismMDE
Drop Test #1 Set-Up
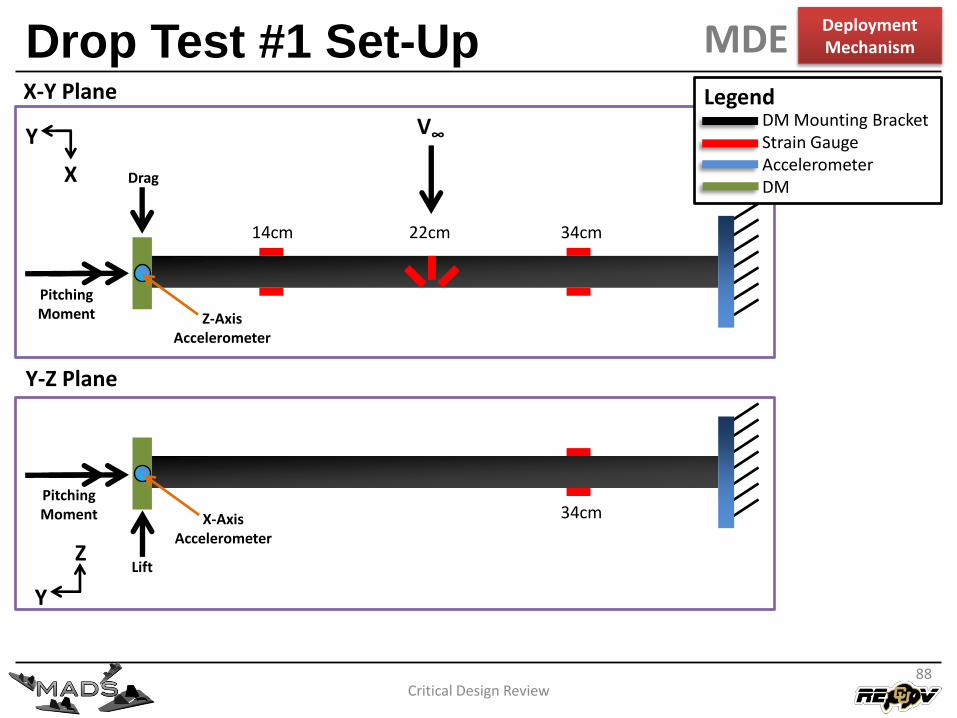
Critical Design Review
14cm
Y
X
V∞
22cm 34cm
Drag
PitchingMoment Z-Axis
Accelerometer
34cm
Y
Z
X-AxisAccelerometer
PitchingMoment
Lift
DM Mounting BracketStrain GaugeAccelerometerDM
Legend
Y-Z Plane
X-Y Plane
88
Deployment MechanismMDE
Vibration Analysis
Critical Design Review
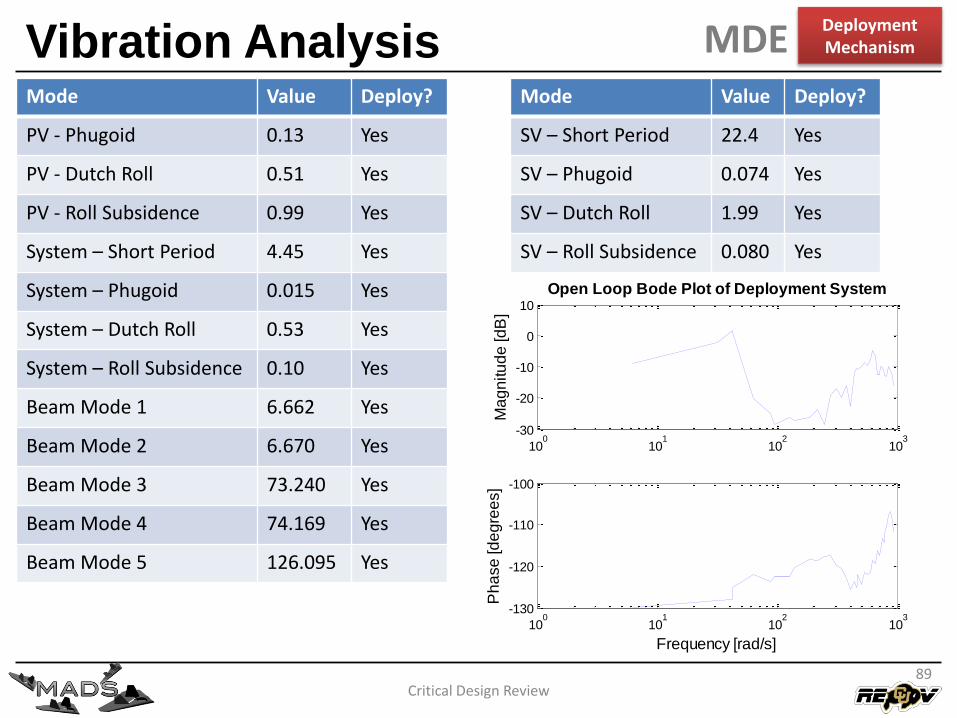
Mode Value Deploy?
PV - Phugoid 0.13 Yes
PV - Dutch Roll 0.51 Yes
PV - Roll Subsidence 0.99 Yes
System – Short Period 4.45 Yes
System – Phugoid 0.015 Yes
System – Dutch Roll 0.53 Yes
System – Roll Subsidence 0.10 Yes
Beam Mode 1 6.662 Yes
Beam Mode 2 6.670 Yes
Beam Mode 3 73.240 Yes
Beam Mode 4 74.169 Yes
Beam Mode 5 126.095 Yes
Mode Value Deploy?
SV – Short Period 22.4 Yes
SV – Phugoid 0.074 Yes
SV – Dutch Roll 1.99 Yes
SV – Roll Subsidence 0.080 Yes
100
101
102
103
-30
-20
-10
0
10
Ma
gn
itu
de
[d
B]
Open Loop Bode Plot of Deployment System
100
101
102
103
-130
-120
-110
-100
Frequency [rad/s]
Ph
ase
[d
eg
ree
s]
89
Deployment MechanismMDE
Sub-Vehicle Drop Model
Critical Design Review90
Methodology:• Force/Moment sum from PowerFLOW data• Numerical integration to calculate position, velocity, pitch angle, and flight path angle
Features:• Variable initial conditions• Deployment mechanism constraint in horizontal/vertical directions• Variable thrust/elevon input as a function of time• Collision detection
• Projections of collision areas made onto X-Z plane• Wing, wheel-casing, and non-deployed sub-vehicle boxed for efficiency• Deployed sub-vehicle uses simplified shadow as seen in relative motion plot• Collision detected by detecting intersecting line segments
Deployment MechanismMDE
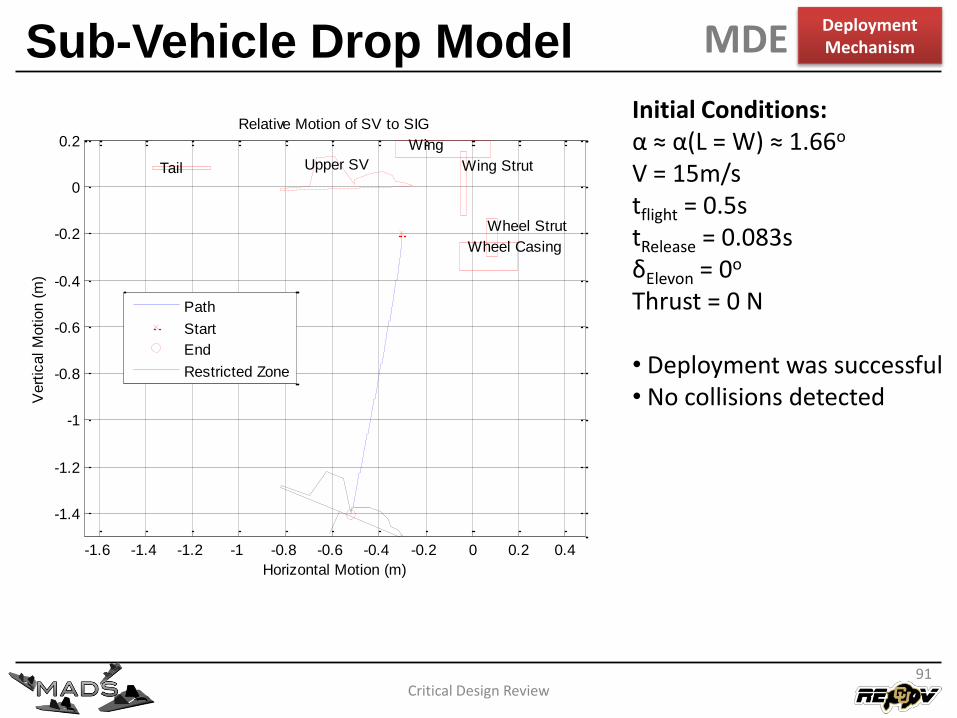
Sub-Vehicle Drop Model
Critical Design Review91
-1.6 -1.4 -1.2 -1 -0.8 -0.6 -0.4 -0.2 0 0.2 0.4
-1.4
-1.2
-1
-0.8
-0.6
-0.4
-0.2
0
0.2
Tail
Wing
Wing Strut
Wheel Strut
Wheel Casing
Upper SV
Relative Motion of SV to SIG
Horizontal Motion (m)
Vert
ical M
otion (
m)
Path
Start
End
Restricted Zone
Initial Conditions:α ≈ α(L = W) ≈ 1.66o
V = 15m/stflight = 0.5stRelease = 0.083sδElevon = 0o
Thrust = 0 N
• Deployment was successful• No collisions detected
Deployment MechanismMDE
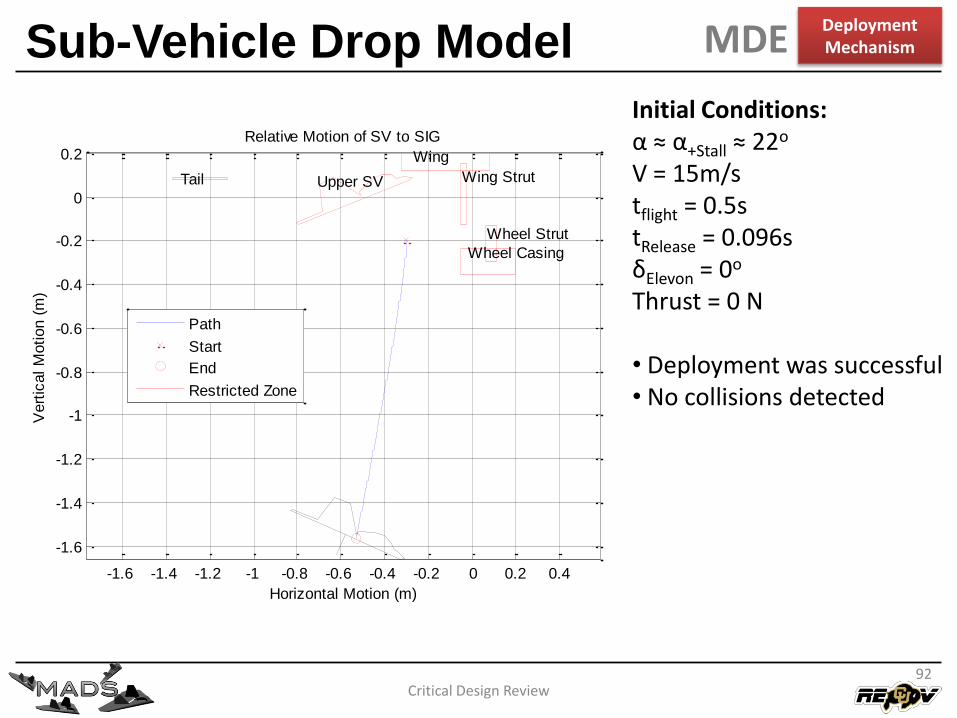
Sub-Vehicle Drop Model
Critical Design Review92
Initial Conditions:α ≈ α+Stall ≈ 22o
V = 15m/stflight = 0.5stRelease = 0.096sδElevon = 0o
Thrust = 0 N
• Deployment was successful• No collisions detected
-1.6 -1.4 -1.2 -1 -0.8 -0.6 -0.4 -0.2 0 0.2 0.4
-1.6
-1.4
-1.2
-1
-0.8
-0.6
-0.4
-0.2
0
0.2
Tail
Wing
Wing Strut
Wheel Strut
Wheel Casing
Upper SV
Relative Motion of SV to SIG
Horizontal Motion (m)
Vert
ical M
otion (
m)
Path
Start
End
Restricted Zone
Deployment MechanismMDE
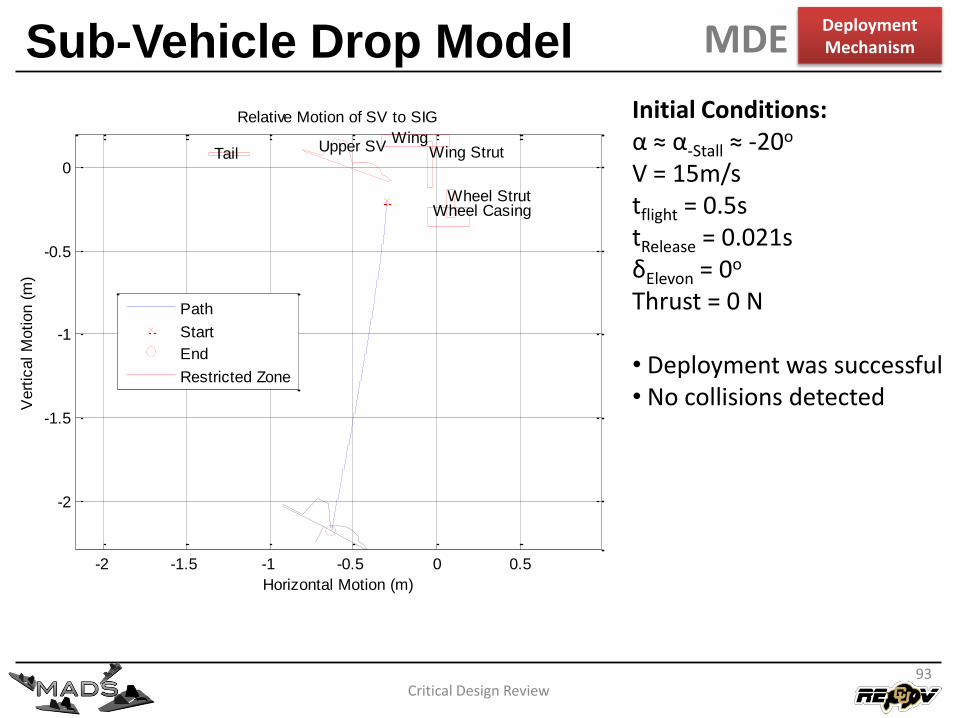
Sub-Vehicle Drop Model
Critical Design Review93
Initial Conditions:α ≈ α-Stall ≈ -20o
V = 15m/stflight = 0.5stRelease = 0.021sδElevon = 0o
Thrust = 0 N
• Deployment was successful• No collisions detected
-2 -1.5 -1 -0.5 0 0.5
-2
-1.5
-1
-0.5
0Tail
WingWing Strut
Wheel StrutWheel Casing
Upper SV
Relative Motion of SV to SIG
Horizontal Motion (m)
Vert
ical M
otion (
m)
Path
Start
End
Restricted Zone
Deployment MechanismMDE

Sub-Vehicle Drop Model
Critical Design Review94
Initial Conditions:α ≈ α(L = W) ≈ 1.66o
V = 15m/stflight = 0.5stRelease = 0.036sδElevon = δElevon, +Max = 25o
Thrust = 0N
• Deployment was successful• No collisions detected• Vehicle stalls after 0.0560s
-1.2 -1 -0.8 -0.6 -0.4 -0.2 0
-0.6
-0.4
-0.2
0
0.2
0.4
Tail
Wing
Wing Strut
Wheel Strut
Wheel Casing
Upper SV
Relative Motion of SV to SIG
Horizontal Motion (m)
Vert
ical M
otion (
m)
Path
Start
End
Restricted Zone
Deployment MechanismMDE

Sub-Vehicle Drop Model
Critical Design Review95
Initial Conditions:α ≈ α(L = W) ≈ 1.66o
V = 15m/stflight = 3stRelease = 1.630sδElevon = 15o
Thrust = 0 N
• Deployment was successful• No collisions detected
-3.5 -3 -2.5 -2 -1.5 -1 -0.5 0 0.5 1
-3.5
-3
-2.5
-2
-1.5
-1
-0.5
0Tail
WingWing Strut
Wheel StrutWheel Casing
Upper SV
Relative Motion of SV to SIG
Horizontal Motion (m)
Vert
ical M
otion (
m)
Path
Start
End
Restricted Zone
Deployment MechanismMDE

Sub-Vehicle Drop Model
Critical Design Review96
Initial Conditions:α ≈ α(L = W) ≈ 1.66o
V = 15m/stflight = 0.5stRelease = 0.129 sδElevon = 5o
Thrust = 0 N
• Deployment was successful• No collisions detected
-1.2 -1 -0.8 -0.6 -0.4 -0.2 0
-0.6
-0.4
-0.2
0
0.2
0.4
Tail
Wing
Wing Strut
Wheel Strut
Wheel Casing
Upper SV
Relative Motion of SV to SIG
Horizontal Motion (m)
Vert
ical M
otion (
m)
Path
Start
End
Restricted Zone
Deployment MechanismMDE
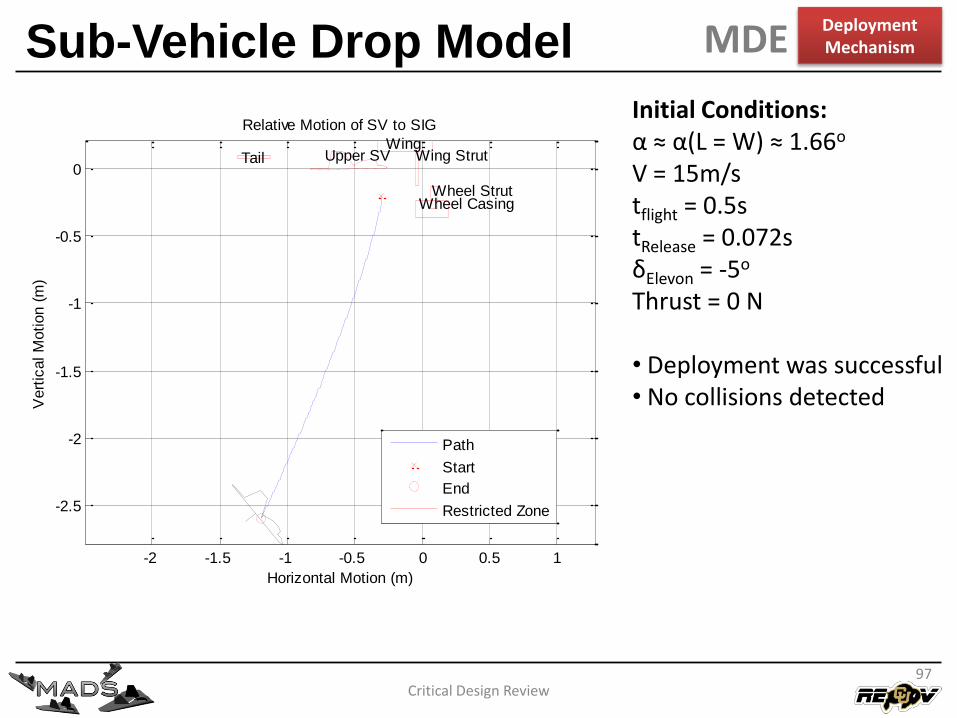
Sub-Vehicle Drop Model
Critical Design Review97
Initial Conditions:α ≈ α(L = W) ≈ 1.66o
V = 15m/stflight = 0.5stRelease = 0.072sδElevon = -5o
Thrust = 0 N
• Deployment was successful• No collisions detected
-2 -1.5 -1 -0.5 0 0.5 1
-2.5
-2
-1.5
-1
-0.5
0Tail
WingWing Strut
Wheel StrutWheel Casing
Upper SV
Relative Motion of SV to SIG
Horizontal Motion (m)
Vert
ical M
otion (
m)
Path
Start
End
Restricted Zone
Deployment MechanismMDE
Sub-Vehicle Drop Model
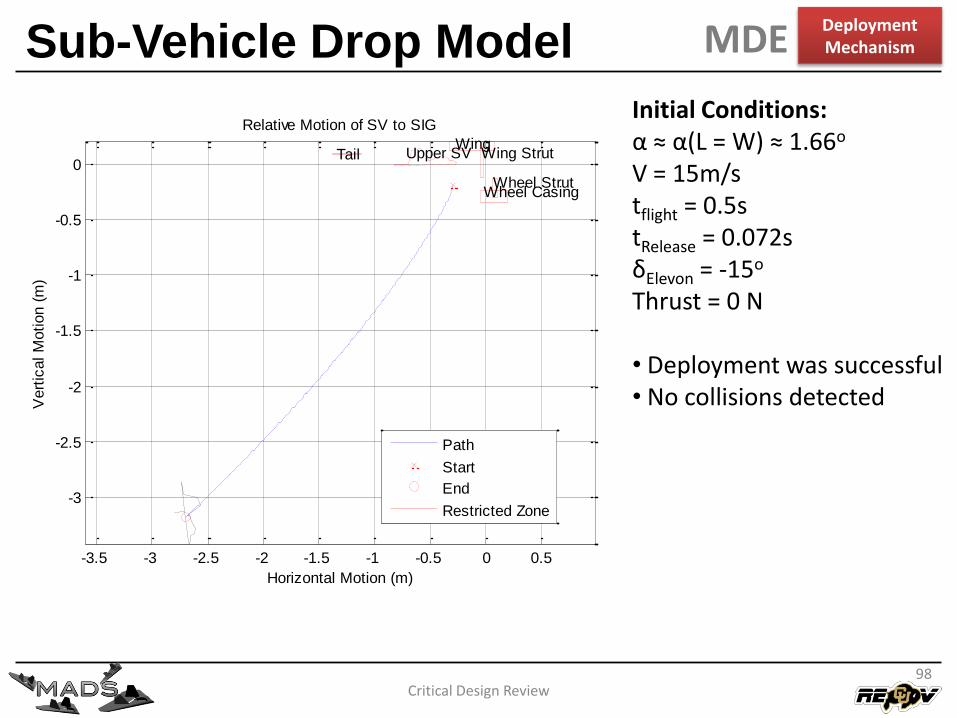
Critical Design Review98
Initial Conditions:α ≈ α(L = W) ≈ 1.66o
V = 15m/stflight = 0.5stRelease = 0.072sδElevon = -15o
Thrust = 0 N
• Deployment was successful• No collisions detected
-3.5 -3 -2.5 -2 -1.5 -1 -0.5 0 0.5
-3
-2.5
-2
-1.5
-1
-0.5
0Tail
WingWing Strut
Wheel StrutWheel Casing
Upper SV
Relative Motion of SV to SIG
Horizontal Motion (m)
Vert
ical M
otion (
m)
Path
Start
End
Restricted Zone
Deployment MechanismMDE
Sub-Vehicle Drop Model
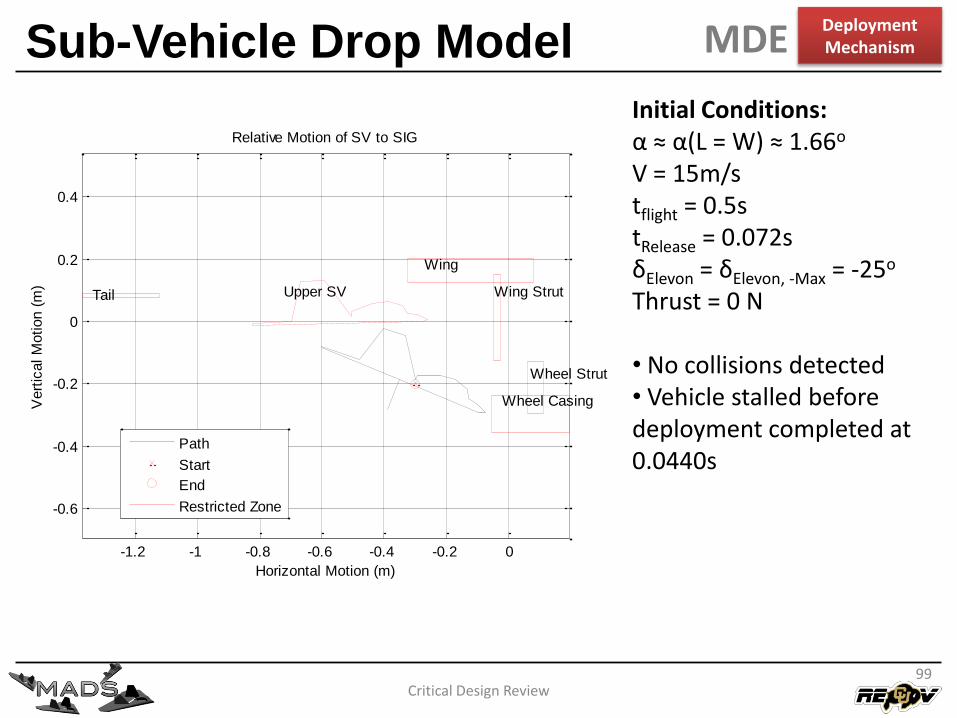
Critical Design Review99
Initial Conditions:α ≈ α(L = W) ≈ 1.66o
V = 15m/stflight = 0.5stRelease = 0.072sδElevon = δElevon, -Max = -25o
Thrust = 0 N
• No collisions detected• Vehicle stalled before deployment completed at 0.0440s
-1.2 -1 -0.8 -0.6 -0.4 -0.2 0
-0.6
-0.4
-0.2
0
0.2
0.4
Tail
Wing
Wing Strut
Wheel Strut
Wheel Casing
Upper SV
Relative Motion of SV to SIG
Horizontal Motion (m)
Vert
ical M
otion (
m)
Path
Start
End
Restricted Zone
Deployment MechanismMDE

Critical Design Review100
Mounting Locations
Mounting Model FBD
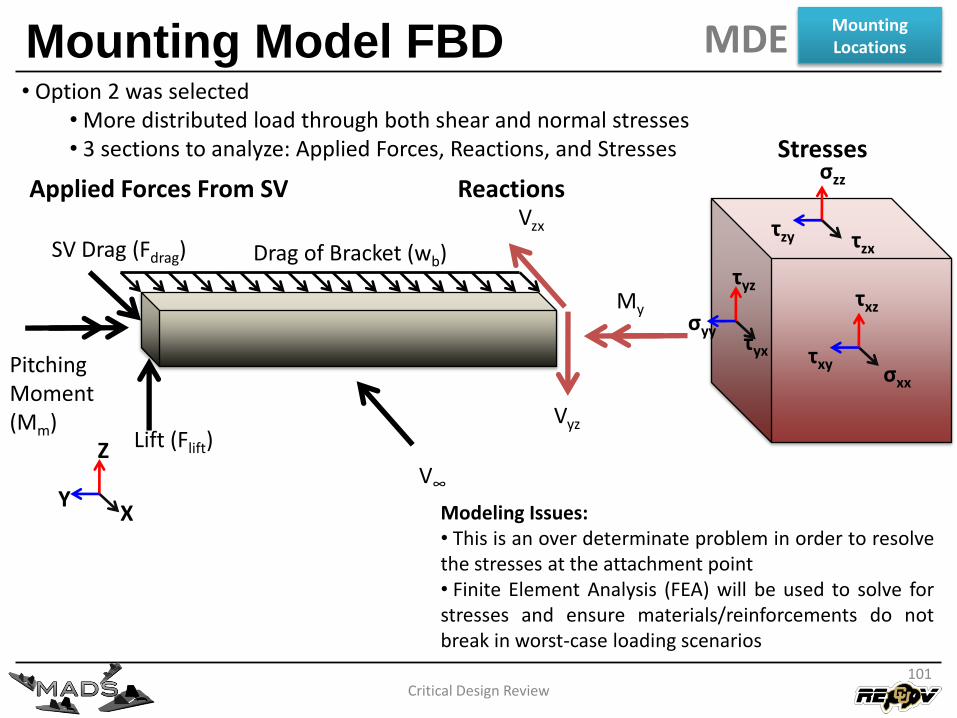
Critical Design Review
• Option 2 was selected• More distributed load through both shear and normal stresses• 3 sections to analyze: Applied Forces, Reactions, and Stresses
V∞
σzz
τzxτzy
σyyτyx
τyz
σxx
τxz
τxy
SV Drag (Fdrag)
Lift (Flift)
Drag of Bracket (wb)
PitchingMoment(Mm) Vyz
Vzx
My
Reactions
YX
Z
Applied Forces From SV
Stresses
Modeling Issues:• This is an over determinate problem in order to resolvethe stresses at the attachment point• Finite Element Analysis (FEA) will be used to solve forstresses and ensure materials/reinforcements do notbreak in worst-case loading scenarios
101
MDEMountingLocations
Applied Loads
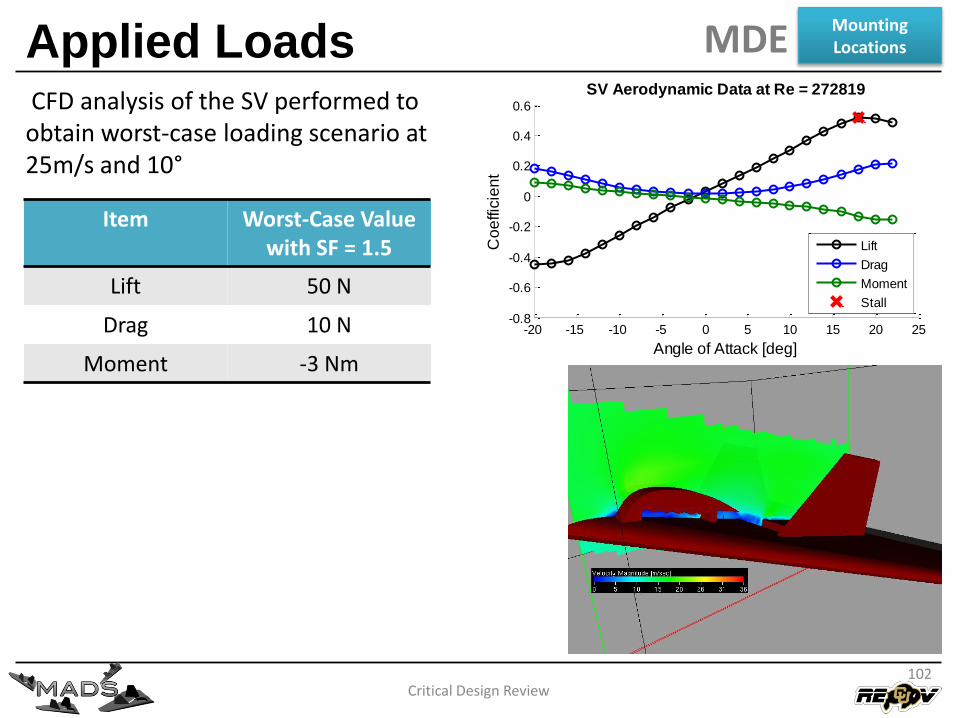
Critical Design Review
CFD analysis of the SV performed to obtain worst-case loading scenario at 25m/s and 10°
Item Worst-Case Value with SF = 1.5
Lift 50 N
Drag 10 N
Moment -3 Nm
-20 -15 -10 -5 0 5 10 15 20 25-0.8
-0.6
-0.4
-0.2
0
0.2
0.4
0.6
SV Aerodynamic Data at Re = 272819
Angle of Attack [deg]
Co
effic
ien
t
Lift
Drag
Moment
Stall
102
MDEMountingLocations
Ideal Mounting Locations
Critical Design Review
-1.6 -1.4 -1.2 -1 -0.8 -0.6 -0.4 -0.2 0 0.2 0.4
-1.6
-1.4
-1.2
-1
-0.8
-0.6
-0.4
-0.2
0
0.2
Tail
Wing
Wing Strut
Wheel Strut
Wheel Casing
Upper SV
Relative Motion of SV to SIG
Horizontal Motion (m)V
ert
ical M
otion (
m)
Path
Start
End
Restricted Zone
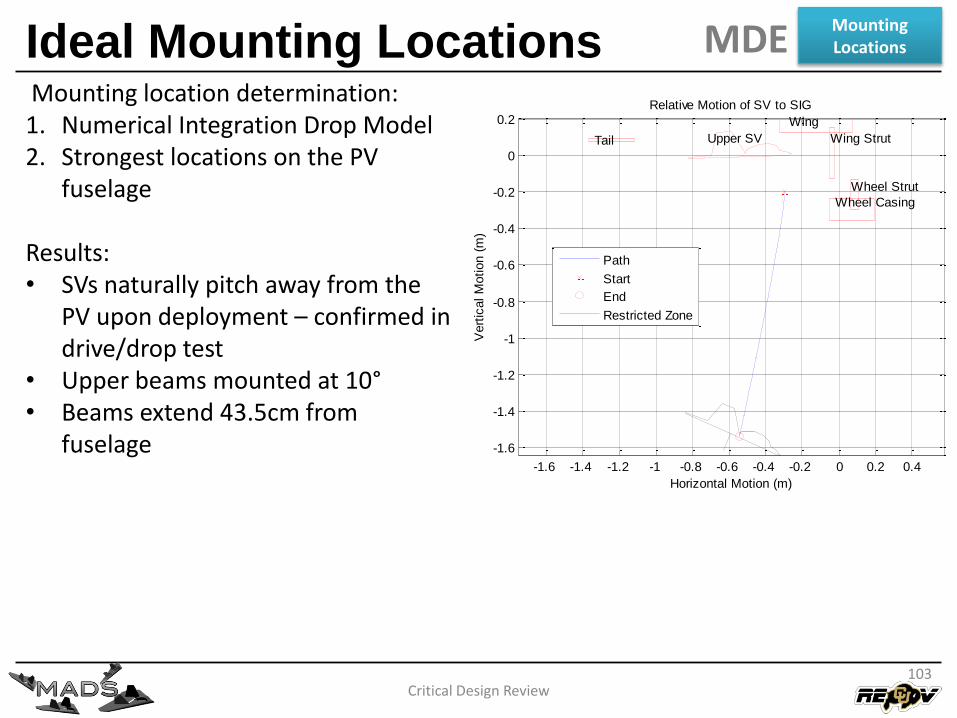
Mounting location determination:1. Numerical Integration Drop Model2. Strongest locations on the PV
fuselage
Results:• SVs naturally pitch away from the
PV upon deployment – confirmed in drive/drop test
• Upper beams mounted at 10°• Beams extend 43.5cm from
fuselage
103
MDEMountingLocations
Mounting Option Trade Study
Critical Design Review
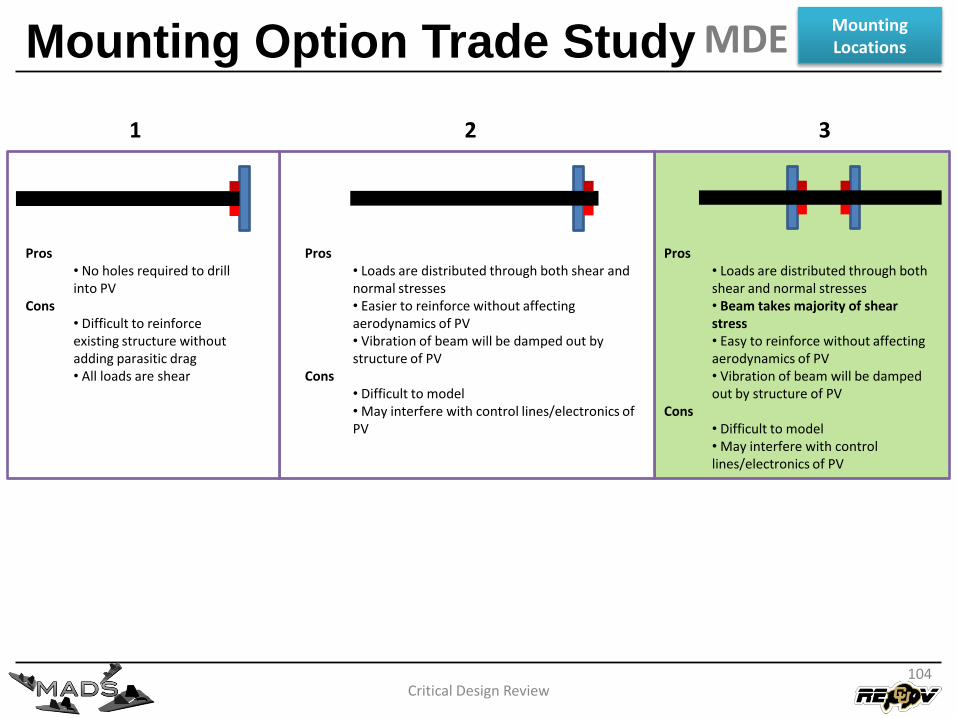
Pros• No holes required to drill into PV
Cons• Difficult to reinforce existing structure without adding parasitic drag• All loads are shear
Pros• Loads are distributed through both shear and normal stresses• Easier to reinforce without affecting aerodynamics of PV• Vibration of beam will be damped out by structure of PV
Cons• Difficult to model• May interfere with control lines/electronics of PV
Pros• Loads are distributed through both shear and normal stresses• Beam takes majority of shear stress• Easy to reinforce without affecting aerodynamics of PV• Vibration of beam will be damped out by structure of PV
Cons• Difficult to model• May interfere with control lines/electronics of PV
1 2 3
104
MDEMountingLocations
Material Testing
Critical Design Review
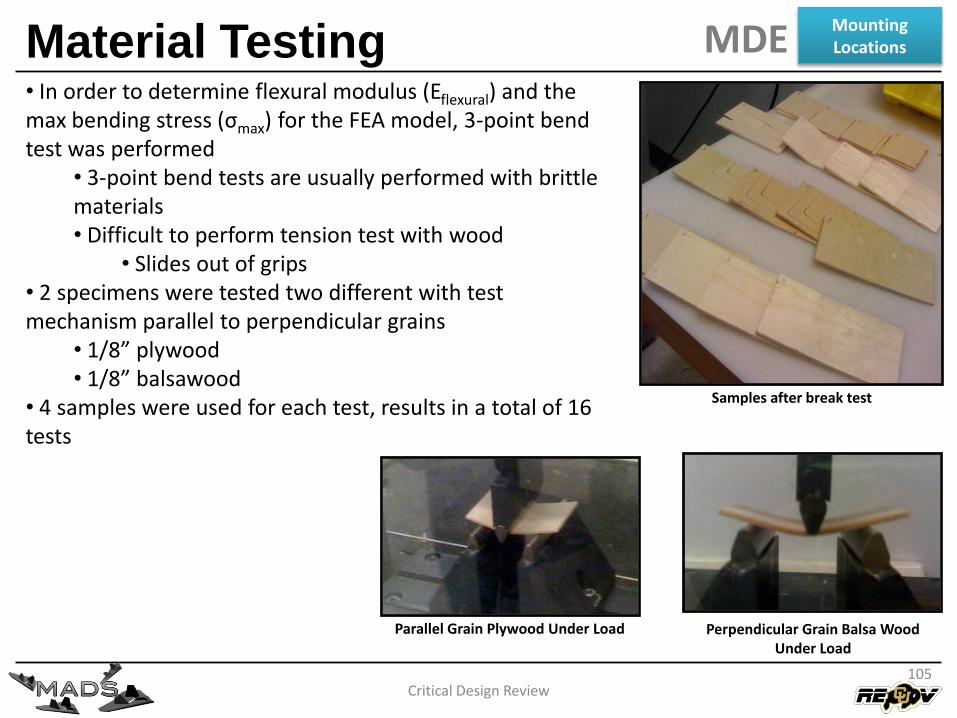
• In order to determine flexural modulus (Eflexural) and the max bending stress (σmax) for the FEA model, 3-point bend test was performed
• 3-point bend tests are usually performed with brittle materials• Difficult to perform tension test with wood
• Slides out of grips• 2 specimens were tested two different with test mechanism parallel to perpendicular grains
• 1/8” plywood• 1/8” balsawood
• 4 samples were used for each test, results in a total of 16 tests
Samples after break test
Perpendicular Grain Balsa Wood Under Load
Parallel Grain Plywood Under Load
105
MDEMountingLocations
Material Testing
Critical Design Review
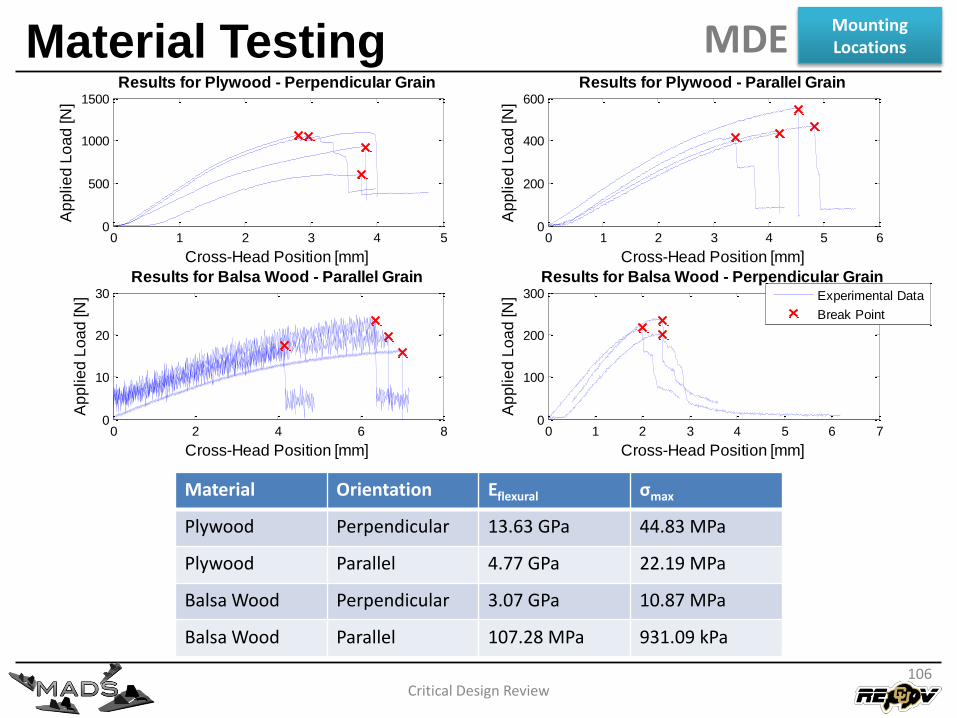
Material Orientation Eflexural σmax
Plywood Perpendicular 13.63 GPa 44.83 MPa
Plywood Parallel 4.77 GPa 22.19 MPa
Balsa Wood Perpendicular 3.07 GPa 10.87 MPa
Balsa Wood Parallel 107.28 MPa 931.09 kPa
0 1 2 3 4 50
500
1000
1500
Results for Plywood - Perpendicular Grain
Cross-Head Position [mm]
Ap
plie
d L
oa
d [N
]
0 1 2 3 4 5 60
200
400
600
Results for Plywood - Parallel Grain
Cross-Head Position [mm]
Ap
plie
d L
oa
d [N
]
0 2 4 6 80
10
20
30
Results for Balsa Wood - Parallel Grain
Cross-Head Position [mm]
Ap
plie
d L
oa
d [N
]
0 1 2 3 4 5 6 70
100
200
300
Results for Balsa Wood - Perpendicular Grain
Cross-Head Position [mm]
Ap
plie
d L
oa
d [N
]
Experimental Data
Break Point
106
MDEMountingLocations
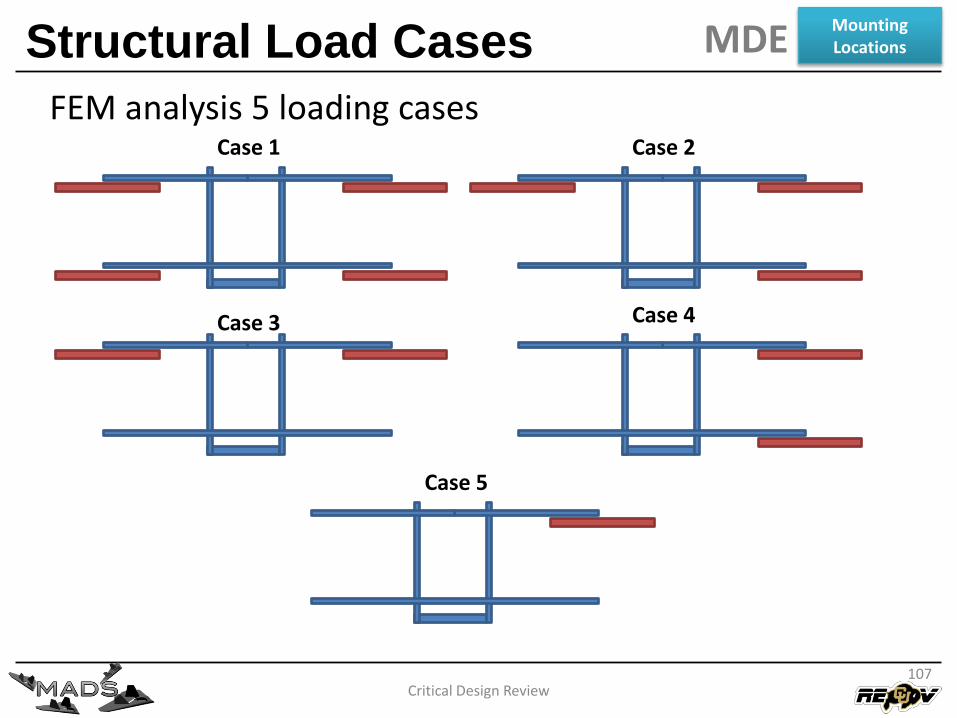
Structural Load Cases
Critical Design Review
FEM analysis 5 loading casesCase 1 Case 2
Case 3 Case 4
Case 5
107
MDEMountingLocations
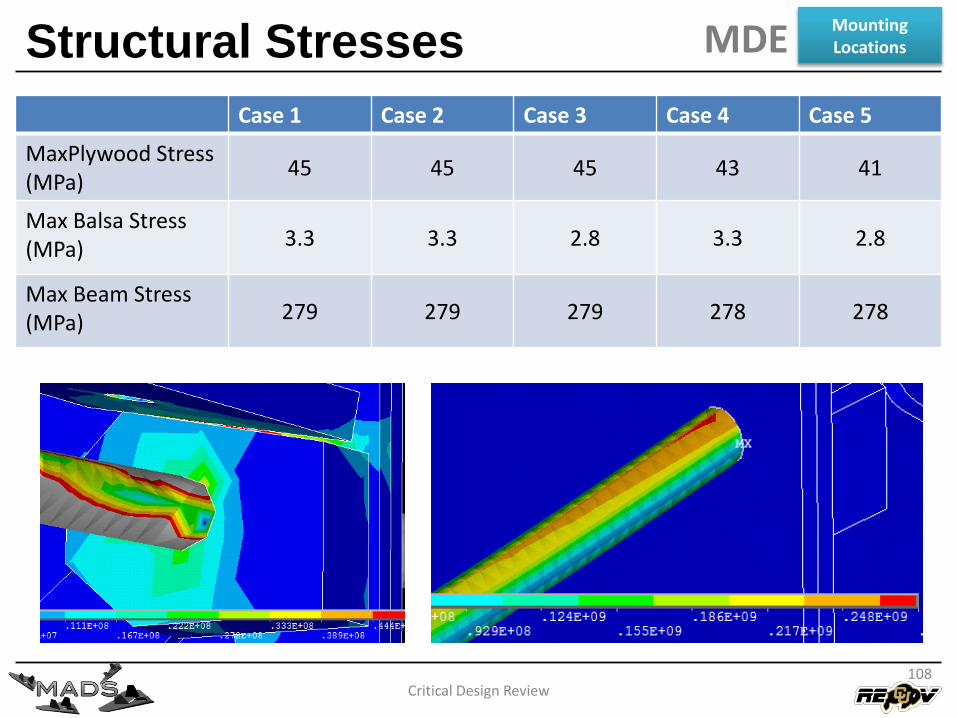
Structural Stresses
Critical Design Review
Case 1 Case 2 Case 3 Case 4 Case 5
MaxPlywood Stress (MPa)
45 45 45 43 41
Max Balsa Stress (MPa) 3.3 3.3 2.8 3.3 2.8
Max Beam Stress (MPa) 279 279 279 278 278
108
MDEMountingLocations
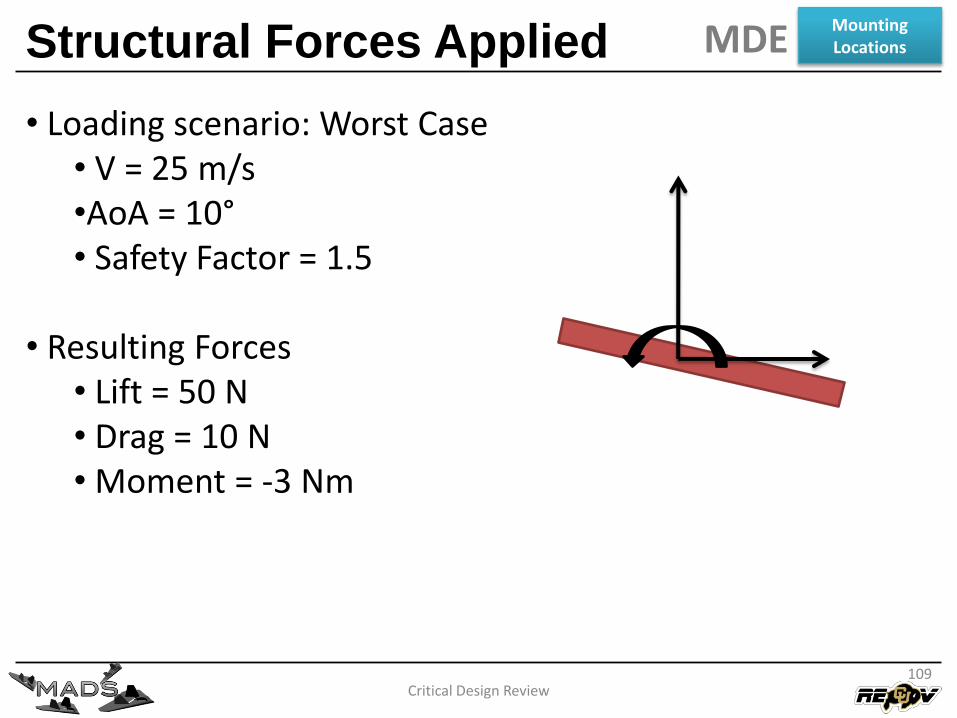
Structural Forces Applied
Critical Design Review
• Loading scenario: Worst Case• V = 25 m/s•AoA = 10°• Safety Factor = 1.5
• Resulting Forces• Lift = 50 N• Drag = 10 N• Moment = -3 Nm
109
MDEMountingLocations
Critical Design Review110
Propulsion and Aerodynamics
PV CFD
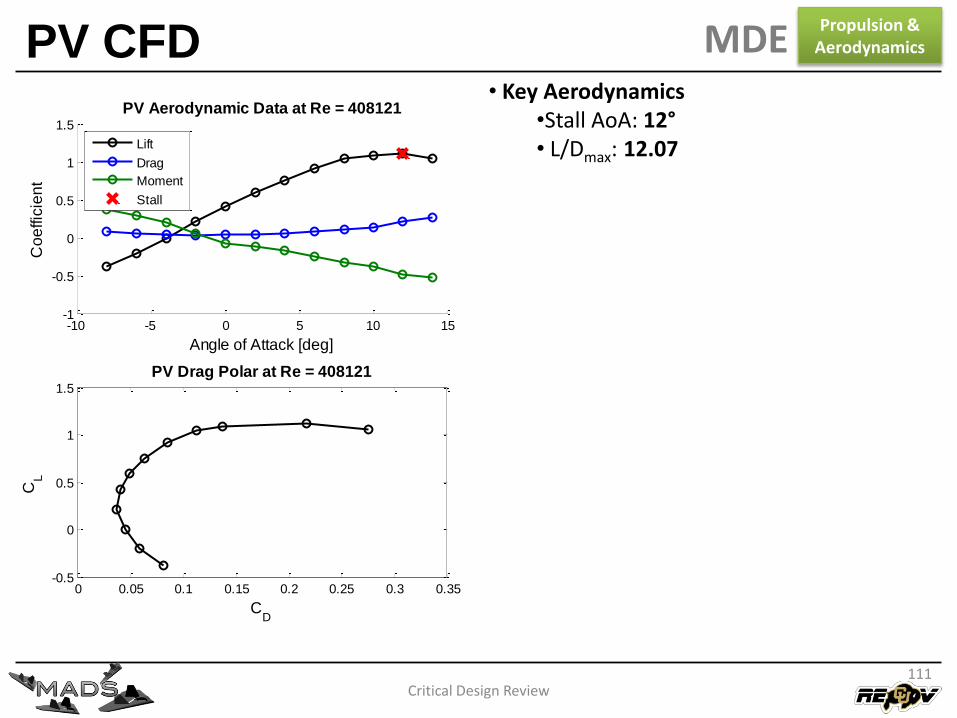
Critical Design Review
-10 -5 0 5 10 15-1
-0.5
0
0.5
1
1.5
PV Aerodynamic Data at Re = 408121
Angle of Attack [deg]
Co
effic
ien
t
Lift
Drag
Moment
Stall
0 0.05 0.1 0.15 0.2 0.25 0.3 0.35-0.5
0
0.5
1
1.5
PV Drag Polar at Re = 408121
CD
CL
• Key Aerodynamics•Stall AoA: 12°• L/Dmax: 12.07
111
Propulsion &AerodynamicsMDE
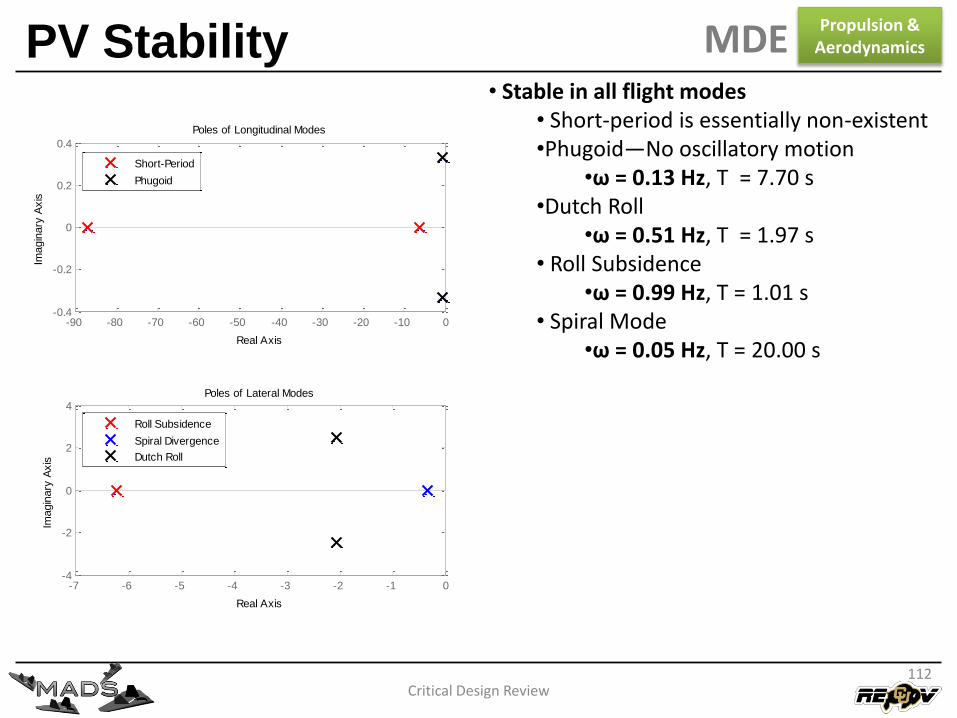
PV Stability
Critical Design Review
• Stable in all flight modes• Short-period is essentially non-existent •Phugoid—No oscillatory motion
•ω = 0.13 Hz, T = 7.70 s•Dutch Roll
•ω = 0.51 Hz, T = 1.97 s• Roll Subsidence
•ω = 0.99 Hz, T = 1.01 s• Spiral Mode
•ω = 0.05 Hz, T = 20.00 s
-90 -80 -70 -60 -50 -40 -30 -20 -10 0-0.4
-0.2
0
0.2
0.4
Poles of Longitudinal Modes
Real Axis
Imagin
ary
Axis
Short-Period
Phugoid
-7 -6 -5 -4 -3 -2 -1 0-4
-2
0
2
4
Poles of Lateral Modes
Real Axis
Imagin
ary
Axis
Roll Subsidence
Spiral Divergence
Dutch Roll
112
Propulsion &AerodynamicsMDE
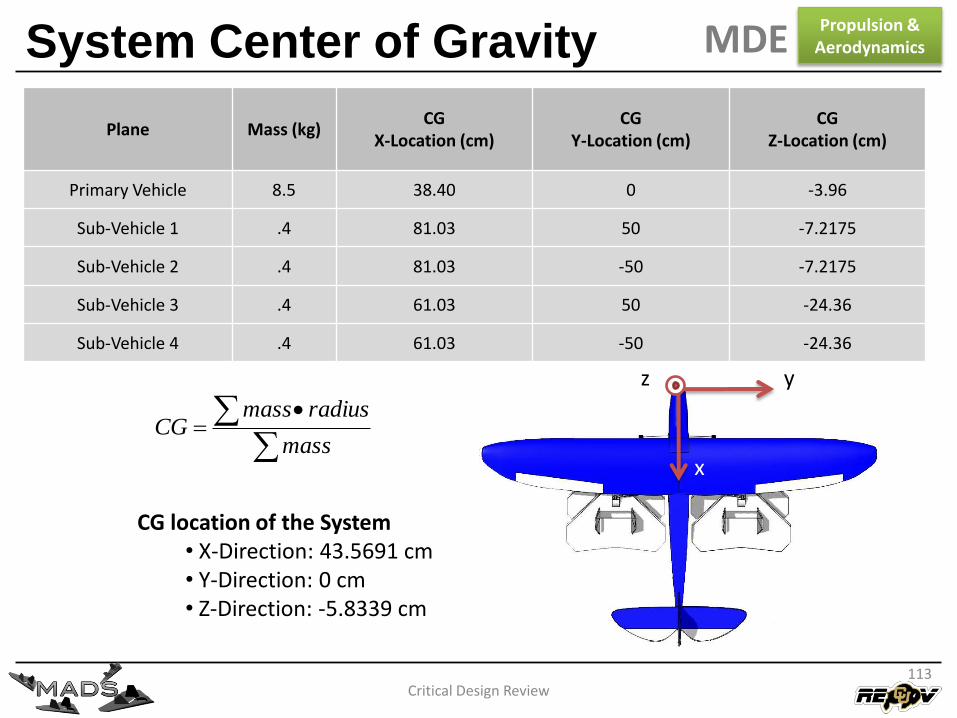
System Center of Gravity
Critical Design Review
y
x
z
Plane Mass (kg)CG
X-Location (cm)CG
Y-Location (cm)CG
Z-Location (cm)
Primary Vehicle 8.5 38.40 0 -3.96
Sub-Vehicle 1 .4 81.03 50 -7.2175
Sub-Vehicle 2 .4 81.03 -50 -7.2175
Sub-Vehicle 3 .4 61.03 50 -24.36
Sub-Vehicle 4 .4 61.03 -50 -24.36
mass
radiusmassCG
CG location of the System• X-Direction: 43.5691 cm• Y-Direction: 0 cm• Z-Direction: -5.8339 cm
113
Propulsion &AerodynamicsMDE
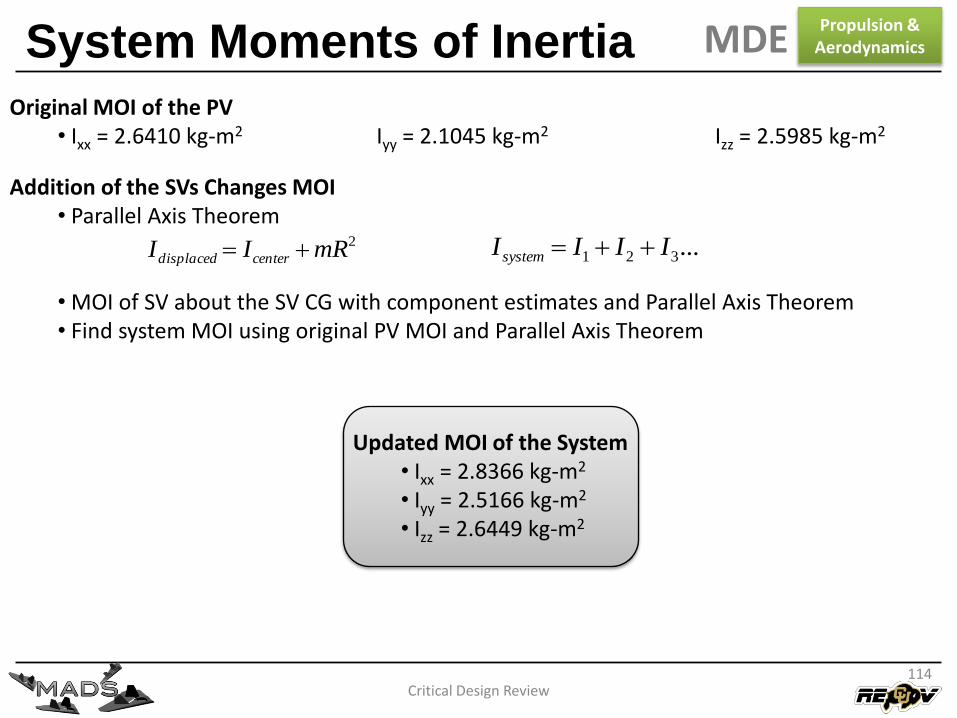
System Moments of Inertia
Critical Design Review
Original MOI of the PV• Ixx = 2.6410 kg-m2 Iyy = 2.1045 kg-m2 Izz = 2.5985 kg-m2
...321 IIIIsystem 2mRII centerdisplaced
Addition of the SVs Changes MOI• Parallel Axis Theorem
• MOI of SV about the SV CG with component estimates and Parallel Axis Theorem• Find system MOI using original PV MOI and Parallel Axis Theorem
Updated MOI of the System• Ixx = 2.8366 kg-m2
• Iyy = 2.5166 kg-m2
• Izz = 2.6449 kg-m2
114
Propulsion &AerodynamicsMDE
Critical Design Review115
System Architecture
Design Elements
Manufacturing & System Integration Plan
Verification & Test Plan
Project Management Plan
Electrical Design Elements (EDE)
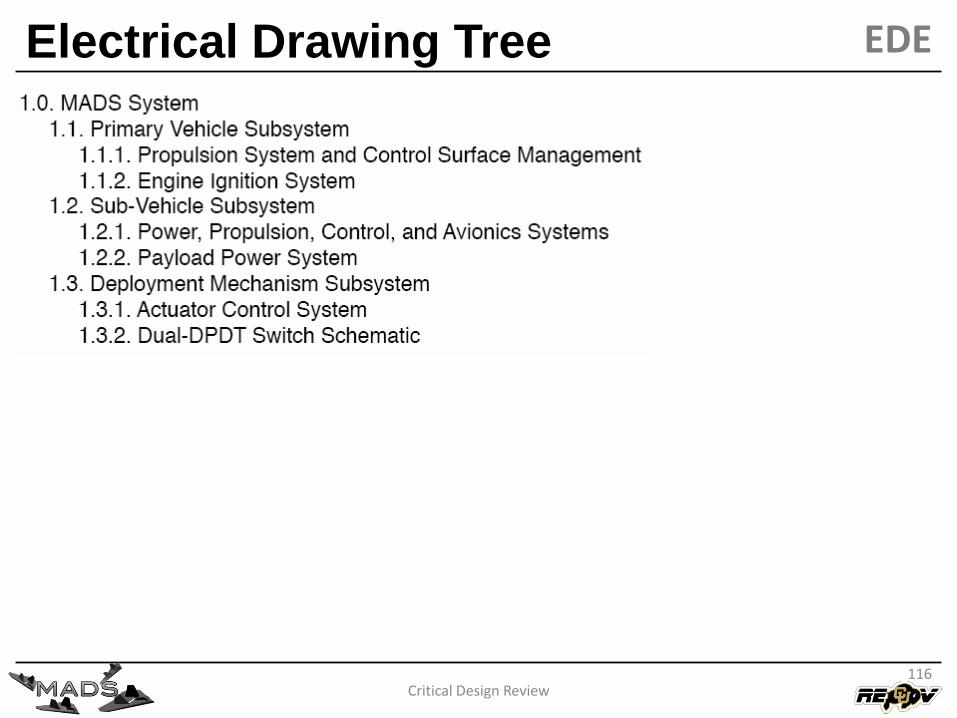
Electrical Drawing Tree
Critical Design Review
EDE
116
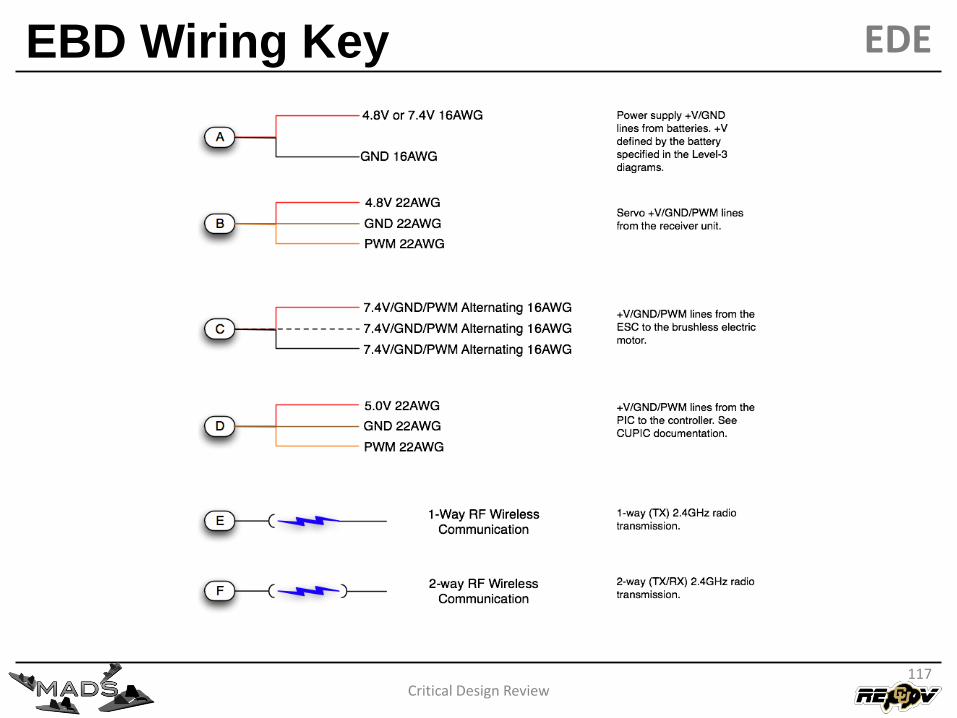
EBD Wiring Key
Critical Design Review117
EDE
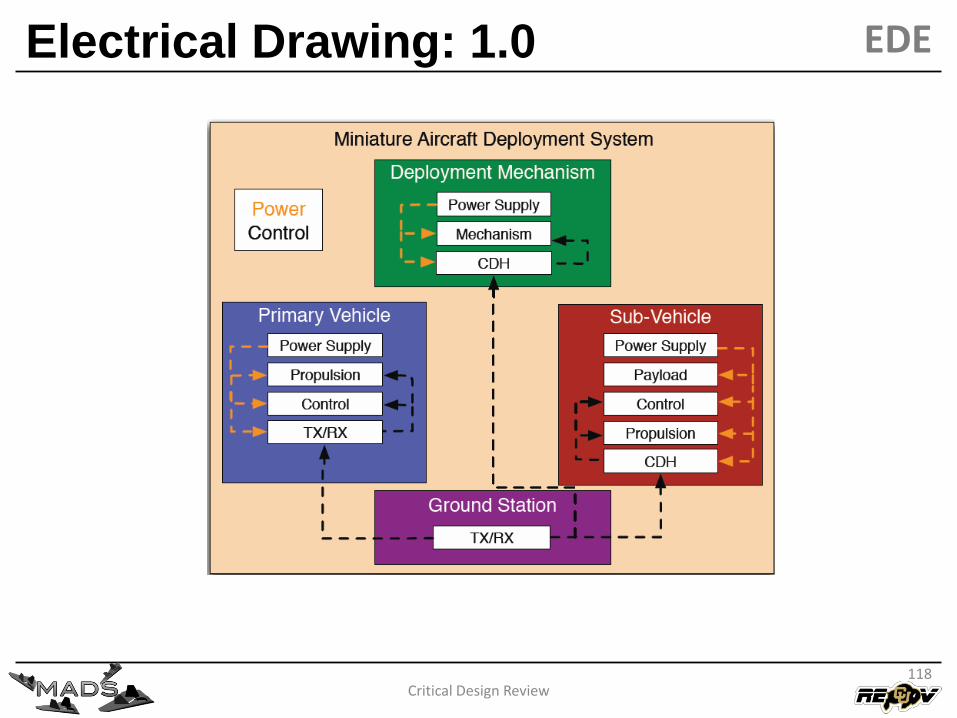
Electrical Drawing: 1.0
Critical Design Review118
EDE
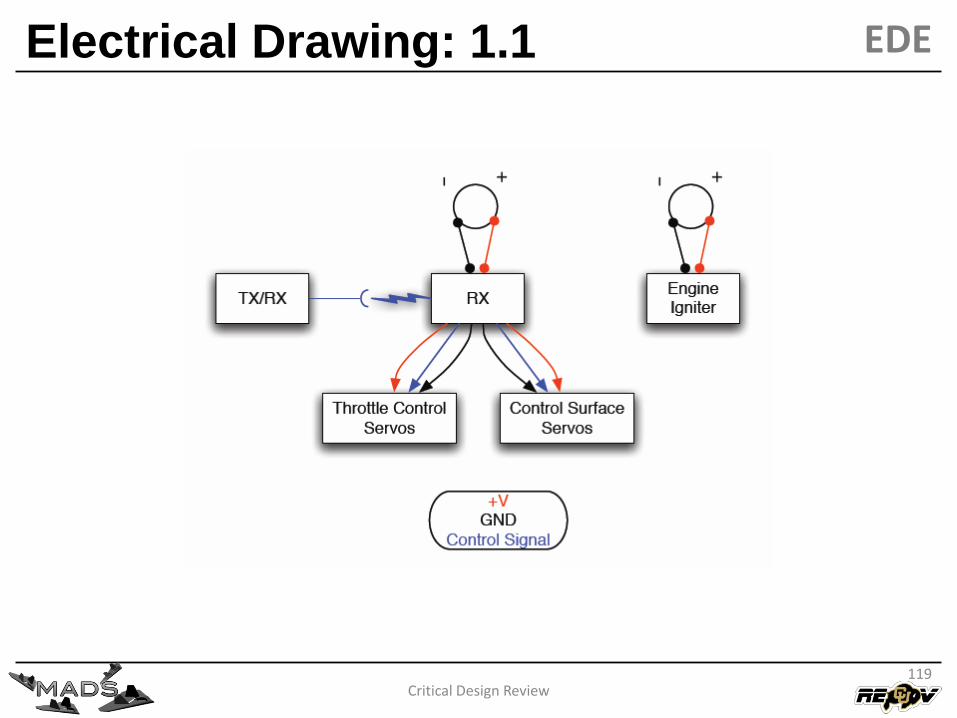
Electrical Drawing: 1.1
Critical Design Review119
EDE
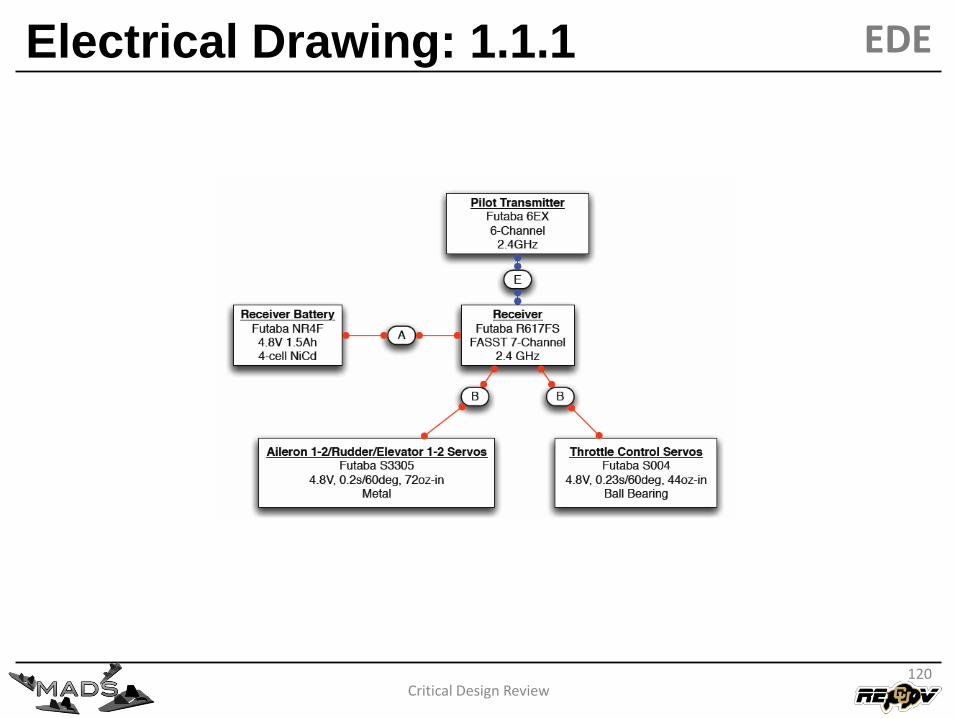
Electrical Drawing: 1.1.1
Critical Design Review120
EDE
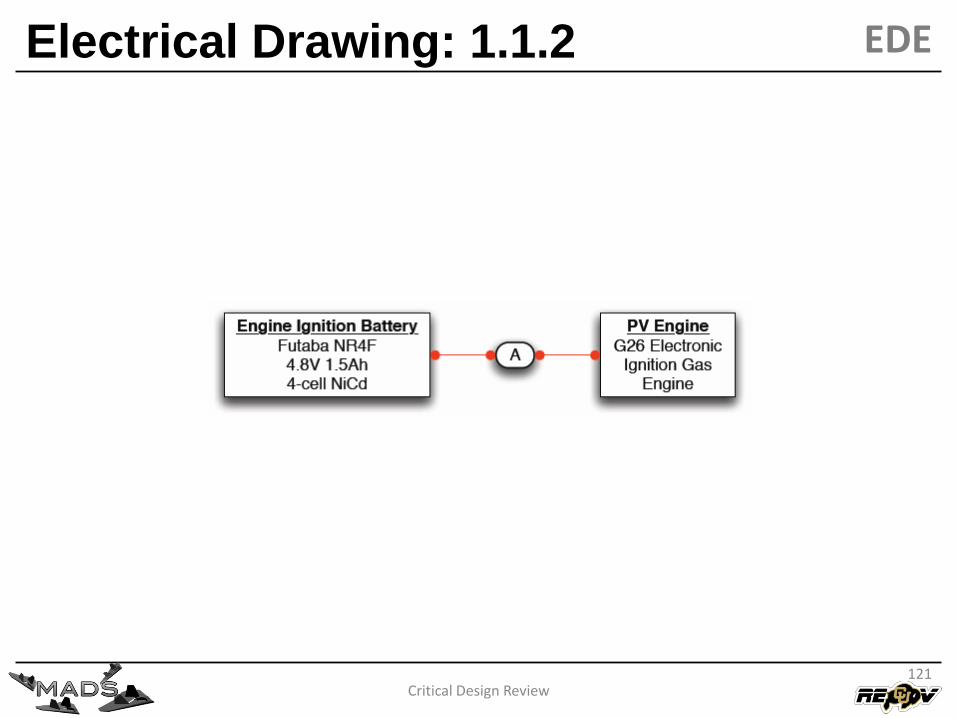
Electrical Drawing: 1.1.2
Critical Design Review121
EDE
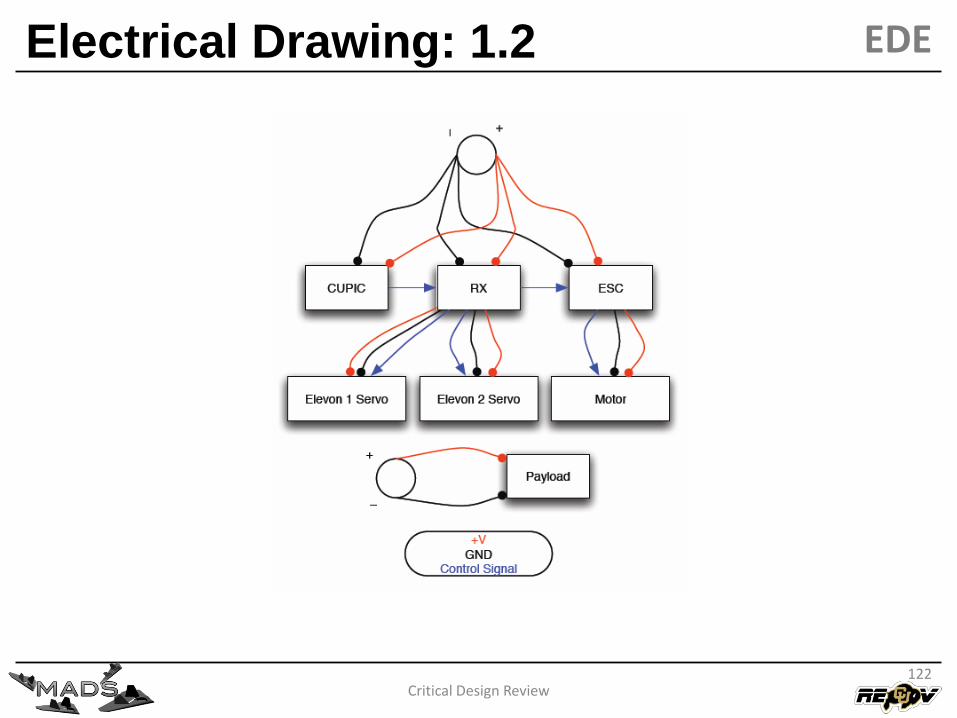
Electrical Drawing: 1.2
Critical Design Review122
EDE
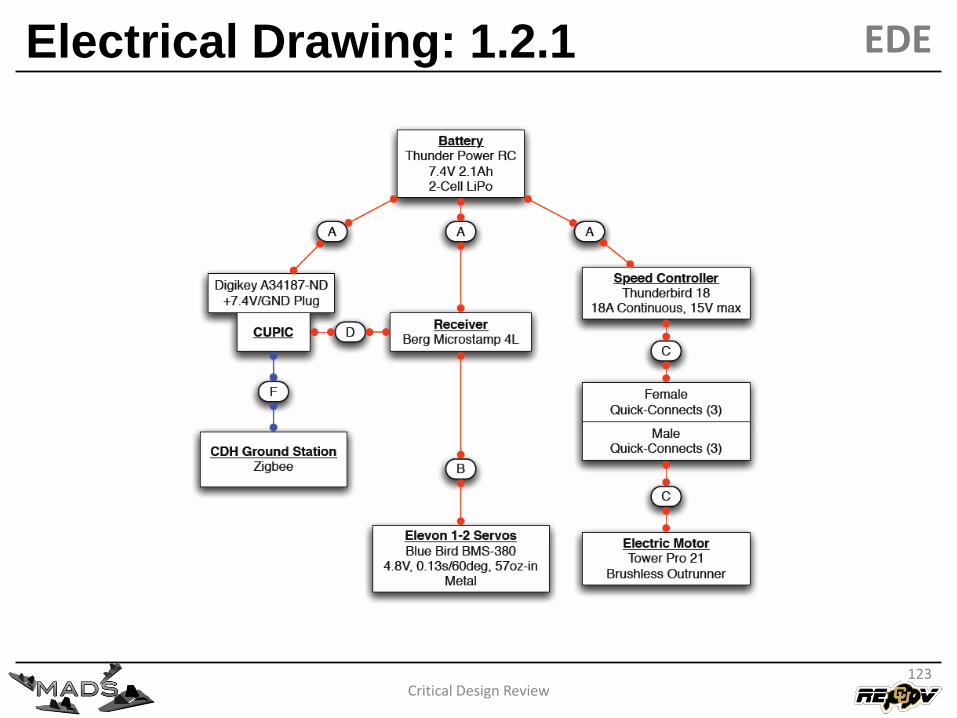
Electrical Drawing: 1.2.1
Critical Design Review123
EDE
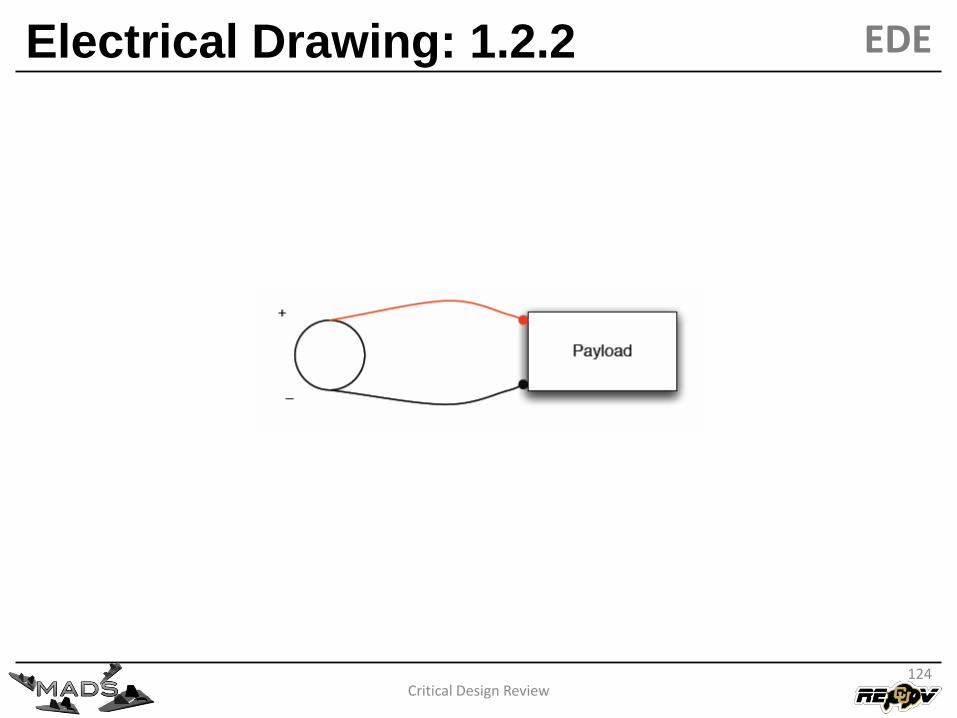
Electrical Drawing: 1.2.2
Critical Design Review124
EDE
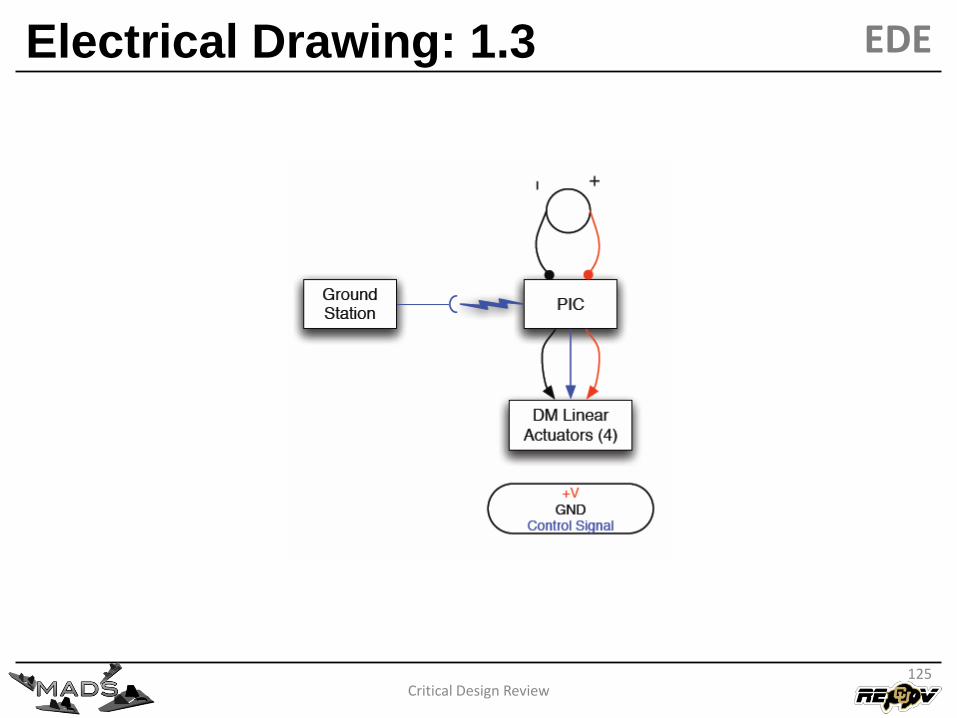
Electrical Drawing: 1.3
Critical Design Review125
EDE
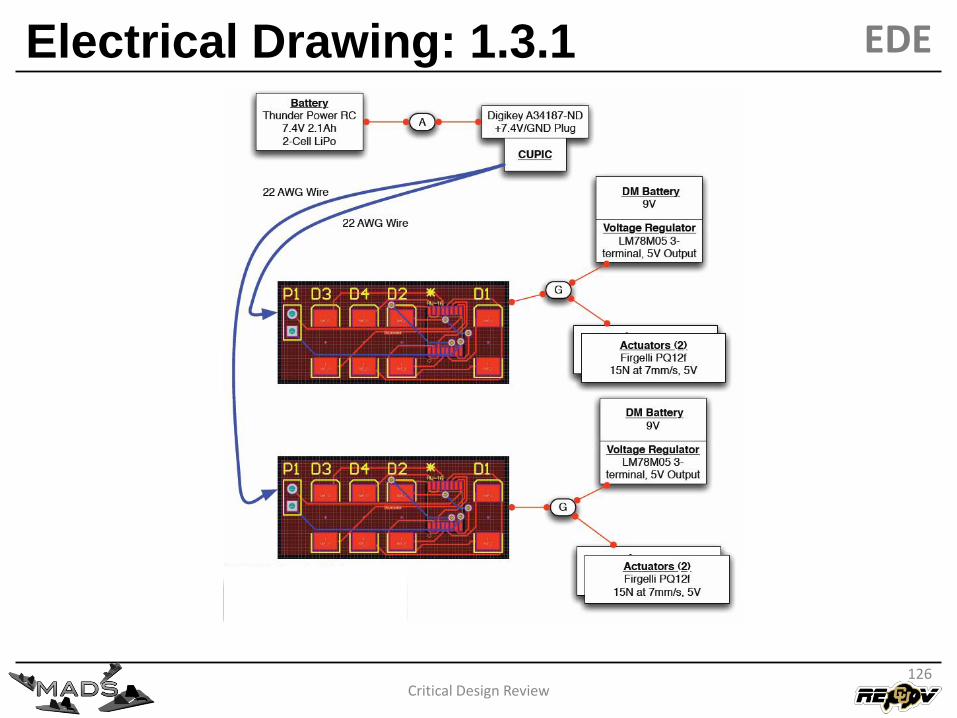
Electrical Drawing: 1.3.1
Critical Design Review126
EDE
Electrical Drawing: 1.3.2
Critical Design Review127
EDE
Critical Design Review128
Deployment MechanismElectrical Design
DM Force and Power Req’s
Critical Design Review
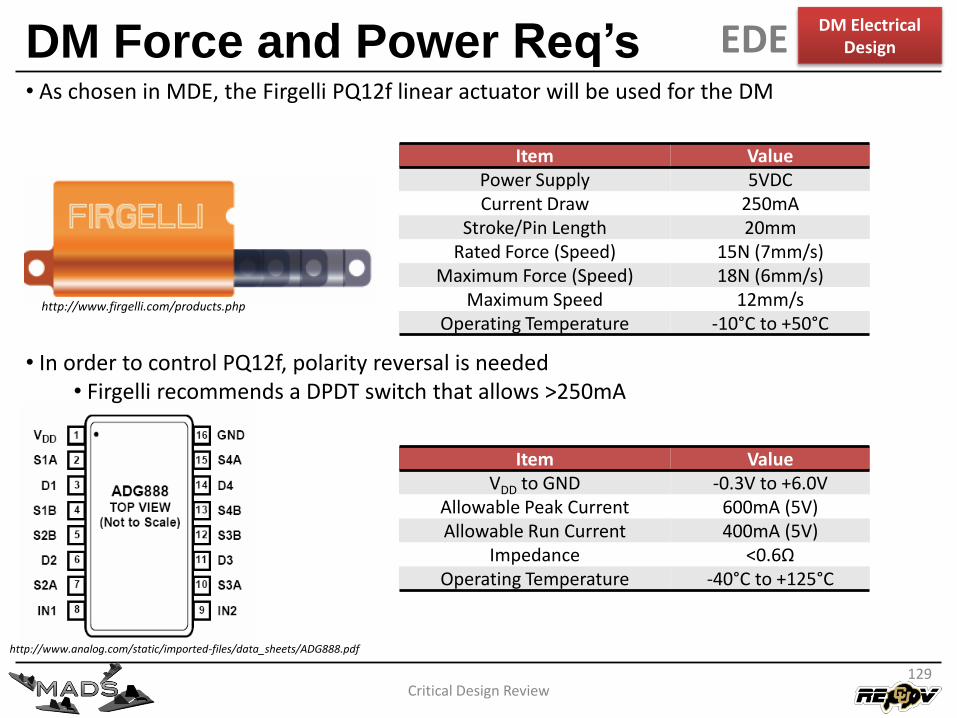
Item ValuePower Supply 5VDCCurrent Draw 250mA
Stroke/Pin Length 20mmRated Force (Speed) 15N (7mm/s)
Maximum Force (Speed) 18N (6mm/s)Maximum Speed 12mm/s
Operating Temperature -10°C to +50°C
• As chosen in MDE, the Firgelli PQ12f linear actuator will be used for the DM
• In order to control PQ12f, polarity reversal is needed• Firgelli recommends a DPDT switch that allows >250mA
Item ValueVDD to GND -0.3V to +6.0V
Allowable Peak Current 600mA (5V)Allowable Run Current 400mA (5V)
Impedance <0.6ΩOperating Temperature -40°C to +125°C
http://www.firgelli.com/products.php
http://www.analog.com/static/imported-files/data_sheets/ADG888.pdf
129
DM Electrical DesignEDE
DM Level-2 EBD
Critical Design Review130
EDEDM Electrical
Design
Critical Design Review131
Sub-VehicleElectrical Design
SV Thrust Model
Critical Design Review
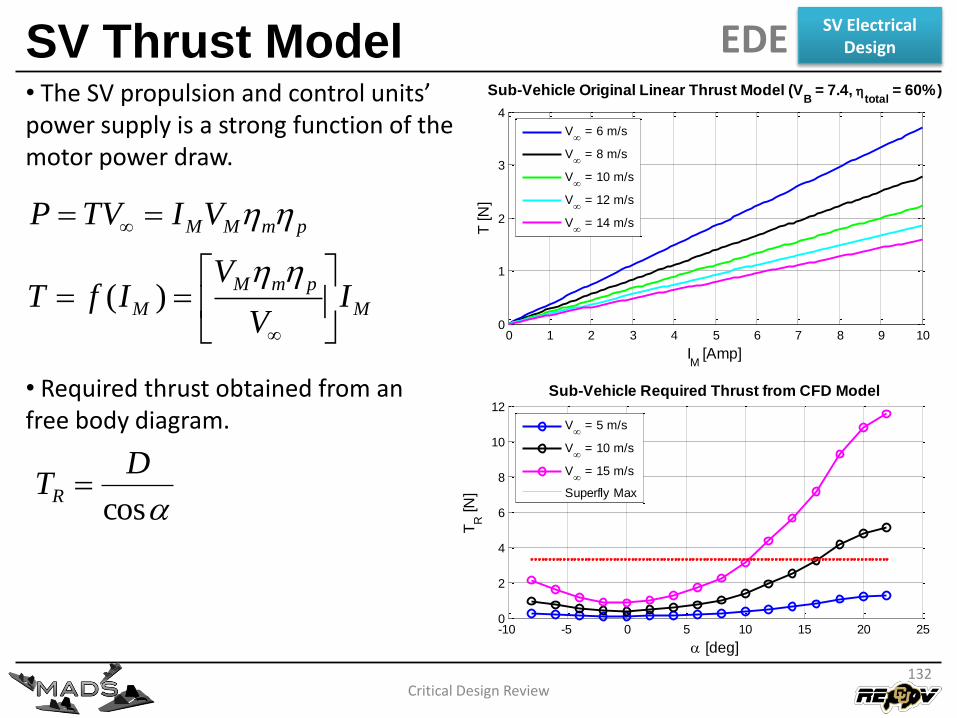
• The SV propulsion and control units’ power supply is a strong function of the motor power draw.
M
pmM
M
pmMM
IV
VIfT
VITVP
)(
-10 -5 0 5 10 15 20 250
2
4
6
8
10
12
[deg]
TR
[N
]
Sub-Vehicle Required Thrust from CFD Model
V
= 5 m/s
V
= 10 m/s
V
= 15 m/s
Superfly Max
0 1 2 3 4 5 6 7 8 9 100
1
2
3
4
Sub-Vehicle Original Linear Thrust Model (VB = 7.4,
total = 60%)
IM
[Amp]
T [N
]
V
= 6 m/s
V
= 8 m/s
V
= 10 m/s
V
= 12 m/s
V
= 14 m/s
• Required thrust obtained from an free body diagram.
cos
DTR
132
SV Electrical DesignEDE
Wind Tunnel vs. CFD
Critical Design Review
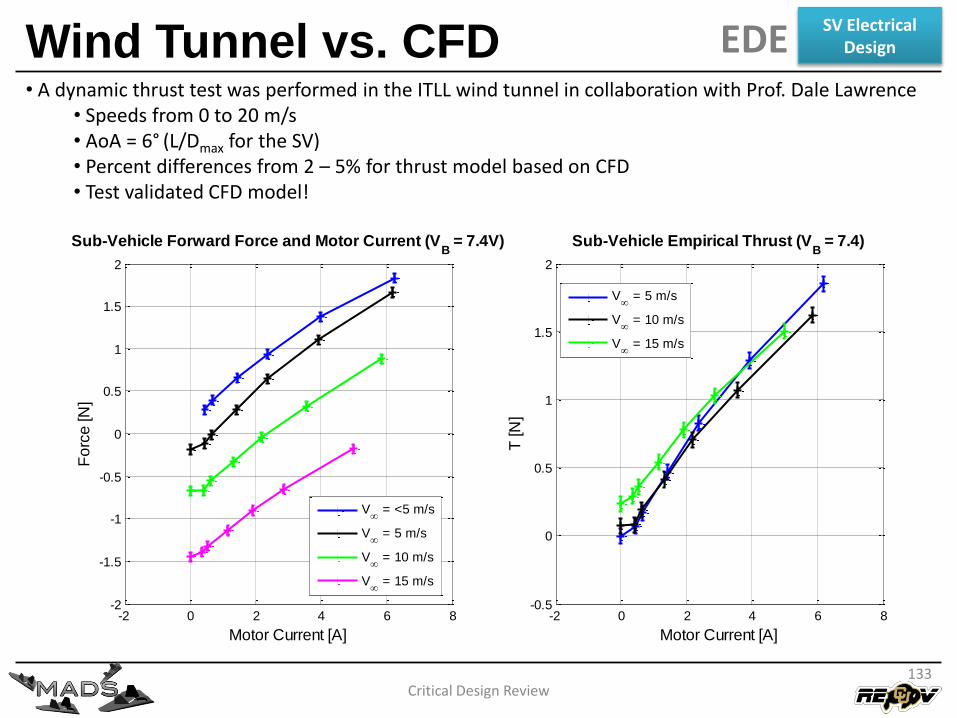
• A dynamic thrust test was performed in the ITLL wind tunnel in collaboration with Prof. Dale Lawrence• Speeds from 0 to 20 m/s• AoA = 6° (L/Dmax for the SV)• Percent differences from 2 – 5% for thrust model based on CFD• Test validated CFD model!
-2 0 2 4 6 8-2
-1.5
-1
-0.5
0
0.5
1
1.5
2
Sub-Vehicle Forward Force and Motor Current (VB = 7.4V)
Motor Current [A]
Fo
rce
[N
]
V
= <5 m/s
V
= 5 m/s
V
= 10 m/s
V
= 15 m/s
-2 0 2 4 6 8-0.5
0
0.5
1
1.5
2
Sub-Vehicle Empirical Thrust (VB = 7.4)
Motor Current [A]
T [N
]
V
= 5 m/s
V
= 10 m/s
V
= 15 m/s
133
SV Electrical DesignEDE
SV Subsystem Analysis
Critical Design Review
PowerFLOWComputational Fluid
Dynamics (CFD) simulation INPUTS:
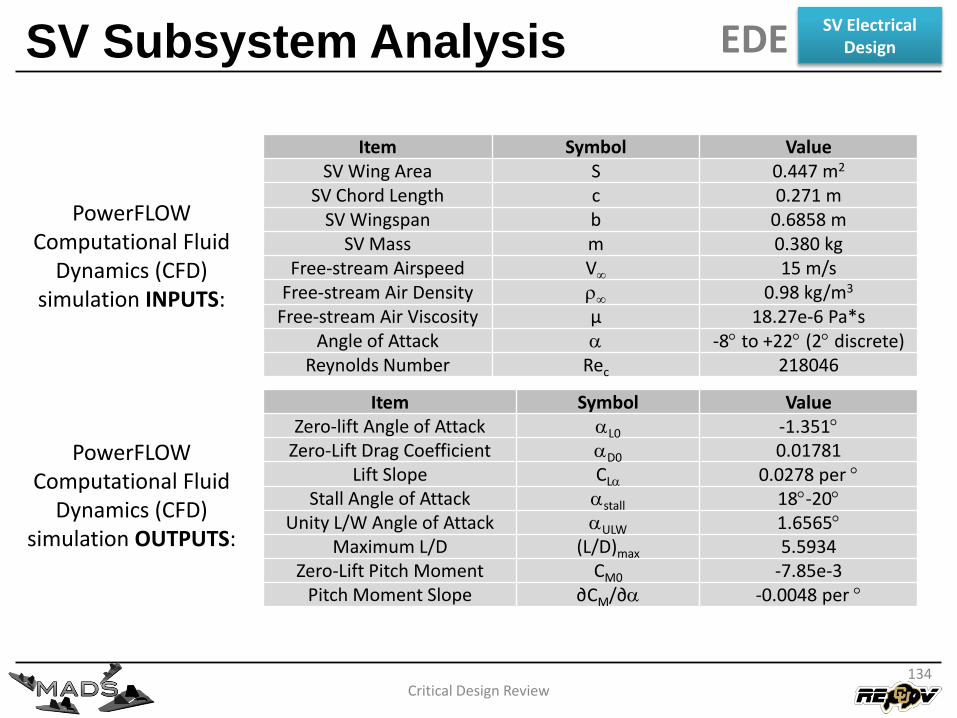
Item Symbol ValueSV Wing Area S 0.447 m2
SV Chord Length c 0.271 mSV Wingspan b 0.6858 m
SV Mass m 0.380 kgFree-stream Airspeed V 15 m/s
Free-stream Air Density 0.98 kg/m3
Free-stream Air Viscosity µ 18.27e-6 Pa*sAngle of Attack -8 to +22 (2 discrete)
Reynolds Number Rec 218046
Item Symbol ValueZero-lift Angle of Attack L0 -1.351
Zero-Lift Drag Coefficient D0 0.01781Lift Slope CL 0.0278 per
Stall Angle of Attack stall 18-20Unity L/W Angle of Attack ULW 1.6565
Maximum L/D (L/D)max 5.5934Zero-Lift Pitch Moment CM0 -7.85e-3
Pitch Moment Slope ∂CM/∂ -0.0048 per
PowerFLOWComputational Fluid
Dynamics (CFD) simulation OUTPUTS:
134
SV Electrical DesignEDE
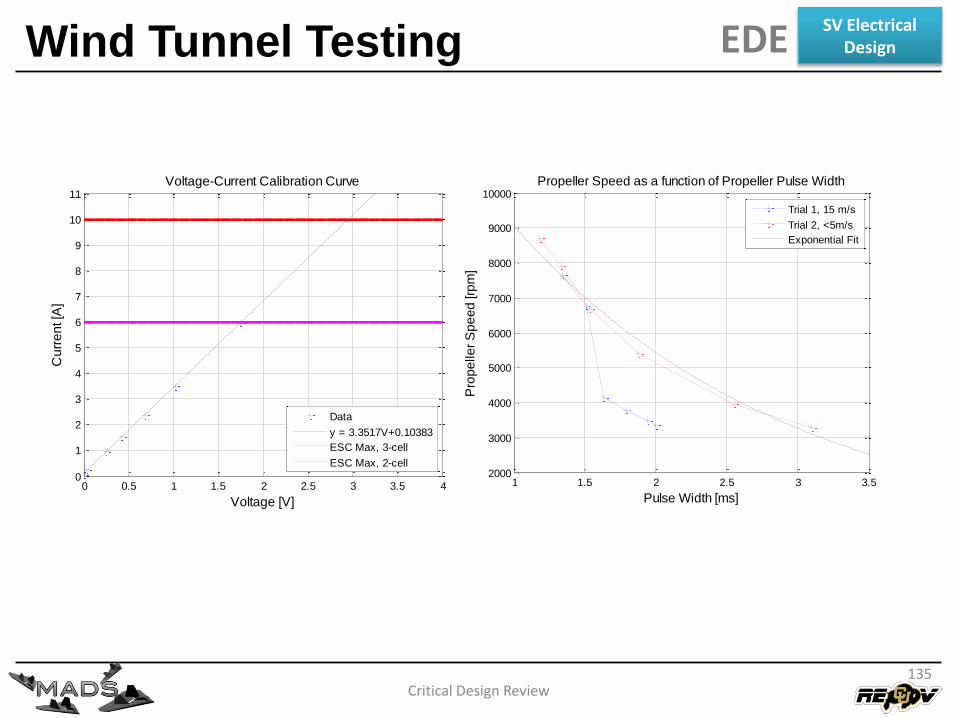
Wind Tunnel Testing
Critical Design Review
0 0.5 1 1.5 2 2.5 3 3.5 40
1
2
3
4
5
6
7
8
9
10
11Voltage-Current Calibration Curve
Voltage [V]
Cu
rre
nt [A
]
Data
y = 3.3517V+0.10383
ESC Max, 3-cell
ESC Max, 2-cell
1 1.5 2 2.5 3 3.52000
3000
4000
5000
6000
7000
8000
9000
10000Propeller Speed as a function of Propeller Pulse Width
Pulse Width [ms]
Pro
pe
lle
r S
pe
ed
[rp
m]
Trial 1, 15 m/s
Trial 2, <5m/s
Exponential Fit
135
SV Electrical DesignEDE
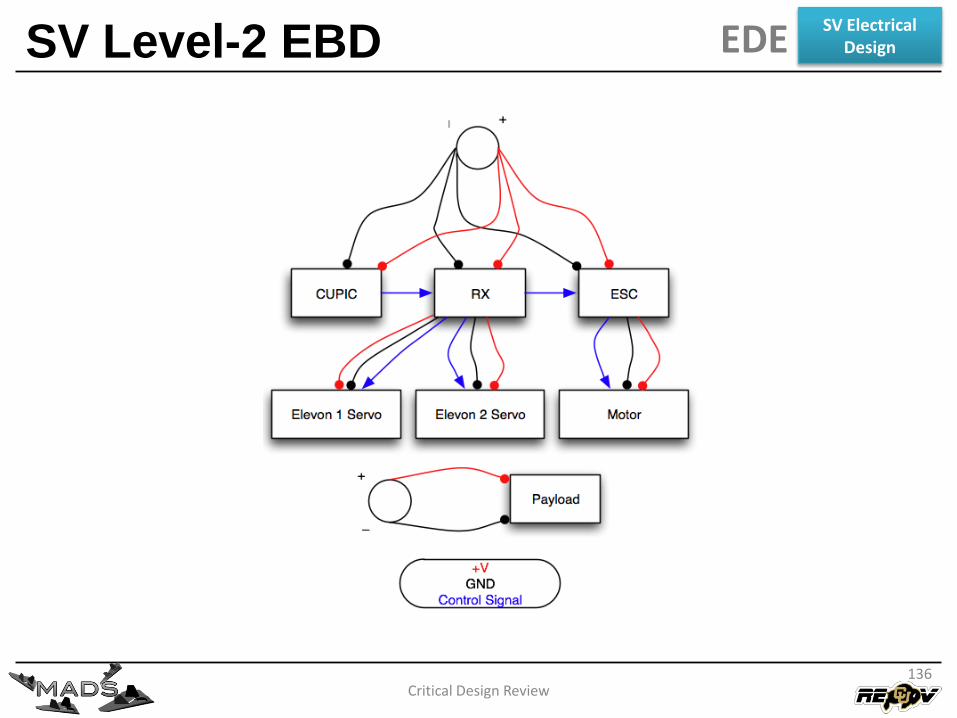
SV Level-2 EBD
Critical Design Review136
SV Electrical DesignEDE
0.3 0.35 0.4 0.45 0.5 0.55 0.60
2
4
6
8
Required Motor Current and Maximum Motor CurrentC
L = 0.19075 at = 6
o, t = 25.2min
mSV
[kg]
I M [A
mp
]
Ireq
CB = 2.1 A*hr
20 25 30 35
0.4
0.5
0.6
0.7
Allowable SV Mass for Varying EnduranceC
L = 0.19075 at = 6
o, C
B = 2.1A*hr, V
B = 7.4V
Endurance [min]
mS
V [kg
]
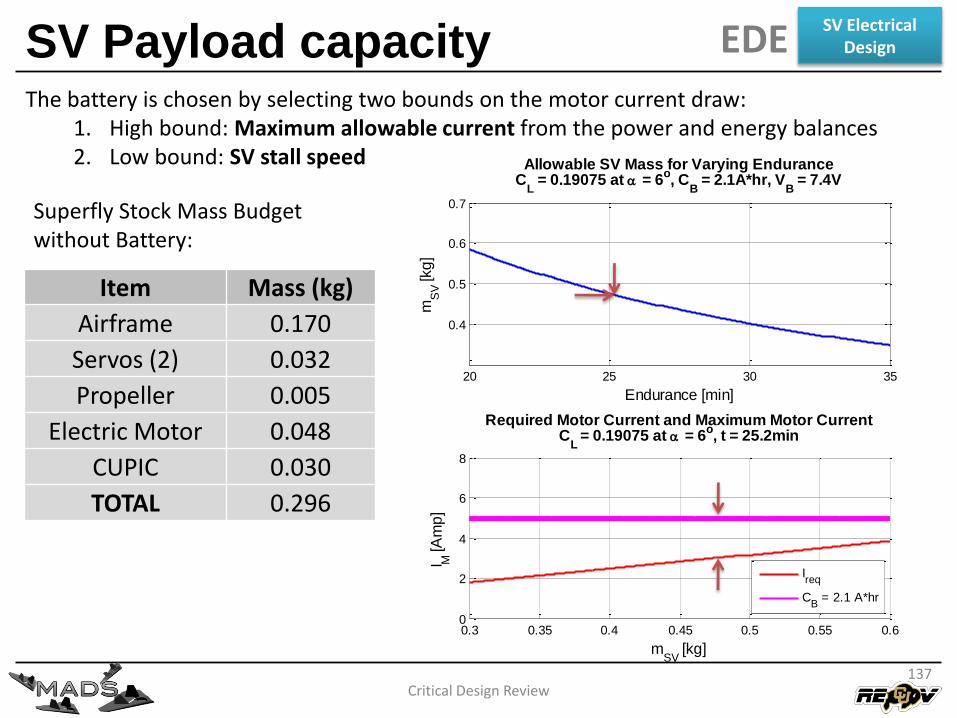
SV Payload capacity
Critical Design Review
The battery is chosen by selecting two bounds on the motor current draw:1. High bound: Maximum allowable current from the power and energy balances2. Low bound: SV stall speed
Item Mass (kg)
Airframe 0.170
Servos (2) 0.032
Propeller 0.005
Electric Motor 0.048
CUPIC 0.030
TOTAL 0.296
Superfly Stock Mass Budget without Battery:
137
SV Electrical DesignEDE
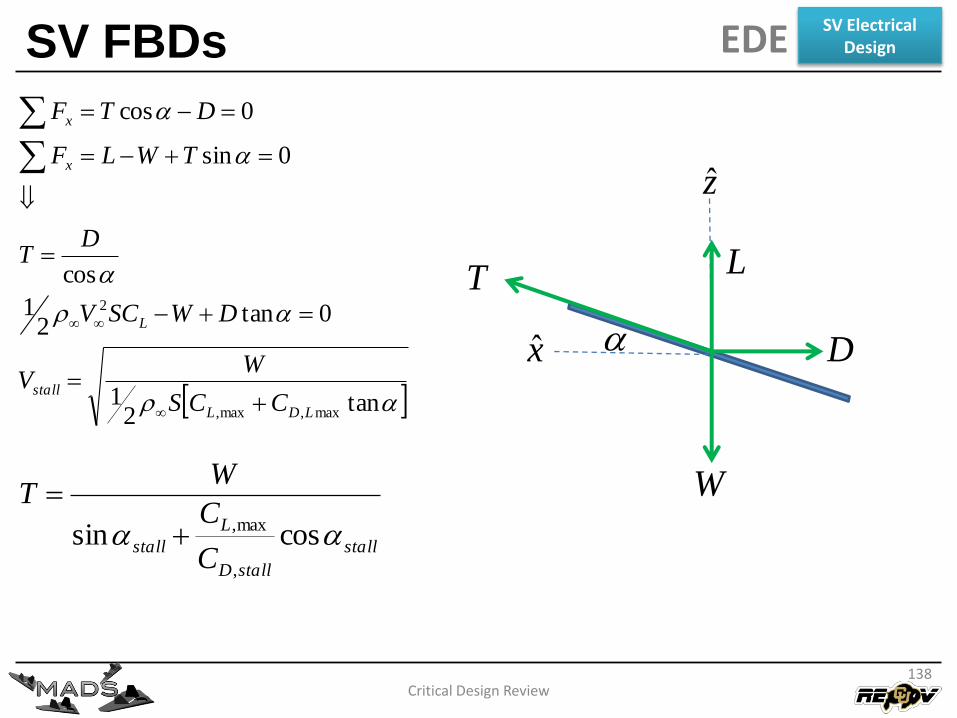
SV FBDs
Critical Design Review
tan2
1
0tan2
1
cos
0sin
0cos
max,max,
2
LDL
stall
L
x
x
CCS
WV
DWSCV
DT
TWLF
DTF
z
x
T
W
L
D
stall
stallD
L
stallC
C
WT
cossin,
max,
138
SV Electrical DesignEDE
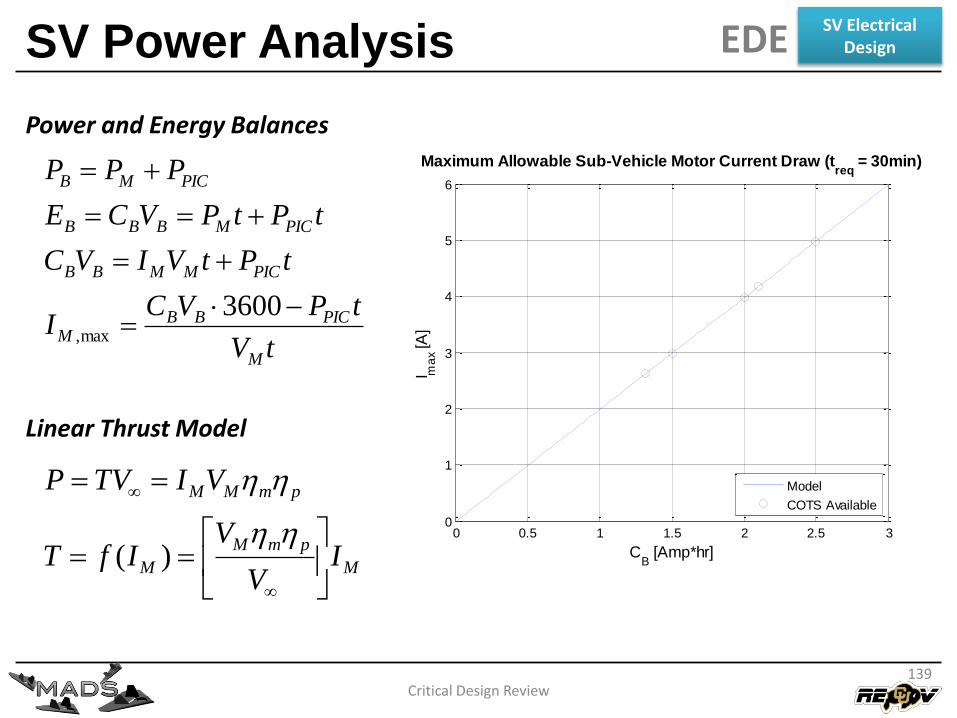
SV Power Analysis
Critical Design Review
tV
tPVCI
tPtVIVC
tPtPVCE
PPP
M
PICBBM
PICMMBB
PICMBBB
PICMB
3600max,
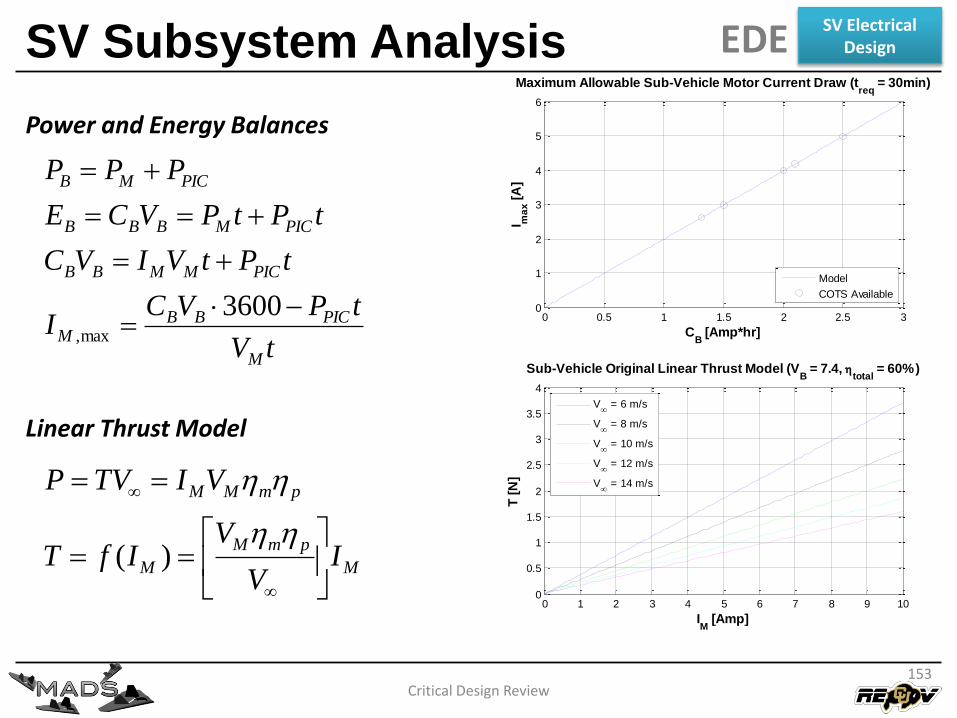
Power and Energy Balances
M
pmM
M
pmMM
IV
VIfT
VITVP
)(
Linear Thrust Model
0 0.5 1 1.5 2 2.5 30
1
2
3
4
5
6
Maximum Allowable Sub-Vehicle Motor Current Draw (treq
= 30min)
CB [Amp*hr]
I ma
x [A
]
Model
COTS Available
139
SV Electrical DesignEDE
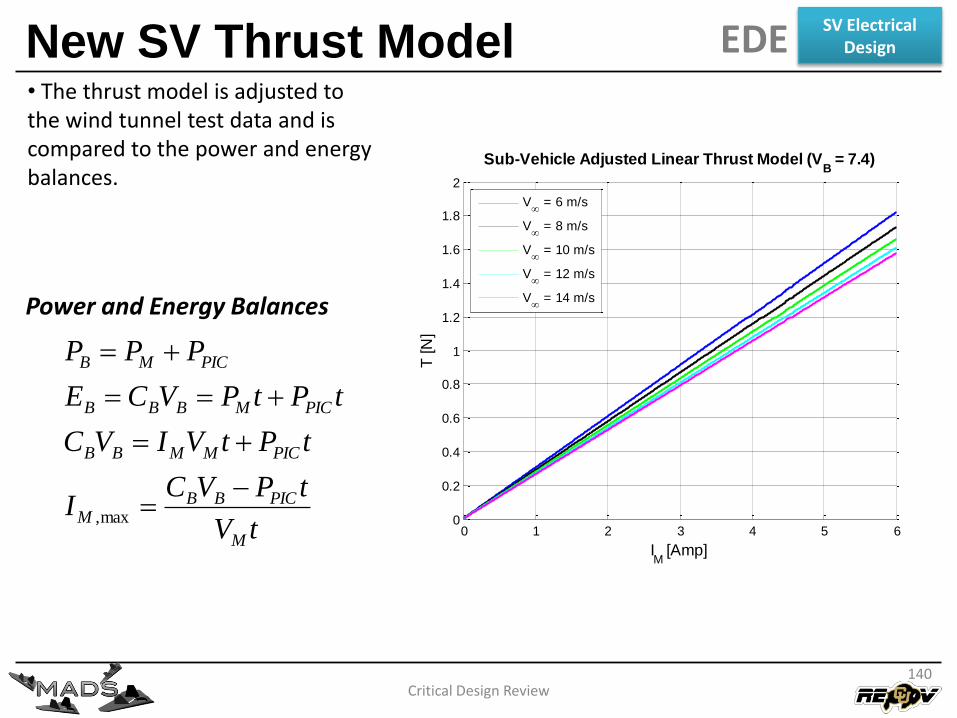
New SV Thrust Model
Critical Design Review
tV
tPVCI
tPtVIVC
tPtPVCE
PPP
M
PICBBM
PICMMBB
PICMBBB
PICMB
max,
Power and Energy Balances
• The thrust model is adjusted to the wind tunnel test data and is compared to the power and energy balances.
0 1 2 3 4 5 60
0.2
0.4
0.6
0.8
1
1.2
1.4
1.6
1.8
2
Sub-Vehicle Adjusted Linear Thrust Model (VB = 7.4)
IM
[Amp]
T [N
]
V
= 6 m/s
V
= 8 m/s
V
= 10 m/s
V
= 12 m/s
V
= 14 m/s
140
SV Electrical DesignEDE
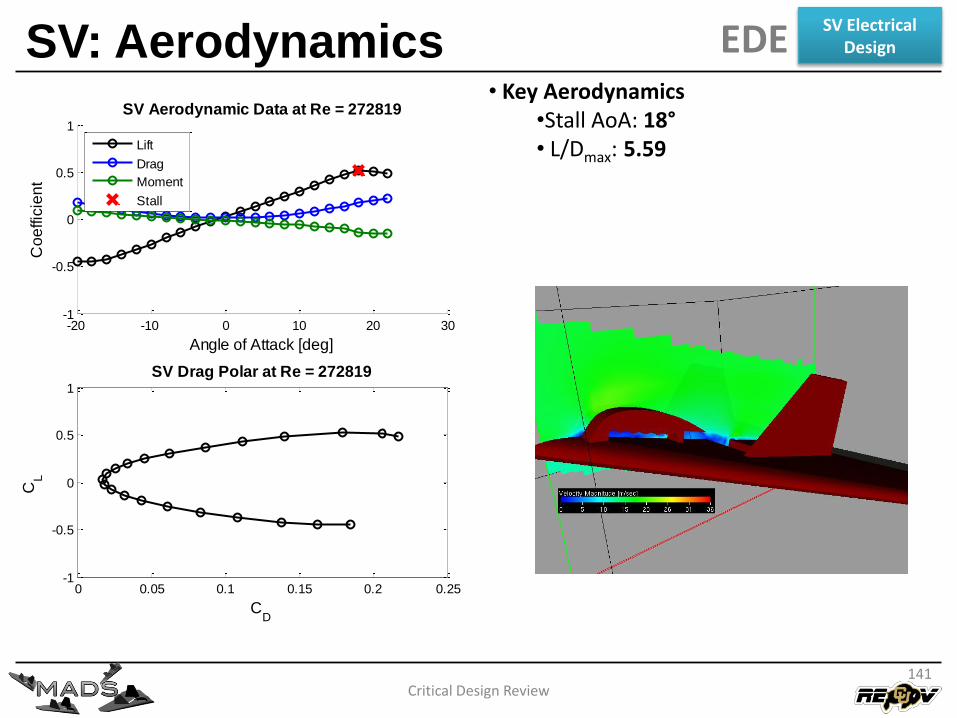
SV: Aerodynamics
Critical Design Review
-20 -10 0 10 20 30-1
-0.5
0
0.5
1
SV Aerodynamic Data at Re = 272819
Angle of Attack [deg]
Co
effic
ien
t
Lift
Drag
Moment
Stall
0 0.05 0.1 0.15 0.2 0.25-1
-0.5
0
0.5
1
SV Drag Polar at Re = 272819
CD
CL
• Key Aerodynamics•Stall AoA: 18°• L/Dmax: 5.59
141
SV Electrical DesignEDE
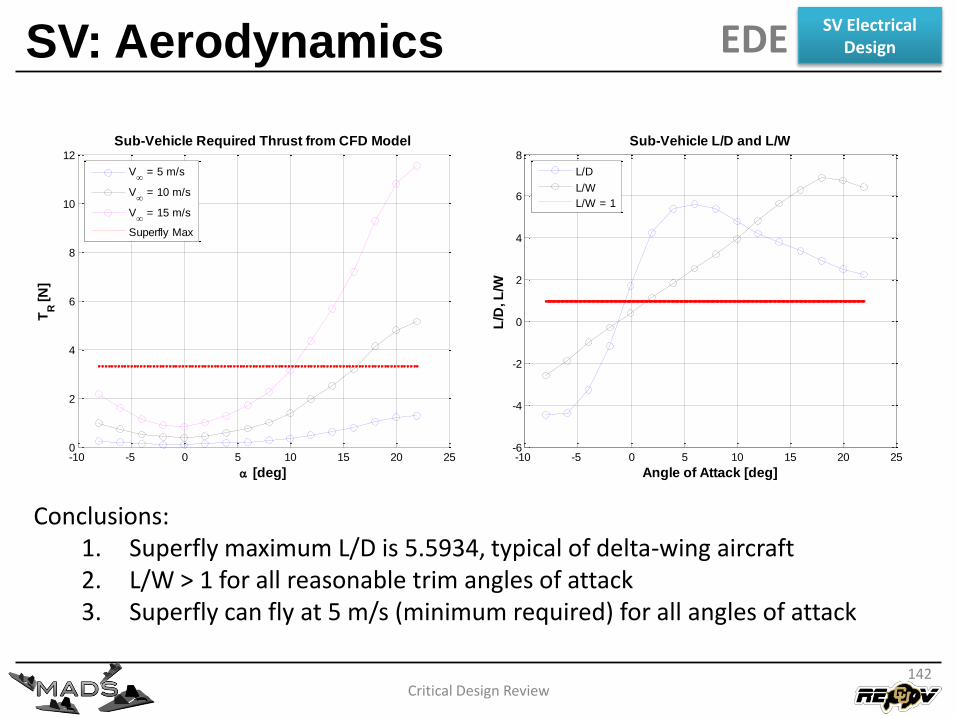
SV: Aerodynamics
Critical Design Review
Conclusions:1. Superfly maximum L/D is 5.5934, typical of delta-wing aircraft2. L/W > 1 for all reasonable trim angles of attack3. Superfly can fly at 5 m/s (minimum required) for all angles of attack
-10 -5 0 5 10 15 20 25-6
-4
-2
0
2
4
6
8
Angle of Attack [deg]
L/D
, L
/W
Sub-Vehicle L/D and L/W
L/D
L/W
L/W = 1
-10 -5 0 5 10 15 20 250
2
4
6
8
10
12
[deg]
TR [
N]
Sub-Vehicle Required Thrust from CFD Model
V
= 5 m/s
V
= 10 m/s
V
= 15 m/s
Superfly Max
142
SV Electrical DesignEDE
SV CFD Inputs and Outputs
Critical Design Review
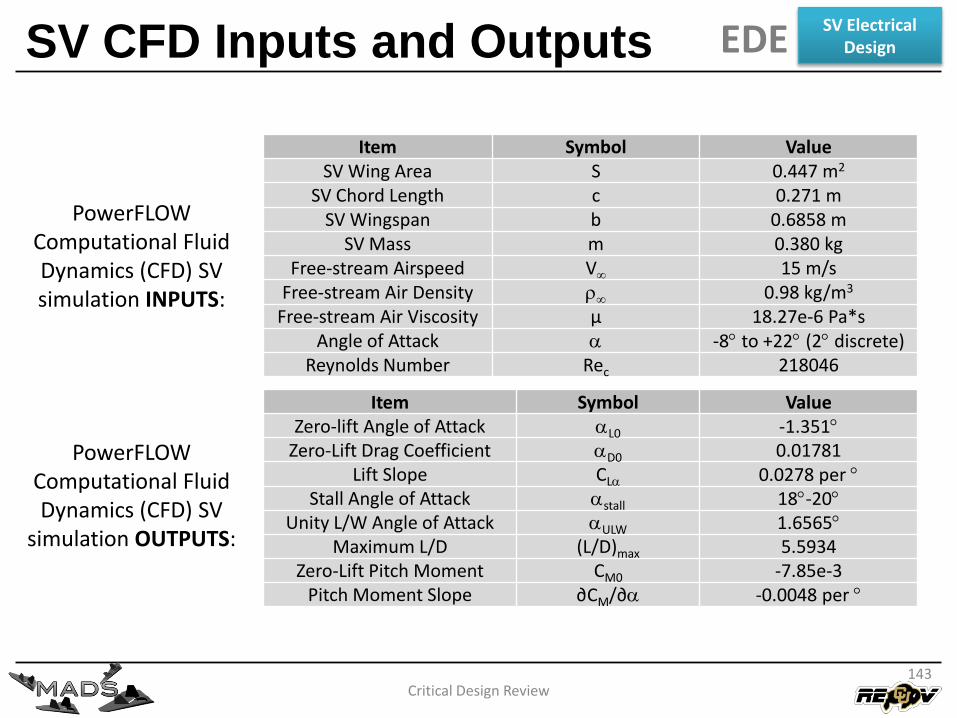
PowerFLOWComputational Fluid Dynamics (CFD) SV simulation INPUTS:
Item Symbol ValueSV Wing Area S 0.447 m2
SV Chord Length c 0.271 mSV Wingspan b 0.6858 m
SV Mass m 0.380 kgFree-stream Airspeed V 15 m/s
Free-stream Air Density 0.98 kg/m3
Free-stream Air Viscosity µ 18.27e-6 Pa*sAngle of Attack -8 to +22 (2 discrete)
Reynolds Number Rec 218046
Item Symbol ValueZero-lift Angle of Attack L0 -1.351
Zero-Lift Drag Coefficient D0 0.01781Lift Slope CL 0.0278 per
Stall Angle of Attack stall 18-20Unity L/W Angle of Attack ULW 1.6565
Maximum L/D (L/D)max 5.5934Zero-Lift Pitch Moment CM0 -7.85e-3
Pitch Moment Slope ∂CM/∂ -0.0048 per
PowerFLOWComputational Fluid Dynamics (CFD) SV
simulation OUTPUTS:
143
SV Electrical DesignEDE
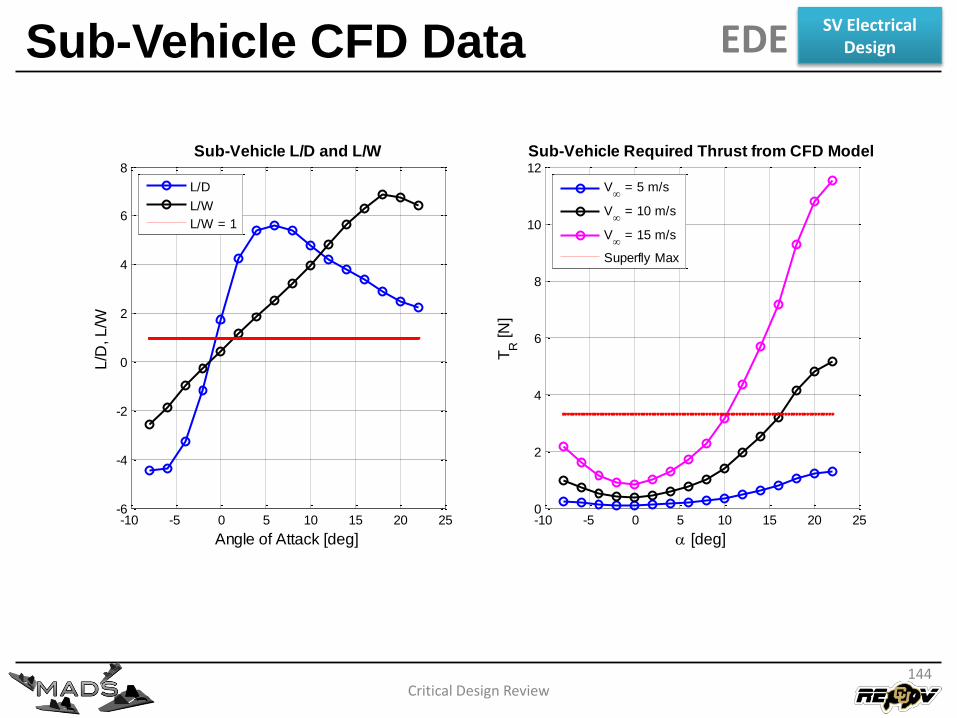
Sub-Vehicle CFD Data
Critical Design Review
-10 -5 0 5 10 15 20 25-6
-4
-2
0
2
4
6
8
Angle of Attack [deg]
L/D
, L
/W
Sub-Vehicle L/D and L/W
L/D
L/W
L/W = 1
-10 -5 0 5 10 15 20 250
2
4
6
8
10
12
[deg]
TR
[N
]
Sub-Vehicle Required Thrust from CFD Model
V
= 5 m/s
V
= 10 m/s
V
= 15 m/s
Superfly Max
144
SV Electrical DesignEDE
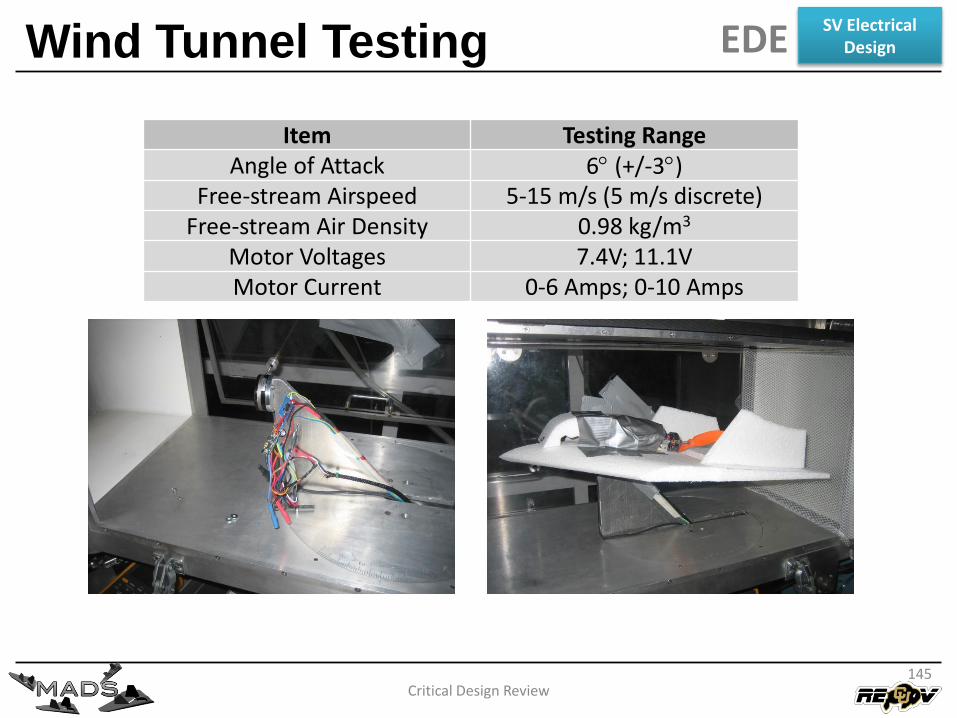
Wind Tunnel Testing
Critical Design Review
Item Testing RangeAngle of Attack 6 (+/-3)
Free-stream Airspeed 5-15 m/s (5 m/s discrete)Free-stream Air Density 0.98 kg/m3
Motor Voltages 7.4V; 11.1VMotor Current 0-6 Amps; 0-10 Amps
145
SV Electrical DesignEDE
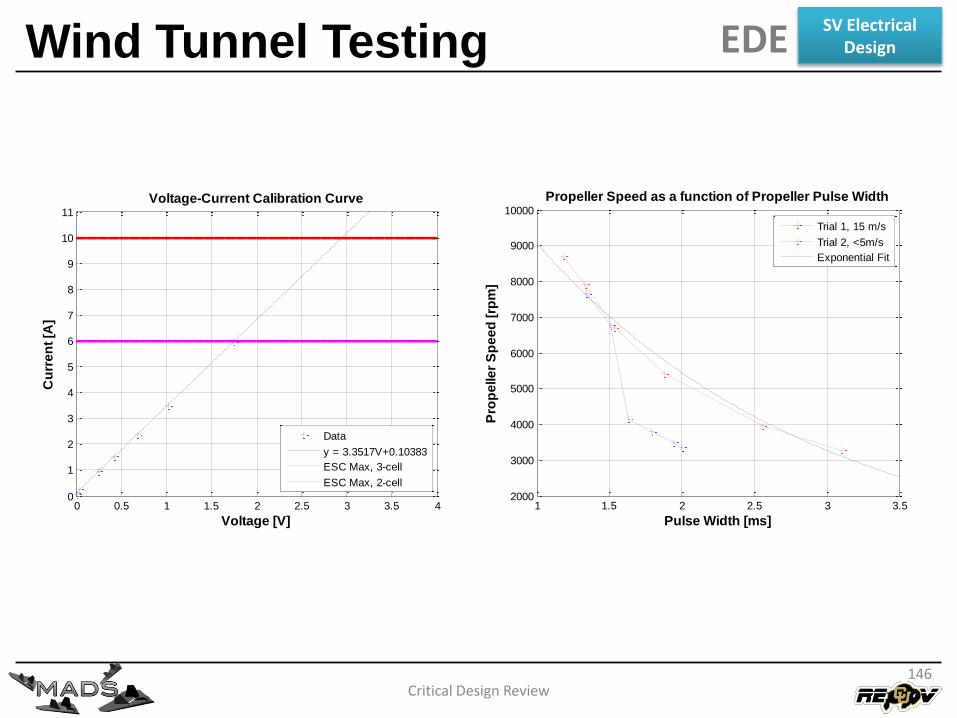
Wind Tunnel Testing
Critical Design Review
0 0.5 1 1.5 2 2.5 3 3.5 40
1
2
3
4
5
6
7
8
9
10
11
Voltage-Current Calibration Curve
Voltage [V]
Cu
rre
nt
[A]
Data
y = 3.3517V+0.10383
ESC Max, 3-cell
ESC Max, 2-cell
1 1.5 2 2.5 3 3.52000
3000
4000
5000
6000
7000
8000
9000
10000
Propeller Speed as a function of Propeller Pulse Width
Pulse Width [ms]
Pro
pe
lle
r S
pe
ed
[rp
m]
Trial 1, 15 m/s
Trial 2, <5m/s
Exponential Fit
146
SV Electrical DesignEDE
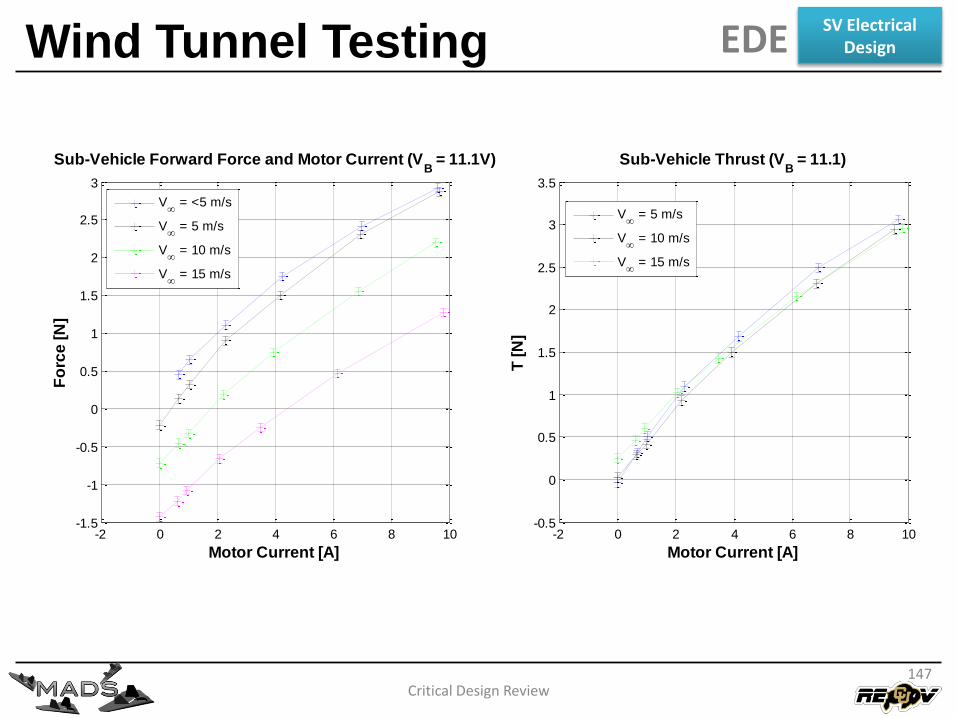
Wind Tunnel Testing
Critical Design Review
-2 0 2 4 6 8 10-1.5
-1
-0.5
0
0.5
1
1.5
2
2.5
3
Sub-Vehicle Forward Force and Motor Current (VB = 11.1V)
Motor Current [A]
Fo
rce
[N
]
V
= <5 m/s
V
= 5 m/s
V
= 10 m/s
V
= 15 m/s
-2 0 2 4 6 8 10-0.5
0
0.5
1
1.5
2
2.5
3
3.5
Sub-Vehicle Thrust (VB = 11.1)
Motor Current [A]
T [
N]
V
= 5 m/s
V
= 10 m/s
V
= 15 m/s
147
SV Electrical DesignEDE
SV Subsystem Analysis
Critical Design Review
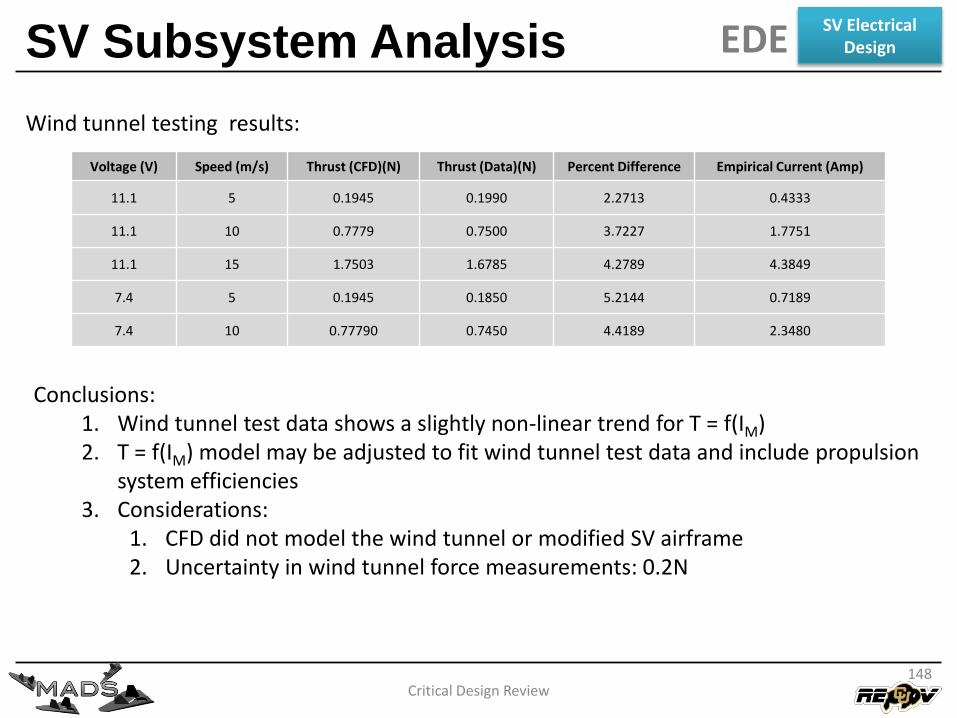
Voltage (V) Speed (m/s) Thrust (CFD)(N) Thrust (Data)(N) Percent Difference Empirical Current (Amp)
11.1 5 0.1945 0.1990 2.2713 0.4333
11.1 10 0.7779 0.7500 3.7227 1.7751
11.1 15 1.7503 1.6785 4.2789 4.3849
7.4 5 0.1945 0.1850 5.2144 0.7189
7.4 10 0.77790 0.7450 4.4189 2.3480
Wind tunnel testing results:
Conclusions:1. Wind tunnel test data shows a slightly non-linear trend for T = f(IM)2. T = f(IM) model may be adjusted to fit wind tunnel test data and include propulsion
system efficiencies3. Considerations:
1. CFD did not model the wind tunnel or modified SV airframe2. Uncertainty in wind tunnel force measurements: 0.2N
148
SV Electrical DesignEDE
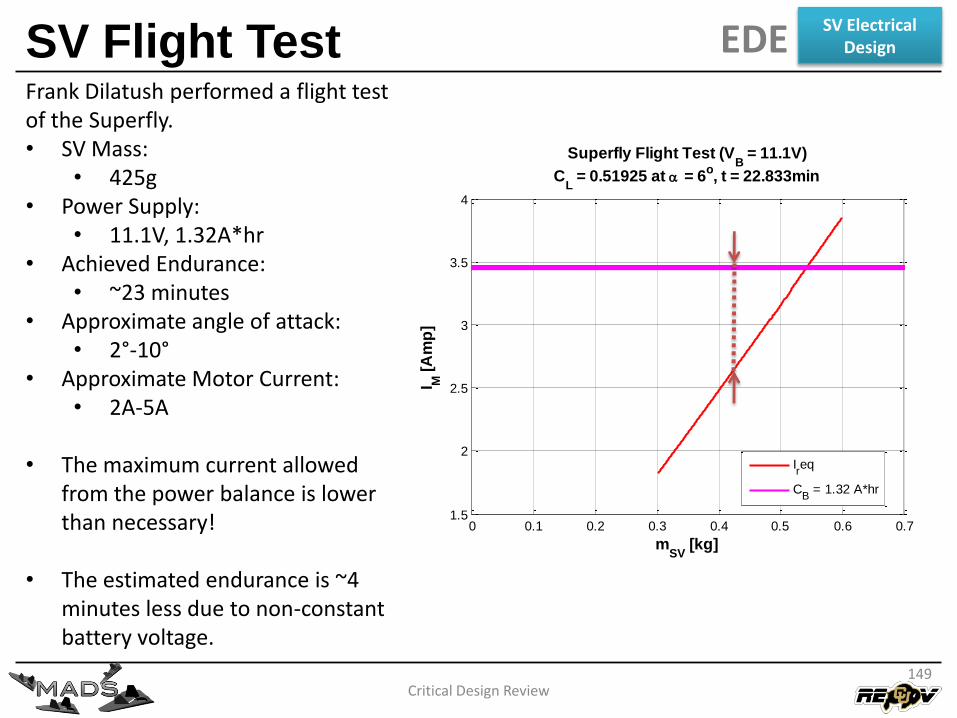
SV Flight Test
Critical Design Review
Frank Dilatush performed a flight test of the Superfly.• SV Mass:
• 425g• Power Supply:
• 11.1V, 1.32A*hr• Achieved Endurance:
• ~23 minutes• Approximate angle of attack:
• 2°-10°• Approximate Motor Current:
• 2A-5A
• The maximum current allowed from the power balance is lower than necessary!
• The estimated endurance is ~4 minutes less due to non-constant battery voltage.
0 0.1 0.2 0.3 0.4 0.5 0.6 0.71.5
2
2.5
3
3.5
4
Superfly Flight Test (VB = 11.1V)
CL = 0.51925 at = 6
o, t = 22.833min
mSV
[kg]
I M [
Am
p]
Ireq
CB = 1.32 A*hr
149
SV Electrical DesignEDE
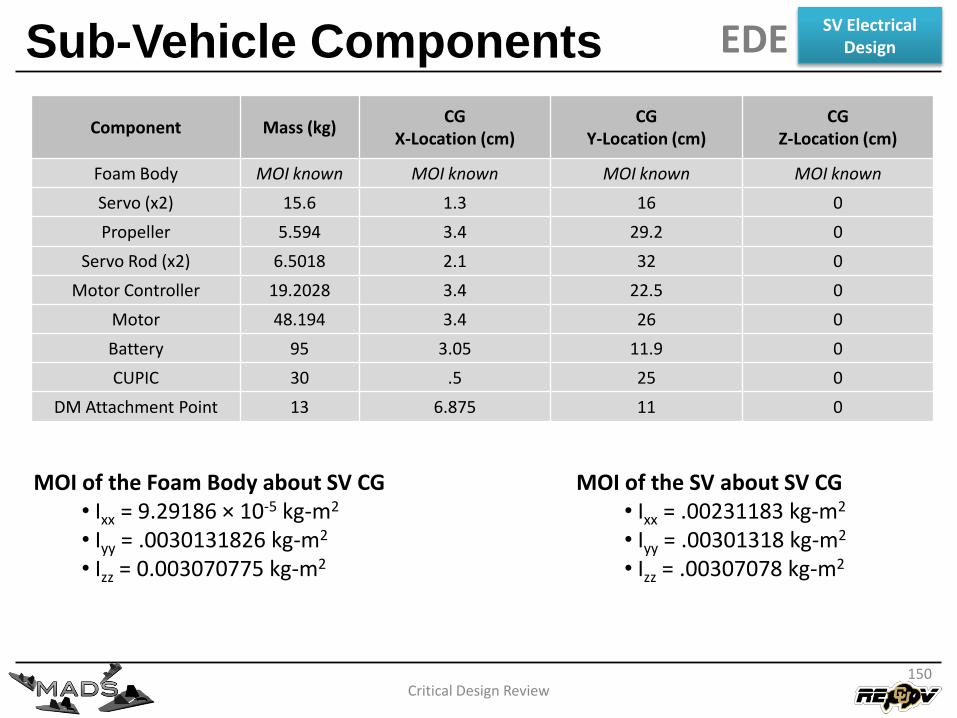
Sub-Vehicle Components
Critical Design Review
Component Mass (kg)CG
X-Location (cm)CG
Y-Location (cm)CG
Z-Location (cm)
Foam Body MOI known MOI known MOI known MOI known
Servo (x2) 15.6 1.3 16 0
Propeller 5.594 3.4 29.2 0
Servo Rod (x2) 6.5018 2.1 32 0
Motor Controller 19.2028 3.4 22.5 0
Motor 48.194 3.4 26 0
Battery 95 3.05 11.9 0
CUPIC 30 .5 25 0
DM Attachment Point 13 6.875 11 0
MOI of the Foam Body about SV CG • Ixx = 9.29186 × 10⁻⁵ kg-m2
• Iyy = .0030131826 kg-m2
• Izz = 0.003070775 kg-m2
MOI of the SV about SV CG • Ixx = .00231183 kg-m2
• Iyy = .00301318 kg-m2
• Izz = .00307078 kg-m2
150
SV Electrical DesignEDE
SV Center of Gravity
Critical Design Review
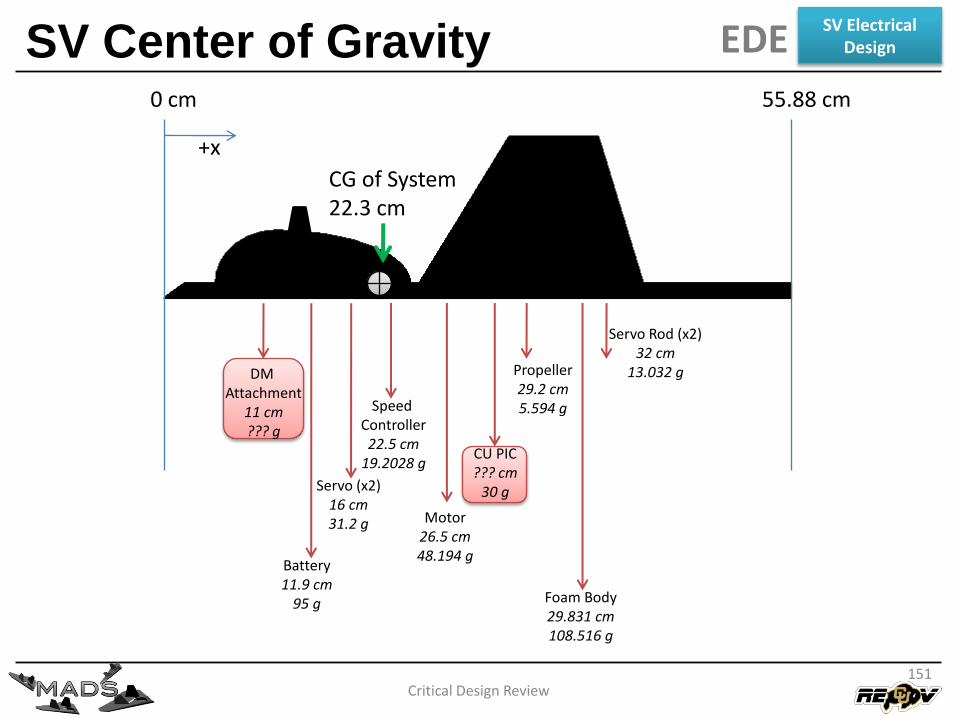
+x
0 cm 55.88 cm
Foam Body29.831 cm108.516 g
Propeller29.2 cm5.594 g
Servo Rod (x2)32 cm
13.032 g
Speed Controller22.5 cm
19.2028 g
Servo (x2)16 cm31.2 g Motor
26.5 cm48.194 g
Battery11.9 cm
95 g
DM Attachment
11 cm??? g
CG of System22.3 cm
CU PIC??? cm
30 g
151
SV Electrical DesignEDE
SV Center of Gravity
Critical Design Review
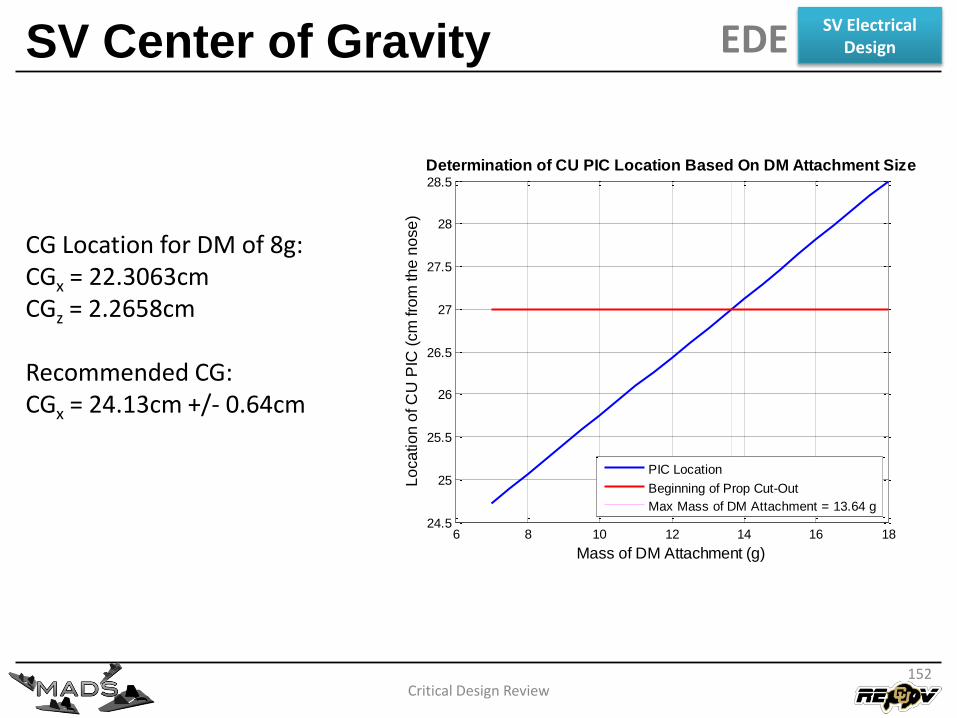
CG Location for DM of 8g:CGx = 22.3063cmCGz = 2.2658cm
Recommended CG:CGx = 24.13cm +/- 0.64cm
6 8 10 12 14 16 1824.5
25
25.5
26
26.5
27
27.5
28
28.5
Mass of DM Attachment (g)
Lo
ca
tio
n o
f C
U P
IC (
cm
fro
m th
e n
ose
)
Determination of CU PIC Location Based On DM Attachment Size
PIC Location
Beginning of Prop Cut-Out
Max Mass of DM Attachment = 13.64 g
152
SV Electrical DesignEDE
SV Subsystem Analysis
Critical Design Review
tV
tPVCI
tPtVIVC
tPtPVCE
PPP
M
PICBBM
PICMMBB
PICMBBB
PICMB
3600max,
Power and Energy Balances
M
pmM
M
pmMM
IV
VIfT
VITVP
)(
Linear Thrust Model
0 1 2 3 4 5 6 7 8 9 100
0.5
1
1.5
2
2.5
3
3.5
4
Sub-Vehicle Original Linear Thrust Model (VB = 7.4,
total = 60%)
IM
[Amp]
T [
N]
V
= 6 m/s
V
= 8 m/s
V
= 10 m/s
V
= 12 m/s
V
= 14 m/s
0 0.5 1 1.5 2 2.5 30
1
2
3
4
5
6
Maximum Allowable Sub-Vehicle Motor Current Draw (treq
= 30min)
CB [Amp*hr]
I ma
x [
A]
Model
COTS Available
153
SV Electrical DesignEDE
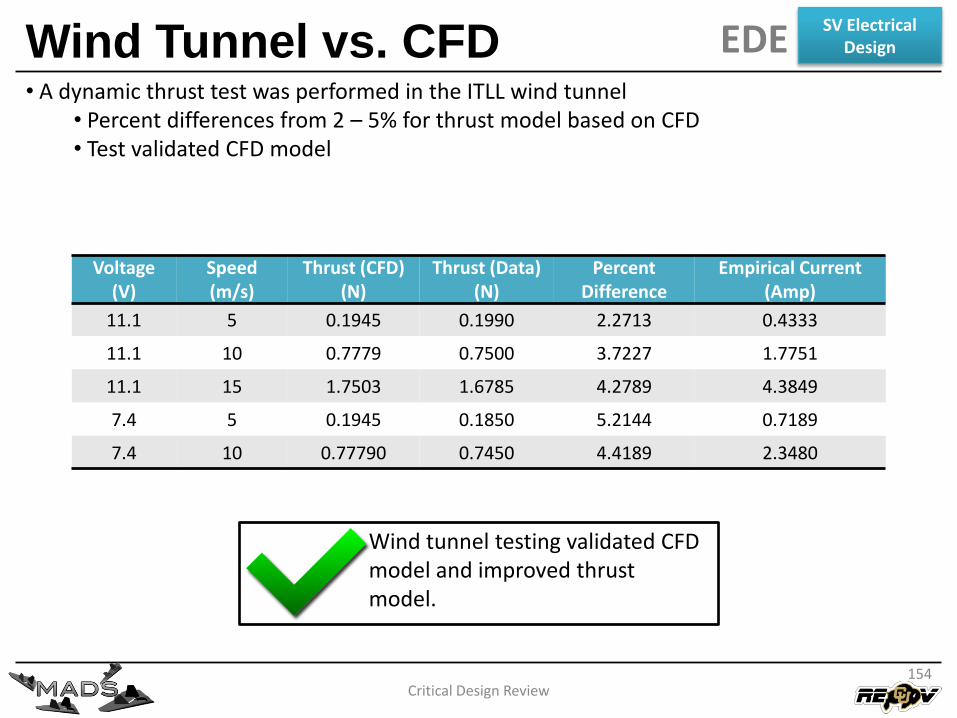
Wind Tunnel vs. CFD
Critical Design Review
• A dynamic thrust test was performed in the ITLL wind tunnel• Percent differences from 2 – 5% for thrust model based on CFD• Test validated CFD model
Voltage (V)
Speed (m/s)
Thrust (CFD)(N)
Thrust (Data)(N)
Percent Difference
Empirical Current (Amp)
11.1 5 0.1945 0.1990 2.2713 0.4333
11.1 10 0.7779 0.7500 3.7227 1.7751
11.1 15 1.7503 1.6785 4.2789 4.3849
7.4 5 0.1945 0.1850 5.2144 0.7189
7.4 10 0.77790 0.7450 4.4189 2.3480
Wind tunnel testing validated CFD model and improved thrust model.
154
SV Electrical DesignEDE
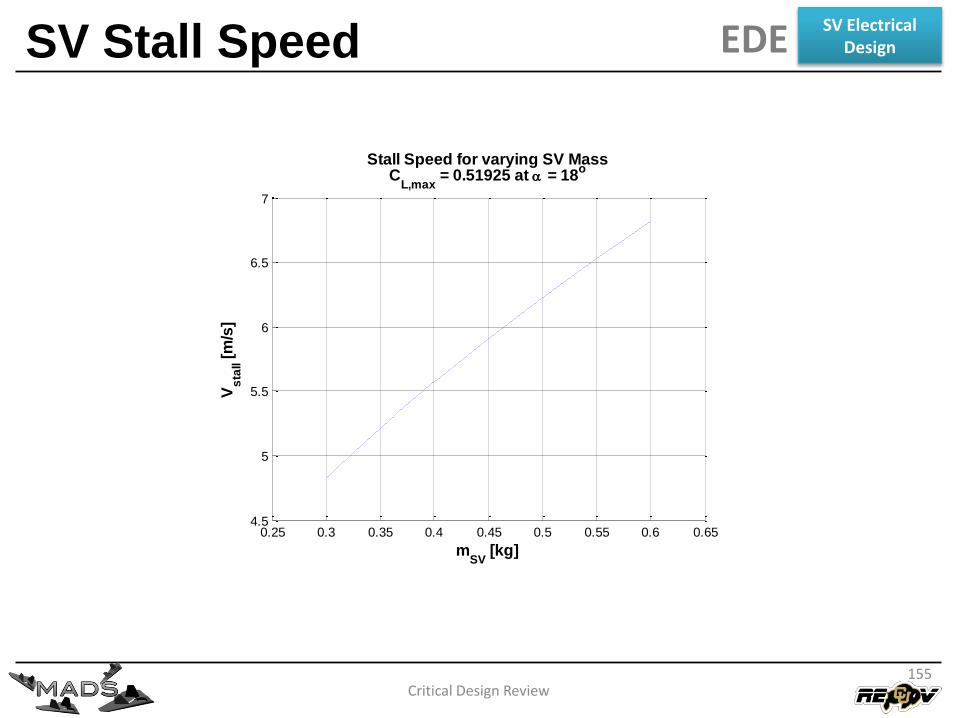
SV Stall Speed
Critical Design Review
0.25 0.3 0.35 0.4 0.45 0.5 0.55 0.6 0.654.5
5
5.5
6
6.5
7
Stall Speed for varying SV MassC
L,max = 0.51925 at = 18
o
mSV
[kg]
Vs
tall [
m/s
]
155
SV Electrical DesignEDE
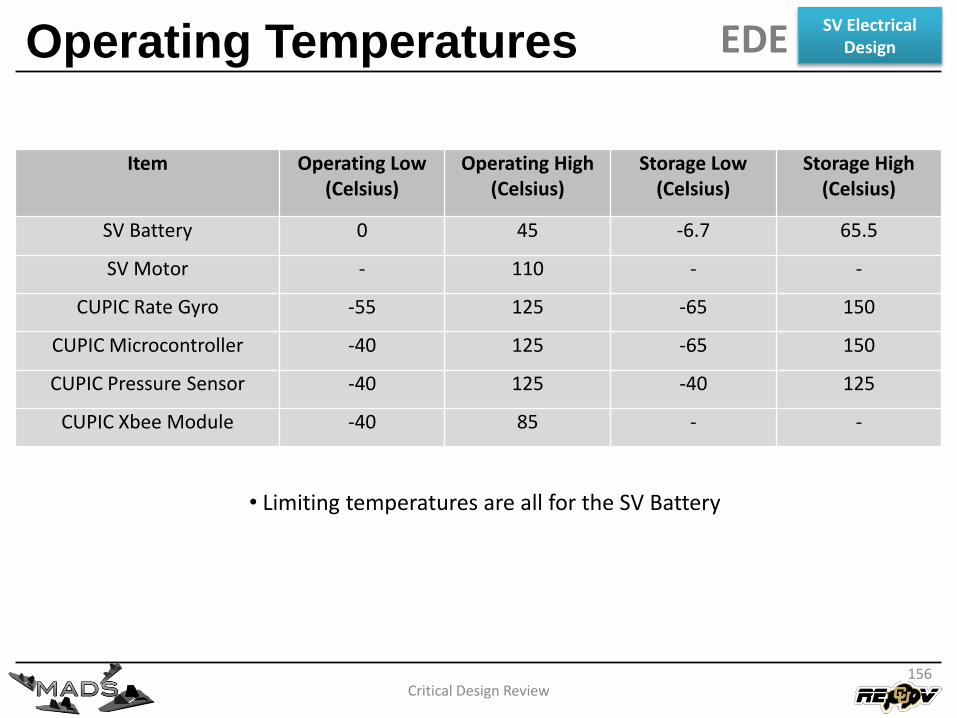
Operating Temperatures
Critical Design Review
Item Operating Low (Celsius)
Operating High (Celsius)
Storage Low (Celsius)
Storage High (Celsius)
SV Battery 0 45 -6.7 65.5
SV Motor - 110 - -
CUPIC Rate Gyro -55 125 -65 150
CUPIC Microcontroller -40 125 -65 150
CUPIC Pressure Sensor -40 125 -40 125
CUPIC Xbee Module -40 85 - -
• Limiting temperatures are all for the SV Battery
156
SV Electrical DesignEDE
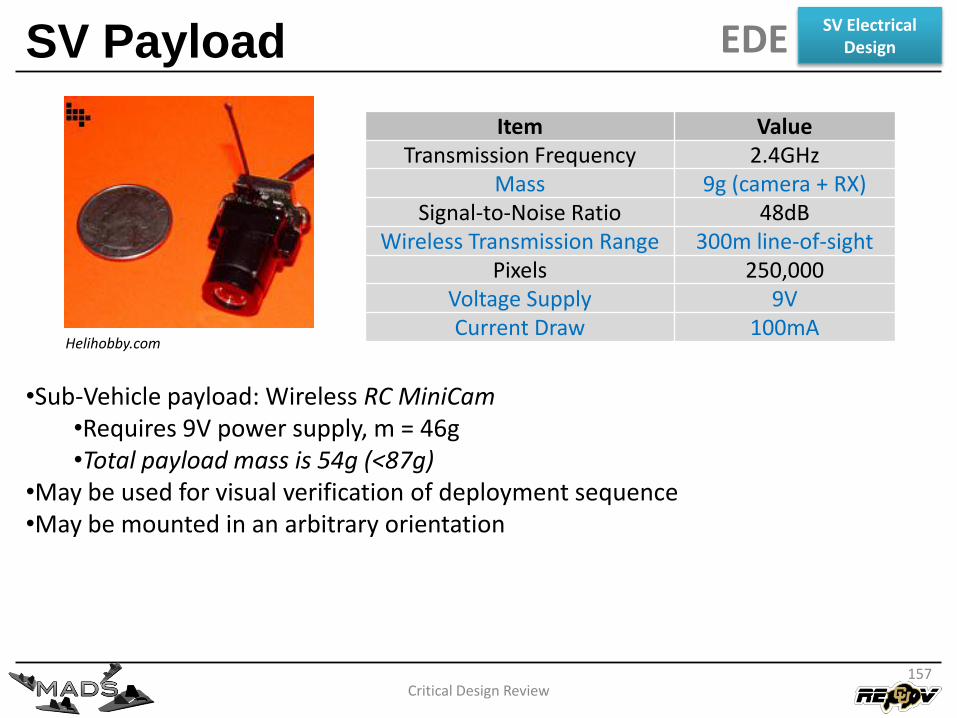
SV Payload
Critical Design Review
Item ValueTransmission Frequency 2.4GHz
Mass 9g (camera + RX)Signal-to-Noise Ratio 48dB
Wireless Transmission Range 300m line-of-sightPixels 250,000
Voltage Supply 9VCurrent Draw 100mA
•Sub-Vehicle payload: Wireless RC MiniCam•Requires 9V power supply, m = 46g•Total payload mass is 54g (<87g)
•May be used for visual verification of deployment sequence•May be mounted in an arbitrary orientation
Helihobby.com
157
SV Electrical DesignEDE

Critical Design Review158
Primary VehicleElectrical Design
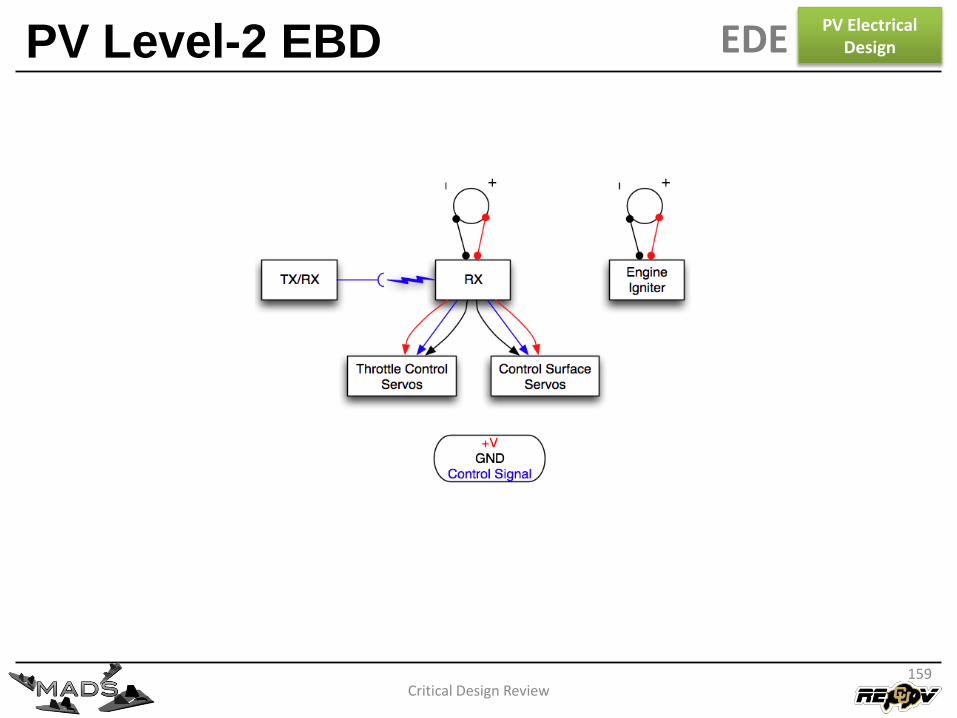
PV Level-2 EBD
Critical Design Review159
EDEPV Electrical
Design

Critical Design Review160
System Architecture
Design Elements
Manufacturing & System Integration Plan
Verification & Test Plan
Project Management Plan
Software Design Elements (SDE)
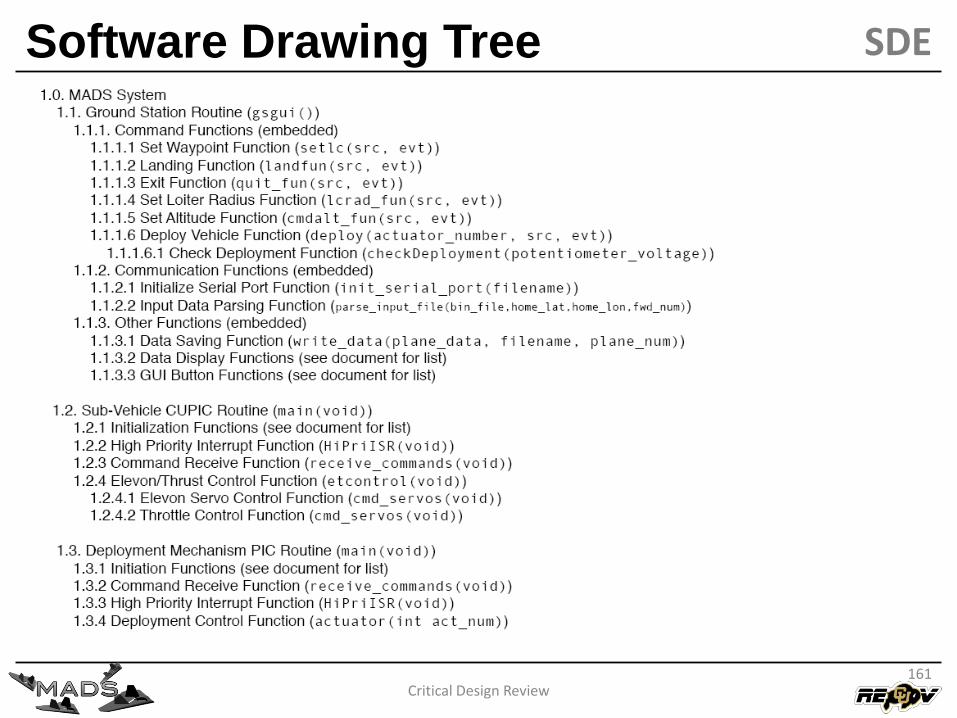
Software Drawing Tree
Critical Design Review161
SDE
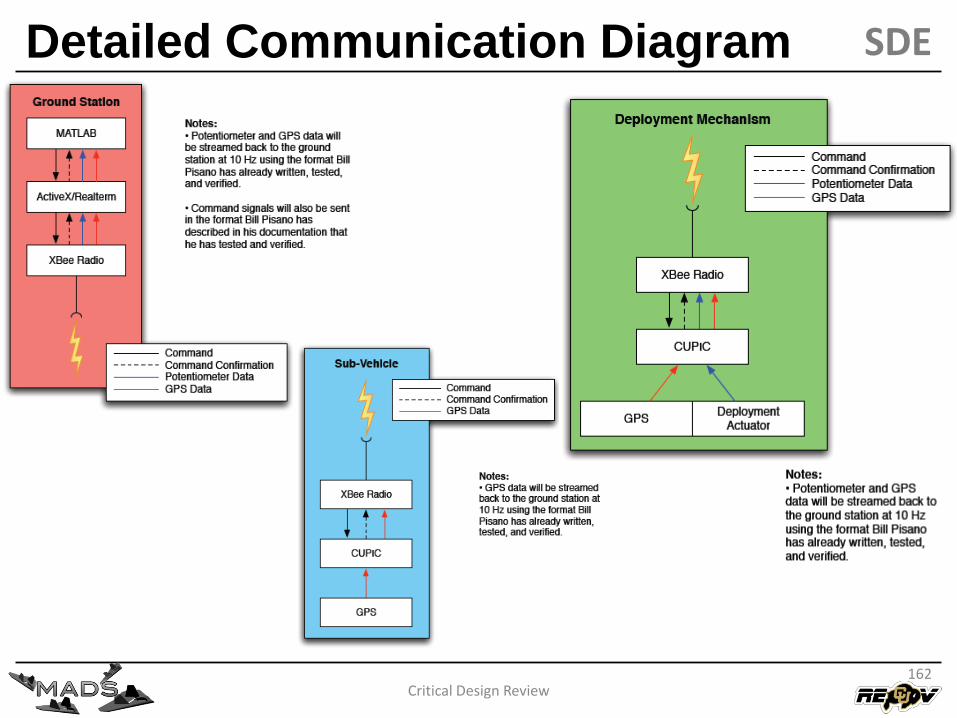
Detailed Communication Diagram
Critical Design Review162
SDE

Critical Design Review163
Sub-Vehicle Software Design
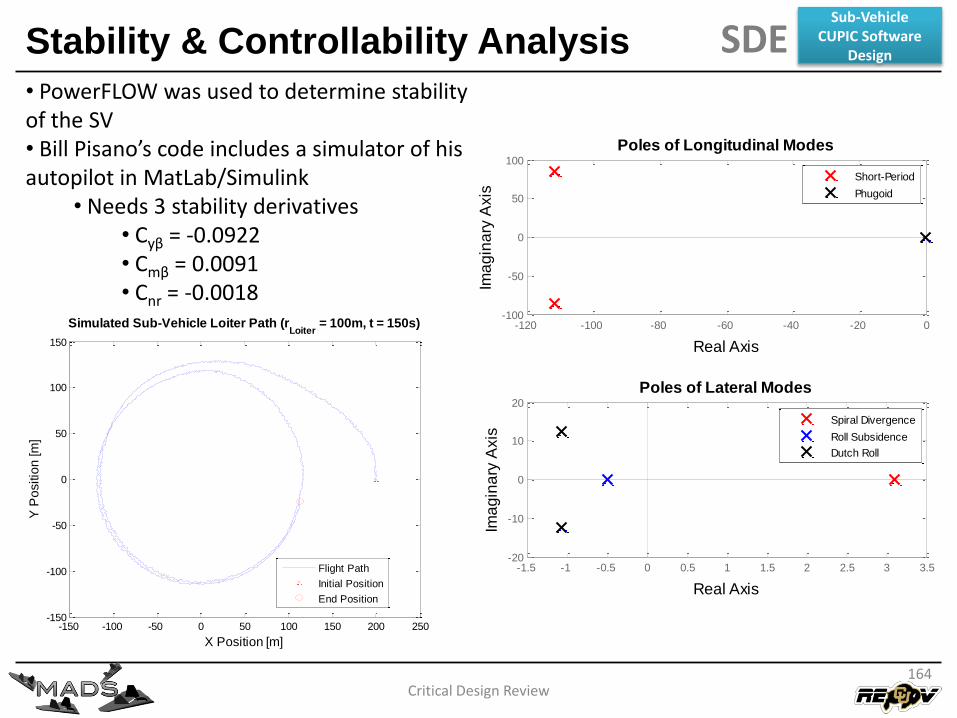
Stability & Controllability Analysis
Critical Design Review
• PowerFLOW was used to determine stability of the SV• Bill Pisano’s code includes a simulator of his autopilot in MatLab/Simulink
• Needs 3 stability derivatives• Cyβ = -0.0922• Cmβ = 0.0091• Cnr = -0.0018
SDE
-150 -100 -50 0 50 100 150 200 250-150
-100
-50
0
50
100
150
X Position [m]
Y P
ositio
n [m
]
Simulated Sub-Vehicle Loiter Path (rLoiter
= 100m, t = 150s)
Flight Path
Initial Position
End Position
-120 -100 -80 -60 -40 -20 0-100
-50
0
50
100
Poles of Longitudinal Modes
Real Axis
Ima
gin
ary
Axis
Short-Period
Phugoid
-1.5 -1 -0.5 0 0.5 1 1.5 2 2.5 3 3.5-20
-10
0
10
20
Poles of Lateral Modes
Real Axis
Ima
gin
ary
Axis
Spiral Divergence
Roll Subsidence
Dutch Roll
Sub-VehicleCUPIC Software
Design
164

Critical Design Review165
System Architecture
Design Elements
Manufacturing & System Integration Plan
Verification & Test Plan
Project Management Plan

Critical Design Review166
System Architecture
Design Elements
Manufacturing & System Integration Plan
Verification & Test Plan
Project Management Plan
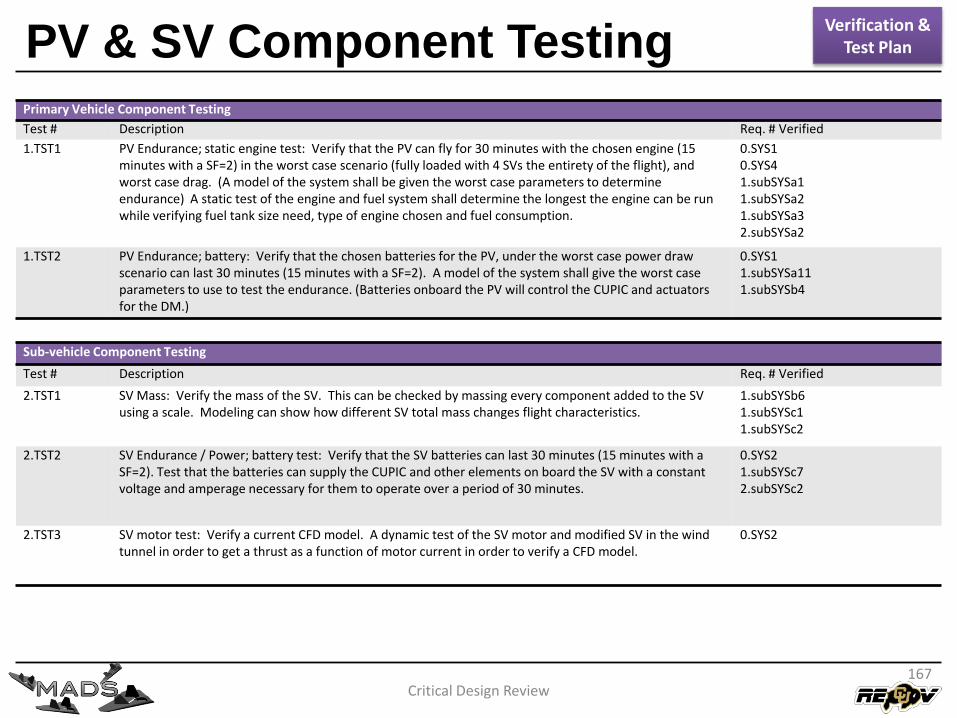
PV & SV Component Testing
167Critical Design Review
Primary Vehicle Component Testing
Test # Description Req. # Verified
1.TST1 PV Endurance; static engine test: Verify that the PV can fly for 30 minutes with the chosen engine (15 minutes with a SF=2) in the worst case scenario (fully loaded with 4 SVs the entirety of the flight), and worst case drag. (A model of the system shall be given the worst case parameters to determine endurance) A static test of the engine and fuel system shall determine the longest the engine can be run while verifying fuel tank size need, type of engine chosen and fuel consumption.
0.SYS10.SYS41.subSYSa11.subSYSa21.subSYSa32.subSYSa2
1.TST2 PV Endurance; battery: Verify that the chosen batteries for the PV, under the worst case power draw scenario can last 30 minutes (15 minutes with a SF=2). A model of the system shall give the worst case parameters to use to test the endurance. (Batteries onboard the PV will control the CUPIC and actuators for the DM.)
0.SYS11.subSYSa111.subSYSb4
Sub-vehicle Component Testing
Test # Description Req. # Verified
2.TST1 SV Mass: Verify the mass of the SV. This can be checked by massing every component added to the SV using a scale. Modeling can show how different SV total mass changes flight characteristics.
1.subSYSb61.subSYSc11.subSYSc2
2.TST2 SV Endurance / Power; battery test: Verify that the SV batteries can last 30 minutes (15 minutes with a SF=2). Test that the batteries can supply the CUPIC and other elements on board the SV with a constant voltage and amperage necessary for them to operate over a period of 30 minutes.
0.SYS21.subSYSc72.subSYSc2
2.TST3 SV motor test: Verify a current CFD model. A dynamic test of the SV motor and modified SV in the wind tunnel in order to get a thrust as a function of motor current in order to verify a CFD model.
0.SYS2
Verification & Test Plan
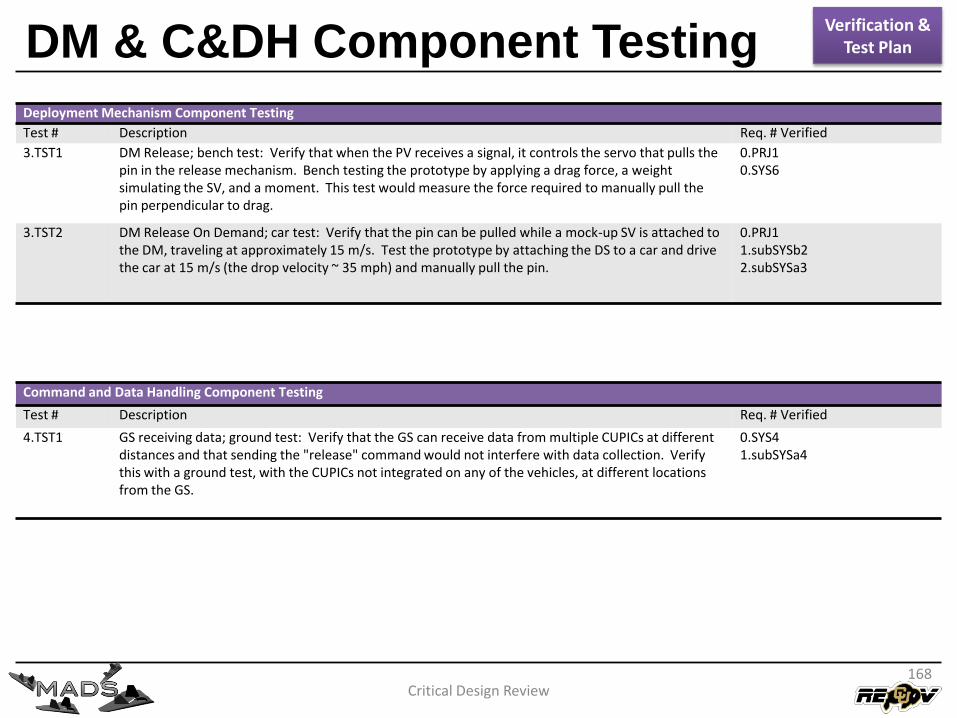
DM & C&DH Component Testing
Critical Design Review168
Deployment Mechanism Component Testing
Test # Description Req. # Verified
3.TST1 DM Release; bench test: Verify that when the PV receives a signal, it controls the servo that pulls the pin in the release mechanism. Bench testing the prototype by applying a drag force, a weight simulating the SV, and a moment. This test would measure the force required to manually pull the pin perpendicular to drag.
0.PRJ10.SYS6
3.TST2 DM Release On Demand; car test: Verify that the pin can be pulled while a mock-up SV is attached to the DM, traveling at approximately 15 m/s. Test the prototype by attaching the DS to a car and drive the car at 15 m/s (the drop velocity ~ 35 mph) and manually pull the pin.
0.PRJ11.subSYSb22.subSYSa3
Command and Data Handling Component Testing
Test # Description Req. # Verified
4.TST1 GS receiving data; ground test: Verify that the GS can receive data from multiple CUPICs at different distances and that sending the "release" command would not interfere with data collection. Verify this with a ground test, with the CUPICs not integrated on any of the vehicles, at different locations from the GS.
0.SYS41.subSYSa4
Verification & Test Plan
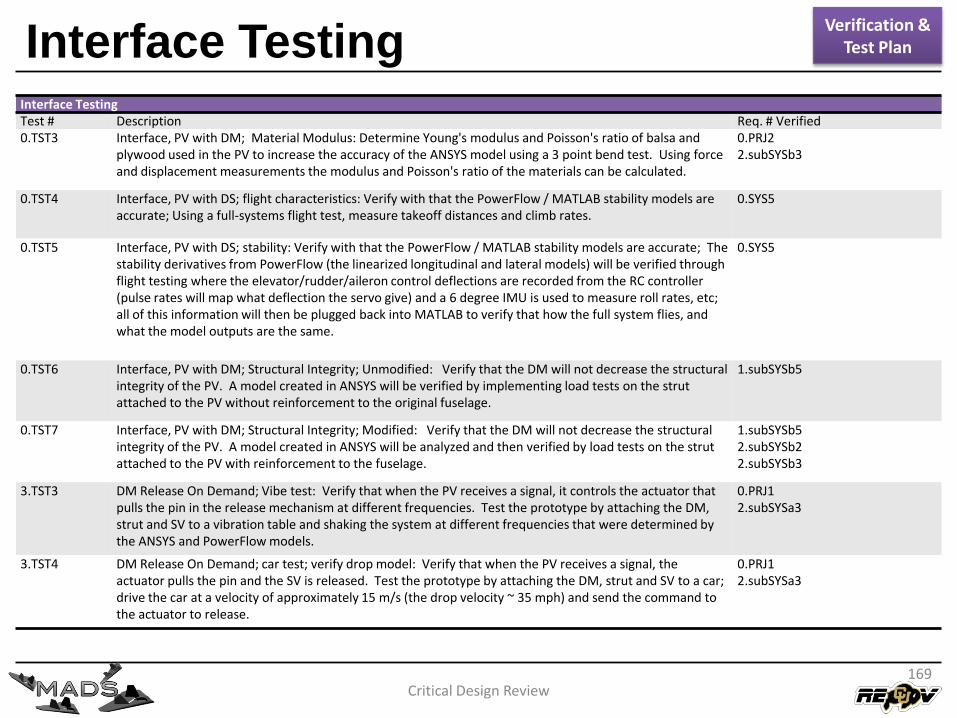
Interface Testing
Critical Design Review169
Interface TestingTest # Description Req. # Verified0.TST3 Interface, PV with DM; Material Modulus: Determine Young's modulus and Poisson's ratio of balsa and
plywood used in the PV to increase the accuracy of the ANSYS model using a 3 point bend test. Using force and displacement measurements the modulus and Poisson's ratio of the materials can be calculated.
0.PRJ22.subSYSb3
0.TST4 Interface, PV with DS; flight characteristics: Verify with that the PowerFlow / MATLAB stability models are accurate; Using a full-systems flight test, measure takeoff distances and climb rates.
0.SYS5
0.TST5 Interface, PV with DS; stability: Verify with that the PowerFlow / MATLAB stability models are accurate; The stability derivatives from PowerFlow (the linearized longitudinal and lateral models) will be verified through flight testing where the elevator/rudder/aileron control deflections are recorded from the RC controller (pulse rates will map what deflection the servo give) and a 6 degree IMU is used to measure roll rates, etc; all of this information will then be plugged back into MATLAB to verify that how the full system flies, and what the model outputs are the same.
0.SYS5
0.TST6 Interface, PV with DM; Structural Integrity; Unmodified: Verify that the DM will not decrease the structural integrity of the PV. A model created in ANSYS will be verified by implementing load tests on the strut attached to the PV without reinforcement to the original fuselage.
1.subSYSb5
0.TST7 Interface, PV with DM; Structural Integrity; Modified: Verify that the DM will not decrease the structural integrity of the PV. A model created in ANSYS will be analyzed and then verified by load tests on the strut attached to the PV with reinforcement to the fuselage.
1.subSYSb52.subSYSb22.subSYSb3
3.TST3 DM Release On Demand; Vibe test: Verify that when the PV receives a signal, it controls the actuator that pulls the pin in the release mechanism at different frequencies. Test the prototype by attaching the DM, strut and SV to a vibration table and shaking the system at different frequencies that were determined by the ANSYS and PowerFlow models.
0.PRJ12.subSYSa3
3.TST4 DM Release On Demand; car test; verify drop model: Verify that when the PV receives a signal, the actuator pulls the pin and the SV is released. Test the prototype by attaching the DM, strut and SV to a car; drive the car at a velocity of approximately 15 m/s (the drop velocity ~ 35 mph) and send the command to the actuator to release.
0.PRJ12.subSYSa3
Verification & Test Plan
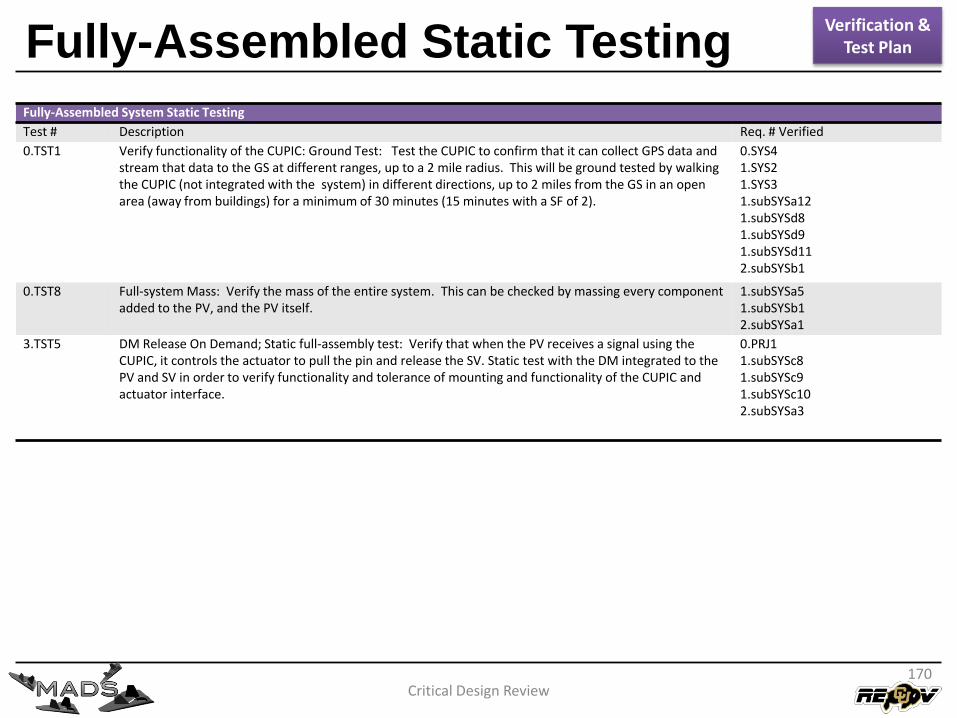
Fully-Assembled Static Testing
Critical Design Review170
Fully-Assembled System Static Testing
Test # Description Req. # Verified
0.TST1 Verify functionality of the CUPIC: Ground Test: Test the CUPIC to confirm that it can collect GPS data and stream that data to the GS at different ranges, up to a 2 mile radius. This will be ground tested by walking the CUPIC (not integrated with the system) in different directions, up to 2 miles from the GS in an open area (away from buildings) for a minimum of 30 minutes (15 minutes with a SF of 2).
0.SYS41.SYS21.SYS31.subSYSa121.subSYSd81.subSYSd91.subSYSd112.subSYSb1
0.TST8 Full-system Mass: Verify the mass of the entire system. This can be checked by massing every component added to the PV, and the PV itself.
1.subSYSa51.subSYSb12.subSYSa1
3.TST5 DM Release On Demand; Static full-assembly test: Verify that when the PV receives a signal using the CUPIC, it controls the actuator to pull the pin and release the SV. Static test with the DM integrated to the PV and SV in order to verify functionality and tolerance of mounting and functionality of the CUPIC and actuator interface.
0.PRJ11.subSYSc81.subSYSc91.subSYSc102.subSYSa3
Verification & Test Plan
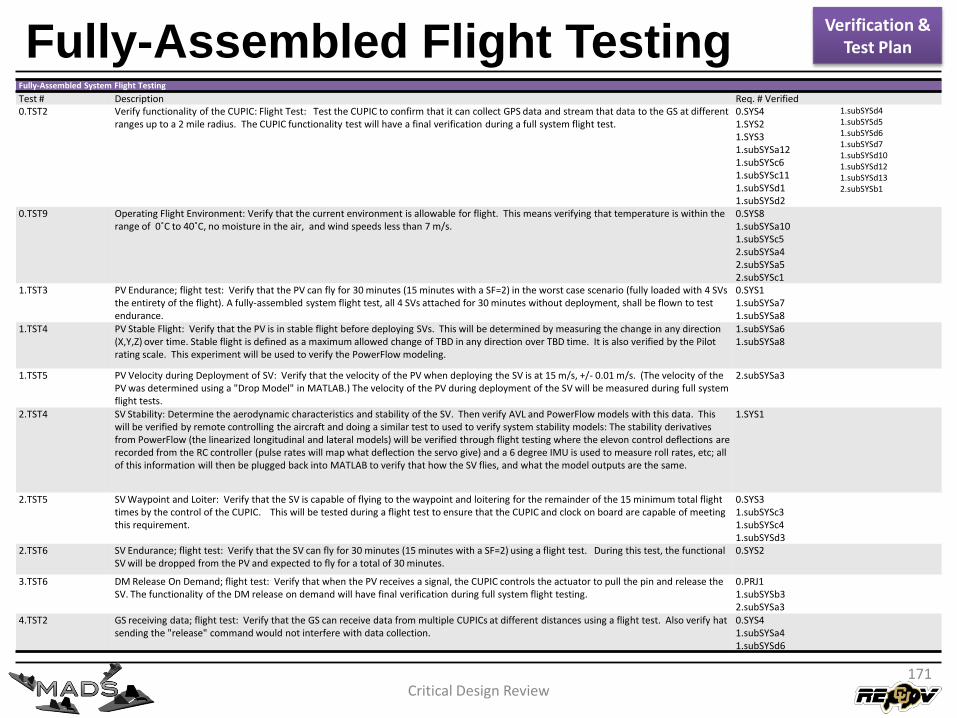
Fully-Assembled Flight Testing
Critical Design Review171
Fully-Assembled System Flight Testing
Test # Description Req. # Verified0.TST2 Verify functionality of the CUPIC: Flight Test: Test the CUPIC to confirm that it can collect GPS data and stream that data to the GS at different
ranges up to a 2 mile radius. The CUPIC functionality test will have a final verification during a full system flight test.0.SYS41.SYS21.SYS31.subSYSa121.subSYSc61.subSYSc111.subSYSd11.subSYSd2
1.subSYSd41.subSYSd51.subSYSd61.subSYSd71.subSYSd101.subSYSd121.subSYSd132.subSYSb1
0.TST9 Operating Flight Environment: Verify that the current environment is allowable for flight. This means verifying that temperature is within the range of 0˚C to 40˚C, no moisture in the air, and wind speeds less than 7 m/s.
0.SYS81.subSYSa101.subSYSc52.subSYSa42.subSYSa52.subSYSc1
1.TST3 PV Endurance; flight test: Verify that the PV can fly for 30 minutes (15 minutes with a SF=2) in the worst case scenario (fully loaded with 4 SVs the entirety of the flight). A fully-assembled system flight test, all 4 SVs attached for 30 minutes without deployment, shall be flown to test endurance.
0.SYS11.subSYSa71.subSYSa8
1.TST4 PV Stable Flight: Verify that the PV is in stable flight before deploying SVs. This will be determined by measuring the change in any direction (X,Y,Z) over time. Stable flight is defined as a maximum allowed change of TBD in any direction over TBD time. It is also verified by the Pilot rating scale. This experiment will be used to verify the PowerFlow modeling.
1.subSYSa61.subSYSa8
1.TST5 PV Velocity during Deployment of SV: Verify that the velocity of the PV when deploying the SV is at 15 m/s, +/- 0.01 m/s. (The velocity of the PV was determined using a "Drop Model" in MATLAB.) The velocity of the PV during deployment of the SV will be measured during full system flight tests.
2.subSYSa3
2.TST4 SV Stability: Determine the aerodynamic characteristics and stability of the SV. Then verify AVL and PowerFlow models with this data. This will be verified by remote controlling the aircraft and doing a similar test to used to verify system stability models: The stability derivatives from PowerFlow (the linearized longitudinal and lateral models) will be verified through flight testing where the elevon control deflections are recorded from the RC controller (pulse rates will map what deflection the servo give) and a 6 degree IMU is used to measure roll rates, etc; all of this information will then be plugged back into MATLAB to verify that how the SV flies, and what the model outputs are the same.
1.SYS1
2.TST5 SV Waypoint and Loiter: Verify that the SV is capable of flying to the waypoint and loitering for the remainder of the 15 minimum total flight times by the control of the CUPIC. This will be tested during a flight test to ensure that the CUPIC and clock on board are capable of meeting this requirement.
0.SYS31.subSYSc31.subSYSc41.subSYSd3
2.TST6 SV Endurance; flight test: Verify that the SV can fly for 30 minutes (15 minutes with a SF=2) using a flight test. During this test, the functional SV will be dropped from the PV and expected to fly for a total of 30 minutes.
0.SYS2
3.TST6 DM Release On Demand; flight test: Verify that when the PV receives a signal, the CUPIC controls the actuator to pull the pin and release the SV. The functionality of the DM release on demand will have final verification during full system flight testing.
0.PRJ11.subSYSb32.subSYSa3
4.TST2 GS receiving data; flight test: Verify that the GS can receive data from multiple CUPICs at different distances using a flight test. Also verify hat sending the "release" command would not interfere with data collection.
0.SYS41.subSYSa41.subSYSd6
Verification & Test Plan
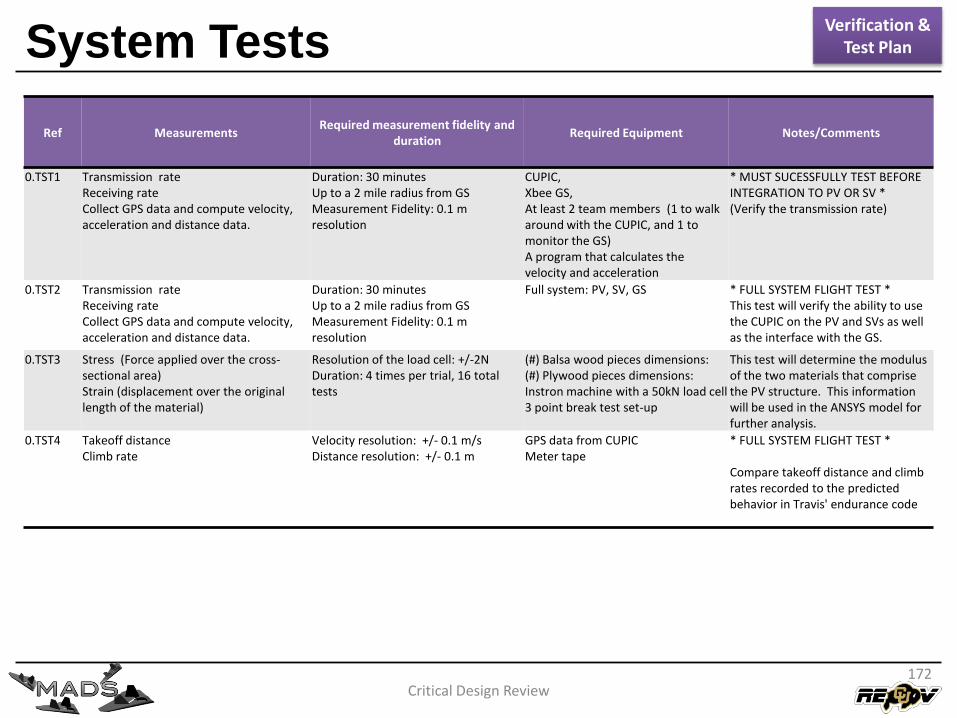
System Tests
Critical Design Review172
Ref MeasurementsRequired measurement fidelity and
durationRequired Equipment Notes/Comments
0.TST1 Transmission rateReceiving rateCollect GPS data and compute velocity, acceleration and distance data.
Duration: 30 minutesUp to a 2 mile radius from GSMeasurement Fidelity: 0.1 m resolution
CUPIC,Xbee GS,At least 2 team members (1 to walk around with the CUPIC, and 1 to monitor the GS)A program that calculates the velocity and acceleration
* MUST SUCESSFULLY TEST BEFORE INTEGRATION TO PV OR SV *(Verify the transmission rate)
0.TST2 Transmission rateReceiving rateCollect GPS data and compute velocity, acceleration and distance data.
Duration: 30 minutesUp to a 2 mile radius from GSMeasurement Fidelity: 0.1 m resolution
Full system: PV, SV, GS * FULL SYSTEM FLIGHT TEST *This test will verify the ability to use the CUPIC on the PV and SVs as well as the interface with the GS.
0.TST3 Stress (Force applied over the cross-sectional area)Strain (displacement over the original length of the material)
Resolution of the load cell: +/-2NDuration: 4 times per trial, 16 total tests
(#) Balsa wood pieces dimensions: (#) Plywood pieces dimensions: Instron machine with a 50kN load cell3 point break test set-up
This test will determine the modulus of the two materials that comprise the PV structure. This information will be used in the ANSYS model for further analysis.
0.TST4 Takeoff distanceClimb rate
Velocity resolution: +/- 0.1 m/s Distance resolution: +/- 0.1 m
GPS data from CUPICMeter tape
* FULL SYSTEM FLIGHT TEST *
Compare takeoff distance and climb rates recorded to the predicted behavior in Travis' endurance code
Verification & Test Plan
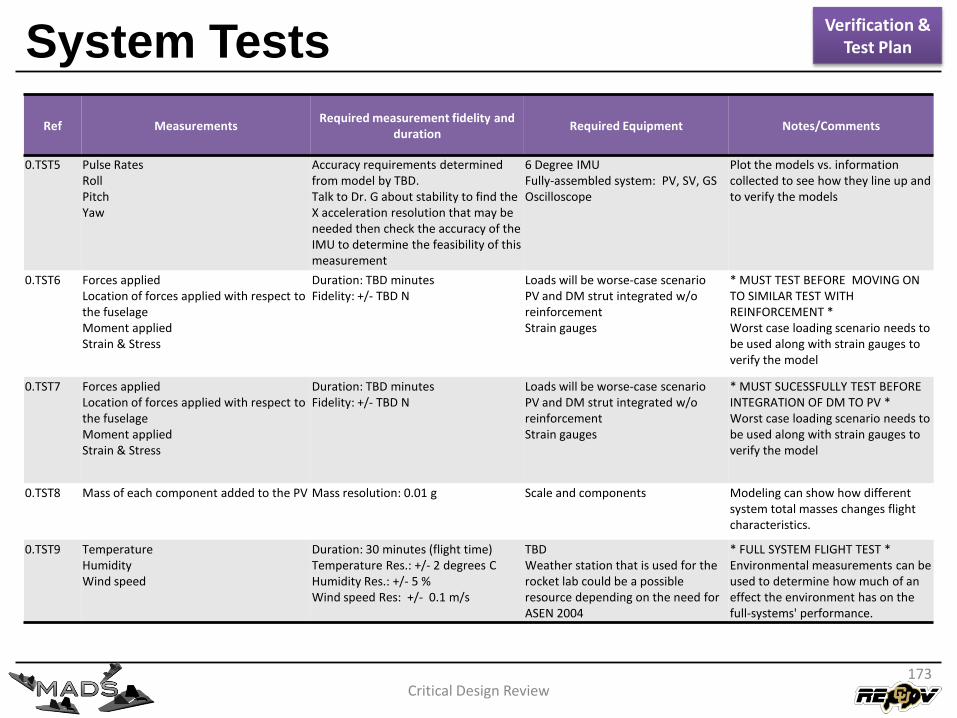
System Tests
Critical Design Review173
Ref MeasurementsRequired measurement fidelity and
durationRequired Equipment Notes/Comments
0.TST5 Pulse RatesRollPitchYaw
Accuracy requirements determined from model by TBD.Talk to Dr. G about stability to find the X acceleration resolution that may be needed then check the accuracy of the IMU to determine the feasibility of this measurement
6 Degree IMUFully-assembled system: PV, SV, GSOscilloscope
Plot the models vs. information collected to see how they line up and to verify the models
0.TST6 Forces appliedLocation of forces applied with respect to the fuselageMoment appliedStrain & Stress
Duration: TBD minutesFidelity: +/- TBD N
Loads will be worse-case scenarioPV and DM strut integrated w/o reinforcementStrain gauges
* MUST TEST BEFORE MOVING ON TO SIMILAR TEST WITH REINFORCEMENT *Worst case loading scenario needs to be used along with strain gauges to verify the model
0.TST7 Forces appliedLocation of forces applied with respect to the fuselageMoment appliedStrain & Stress
Duration: TBD minutesFidelity: +/- TBD N
Loads will be worse-case scenarioPV and DM strut integrated w/o reinforcementStrain gauges
* MUST SUCESSFULLY TEST BEFORE INTEGRATION OF DM TO PV *Worst case loading scenario needs to be used along with strain gauges to verify the model
0.TST8 Mass of each component added to the PV Mass resolution: 0.01 g Scale and components Modeling can show how different system total masses changes flight characteristics.
0.TST9 TemperatureHumidityWind speed
Duration: 30 minutes (flight time)Temperature Res.: +/- 2 degrees CHumidity Res.: +/- 5 %Wind speed Res: +/- 0.1 m/s
TBDWeather station that is used for the rocket lab could be a possible resource depending on the need for ASEN 2004
* FULL SYSTEM FLIGHT TEST *Environmental measurements can be used to determine how much of an effect the environment has on the full-systems' performance.
Verification & Test Plan
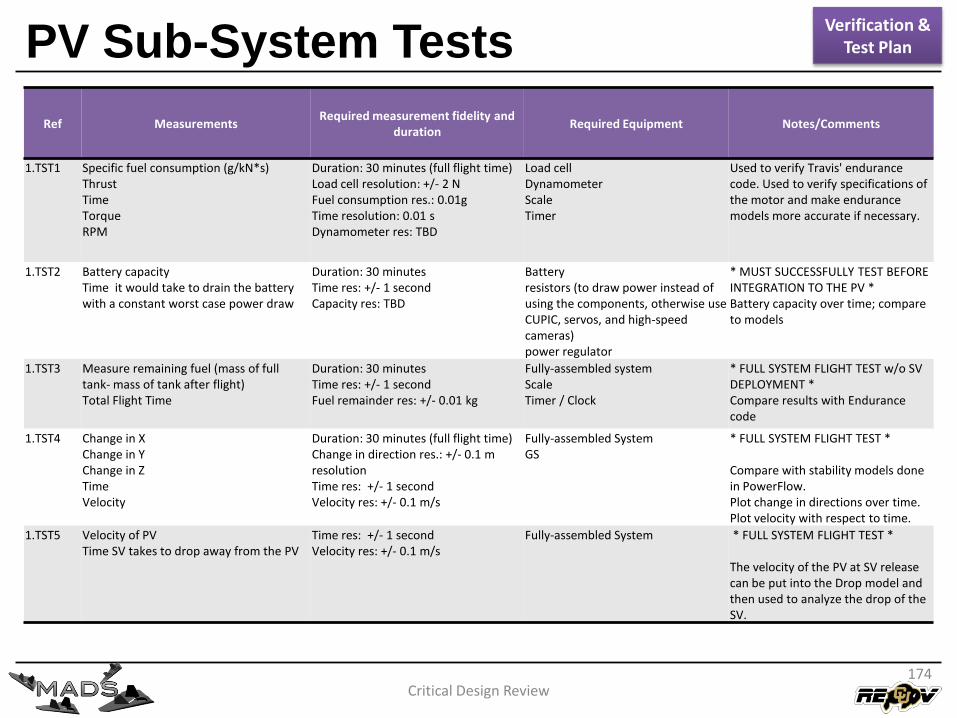
PV Sub-System Tests
Critical Design Review174
Ref MeasurementsRequired measurement fidelity and
durationRequired Equipment Notes/Comments
1.TST1 Specific fuel consumption (g/kN*s)ThrustTimeTorqueRPM
Duration: 30 minutes (full flight time)Load cell resolution: +/- 2 NFuel consumption res.: 0.01gTime resolution: 0.01 sDynamometer res: TBD
Load cellDynamometerScaleTimer
Used to verify Travis' endurance code. Used to verify specifications of the motor and make endurance models more accurate if necessary.
1.TST2 Battery capacityTime it would take to drain the battery with a constant worst case power draw
Duration: 30 minutes Time res: +/- 1 secondCapacity res: TBD
Batteryresistors (to draw power instead of using the components, otherwise use CUPIC, servos, and high-speed cameras)power regulator
* MUST SUCCESSFULLY TEST BEFORE INTEGRATION TO THE PV *Battery capacity over time; compare to models
1.TST3 Measure remaining fuel (mass of full tank- mass of tank after flight)Total Flight Time
Duration: 30 minutes Time res: +/- 1 secondFuel remainder res: +/- 0.01 kg
Fully-assembled systemScaleTimer / Clock
* FULL SYSTEM FLIGHT TEST w/o SV DEPLOYMENT *Compare results with Endurance code
1.TST4 Change in XChange in YChange in ZTimeVelocity
Duration: 30 minutes (full flight time)Change in direction res.: +/- 0.1 m resolutionTime res: +/- 1 secondVelocity res: +/- 0.1 m/s
Fully-assembled SystemGS
* FULL SYSTEM FLIGHT TEST *
Compare with stability models done in PowerFlow. Plot change in directions over time.Plot velocity with respect to time.
1.TST5 Velocity of PVTime SV takes to drop away from the PV
Time res: +/- 1 secondVelocity res: +/- 0.1 m/s
Fully-assembled System * FULL SYSTEM FLIGHT TEST *
The velocity of the PV at SV release can be put into the Drop model and then used to analyze the drop of the SV.
Verification & Test Plan
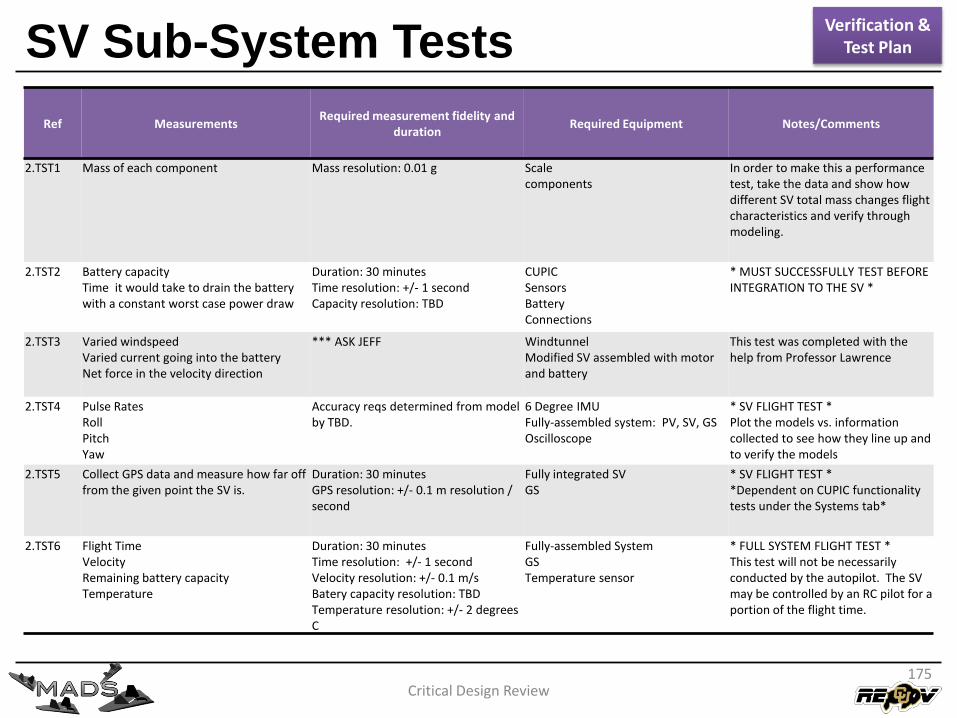
SV Sub-System Tests
Critical Design Review175
Ref MeasurementsRequired measurement fidelity and
durationRequired Equipment Notes/Comments
2.TST1 Mass of each component Mass resolution: 0.01 g Scalecomponents
In order to make this a performance test, take the data and show how different SV total mass changes flight characteristics and verify through modeling.
2.TST2 Battery capacityTime it would take to drain the battery with a constant worst case power draw
Duration: 30 minutes Time resolution: +/- 1 secondCapacity resolution: TBD
CUPICSensorsBatteryConnections
* MUST SUCCESSFULLY TEST BEFORE INTEGRATION TO THE SV *
2.TST3 Varied windspeedVaried current going into the batteryNet force in the velocity direction
*** ASK JEFF WindtunnelModified SV assembled with motor and battery
This test was completed with the help from Professor Lawrence
2.TST4 Pulse RatesRollPitchYaw
Accuracy reqs determined from model by TBD.
6 Degree IMUFully-assembled system: PV, SV, GSOscilloscope
* SV FLIGHT TEST *Plot the models vs. information collected to see how they line up and to verify the models
2.TST5 Collect GPS data and measure how far off from the given point the SV is.
Duration: 30 minutes GPS resolution: +/- 0.1 m resolution / second
Fully integrated SVGS
* SV FLIGHT TEST **Dependent on CUPIC functionality tests under the Systems tab*
2.TST6 Flight TimeVelocityRemaining battery capacityTemperature
Duration: 30 minutesTime resolution: +/- 1 secondVelocity resolution: +/- 0.1 m/sBatery capacity resolution: TBDTemperature resolution: +/- 2 degrees C
Fully-assembled SystemGSTemperature sensor
* FULL SYSTEM FLIGHT TEST *This test will not be necessarily conducted by the autopilot. The SV may be controlled by an RC pilot for a portion of the flight time.
Verification & Test Plan
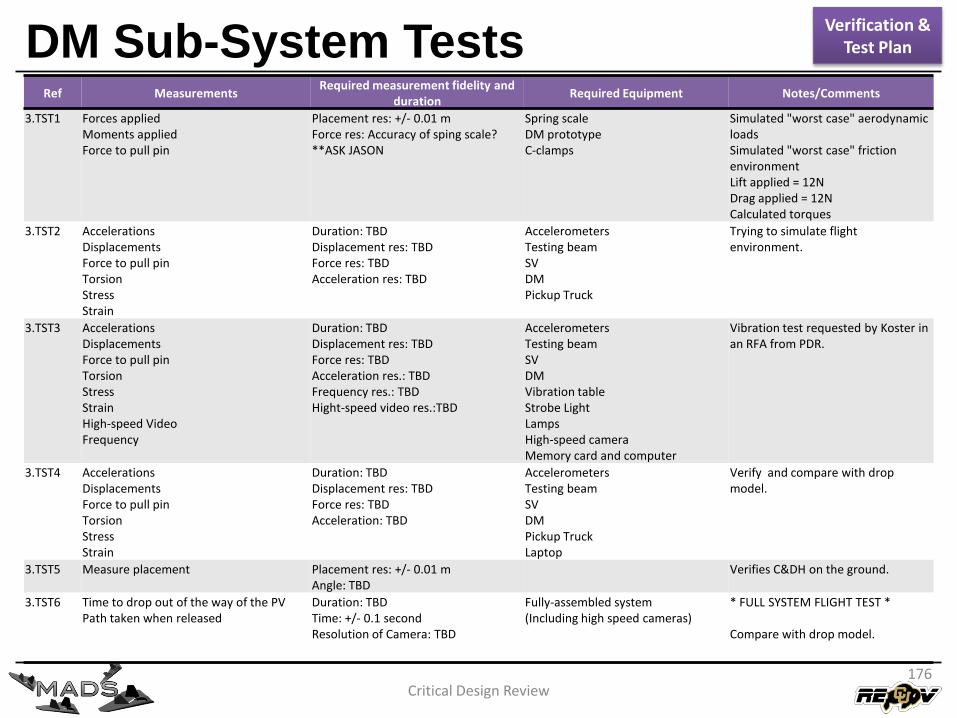
DM Sub-System Tests
Critical Design Review176
Ref MeasurementsRequired measurement fidelity and
durationRequired Equipment Notes/Comments
3.TST1 Forces appliedMoments appliedForce to pull pin
Placement res: +/- 0.01 mForce res: Accuracy of sping scale? **ASK JASON
Spring scaleDM prototypeC-clamps
Simulated "worst case" aerodynamic loadsSimulated "worst case" friction environmentLift applied = 12NDrag applied = 12NCalculated torques
3.TST2 AccelerationsDisplacementsForce to pull pinTorsionStressStrain
Duration: TBDDisplacement res: TBDForce res: TBDAcceleration res: TBD
AccelerometersTesting beamSVDMPickup Truck
Trying to simulate flight environment.
3.TST3 AccelerationsDisplacementsForce to pull pinTorsionStressStrainHigh-speed VideoFrequency
Duration: TBDDisplacement res: TBDForce res: TBDAcceleration res.: TBDFrequency res.: TBDHight-speed video res.:TBD
AccelerometersTesting beamSVDMVibration tableStrobe LightLampsHigh-speed cameraMemory card and computer
Vibration test requested by Koster in an RFA from PDR.
3.TST4 AccelerationsDisplacementsForce to pull pinTorsionStressStrain
Duration: TBDDisplacement res: TBDForce res: TBDAcceleration: TBD
AccelerometersTesting beamSVDMPickup TruckLaptop
Verify and compare with drop model.
3.TST5 Measure placement Placement res: +/- 0.01 mAngle: TBD
Verifies C&DH on the ground.
3.TST6 Time to drop out of the way of the PVPath taken when released
Duration: TBD Time: +/- 0.1 secondResolution of Camera: TBD
Fully-assembled system(Including high speed cameras)
* FULL SYSTEM FLIGHT TEST *
Compare with drop model.
Verification & Test Plan
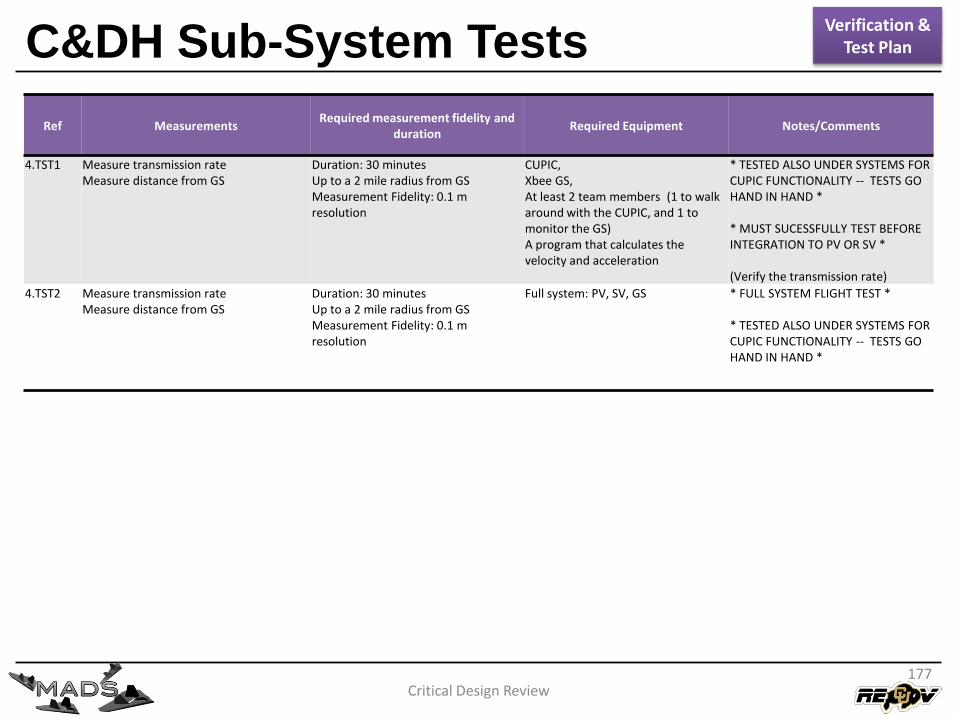
C&DH Sub-System Tests
Critical Design Review177
Ref MeasurementsRequired measurement fidelity and
durationRequired Equipment Notes/Comments
4.TST1 Measure transmission rateMeasure distance from GS
Duration: 30 minutesUp to a 2 mile radius from GSMeasurement Fidelity: 0.1 m resolution
CUPIC,Xbee GS,At least 2 team members (1 to walk around with the CUPIC, and 1 to monitor the GS)A program that calculates the velocity and acceleration
* TESTED ALSO UNDER SYSTEMS FOR CUPIC FUNCTIONALITY -- TESTS GO HAND IN HAND *
* MUST SUCESSFULLY TEST BEFORE INTEGRATION TO PV OR SV *
(Verify the transmission rate)
4.TST2 Measure transmission rateMeasure distance from GS
Duration: 30 minutesUp to a 2 mile radius from GSMeasurement Fidelity: 0.1 m resolution
Full system: PV, SV, GS * FULL SYSTEM FLIGHT TEST *
* TESTED ALSO UNDER SYSTEMS FOR CUPIC FUNCTIONALITY -- TESTS GO HAND IN HAND *
Verification & Test Plan
Critical Design Review178
System Architecture
Design Elements
Manufacturing & System Integration Plan
Verification & Test Plan
Project Management Plan
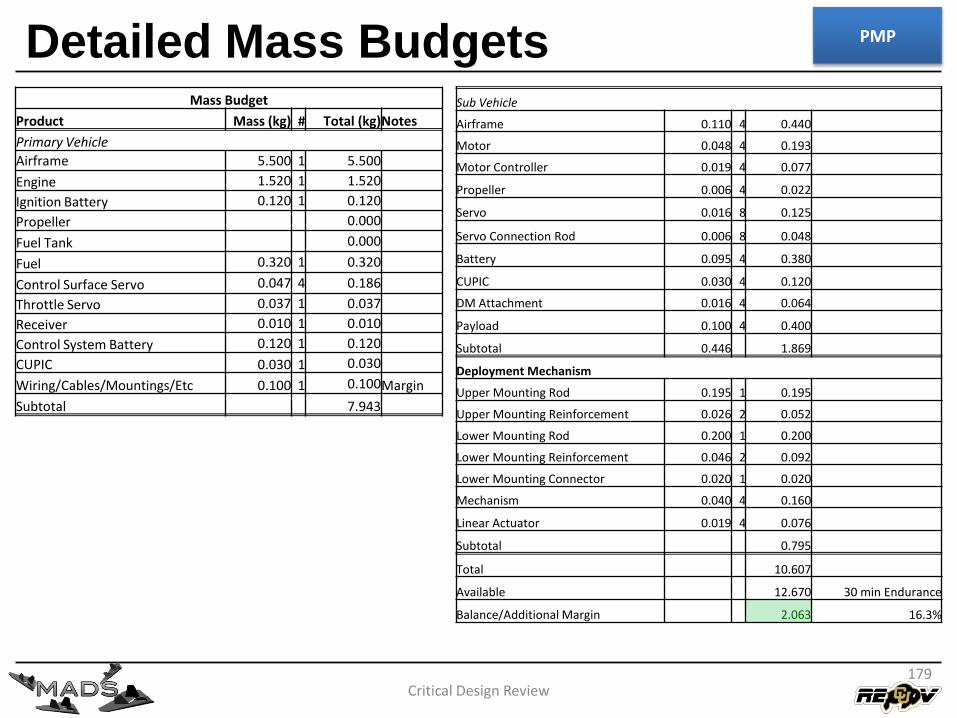
Detailed Mass Budgets
Critical Design Review
Mass Budget
Product Mass (kg) # Total (kg)Notes
Primary Vehicle
Airframe 5.500 1 5.500
Engine 1.520 1 1.520
Ignition Battery 0.120 1 0.120
Propeller 0.000
Fuel Tank 0.000
Fuel 0.320 1 0.320
Control Surface Servo 0.047 4 0.186
Throttle Servo 0.037 1 0.037
Receiver 0.010 1 0.010
Control System Battery 0.120 1 0.120
CUPIC 0.030 1 0.030
Wiring/Cables/Mountings/Etc 0.100 1 0.100Margin
Subtotal 7.943
Sub Vehicle
Airframe 0.110 4 0.440
Motor 0.048 4 0.193
Motor Controller 0.019 4 0.077
Propeller 0.006 4 0.022
Servo 0.016 8 0.125
Servo Connection Rod 0.006 8 0.048
Battery 0.095 4 0.380
CUPIC 0.030 4 0.120
DM Attachment 0.016 4 0.064
Payload 0.100 4 0.400
Subtotal 0.446 1.869
Deployment Mechanism
Upper Mounting Rod 0.195 1 0.195
Upper Mounting Reinforcement 0.026 2 0.052
Lower Mounting Rod 0.200 1 0.200
Lower Mounting Reinforcement 0.046 2 0.092
Lower Mounting Connector 0.020 1 0.020
Mechanism 0.040 4 0.160
Linear Actuator 0.019 4 0.076
Subtotal 0.795
Total 10.607
Available 12.670 30 min Endurance
Balance/Additional Margin 2.063 16.3%
179
PMP
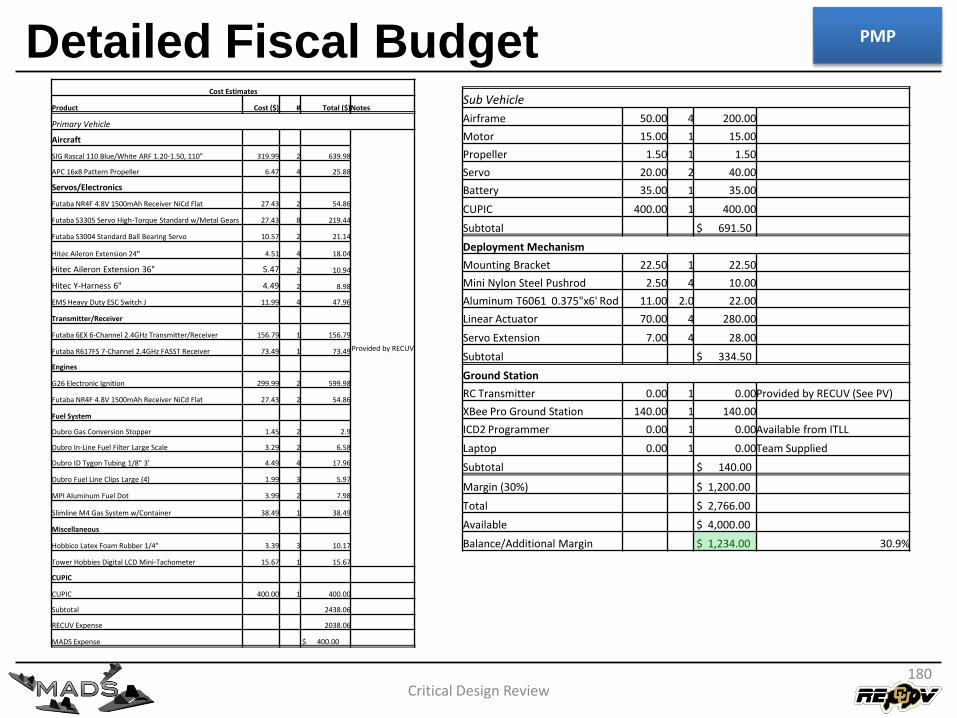
Detailed Fiscal Budget
Critical Design Review
Cost Estimates
Product Cost ($) # Total ($)Notes
Primary Vehicle
Aircraft
Provided by RECUV
SIG Rascal 110 Blue/White ARF 1.20-1.50, 110" 319.99 2 639.98
APC 16x8 Pattern Propeller 6.47 4 25.88
Servos/Electronics
Futaba NR4F 4.8V 1500mAh Receiver NiCd Flat 27.43 2 54.86
Futaba S3305 Servo High-Torque Standard w/Metal Gears 27.43 8 219.44
Futaba S3004 Standard Ball Bearing Servo 10.57 2 21.14
Hitec Aileron Extension 24" 4.51 4 18.04
Hitec Aileron Extension 36" 5.47 2 10.94
Hitec Y-Harness 6" 4.49 2 8.98
EMS Heavy Duty ESC Switch J 11.99 4 47.96
Transmitter/Receiver
Futaba 6EX 6-Channel 2.4GHz Transmitter/Receiver 156.79 1 156.79
Futaba R617FS 7-Channel 2.4GHz FASST Receiver 73.49 1 73.49
Engines
G26 Electronic Ignition 299.99 2 599.98
Futaba NR4F 4.8V 1500mAh Receiver NiCd Flat 27.43 2 54.86
Fuel System
Dubro Gas Conversion Stopper 1.45 2 2.9
Dubro In-Line Fuel Filter Large Scale 3.29 2 6.58
Dubro ID Tygon Tubing 1/8" 3' 4.49 4 17.96
Dubro Fuel Line Clips Large (4) 1.99 3 5.97
MPI Aluminum Fuel Dot 3.99 2 7.98
Slimline M4 Gas System w/Container 38.49 1 38.49
Miscellaneous
Hobbico Latex Foam Rubber 1/4" 3.39 3 10.17
Tower Hobbies Digital LCD Mini-Tachometer 15.67 1 15.67
CUPIC
CUPIC 400.00 1 400.00
Subtotal 2438.06
RECUV Expense 2038.06
MADS Expense $ 400.00
Sub Vehicle
Airframe 50.00 4 200.00
Motor 15.00 1 15.00
Propeller 1.50 1 1.50
Servo 20.00 2 40.00
Battery 35.00 1 35.00
CUPIC 400.00 1 400.00
Subtotal $ 691.50
Deployment Mechanism
Mounting Bracket 22.50 1 22.50
Mini Nylon Steel Pushrod 2.50 4 10.00
Aluminum T6061 0.375"x6' Rod 11.00 2.0 22.00
Linear Actuator 70.00 4 280.00
Servo Extension 7.00 4 28.00
Subtotal $ 334.50
Ground Station
RC Transmitter 0.00 1 0.00Provided by RECUV (See PV)
XBee Pro Ground Station 140.00 1 140.00
ICD2 Programmer 0.00 1 0.00Available from ITLL
Laptop 0.00 1 0.00Team Supplied
Subtotal $ 140.00
Margin (30%) $ 1,200.00
Total $ 2,766.00
Available $ 4,000.00
Balance/Additional Margin $ 1,234.00 30.9%
180
PMP
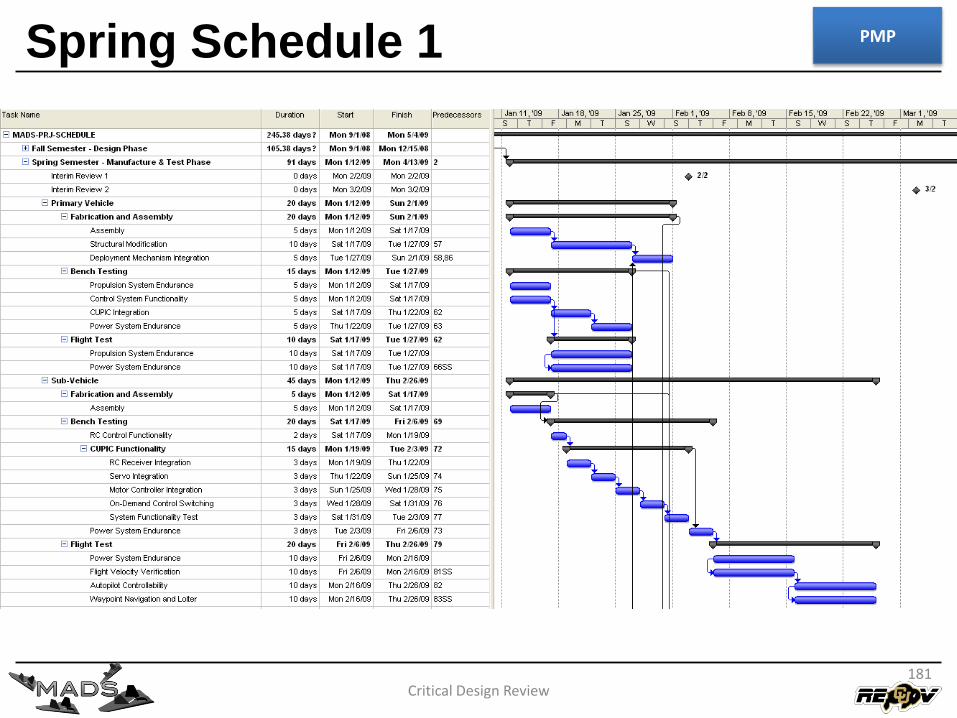
Spring Schedule 1
Critical Design Review181
PMP
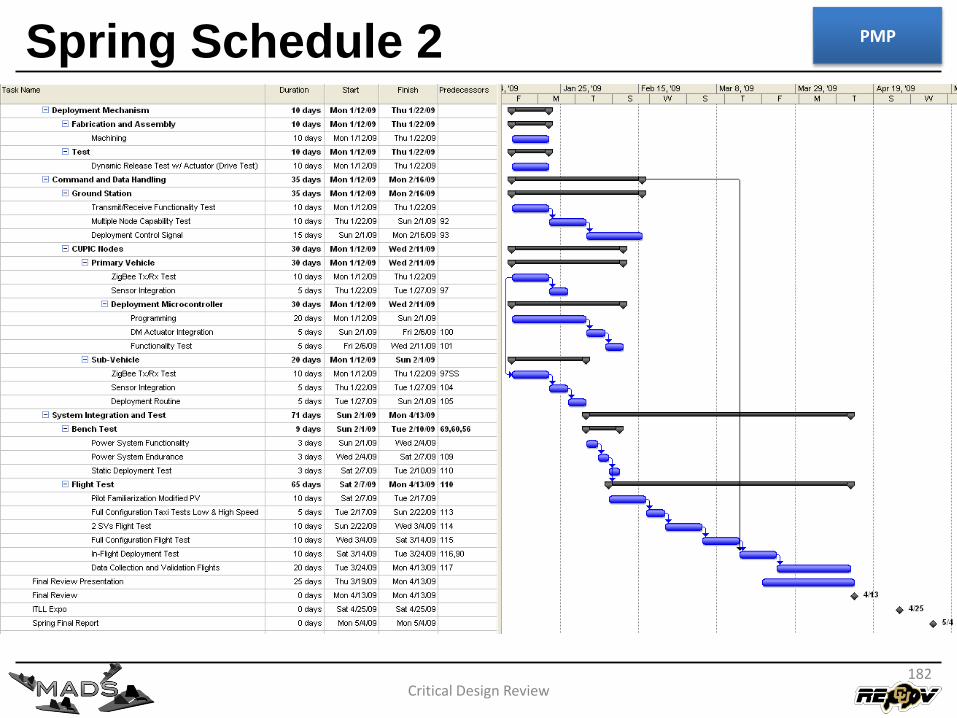
Spring Schedule 2
Critical Design Review182
PMP