Embed Size (px)
Citation preview
DIVISION OF PACKAGING LOGISTICS | DEPARTMENT OF DESIGN SCIENCES FACULTY OF ENGINEERING LTH | LUND UNIVERSITY 2016
MASTER THESIS
Jue Song, Siqi Zhang
Critical factors for shelf life prediction of commercial fruit product

1
This Master’s thesis has been done within the Joint European Master FIPDes, Food Innovation and Product Design.
2
Critical factors for shelf life prediction of commercial fruit
product
Jue Song and Siqi Zhang

3
Critical factors for shelf life prediction of commercial fruit product
Copyright © 2018 Jue Song, Siqi Zhang Published by Division of Packaging Logistics Department of Design Sciences Faculty of Engineering LTH, Lund University P.O. Box 118, SE-221 00 Lund, Sweden Subject: Food Packaging Design (MTTM01) Division: Packaging Logistics Supervisor: Daniel Hellström Co-supervisor: Katarina Flemmer Karlsson Examiner: Henrik Pålsson This Master´s thesis has been done within the Joint European Master Course FIPDes, Food Innovation and Product Design. www.fipdes.eu ISBN 978-91-7753-757-1
4
Abstract
The study was carried out to identify critical factors for processed fruit shelf life in Tetra Recart packages. To investigate the importance of package volume and headspace volume, vitamin C was chosen to be the indicator. Oxygen in headspace, headspace volume, dissolved oxygen in product, oxygen transmission rate (OTR) and the concentration of vitamin C along storage time were measured to understand the mechanism. The results showed that the degradation of vitamin C is faster and more anaerobic degradation happened in large packages. All three sources of oxygen; dissolved oxygen, oxygen in headspace, oxygen permeated through package, which are decided by headspace volume and package volume, have significant influence on the degradation. Vitamin C was also investigated to see if there was any correlation between the degradation of vitamin C and browning of fruit. Storage tests under different temperatures with different package sizes and initial vitamin C concentrations were conducted to identify the best predictor variable for browning reaction. The a value turned out to be a good indicator and the a value -3 might be the threshold of slight browning. The concentration of vitamin C might also be related to the level of browning. The data extraction and analysis by stepwise regression and ordinal logistic regression were implemented to identify variables that may have the main influence on shelf life. The results accentuate that higher vitamin C concentration, lower heat treatment temperature, longer heat treatment time and lower blanching temperature can contribute to longer shelf life.
Keywords: browning, vitamin C, headspace, shelf life, fruit
5
Executive Summary
Introduction
According to the European Commission (2016), food waste in the EU is around 88 million tons per year, with an associated cost estimated to 143 billion euros. Wasting food is not only an economic and ethical issue because of the persistent high number of chronically undernourished people in the world, but also an environmental problem as the manufactures deplete limited natural resources and cause emissions into air, water and soil during production and along the supply chain (Manfredi et al., 2015). Most of the food waste can be avoided by acting on the food shelf life since one of the main reasons for throwing away food is not being used before its expiry date (WRAP, 2008).
According to European legislation (Regulation (EU) No. 1169/2011), shelf life is the period during which a food maintains its acceptable or desirable characteristics under specified storage and handling conditions. These acceptable or desirable characteristics can be related to the safety or quality of the product and can be microbiological, chemical or physical in nature. Few food producers are willing to risk their reputation on a food safety scandal since a product recall gives bad publicity and lowers the value of the brand. The commercial shelf life is often shorter than the technical (real) shelf life, adding to food waste.
Research objectives
The purpose of this thesis is to give an in-depth understanding of some critical factors for shelf life. The following objectives were formulated to meet the purpose of this thesis:
- The effect of headspace volume and package volume on shelf life - The correlation of vitamin C degradation and browning - To identify critical factors that influence shelf life of fruit product
Methodology
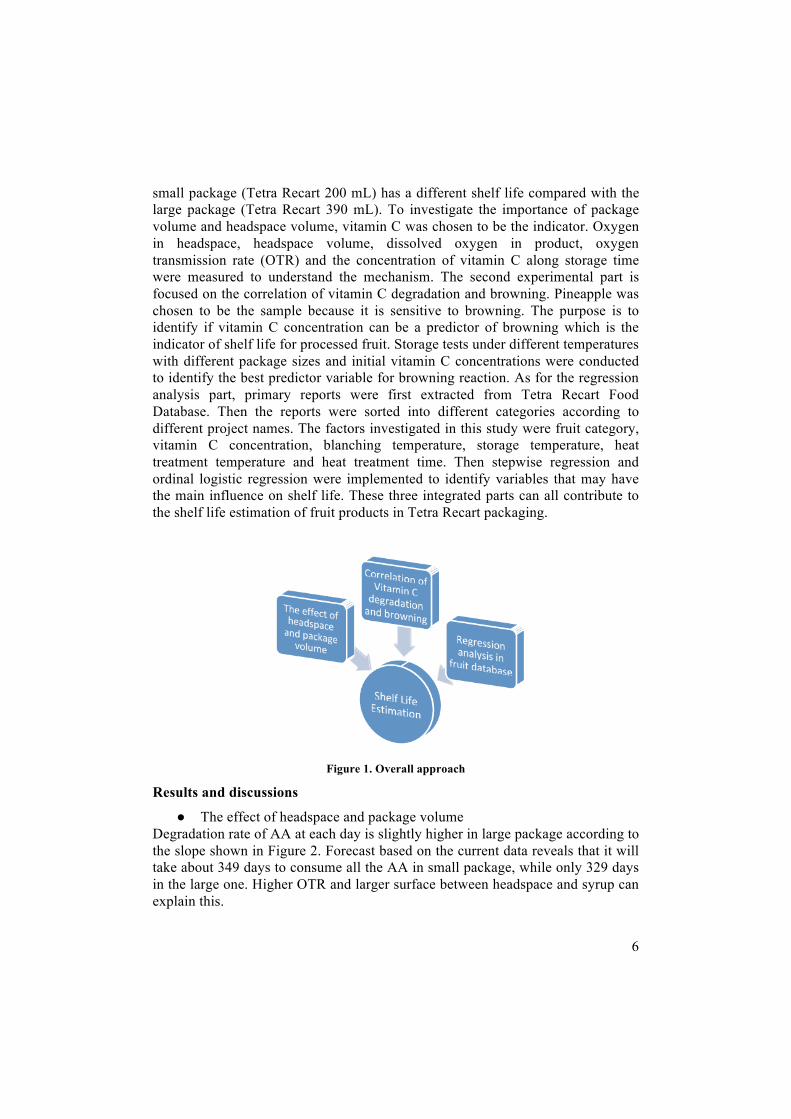
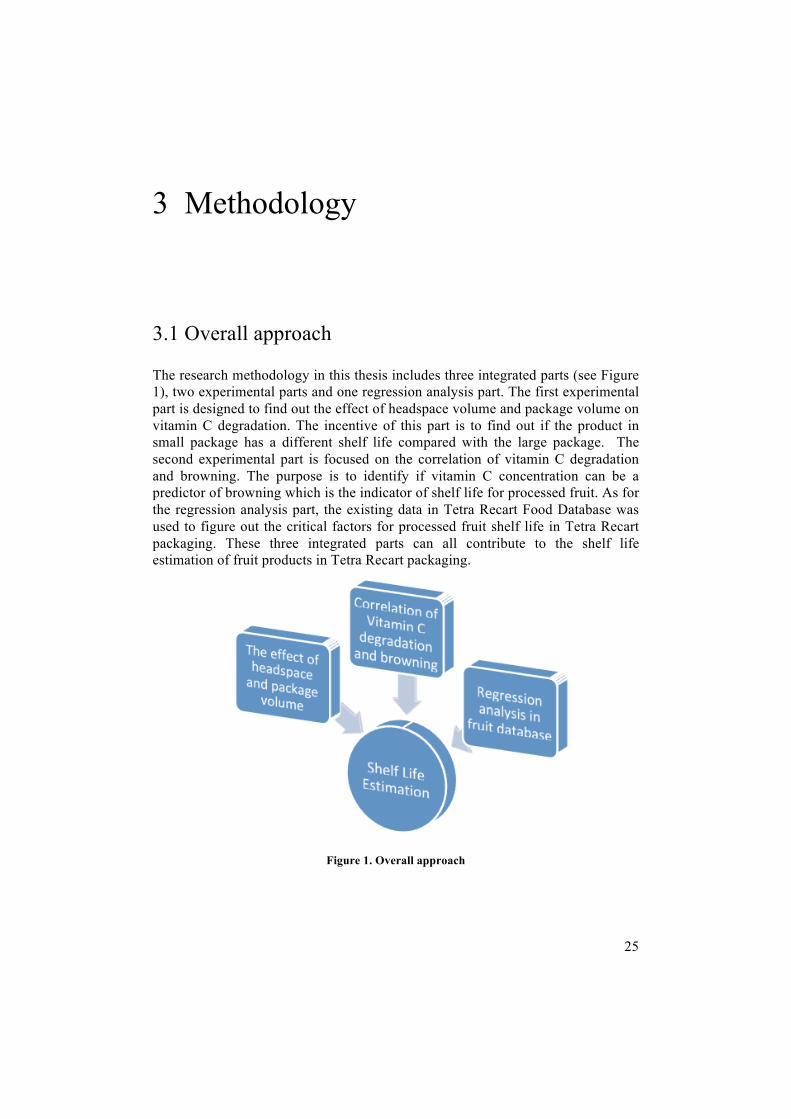
The research methodology in this thesis includes three integrated parts (see Figure 1), two experimental parts and one regression analysis part. The first experimental part is designed to find out the effect of headspace volume and package volume on vitamin C degradation. The incentive of this part is to find out if the product in
6
small package (Tetra Recart 200 mL) has a different shelf life compared with the large package (Tetra Recart 390 mL). To investigate the importance of package volume and headspace volume, vitamin C was chosen to be the indicator. Oxygen in headspace, headspace volume, dissolved oxygen in product, oxygen transmission rate (OTR) and the concentration of vitamin C along storage time were measured to understand the mechanism. The second experimental part is focused on the correlation of vitamin C degradation and browning. Pineapple was chosen to be the sample because it is sensitive to browning. The purpose is to identify if vitamin C concentration can be a predictor of browning which is the indicator of shelf life for processed fruit. Storage tests under different temperatures with different package sizes and initial vitamin C concentrations were conducted to identify the best predictor variable for browning reaction. As for the regression analysis part, primary reports were first extracted from Tetra Recart Food Database. Then the reports were sorted into different categories according to different project names. The factors investigated in this study were fruit category, vitamin C concentration, blanching temperature, storage temperature, heat treatment temperature and heat treatment time. Then stepwise regression and ordinal logistic regression were implemented to identify variables that may have the main influence on shelf life. These three integrated parts can all contribute to the shelf life estimation of fruit products in Tetra Recart packaging.
Figure 1. Overall approach
Results and discussions
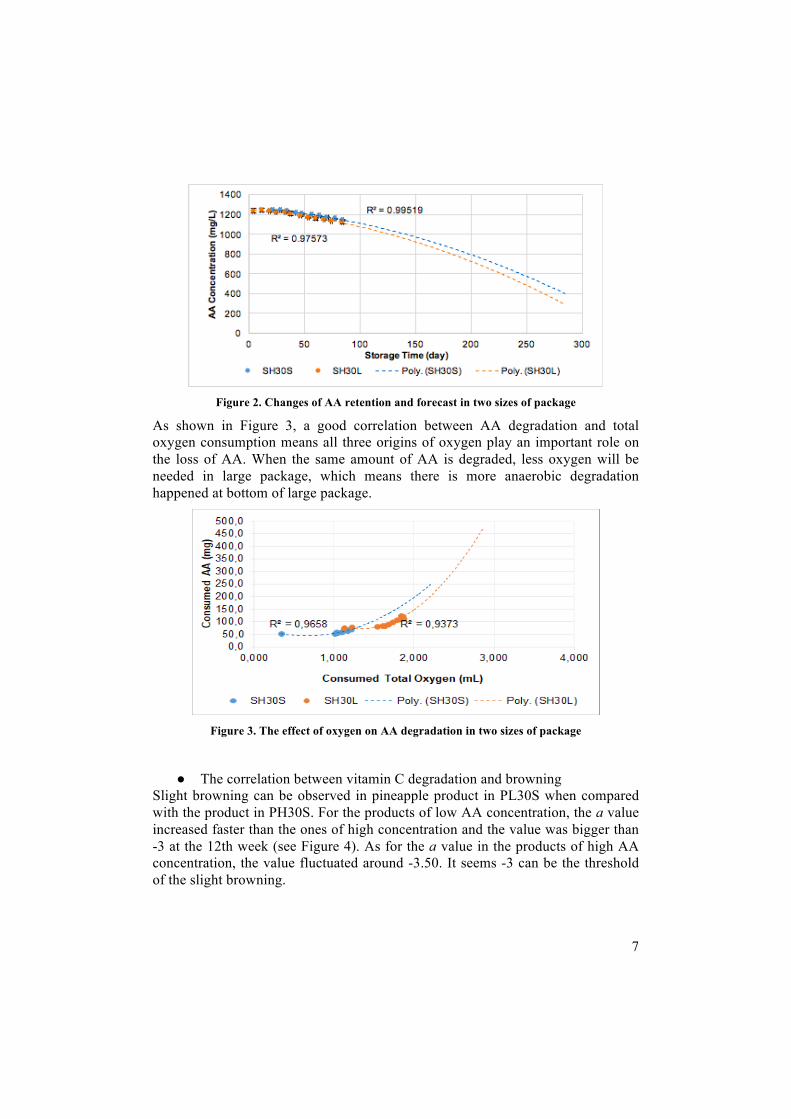
● The effect of headspace and package volume Degradation rate of AA at each day is slightly higher in large package according to the slope shown in Figure 2. Forecast based on the current data reveals that it will take about 349 days to consume all the AA in small package, while only 329 days in the large one. Higher OTR and larger surface between headspace and syrup can explain this.
7
Figure 2. Changes of AA retention and forecast in two sizes of package
As shown in Figure 3, a good correlation between AA degradation and total oxygen consumption means all three origins of oxygen play an important role on the loss of AA. When the same amount of AA is degraded, less oxygen will be needed in large package, which means there is more anaerobic degradation happened at bottom of large package.
Figure 3. The effect of oxygen on AA degradation in two sizes of package
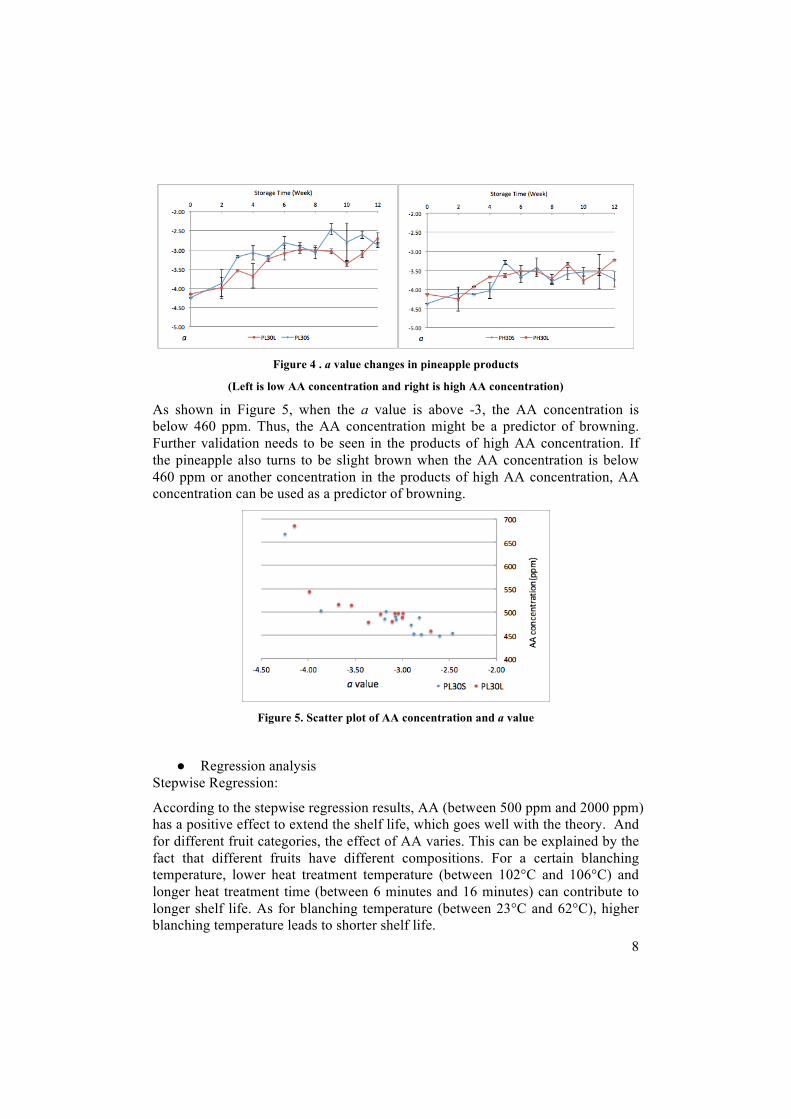
● The correlation between vitamin C degradation and browning Slight browning can be observed in pineapple product in PL30S when compared with the product in PH30S. For the products of low AA concentration, the a value increased faster than the ones of high concentration and the value was bigger than -3 at the 12th week (see Figure 4). As for the a value in the products of high AA concentration, the value fluctuated around -3.50. It seems -3 can be the threshold of the slight browning.
8
Figure 4 . a value changes in pineapple products
(Left is low AA concentration and right is high AA concentration)
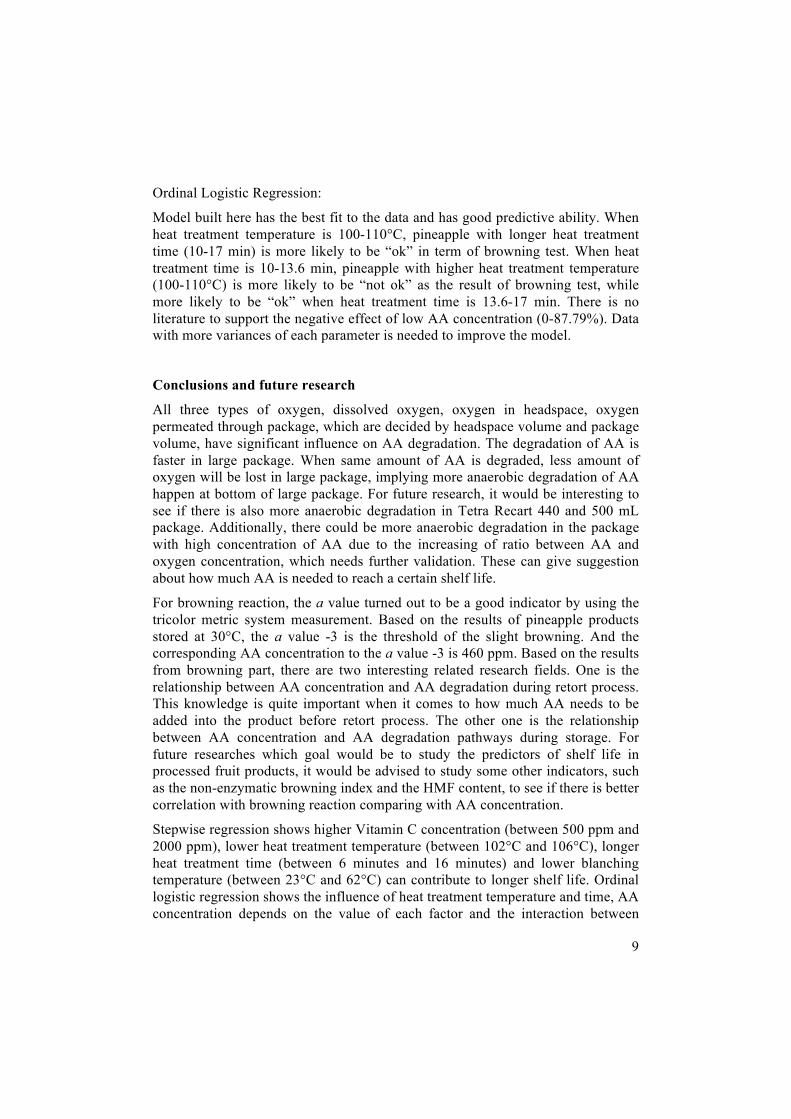
As shown in Figure 5, when the a value is above -3, the AA concentration is below 460 ppm. Thus, the AA concentration might be a predictor of browning. Further validation needs to be seen in the products of high AA concentration. If the pineapple also turns to be slight brown when the AA concentration is below 460 ppm or another concentration in the products of high AA concentration, AA concentration can be used as a predictor of browning.
Figure 5. Scatter plot of AA concentration and a value
● Regression analysis Stepwise Regression:
According to the stepwise regression results, AA (between 500 ppm and 2000 ppm) has a positive effect to extend the shelf life, which goes well with the theory. And for different fruit categories, the effect of AA varies. This can be explained by the fact that different fruits have different compositions. For a certain blanching temperature, lower heat treatment temperature (between 102°C and 106°C) and longer heat treatment time (between 6 minutes and 16 minutes) can contribute to longer shelf life. As for blanching temperature (between 23°C and 62°C), higher blanching temperature leads to shorter shelf life.
9
Ordinal Logistic Regression:
Model built here has the best fit to the data and has good predictive ability. When heat treatment temperature is 100-110°C, pineapple with longer heat treatment time (10-17 min) is more likely to be “ok” in term of browning test. When heat treatment time is 10-13.6 min, pineapple with higher heat treatment temperature (100-110°C) is more likely to be “not ok” as the result of browning test, while more likely to be “ok” when heat treatment time is 13.6-17 min. There is no literature to support the negative effect of low AA concentration (0-87.79%). Data with more variances of each parameter is needed to improve the model.
Conclusions and future research
All three types of oxygen, dissolved oxygen, oxygen in headspace, oxygen permeated through package, which are decided by headspace volume and package volume, have significant influence on AA degradation. The degradation of AA is faster in large package. When same amount of AA is degraded, less amount of oxygen will be lost in large package, implying more anaerobic degradation of AA happen at bottom of large package. For future research, it would be interesting to see if there is also more anaerobic degradation in Tetra Recart 440 and 500 mL package. Additionally, there could be more anaerobic degradation in the package with high concentration of AA due to the increasing of ratio between AA and oxygen concentration, which needs further validation. These can give suggestion about how much AA is needed to reach a certain shelf life.
For browning reaction, the a value turned out to be a good indicator by using the tricolor metric system measurement. Based on the results of pineapple products stored at 30°C, the a value -3 is the threshold of the slight browning. And the corresponding AA concentration to the a value -3 is 460 ppm. Based on the results from browning part, there are two interesting related research fields. One is the relationship between AA concentration and AA degradation during retort process. This knowledge is quite important when it comes to how much AA needs to be added into the product before retort process. The other one is the relationship between AA concentration and AA degradation pathways during storage. For future researches which goal would be to study the predictors of shelf life in processed fruit products, it would be advised to study some other indicators, such as the non-enzymatic browning index and the HMF content, to see if there is better correlation with browning reaction comparing with AA concentration.
Stepwise regression shows higher Vitamin C concentration (between 500 ppm and 2000 ppm), lower heat treatment temperature (between 102°C and 106°C), longer heat treatment time (between 6 minutes and 16 minutes) and lower blanching temperature (between 23°C and 62°C) can contribute to longer shelf life. Ordinal logistic regression shows the influence of heat treatment temperature and time, AA concentration depends on the value of each factor and the interaction between

10
factors. More variances of AA concentration, heat treatment time and temperature, diversity of fruit, quantitative browning result are expected in the database. Thus, the regression model to predict shelf life can be improved and more accurate leading factors might be found.
11
Acknowledgments
First of all, we would like to express our gratitude to all the members of the FIPDes consortium for considering our qualification and giving us opportunity to join FIPDes, where we expanded our horizon, developed academic skills and met all the lovely FIPDesers.
We would like to thank our supervisor, Daniel Hellström, for his patience, humor, academic support and precious advice on our thesis. We will never forget that snowy day running out from IKDC with you due to the fire alarm, chilling and laughing together in the wind.
A special thank you to Katarina Flemmer Karlsson, our supervisor at Tetra Pak, who always take care of us in the way a mother would do, who always stands by us when we had problems and have catching-up meeting with us every week, who helps us reach a lot of excellent employees and carry our thesis in a good way.
Also, we want to thank to Helena Wijkander, JennyM Jonsson, Jannika Timander for attending each discussion meeting and give us very constructive feedback; Josefine Wegelid, Hanna Eliasson, BjornJ Loodberg for assisting us with the pre-test and the production of all the samples; Anders Johansson, Adnan Gültekin, Emilia Henrysson, Sofia Klasen, Dan Haldeborg, RoseMarie Janusz for patient instruction about security and test equipment; Linda Carlstedt, Kristina Helstad, Camilla Petersson, Ola Funkquist for providing their knowledge and experience and help us design all the experiments to achieve the objectives; Sten Sjostrom for assist on Minitab; Martin Gunnarsson for measuring OTR. We really appreciate this thesis opportunity and all the support received from Tetra Pak.
Thanks to our examinar Henrik Pålsson and opponents Rafal Ferrándiz Martínez and Zhuxuezi Zhao for feedback. Finally, we would like to express our gratitude and love to our family members, who always support and respect each decision we made and care about much more about our health condition.
Lund, June 2018
Jue Song, Siqi Zhang

12
Table of contents
List of abbreviations 14
1 Introduction 15
1.1 Background 15
1.2 Research problem and questions 16
1.3 Research purpose and objectives 17
1.4 Focus and delimitations 18
2 Frame of Reference 19
2.1 Chemical deterioration determining shelf life 19
2.1.1 Chemical deterioration 19
2.1.2 Predicting chemical deterioration 20
2.1.3 Preventing chemical deterioration 20
2.2 Vitamin C degradation 21
2.2.1 Degradation mechanism 21
2.2.2 Factors that affecting degradation 22
2.3 Browning and vitamin C degradation 22
2.3.1 Enzymatic browning 23
2.3.2 Non-enzymatic browning 24
3 Methodology 25
3.1 Overall approach 25
3.2 The effect of headspace and package volume 26
3.2.1 Experimental design 26
3.2.2 Materials and equipment 27
3.2.3 Test methods 28
3.3 The correlation of vitamin C degradation and browning 32
13
3.3.1 Experimental design 32
3.3.2 Materials and equipment 33
3.3.3 Test methods 35
3.4 Regression analysis 36
4 Results and Discussion 37
4.1 The effect of headspace and package volume 37
4.2 The correlation of vitamin C degradation and browning 42
4.3 Regression analysis 47
4.3.1 Stepwise regression analysis in each project 47
4.3.2 Ordinal logistic regression analysis 48
5 Conclusions and Future research 51
5.1 Conclusions 51
5.2 Future research 52
References 53
14
List of abbreviations
AA ascorbic acid
D-O2 Dissolved Oxygen
HS Headspace
HMF Hydroxymethylfurfural
OTR Oxygen Transmission Rate
TP Tetra Pak®
TRC 200 Tetra Recart 200 mL mini
TRC 390 Tetra Recart 390 mL midi
15
1 Introduction
1.1 Background
Food provides human bodies with energy, protein, essential fats, vitamins and minerals to live, grow and function properly. A wide variety of different foods are needed to provide the right amounts of nutrients for good health. Poor diet may lead to a lack of essential substances. Too little protein can lead to kwashiorkor. A lack of vitamin C can result in scurvy. According to the World Health Organization, stunted development due to poor diet affects 159 million children under age of 5 years globally and 50 million dies (WHO, 2016). In 2016, 815 million people are estimated to be undernourished in the world, which represents nearly 11% of the total population. While the number of undernourished people was estimated to be 777 million in 2015 (FAO, 2017). This recent increase is cause for great concern and poses a significant challenge for the sustainable development goal, “By 2030, end hunger and ensure access by all people, in particular the poor and people in vulnerable situations, including infants, to safe, nutritious and sufficient food all year round”.
According to the European Commission (2016), food waste in the EU is around 88 million tons per year, with an associated cost estimated to 143 billion euros. Wasting food is not only an economic and ethical issue because of the persistent high number of chronically undernourished people in the world, but also an environmental problem as the manufactures deplete limited natural resources and cause emissions into air, water and soil during production and along the supply chain (Manfredi et al., 2015). Most of the food waste can be avoided by acting on the food shelf life since one of the main reasons for throwing away food is not being used before its expiry date (WRAP, 2008).
According to European legislation (Regulation (EU) No. 1169/2011), shelf life is the period during which a food maintains its acceptable or desirable characteristics under specified storage and handling conditions. These acceptable or desirable characteristics can be related to the safety or quality of the product and can be microbiological, chemical or physical in nature. In the case of foods, which from a microbiological point of view, are highly perishable and are therefore likely after a short period to constitute an immediate danger to human health, such as meat, milk etc. The ‘use by’ date is used to indicate the shelf life. After the ‘use by’ date, food is deemed unsafe and cannot enter the food supply. The ‘best before’ date is until
16
which food product retains specific properties in terms of taste, appearance, nutrition content, aroma etc. once the food has been stored appropriately in accordance with storage conditions. Typically, a ‘best before’ date is applied to dry, canned, ambient, frozen foods etc. Food may be safe to eat even when it is past the ‘best before’ date, but with the deterioration of quality. Few food producers are willing to risk their reputation on a food safety scandal since a product recall gives bad publicity and lowers the value of the brand. The commercial shelf life is often shorter than the technical (real) shelf life, adding to food waste.
1.2 Research problem and questions
Food shelf life is of great interest because it can reflect food nutritional, functional, sensory and safety profile (Sakač et al., 2016). The shelf life of a product is not always related to its real life that ends with the loss of the hygienic and/or nutritional properties, but generally corresponds to the end of its marketability when its physical and sensory features are not acceptable (Alamprese et al., 2017).
Many factors can influence shelf life and can be categorized into intrinsic and extrinsic factors. Intrinsic factors are the properties of the final product, including water activity, pH, available oxygen, nutrients, use of the preservatives etc. Extrinsic factors include time-temperature during processing, temperature control during storage and distribution, relative humidity in the environment etc (IFST, 1993). There are various combinations of those factors which can be modified by manufacturers, consequently affecting shelf life. For example, manufacturers can influence product formulation, processing and preservation techniques, packaging to extend the shelf life. Among them two of the most dynamic areas of research are in new processing methods and packaging techniques.
Food processing is used to transform ingredients into products and change the properties, distribution and structure of ingredients. No processing operation acts alone to determine food shelf life, but they interact with the chemical, physical, biochemical and microbiological factors in foods to give food an initial quality followed by a sequence of quality changes during its shelf life (Brown, 2011). When designing a food process, target physical and chemical properties need to be clear and then controlled during processing.
In food industry, the shelf life of products can be extended by the use of special processing treatment, such as heat, radiation which kill the microorganisms, or by controlling the microbial growth through temperature control (chilling and freezing) and reducing the water activity (drying and pickling) and by the addition of preservatives, for example Vitamin C (Subramaniam et al., 2016). Generally, the use of harsh treatments can give long shelf life, but at the same time, compromise the overall sensory quality of food product. Therefore, as the
17
principle of the hurdle technique, a combination of different processing methods in the level of mild treatment can be useful in retaining the sensory quality, while achieving the requirement of microbial stability.
Packaging plays a critical role in the food supply chain. The protection packaging provides for food products include the prevention of biological contamination (from microorganisms, insects, rodents), chemical degradation (oxidation, loss of aroma, etc) and physical damage (abrasion, crushing) (Heldman et al., 2006). It was reported that packaged foods result in 2.5% total waste as compared to 50% for fresh foods (Rathje et al., 1985). Considering the poor transportation without cold-chain logistics and lack of refrigeration in some countries, it is necessary to use ambient packaging to avoid food spoilage
Over the last few decades, the active packaging concept has been established and developed to improve the food quality and extend food shelf life (Tawakkal et al., 2014). Active packaging systems can be divided into two categories, active scavenging systems and active releasing systems. The active scavenging systems can remove undesired compounds from the food product, such as moisture, oxygen, ethylene and odor. The active releasing systems can add compounds to the packaged food, such as antimicrobial compounds, carbon dioxide, antioxidants and ethanol (Yildirim et al., 2018).
Defining the exact shelf life of food product is still a real challenge for food manufacturers because of a wide range of variables to be considered, such as formulation, processing conditions, packaging characteristics and storage conditions (Nicoli, 2012). Among all the factors, which ones are more crucial in terms of shelf life determination? As the degradation reactions determining shelf life are really complex, is there any indicator to predict food quality change? Lots of studies mainly focused on the quality loss of juice product, especially citrus juice, the research on fruit product is lacking. Despite the large volume of work on quality loss in food prepared in a laboratory scale, few researchers have investigated the food quality loss in a commercial scale.
1.3 Research purpose and objectives
The purpose of this thesis is to give an in-depth understanding of some critical factors for shelf life. The following objectives were formulated to meet the purpose of this thesis:
- The effect of headspace volume and package volume on shelf life - The correlation of vitamin C degradation and browning - To identify critical factors that influence shelf life of fruit product

18
1.4 Focus and delimitations
This study is carried out in the package of Tetra Recart. Tetra Recart package size varies from mini: 200 mL to midi: 340 mL, 390 mL, 440 mL and 500 mL. Tetra Recart 200 mL mini (TRC 200) and Tetra Recart 390 mL midi (TRC 390) were chosen to be studied in this research. The test was performed under experimental conditions (pilot scale) and the product (pineapple and syrup) was filled into packages manually. The achieved shelf life of the product and headspace in the package are not representative of what can be achieved using a commercial Tetra Recart line installation for filling of the fruit product.
To understand the influence of headspace volume and package volume, vitamin C was chosen to be the indicator of shelf life due to its antioxidant capacity, meaning the more retention of vitamin C, the more guarantee of longer shelf life. Oxygen in headspace and dissolved oxygen in product along storage time were measured to understand the mechanism.
The shelf life of processed fruit in this study is determined by the browning level of the fruit. Turning to brown means the end of shelf life from the sensory aspect. Pineapple was chosen to be studied in terms of browning because pineapple is very sensitive among all processed fruit. vitamin C concentration was chosen to be studied as the predictor of browning.
The data analyzed was extracted from Tetra Recart Food Database (internal test results database). The factors investigated in this study that may influence shelf life were fruit category, vitamin C concentration, blanching temperature, storage temperature, heat treatment temperature and heat treatment time.
19
2 Frame of Reference
2.1 Chemical deterioration determining shelf life
Shelf life is the length of time that a commodity may be stored without becoming unfit for use or consumption. Within shelf life, a packaged food should last without deteriorating. Most deterioration of food is related to chemical, microbiological and physical changes. This thesis is focused on chemical reactions that cause food quality loss during storage. Different approaches can be implemented to extend food shelf life, including modification of formulation, processing, packaging and storage conditions.
2.1.1 Chemical deterioration
Food spoilage can occur due to the chemical reactions of the food components, including proteins, lipids and carbohydrates. These reactions can change the food appearance and cause loss of nutrients such as vitamins.
Protein degradation can involve reactions with proteins acting as ingredients and enzymes. Enzymes are functional proteins that can act as catalysts in reactions and greatly increase the reaction rates. Enzymatic activities in fruit can cause browning and softening of tissues (Singh and Anderson, 2004).
Lipid spoilage can occur due to oxidation reactions and hydrolytic reactions. Lipid oxidation is the most important degradation pathway in food products. During lipid oxidation, oxygen can attack unsaturated fats, ending up with color changes, off-flavor or toxic substances. Hydrolytic reactions involve cleaving of free fatty acids which have lower flavor threshold and sometimes odors from triglyceride molecules (Singh and Anderson, 2004).
Chemical degradation of carbohydrates can include gelatinization, caramelization and hydrolytic reactions. Gelatinization is a process of breaking down the intermolecular bonds of starch molecules, including granule swelling, crystal helical melting and amylose leaching. Caramelization requires relatively higher temperature than typical storage temperatures for food products. Hydrolytic reactions can occur with pectin in fruits and cause a softening of structure.

20
2.1.2 Predicting chemical deterioration
Chemical changes can lead to deterioration in food appearance and texture which can affect food shelf life. Thus, it is crucial to find ways to predict chemical deterioration in order to estimate shelf life. Mathematical modeling is commonly used to describe chemical reactions as a function of time or other intrinsic and extrinsic factors.
Kinetic modeling is the most commonly used modeling method, which has been applied in chemical reactions in food during processing and storage. To determine the kinetic modeling, experiments are needed to collect relevant data under specific conditions. Kinetic parameters and mathematical relationships can be determined by analyzing experimental data. Validation is needed to see how well the model simulate the reality. It is important to note that a certain model only works in the specific condition as the experimental data is collected.
Chemical kinetics involves the study of the rates and mechanisms by which a chemical species converts to another. It is characterized by the rate constant and the order of the reaction. The rate of a chemical is defined as the change of concentration of a reactant. In zero-order reactions, the rate of loss of the reactant is constant. An example of zero-order reaction is formation of brown color in foods because of the Maillard reaction. First-order reactions are frequently reported, such as lipid oxidation and vitamin losses in dried foods (Subramaniam and Wareing, 2016). Second-order reactions are relatively less common.
2.1.3 Preventing chemical deterioration
As chemical reactions can change the food quality, it is crucial to find methods to prevent chemical deterioration. These reactions are strongly influenced by environmental factors such as oxygen content, temperature, water activity and food composition. Thus, chemical reactions can be retarded by controlling these factors through the food chain, including formulation, processing, packaging and storage.
The design of formulation is fundamental to the quality and shelf life of the product. Food additives are substances added to food to preserve the flavor and quality. Combination of food additives can be used to improve food stability during manufacturing. Antioxidants such as vitamin C can be used to control oxidation reactions and minimize rancidity by inhibiting the degradation by oxygen. Water activity in foods can be controlled by using various additives, such as salts and sugars, to increase the food stability.
Processing methods can also affect the food quality and shelf life. Traditional processing approaches include thermal treatments, drying, refrigeration and separation. There are many new processing technologies, such as pulsed electric
21
fields, microwave and radio-frequency processing, and ohmic heating (Kong and Singh, 2009). These technologies can affect food quality and shelf life at various degrees. For example, heat treatments such as blanching can effectively inhibit enzymatic activity and preserve the color and texture of fruits (Subramaniam and Wareing, 2016).
Packaging can influence food shelf life from various aspects. The deterioration of packaged foods depends largely on transfers that can occur between the external environment and the internal environment of the package (Robertson, 2011). The external storage and distribution environment may contain different hazards. Packaging materials can determine the transmission rate of light and oxygen which are important factors for chemical reactions.
2.2 Vitamin C degradation
Vitamin C, also known as ascorbic acid (AA), is a vitamin found naturally in fruits and vegetables and commonly used as a dietary supplement. Being highly polar, AA is easily soluble in aqueous solution. AA is a carbohydrate-like compound with acidic and reducing properties (Damodaran and Parkin, 2017). Thus, AA is readily prone to both chemical and enzymatic oxidation. The oxidation of AA has been found to cause darkening of various foods including fruit juices and concentrates (Robertson and Samaniego, 1986; Ziena, 2000).
2.2.1 Degradation mechanism
In the presence of oxygen, AA is readily oxidized via a reversible reaction to dehydroascorbic acid (DHA) which has a similar biological activity as AA (Campos et al., 2009) and an antioxidant activity five times lower than AA (Nkhili and Brat, 2011). DHA is prone to further degradation, ending up in losing its biological activity (Righetto and Netto, 2006).
Degradation kinetic modeling is a useful way to predict the chemical change of AA during storage. The degradation of AA to DHA was successfully described by a zero order kinetic model for the oxygen concentrations lower than 0.63% and by a first order kinetic model for all oxygen concentrations in headspace (Van Bree et al., 2012). AA degradation and color intensity loss during storage were best explained by first-order kinetic model through nonlinear regression methods (Remini et al., 2015).
AA can also be degraded in the absence of oxygen. The anaerobic pathway becomes significant after depletion of residual oxygen. The mechanism of anaerobic degradation of AA has not been fully established. In most cases, rate
22
constants for anaerobic degradation of ascorbic acid will be two to three orders of magnitude less than those for the oxidative reaction (Jesse F, 1997).
2.2.2 Factors that affect degradation
AA is highly susceptible to oxidation, which can be catalyzed by metal ions such as Cu2+ and Fe3+. Trace amount of metals can serve as catalysis for this oxidative process. Uncatalyzed oxidation is essentially negligible and trace metals in food are responsible for much of the oxidative degradation (Damodaran and Parkin, 2017).
The rate of the ferric and cupric ion catalyzed oxidation of AA was found to be proportional to the partial pressure of dissolved oxygen over the range of 0.4-1.0 atm (Khan and Martell, 1967). AA is prone to have longer stability in fruit juices stored in glass bottles compared to those stored in polymer packaging materials and paper board containers due to the oxygen permeability of these packages (Ayhan et al., 2001). To minimize the loss of AA and keep the associated non-enzymatic browning as low as possible, the amount of headspace and dissolved oxygen should be kept minimal (Dhuique-Mayer et al., 2007).
In general, the longer the time and the higher the storage temperature, the greater the degradation of AA. The impact of storage temperature and degassing are the most influential factors in the degradation of AA and color intensity, while AA fortification have no significant effect on the degradation kinetic during storage (Remini et al., 2015).
The rate of oxidation of AA is nonlinear function of pH since different forms of AA differ in susceptibility of oxidation (Buettner, 1988). Anaerobic degradation exhibits a maximum rate at pH~3–4 (Jesse F, 1997).
2.3 Browning and vitamin C degradation
Browning reaction is common during the processing and storage of food, it occurs during the manufacture of fruit, vegetable, fish products, as well as when fresh fruits and vegetables are exposed to mechanical injury. Browning is one of the main reasons for the reduction in commercial value of food products, it affects the flavor, appearance and nutrition (Eskin et al., 2012).
Browning in food products includes enzymatic browning and non-enzymatic browning. Enzymatic browning is a phenomenon which occurs in many fresh fruits and vegetables, while the non-enzymatic browning is a phenomenon associated with heated and stored products, not only fruits and vegetables, but also meat, fish, etc. Non-enzymatic browning under careful control is preferable when
23
concerning its contribution to the flavor, color and aroma of coffee, caramel, bread and breakfast cereals (Eskin et al., 2012). Ascorbic acid is an effective inhibitor of browning which works by decreasing pH and acting as an antioxidant (Guerrero-Beltra ́n et al., 2005). AA is used especially in the food products which naturally contain AA. It does not have a detectable flavor at the level used to inhibit the enzyme in enzymatic browning, nor does it have a corrosive action on metals (Eskin et al., 2012). However, AA is an unstable compound and decomposes easily under less desirable conditions (Lee and Coates, 1999). AA degradation is associated with brown pigments as product in both the presence and absence of amines (Marcel et al., 1997). It was reported that several reactive compounds generated via the degradation of AA may combine with amino acids, therefore result in formation of brown pigments (Burdurlu et al., 2006).
2.3.1 Enzymatic browning
When vegetables or fruits are cut, peeled, or exposed to abnormal condition, the tissue rapidly becomes dark on exposure to air, which resulted from the conversion of phenolic compounds to brown pigments. Polyphenol oxidases (PPOs) are a group of copper-proteins that catalyze the oxidation of phenolics to quinones with the presence of oxygen (Eskin et al., 2012). PPO catalyzes two different reactions: the hydroxylation of monophenols and the oxidation of o-diphenols to o-quinones (Queiroz et al., 2008). This reaction is followed by non-enzymatic polymerization of quinone, with the formation of melanins, pigments of high molecular mass, and dark color (Espín et al., 1998).
The inactivation of PPO is required to minimize product losses caused by browning. Heat treatment and addition of anti-browning agents are usually applied. In general, exposure of PPO to temperatures of 70-90°C destroys catalytic activity, while the time required depends on the product (Chutintrasri and Noomhorm, 2006). As for antioxidant agents, AA is a particularly effective inhibitor of PPO. It reduces the quinone produced before it undergoes secondary reactions that lead to browning, and decreases the pH for inhibiting PPO activity (Guerrero-Beltra ́n et al., 2005) and slow down the secondary reactions which are also pH dependent (Muneta et al., 1977). The optimum pH of most PPO lies between pH 4.0 and 7.0, with lower activity below pH 3.0 (Eskin et al., 2012). In fruit juice treated with AA, autooxidation of AA, or natural AA oxidase activity use up all the dissolved oxygen, making oxygen the limiting factor to the rate of enzymatic browning (Eskin et al., 2012). Therefore, an adequate amount of AA must be added to food product to delay enzymatic browning. Citric acid is another commonly used chemical inhibitor of enzymatic browning, which has been used usually in conjunction with AA (Hiranvarachat et al., 2011). Other method such as exclusion of oxygen, high hydrostatic pressure treatment, gamma irradiation, pulsed electric field are also conducted to control enzymatic browning (Queiroz et al., 2008).
24
2.3.2 Non-enzymatic browning
The mechanism of AA degradation has been introduced previously. Regardless of the mechanism, many reactions involved in the terminal phases of ascorbate degradation are important due to their involvement in non-enzymatic browning. 3,4-dihydroxy-5-methyl-2(5H)-furanone, an intermediate product of dehydration following decarboxylation during anaerobic degradation of AA, has a brownish color. Further polymerization of these or other unsaturated products forms either melanoidins (nitrogenous polymers) or non-nitrogenous caramel-like pigments (Kacem et al., 1987; Marcel et al.,1997). Kacem et al. (1987) has concluded that the effect of AA on browning of orange drinks was strictly linear within the concentration range used and was more obvious in the presence of high levels of AA. AA degradation is associated with discoloration reactions in both the presence and absence of amino acids (Handwerk, 1988). DHAA formed during the degradation of AA can participate in Strecker degradation with amino acids. Following this, the sorbamic acid product can form dimers, trimers, and tetramers, several of which are reddish or yellowish in color (Marcel et al., 1997). Kacem et al. (1987) has researched the influence by AA concentration and amino acid concentration respectively on browning. It was reported that high amino acid levels may accelerate AA degradation, resulting in an increase in browning while little browning occurred at low AA concentration even at high amino acid levels, which demonstrate the important role of AA content in browning formation.
The degradation of sugars and AA is strikingly similar, and in some cases mechanistically identical (Marcel et al., 1997). Both or their degradation products can combine with amino acid and generate brown pigments through this reaction. However, browning by AA degradation is different from Maillard reaction, not only because of the amino acid concentration required, but also the pH condition. Conditions which would favor the Maillard reaction at near neutral pH or slightly alkaline are absent in highly acidic fruit product that AA is usually added as antioxidant agent (Kacem et al., 1987). The reaction of AA in fruit juices is very much dependent on pH, as the browning process is inversely proportional to pH over a range of 2.0-3.5 (Braverman, 1963). Below pH 4.0, browning is due primarily to decomposition of AA to furfural and 5-Hydroxymethylfurfural (HMF) formation which is formed causing the brown color (Eskin et al., 2012).
25
3 Methodology
3.1 Overall approach
The research methodology in this thesis includes three integrated parts (see Figure 1), two experimental parts and one regression analysis part. The first experimental part is designed to find out the effect of headspace volume and package volume on vitamin C degradation. The incentive of this part is to find out if the product in small package has a different shelf life compared with the large package. The second experimental part is focused on the correlation of vitamin C degradation and browning. The purpose is to identify if vitamin C concentration can be a predictor of browning which is the indicator of shelf life for processed fruit. As for the regression analysis part, the existing data in Tetra Recart Food Database was used to figure out the critical factors for processed fruit shelf life in Tetra Recart packaging. These three integrated parts can all contribute to the shelf life estimation of fruit products in Tetra Recart packaging.
Figure 1. Overall approach

26
3.2 The effect of headspace and package volume
3.2.1 Experimental design
Glucose syrup with addition of AA were filled in the TRC390 and TRC200 respectively. Syrup was chosen here to ensure H/P ratio is the only factor influencing AA degradation. Also, it is reasonable to pack syrup since it acts as brine for the fruit product in TRC packages. Through pre-test, the concentration of glucose syrup and the weight of filled syrup were decided. Additional citric acid was added to make syrup achieve same pH as the product of pineapple to be retorted under same program. The concentration of citric acid was decided during pre-test and final pH for all the samples are around 3.5. Detail information and the abbreviation of samples are described in Table 1. Process procedure of all the samples can be found in Figure 2.
Table 1. Abbreviation, formula, package size and storage temperature of samples
Syrup Citric Acid
Vitamin C Headspace Content
Package Size
Storage Temperature
SH30S* 16° Brix, 200 g 0.015% 1600 mg/L Nitrogen TRC 200 30 oC
SH30L 16° Brix, 429 g 0.015% 1600 mg/L Nitrogen TRC 390 30 oC
SH30SA 16° Brix, 200 g 0.015% 1600 mg/L Air TRC 200 30 oC
*The letter after figure represents the size of packages, which is ‘S’ for small, ‘L’ for large.
Figure 2. Process procedure of syrup samples
Zero sample of SH30S was stored at 6 oC and measured three days after due to lack of access to equipment. SH30L was produced 10 days later than other samples due to an unexpected mistake and zero sample was measured at the same day. SH30SA was produced when air was flushed in headspace mistakenly. Discussion about SH30SA result will not be displayed in this paper. Headspace
27
volume, oxygen concentration in headspace, content of dissolved oxygen and Vitamin C concentration of syrup were measured every week with three repetitions along the 12-week storage time.
Equation used for data analysis:
Total Oxygen Content (mL) = Oxygen concentration in headspace (%) × Headspace volume (mL) + Dissolved oxygen (mg/L) × Volume of filling product (L) × 0.766
Oxygen Consumption (mL) from day X to day Y = Total oxygen content of day Y (mL) - Total oxygen content of day X (mL) + OTR (mL/package day) × (Y-X) (day)
3.2.2 Materials and equipment
List of materials:
1. TRC200 and TRC390: Tetra Recart is a modern and innovative package for the canned food. It is the first retortable carton package designed for shelf-stable food products with particles of almost any size from sauce, soup to vegetable, tomato, bean and pet food, for example. In other words, Tetra Recart is the alternative package for foods traditionally filled in cans, glass jars or pouches. The materials of TRC packages contain polypropylene, paperboard, aluminium foil, which brings low environmental impact. TRC packages were designed specially to resist retorting condition and provide shelf life up to 24 months. To keep the hygiene for sealing and not overfill products to exceed the sealing line, minimum headspace volume is set for each package in Tetra Pak. On the other hand, according to EU regulation, maximum headspace volume is set to ensure customer get certain amount of products
2. AA: Santa Maria, Askorbinsyra, 37g/bag 3. Citric acid 4. Glucose 5. Iodine solution, BDH Chemicals: Iodine in 0.05 mol/L water solution was
used as reagent solution. General recommended storage time after opening is maximum two weeks for this kind of standard solutions.
6. Oxalic acid, Merck KGaA, Germany: Dilute oxalic acid until 5% in distilled water. The same amount of oxalic acid as the sample with AA was used during titration. Oxygen in air reduce the AA in sample while waiting to be analysed, oxalic acid is added to prevent AA from oxidation.
7. Distilled water List of equipment:
1. TitroLine 7000, SI Analytic, Germany

28
2. CheckMate 9900 O2, PBI-Dansensor 3. Oxi 3315, WTW GmbH 4. Force Gauge Meter, Lutron FG 5005
3.2.3 Test methods
1. Non-destructive measuring method of headspace volume The purpose of this test method is to determine the headspace of sealed packages without destroying the packages. The headspace is determined by recording the lifting force from a package that is entirely immersed into water. The lifting force is recorded by a force gauge meter (See Figure 3).
Figure 3. Force gauge meter with accessories for measuring headspace volume
The headspace volume (V) is calculated with the following expression:
V = CT (F – F0 – FC),
V is the requested volume expressed in ml,
F is the recorded lifting force expressed in grams (g),
F0 is the lifting force for the package without headspace (expressed in g),
FC is a temperature correction of the filling product density (expressed in g),
CT is a temperature correction factor for the air in the headspace volume.
29
CT and FC are determined from the filling product temperature. If no temperature correction is necessary, CT = 1 and FC = 0
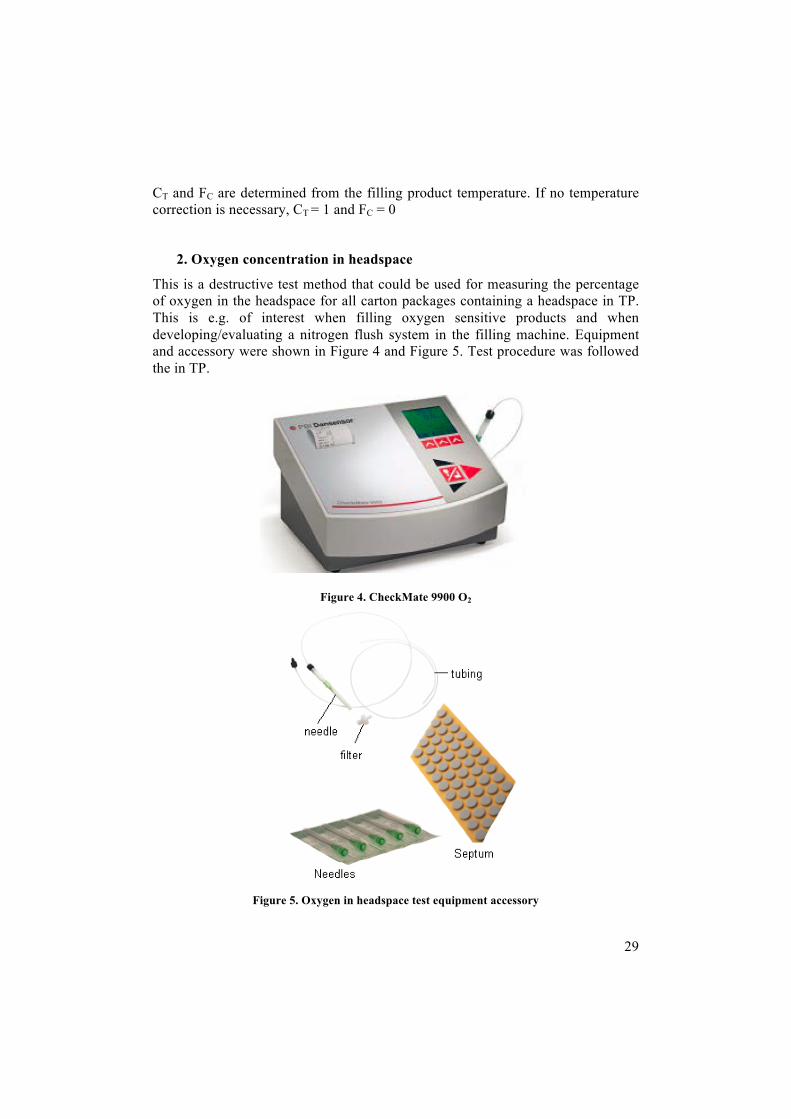
2. Oxygen concentration in headspace
This is a destructive test method that could be used for measuring the percentage of oxygen in the headspace for all carton packages containing a headspace in TP. This is e.g. of interest when filling oxygen sensitive products and when developing/evaluating a nitrogen flush system in the filling machine. Equipment and accessory were shown in Figure 4 and Figure 5. Test procedure was followed the in TP.
Figure 4. CheckMate 9900 O2
Figure 5. Oxygen in headspace test equipment accessory
30
3. Electrochemical measurements for concentration of dissolved oxygen
Each liquid takes up oxygen until the partial pressure of oxygen in the liquid is in equilibrium with the air or gas phase that is in contact with it. The actual oxygen concentration depends on several factors like temperature, air pressure etc.
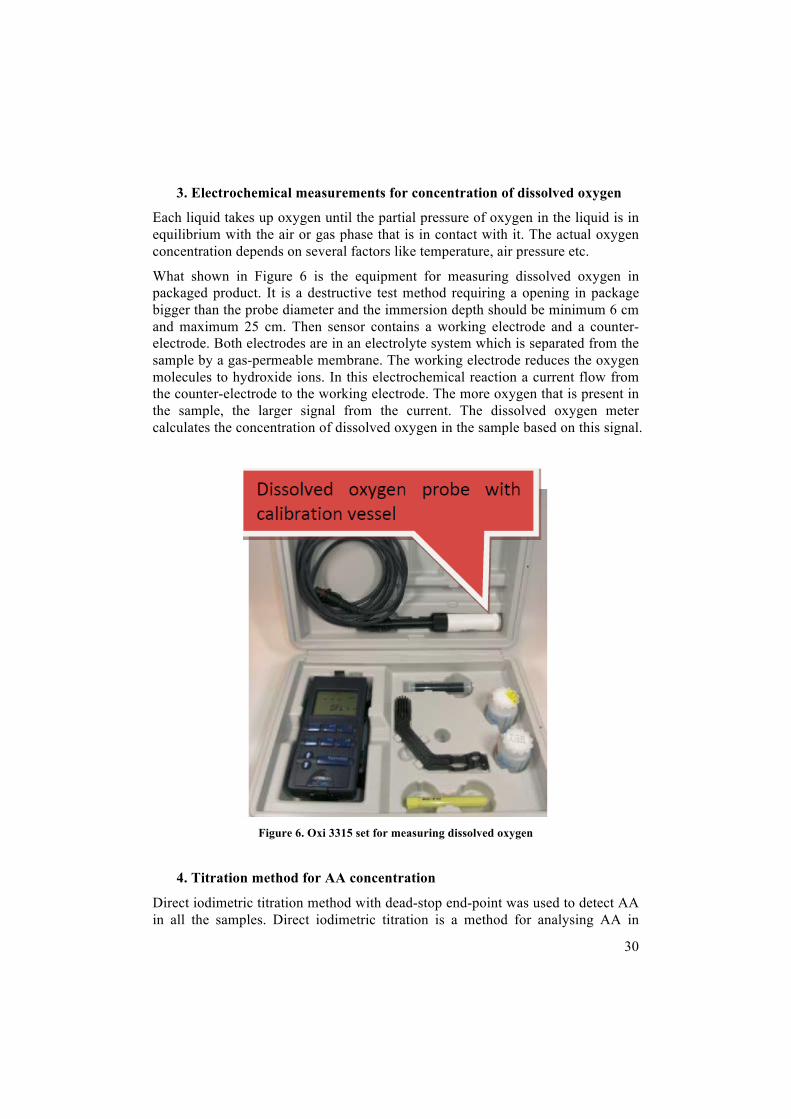
What shown in Figure 6 is the equipment for measuring dissolved oxygen in packaged product. It is a destructive test method requiring a opening in package bigger than the probe diameter and the immersion depth should be minimum 6 cm and maximum 25 cm. Then sensor contains a working electrode and a counter-electrode. Both electrodes are in an electrolyte system which is separated from the sample by a gas-permeable membrane. The working electrode reduces the oxygen molecules to hydroxide ions. In this electrochemical reaction a current flow from the counter-electrode to the working electrode. The more oxygen that is present in the sample, the larger signal from the current. The dissolved oxygen meter calculates the concentration of dissolved oxygen in the sample based on this signal.
Figure 6. Oxi 3315 set for measuring dissolved oxygen
4. Titration method for AA concentration
Direct iodimetric titration method with dead-stop end-point was used to detect AA in all the samples. Direct iodimetric titration is a method for analysing AA in

31
various citrus fruits and in vitamin tables. In iodimetric titration, the analyte (a reducing agent) reacts with iodine (I2) with the iodie (I-) as product. Here iodine rapidly oxidizes AA, C6H8O6, to produce dehydroascorbic acid, C6H6O6. AA is the oxidized form and dehydroascorbic acid is the reduced form of the analyte.
TitroLine 7000 (SI Analytic, Germany) with electrode Pt62 was used here for titration (see Figure 7).
Titration parameters: Initial waiting time: 0s; Step size: 0.025mL; Tit.direct: increase; Pretitration: changes depending on the concentration of AA in sample, delay time 10s.
Dosing parameter: Dosing speed: 25%; Dosing speed: 10mL/min; Filling speed: 30s; Maximum titration volume: 15.000mL.
Figure 7. TitroLine 7000
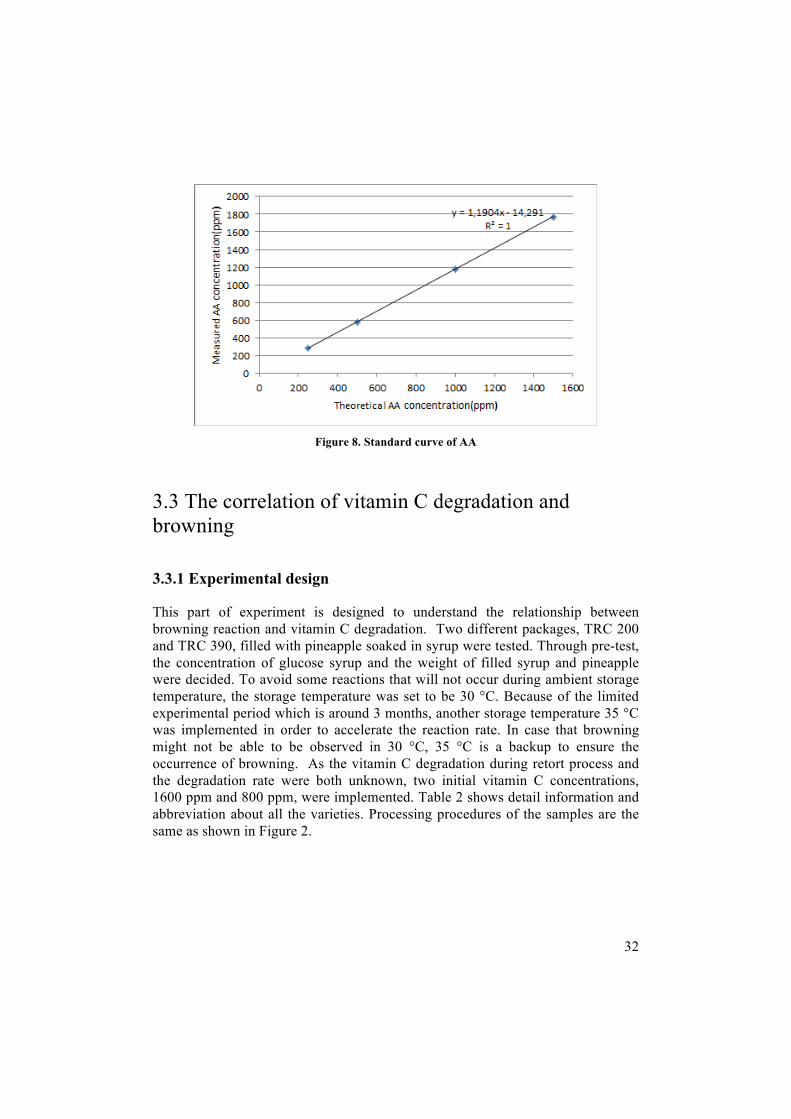
Standard solutions of AA for analysis were prepared with distilled water and titrated in the standard method. As shown in Figure 8, four concentrations of AA were tested, 250 ppm, 500 ppm, 1000 ppm and 1500 ppm. The regression line equation (y=1.1904x-14.291) had a coefficient of determination (R2) at 1 which indicated a good correlation.
32
Figure 8. Standard curve of AA
3.3 The correlation of vitamin C degradation and browning
3.3.1 Experimental design
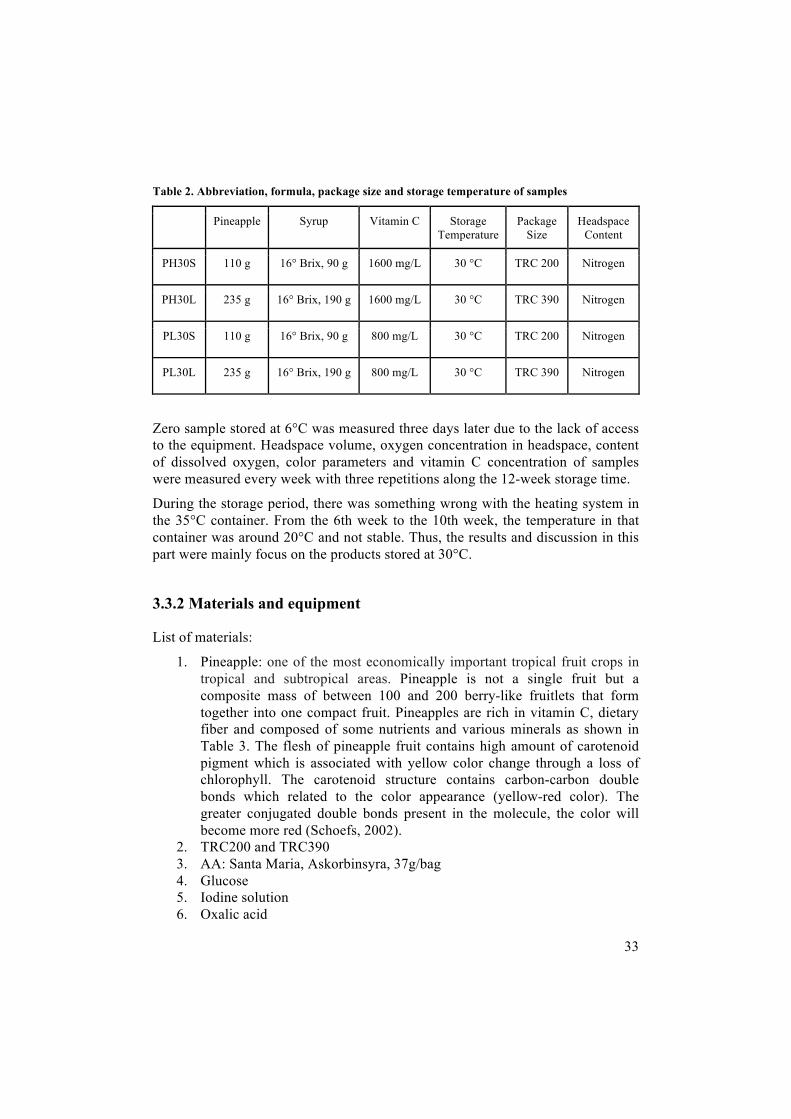
This part of experiment is designed to understand the relationship between browning reaction and vitamin C degradation. Two different packages, TRC 200 and TRC 390, filled with pineapple soaked in syrup were tested. Through pre-test, the concentration of glucose syrup and the weight of filled syrup and pineapple were decided. To avoid some reactions that will not occur during ambient storage temperature, the storage temperature was set to be 30 °C. Because of the limited experimental period which is around 3 months, another storage temperature 35 °C was implemented in order to accelerate the reaction rate. In case that browning might not be able to be observed in 30 °C, 35 °C is a backup to ensure the occurrence of browning. As the vitamin C degradation during retort process and the degradation rate were both unknown, two initial vitamin C concentrations, 1600 ppm and 800 ppm, were implemented. Table 2 shows detail information and abbreviation about all the varieties. Processing procedures of the samples are the same as shown in Figure 2.
33
Table 2. Abbreviation, formula, package size and storage temperature of samples
Pineapple Syrup Vitamin C Storage Temperature
Package Size
Headspace Content
PH30S 110 g 16° Brix, 90 g 1600 mg/L 30 °C TRC 200 Nitrogen
PH30L 235 g 16° Brix, 190 g 1600 mg/L 30 °C TRC 390 Nitrogen
PL30S 110 g 16° Brix, 90 g 800 mg/L 30 °C TRC 200 Nitrogen
PL30L 235 g 16° Brix, 190 g 800 mg/L 30 °C TRC 390 Nitrogen
Zero sample stored at 6°C was measured three days later due to the lack of access to the equipment. Headspace volume, oxygen concentration in headspace, content of dissolved oxygen, color parameters and vitamin C concentration of samples were measured every week with three repetitions along the 12-week storage time.
During the storage period, there was something wrong with the heating system in the 35°C container. From the 6th week to the 10th week, the temperature in that container was around 20°C and not stable. Thus, the results and discussion in this part were mainly focus on the products stored at 30°C.
3.3.2 Materials and equipment
List of materials:
1. Pineapple: one of the most economically important tropical fruit crops in tropical and subtropical areas. Pineapple is not a single fruit but a composite mass of between 100 and 200 berry-like fruitlets that form together into one compact fruit. Pineapples are rich in vitamin C, dietary fiber and composed of some nutrients and various minerals as shown in Table 3. The flesh of pineapple fruit contains high amount of carotenoid pigment which is associated with yellow color change through a loss of chlorophyll. The carotenoid structure contains carbon-carbon double bonds which related to the color appearance (yellow-red color). The greater conjugated double bonds present in the molecule, the color will become more red (Schoefs, 2002).
2. TRC200 and TRC390 3. AA: Santa Maria, Askorbinsyra, 37g/bag 4. Glucose 5. Iodine solution 6. Oxalic acid

34
7. Distilled water Table 3. Chemical composition of the edible portion of pineapple (all varieties)
(the data from USDA Nutrient Database)
Nutrient Units Value per 100g
Water g 86.00
Protein g 0.54
Total lipid (fat) g 0.12
Ash g 0.22
Carbohydrate g 13.12
Fiber, total dietary g 1.4
Sugars, total g 9.85
Sucrose g 9.85
Glucose (dextrose) g 5.99
Fructose g 1.73
Vitamins
Vitamin C mg 47.8
Vitamin A, IU IU 58
Vitamin A, RAE mcg_RAE 3
List of equipment:
1. Chroma meter, CR-400, Japan 2. TitroLine 7000, SI Analytic, Germany 3. CheckMate 9900 O2, PBI-Dansensor
35
4. Oxi 3315, WTW GmbH 5. Force Gauge Meter, Lutron FG 5005
3.3.3 Test methods
The test methods of oxygen in headspace, headspace volume, dissolved oxygen and titration method were illustrated in previous section.
Color measurement
The color perceived depends on the spectral composition of the light source, the chemical and physical character of the object and the spectral sensitivity characteristics of eye viewing the object (Ranganna, 1986). Here Hunter Lab system was used for objectively describing color.
Hunter Lab system is a tricolor metric system which has tristimulus values: L value (lightness or darkness), a value (redness or greenness) and b value (yellowness or blue) as shown in Figure 9.
Hunter values can be used to calculate the total color difference (∆E) between a sample and a standard. It can be expressed as the coordinates of color space (Yoovidhya et al., n.d.). Hence
∆𝐸 = [(∆𝐿)2 + (∆𝑎)2 + (∆𝑏)2]1/2
To have consistency in color, all the pineapple samples were filtered through sifter to obtain pineapple only and then smashed before measurement.

36
Figure 9: The Hunter L, a, b color space (De Man,1980)
3.4 Regression analysis
First, the primary reports were extracted from Tetra Recart Food Database. Then the reports were sorted into different categories according to different project names. The factors investigated in this study that may influence shelf life were fruit category, AA concentration, blanching temperature, storage temperature, heat treatment temperature and heat treatment time.
Secondly, stepwise regression in Minitab was carried out within each project to identify variables which might have the main influence on shelf life. Since the experimental conditions might vary in different projects, the analysis was implemented separately according to different projects.
Thirdly, the results from different projects were analyzed together. Ordinal logistic regression was implemented to compare the data from different projects. Thus, all factors can be analyzed in order to find out the critical ones that may affect fruit shelf life.
37
4 Results and Discussion
4.1 The effect of headspace and package volume
Headspace volume
The experiment here is to verify if there is any difference of AA degradation between the TRC 200 and TRC 390 packages. Measurements of headspace volume shows in average TRC 200 contains 14.6 mL and TRC 390 contains 12.0 mL. There is no so much difference between the headspace volume of these two packages. However, TRC 390 contains much more product and has larger surface area for the interaction between oxygen in headspace and AA, which may lead to more dramatic degradation of AA. Volume itself does not affect the degradation of AA directly, instead it is the oxygen content decided by package volume which influences the degradation of AA.
Changes of concentration of dissolved oxygen, oxygen in headspace
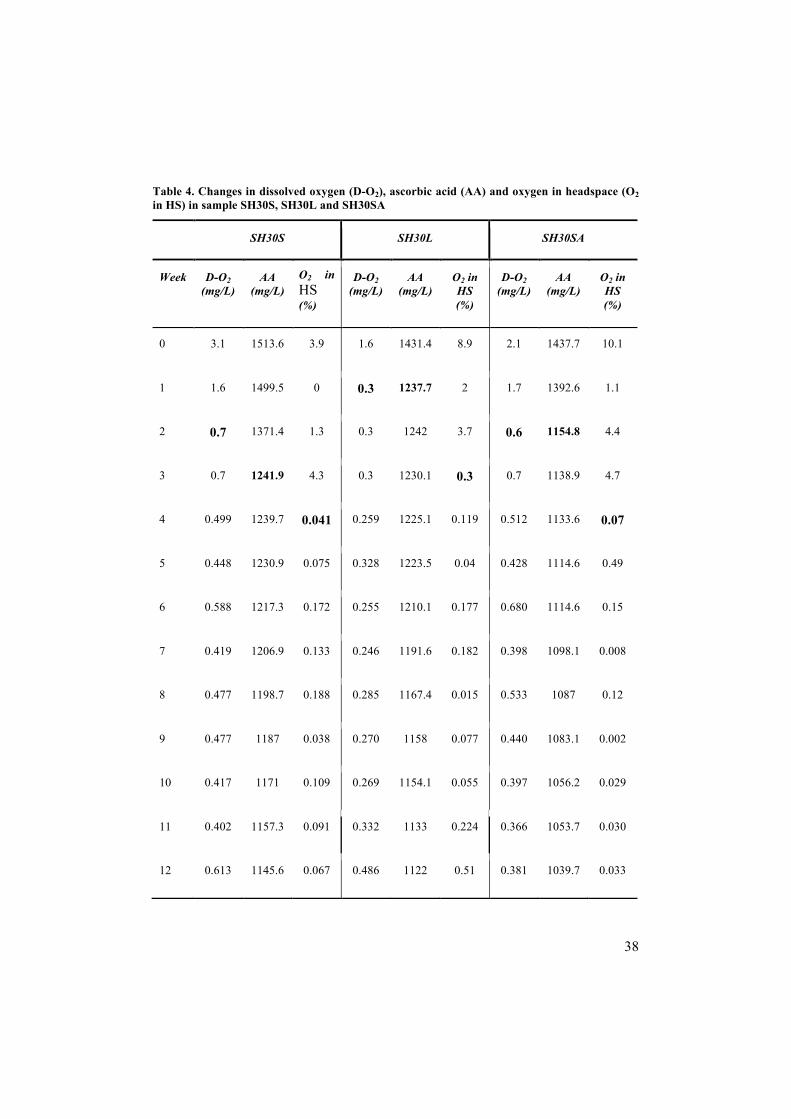
All the results of measurements are shown in Table 4. The initial oxygen content (including both dissolved oxygen and oxygen in headspace) in small package is 0.980 mL, while it is 1.554 mL in the large one. The difference here is mainly caused by the much higher percentage of oxygen in headspace in large package, which may be the result of the unsteady gas flushing rate. The amount of oxygen which equals to the initial amount of oxygen was consumed after three weeks in both sizes of packages. There is dramatic decrease of dissolved oxygen and oxygen in headspace during the first three or four weeks in two sizes of packages. After the dramatic decrease, an equilibrium with same low level of oxygen was reached (figures in bold) and in large package this took less time to achieve. A plateau was reached after an initial depletion of oxygen was also reported in commercial orange juice in TetraBrik (Kennedy et al., 1992) and lemon juice (Robertson & Samaniego, 1986) during storage.
Extremely high value of oxygen in headspace were strangely obtained at the third week of storage in small size package, second week of storage in large size package and third week of storage in small size package filled with air, which were actually measured at the same day. Therefore, one can conclude those strange values are the result of wrong measurement or equipment in wrong condition.
38
Table 4. Changes in dissolved oxygen (D-O2), ascorbic acid (AA) and oxygen in headspace (O2 in HS) in sample SH30S, SH30L and SH30SA
SH30S SH30L SH30SA
Week D-O2 (mg/L)
AA (mg/L)
O2 in HS (%)
D-O2 (mg/L)
AA (mg/L)
O2 in HS (%)
D-O2 (mg/L)
AA (mg/L)
O2 in HS (%)
0 3.1 1513.6 3.9 1.6 1431.4 8.9 2.1 1437.7 10.1
1 1.6 1499.5 0 0.3 1237.7 2 1.7 1392.6 1.1
2 0.7 1371.4 1.3 0.3 1242 3.7 0.6 1154.8 4.4
3 0.7 1241.9 4.3 0.3 1230.1 0.3 0.7 1138.9 4.7
4 0.499 1239.7 0.041 0.259 1225.1 0.119 0.512 1133.6 0.07
5 0.448 1230.9 0.075 0.328 1223.5 0.04 0.428 1114.6 0.49
6 0.588 1217.3 0.172 0.255 1210.1 0.177 0.680 1114.6 0.15
7 0.419 1206.9 0.133 0.246 1191.6 0.182 0.398 1098.1 0.008
8 0.477 1198.7 0.188 0.285 1167.4 0.015 0.533 1087 0.12
9 0.477 1187 0.038 0.270 1158 0.077 0.440 1083.1 0.002
10 0.417 1171 0.109 0.269 1154.1 0.055 0.397 1056.2 0.029
11 0.402 1157.3 0.091 0.332 1133 0.224 0.366 1053.7 0.030
12 0.613 1145.6 0.067 0.486 1122 0.51 0.381 1039.7 0.033
39
Changes of AA concentration
The concentration of AA retained after retort vary due to the package volume and type of gas flushed in headspace. There is 82.2 mg/L AA less in large package than in small one after retort. An initial big decrease in AA concentration is observed in the small package during the first three weeks and in large package during the first week (Table 4, figures in bold). The initial dramatic loss of oxygen, especially the dissolved oxygen, seemed to correlate with the high rate of degradation of AA. The lag period for oxygen in headspace to reach a relatively constant low level makes sense since it needs more time to reach the AA in syrup. Hence an aerobic degradation process was taking place here. After this drop, 82% of AA was retained in small package and 86.5% of AA was retained in large package, which means AA was degraded faster in large package during the beginning stage. Later, the degradation of AA in both size became slow. The initial fast decline of AA followed by a much slower decline was also observed in the red fruit (Verbeyst et al., 2013) and citrus juice (Kennedy et al., 1992; Robertson & Samaniego, 1986) during storage. After twelve weeks of storage, 75.7% of AA was retained in small size while 78.4% in large size, which shows no big difference.
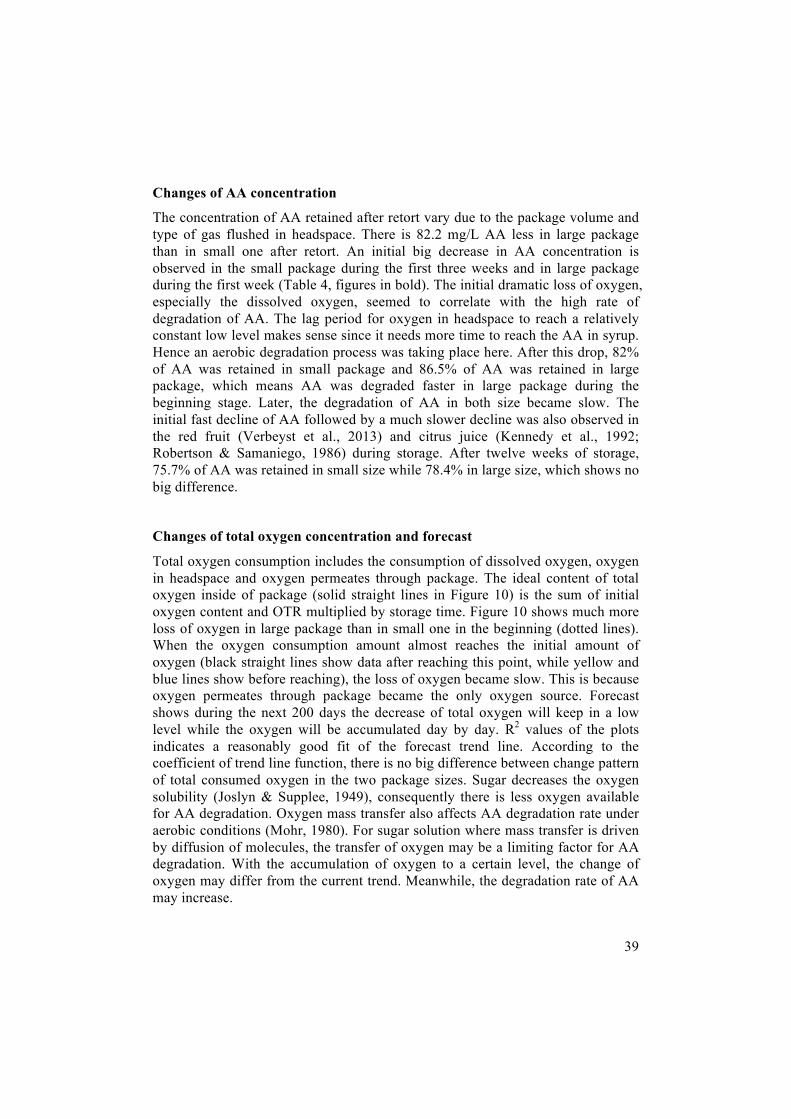
Changes of total oxygen concentration and forecast
Total oxygen consumption includes the consumption of dissolved oxygen, oxygen in headspace and oxygen permeates through package. The ideal content of total oxygen inside of package (solid straight lines in Figure 10) is the sum of initial oxygen content and OTR multiplied by storage time. Figure 10 shows much more loss of oxygen in large package than in small one in the beginning (dotted lines). When the oxygen consumption amount almost reaches the initial amount of oxygen (black straight lines show data after reaching this point, while yellow and blue lines show before reaching), the loss of oxygen became slow. This is because oxygen permeates through package became the only oxygen source. Forecast shows during the next 200 days the decrease of total oxygen will keep in a low level while the oxygen will be accumulated day by day. R2 values of the plots indicates a reasonably good fit of the forecast trend line. According to the coefficient of trend line function, there is no big difference between change pattern of total consumed oxygen in the two package sizes. Sugar decreases the oxygen solubility (Joslyn & Supplee, 1949), consequently there is less oxygen available for AA degradation. Oxygen mass transfer also affects AA degradation rate under aerobic conditions (Mohr, 1980). For sugar solution where mass transfer is driven by diffusion of molecules, the transfer of oxygen may be a limiting factor for AA degradation. With the accumulation of oxygen to a certain level, the change of oxygen may differ from the current trend. Meanwhile, the degradation rate of AA may increase.
40
Figure 10. Total oxygen consumption, ideal total oxygen content in SH30S, SH30L as a
function of storage time and their prediction
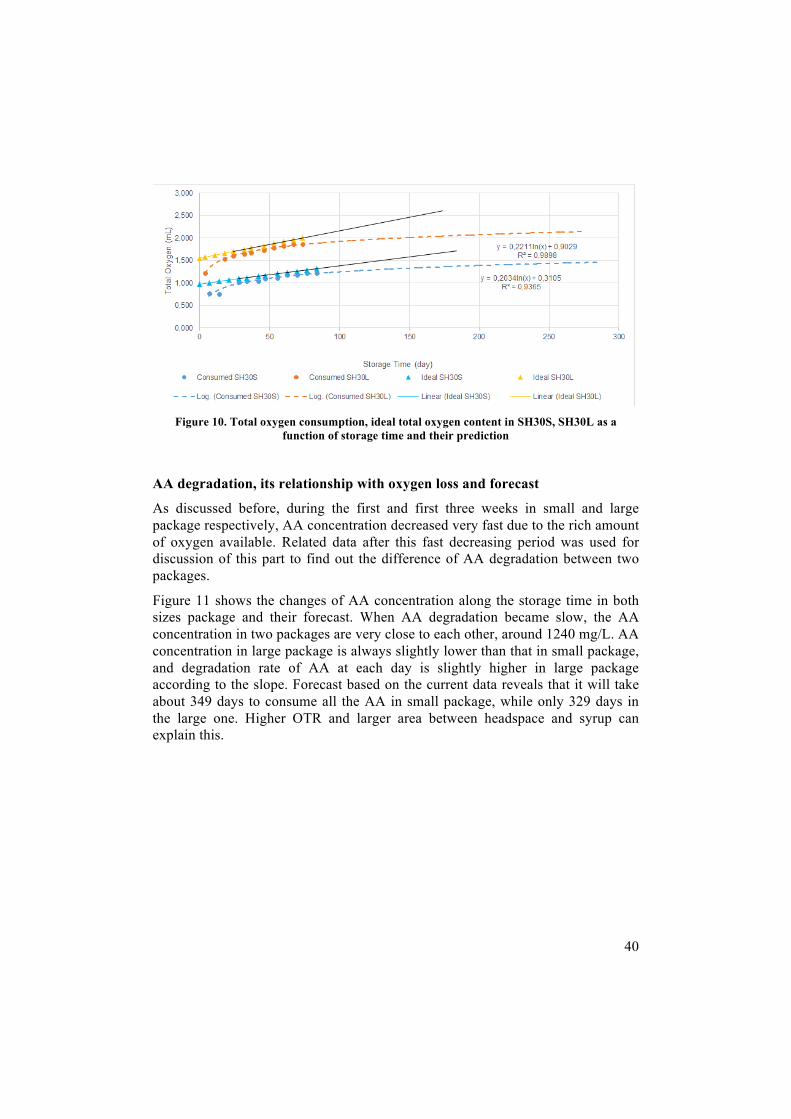
AA degradation, its relationship with oxygen loss and forecast
As discussed before, during the first and first three weeks in small and large package respectively, AA concentration decreased very fast due to the rich amount of oxygen available. Related data after this fast decreasing period was used for discussion of this part to find out the difference of AA degradation between two packages.
Figure 11 shows the changes of AA concentration along the storage time in both sizes package and their forecast. When AA degradation became slow, the AA concentration in two packages are very close to each other, around 1240 mg/L. AA concentration in large package is always slightly lower than that in small package, and degradation rate of AA at each day is slightly higher in large package according to the slope. Forecast based on the current data reveals that it will take about 349 days to consume all the AA in small package, while only 329 days in the large one. Higher OTR and larger area between headspace and syrup can explain this.
41
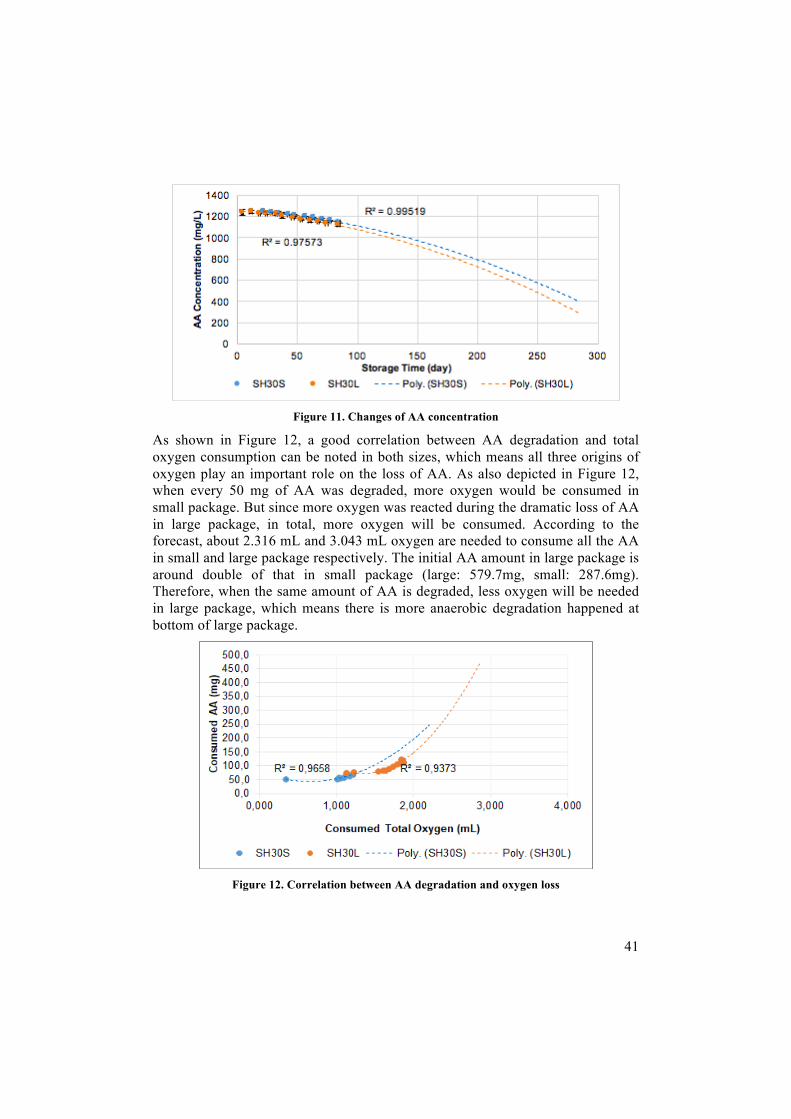
Figure 11. Changes of AA concentration
As shown in Figure 12, a good correlation between AA degradation and total oxygen consumption can be noted in both sizes, which means all three origins of oxygen play an important role on the loss of AA. As also depicted in Figure 12, when every 50 mg of AA was degraded, more oxygen would be consumed in small package. But since more oxygen was reacted during the dramatic loss of AA in large package, in total, more oxygen will be consumed. According to the forecast, about 2.316 mL and 3.043 mL oxygen are needed to consume all the AA in small and large package respectively. The initial AA amount in large package is around double of that in small package (large: 579.7mg, small: 287.6mg). Therefore, when the same amount of AA is degraded, less oxygen will be needed in large package, which means there is more anaerobic degradation happened at bottom of large package.
Figure 12. Correlation between AA degradation and oxygen loss
42
4.2 The correlation of vitamin C degradation and browning
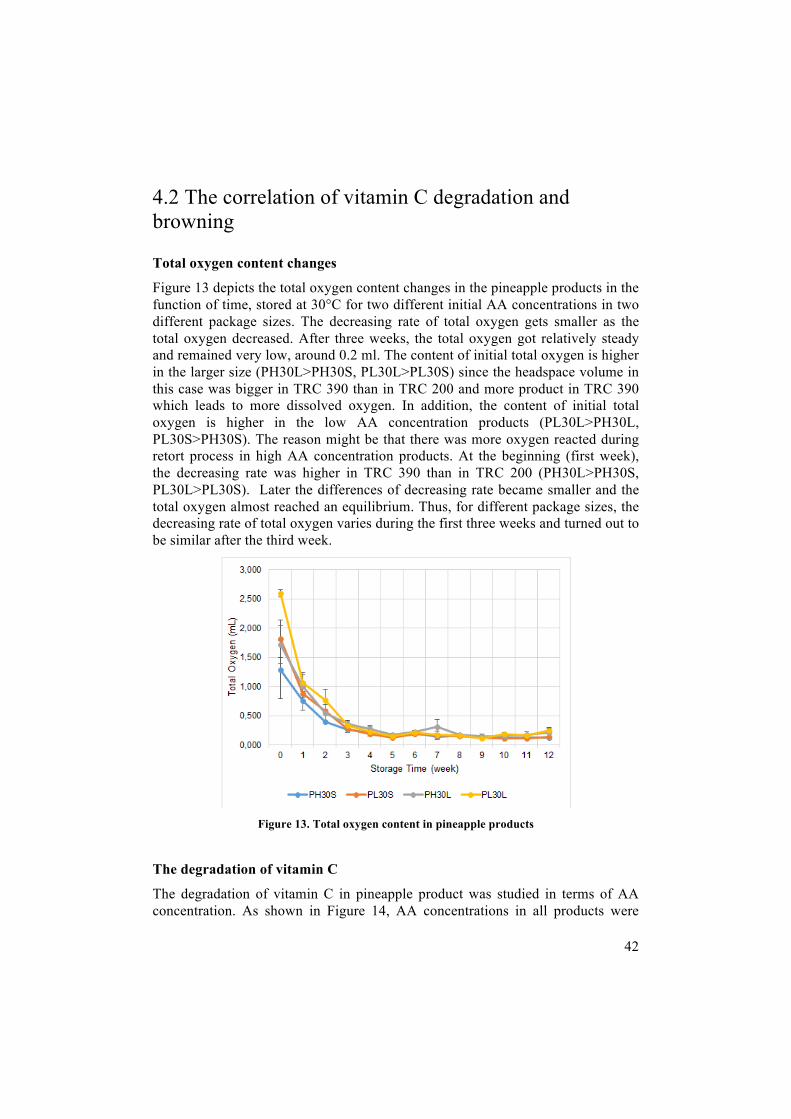
Total oxygen content changes
Figure 13 depicts the total oxygen content changes in the pineapple products in the function of time, stored at 30°C for two different initial AA concentrations in two different package sizes. The decreasing rate of total oxygen gets smaller as the total oxygen decreased. After three weeks, the total oxygen got relatively steady and remained very low, around 0.2 ml. The content of initial total oxygen is higher in the larger size (PH30L>PH30S, PL30L>PL30S) since the headspace volume in this case was bigger in TRC 390 than in TRC 200 and more product in TRC 390 which leads to more dissolved oxygen. In addition, the content of initial total oxygen is higher in the low AA concentration products (PL30L>PH30L, PL30S>PH30S). The reason might be that there was more oxygen reacted during retort process in high AA concentration products. At the beginning (first week), the decreasing rate was higher in TRC 390 than in TRC 200 (PH30L>PH30S, PL30L>PL30S). Later the differences of decreasing rate became smaller and the total oxygen almost reached an equilibrium. Thus, for different package sizes, the decreasing rate of total oxygen varies during the first three weeks and turned out to be similar after the third week.
Figure 13. Total oxygen content in pineapple products
The degradation of vitamin C
The degradation of vitamin C in pineapple product was studied in terms of AA concentration. As shown in Figure 14, AA concentrations in all products were

43
gradually decreased during storage. For the first two weeks, the decreasing rate was relatively high due to the high content of total oxygen. Then the decreasing rate became steady and relatively low. For different package sizes, there was no big difference of decreasing pattern. For different initial AA concentrations, the decreasing pattern is also similar, that is AA consumption became steady with the permeated oxygen after consuming most of the total initial oxygen. However, there was more AA degraded in the products of high AA concentration than those of low AA concentration. The AA decrease was around 300 ppm in the products of high AA concentration, while a decrease of around 200 ppm for the low AA concentration. Considering the fact that there was more oxygen consumed in the products of low AA concentration, the degradation mechanism should be different in different concentrations of AA. The reason might be that more AA was degraded through anaerobic pathway or reacting with other components in the products of high AA concentration than those of low AA concentration.
Figure 14. AA concentration changes in pineapple products
Changes of color parameters
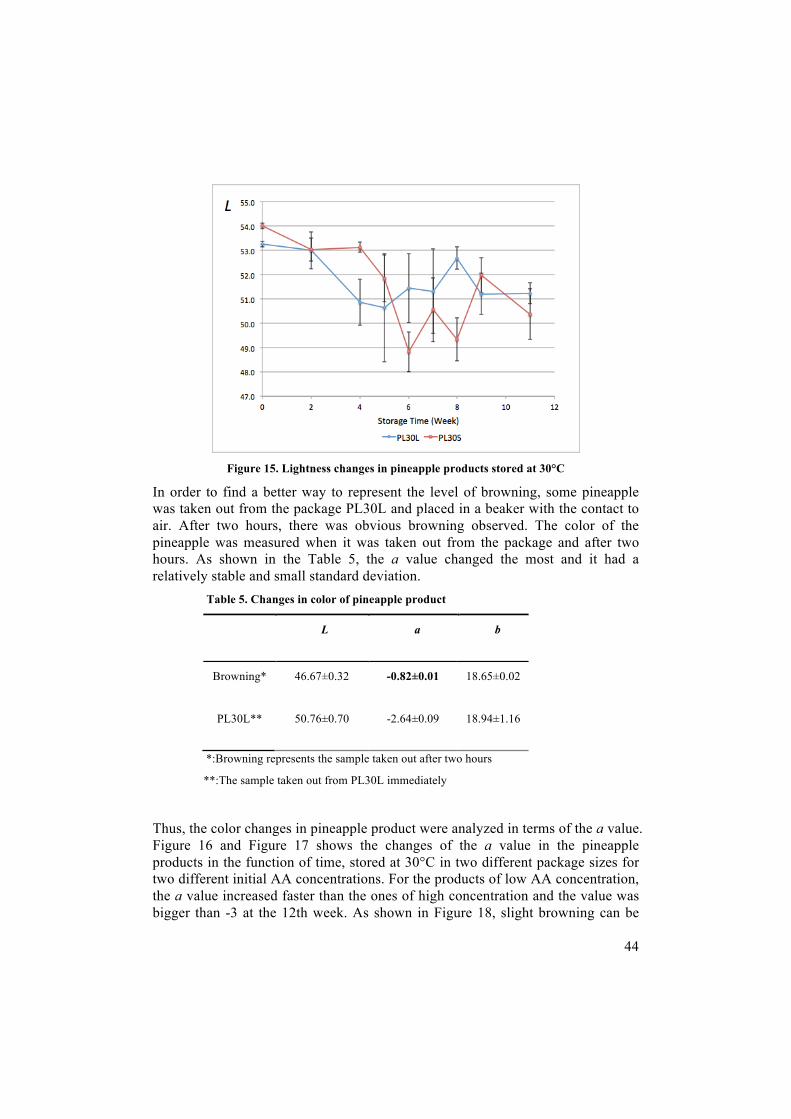
The color changes in pineapple products were first studied in terms of lightness. Figure 15 shows the lightness changes in the pineapple products in the function of time, stored at 30°C for two different initial AA concentrations in two different package sizes. The fluctuation of lightness and standard deviation turned out to be relatively big due to the fact that the color of pineapple was not homogeneous and the light condition in the lab was not stable all the time.
44
Figure 15. Lightness changes in pineapple products stored at 30°C
In order to find a better way to represent the level of browning, some pineapple was taken out from the package PL30L and placed in a beaker with the contact to air. After two hours, there was obvious browning observed. The color of the pineapple was measured when it was taken out from the package and after two hours. As shown in the Table 5, the a value changed the most and it had a relatively stable and small standard deviation. Table 5. Changes in color of pineapple product
L a b
Browning* 46.67±0.32 -0.82±0.01 18.65±0.02
PL30L** 50.76±0.70 -2.64±0.09 18.94±1.16
*:Browning represents the sample taken out after two hours
**:The sample taken out from PL30L immediately
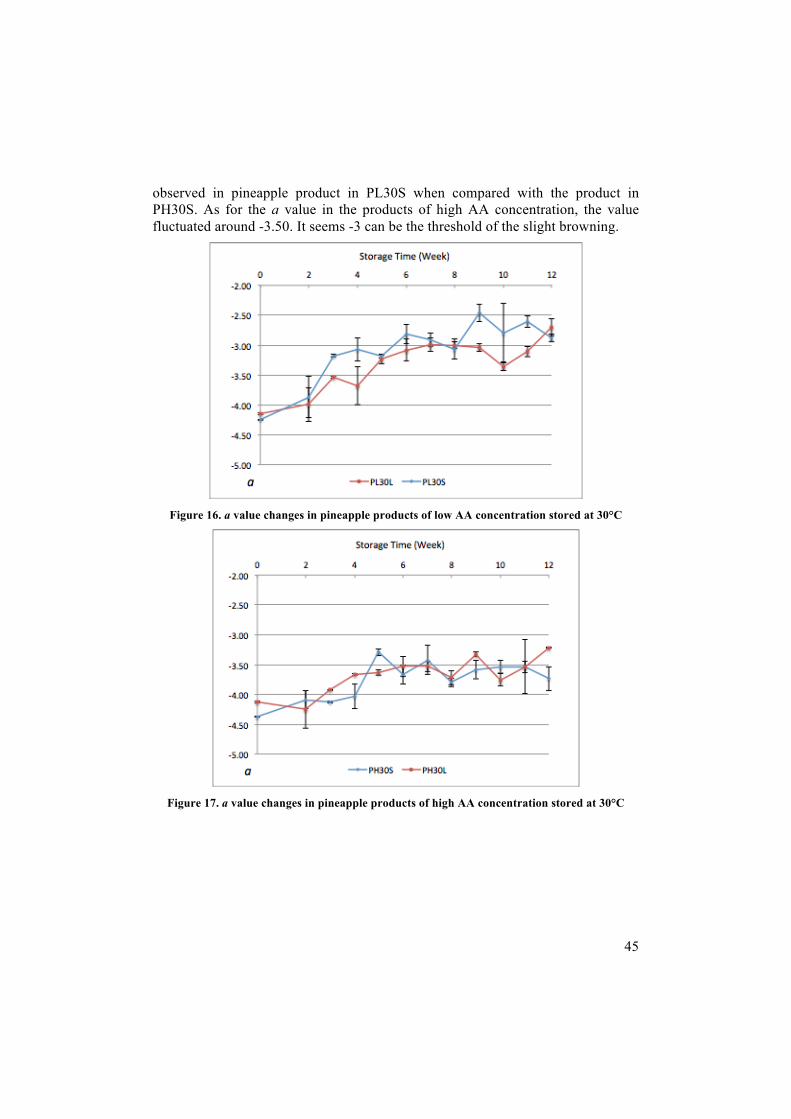
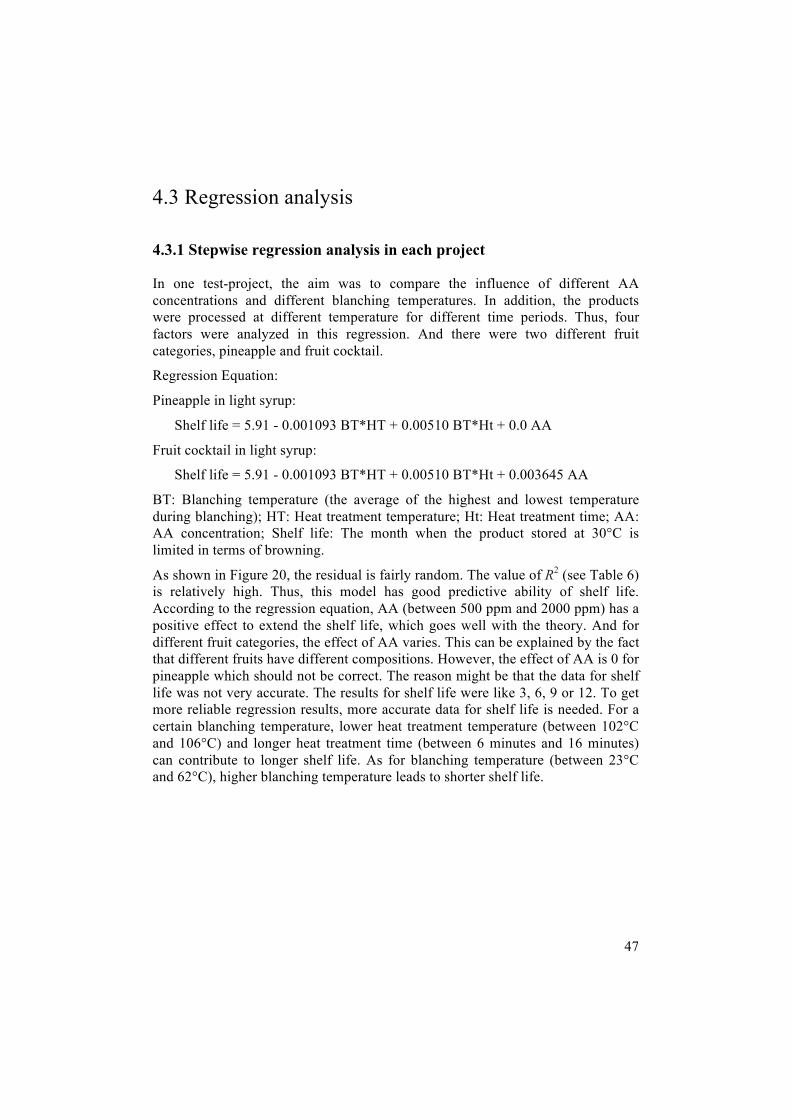
Thus, the color changes in pineapple product were analyzed in terms of the a value. Figure 16 and Figure 17 shows the changes of the a value in the pineapple products in the function of time, stored at 30°C in two different package sizes for two different initial AA concentrations. For the products of low AA concentration, the a value increased faster than the ones of high concentration and the value was bigger than -3 at the 12th week. As shown in Figure 18, slight browning can be
45
observed in pineapple product in PL30S when compared with the product in PH30S. As for the a value in the products of high AA concentration, the value fluctuated around -3.50. It seems -3 can be the threshold of the slight browning.
Figure 16. a value changes in pineapple products of low AA concentration stored at 30°C
Figure 17. a value changes in pineapple products of high AA concentration stored at 30°C

46
Figure 18. Pineapple products in PL30S(left) and PH30S(right)
In order to find the correlation of AA degradation and browning, a scatter plot was made (see Figure 19). As discussed above, the a value -3 might be the threshold of the slight browning. When the a value is above -3, the AA concentration is below 460 ppm. Thus, the AA concentration might be a predictor of browning. Further validation needs to be seen in the products of high AA concentration. If the pineapple also turns to be slight brown when the AA concentration is below 460 ppm or another concentration in the products of high AA concentration, AA concentration can be used as a predictor of browning.
Figure 19. Scatter plot of AA concentration and a value
47
4.3 Regression analysis
4.3.1 Stepwise regression analysis in each project
In one test-project, the aim was to compare the influence of different AA concentrations and different blanching temperatures. In addition, the products were processed at different temperature for different time periods. Thus, four factors were analyzed in this regression. And there were two different fruit categories, pineapple and fruit cocktail.
Regression Equation:
Pineapple in light syrup:
Shelf life = 5.91 - 0.001093 BT*HT + 0.00510 BT*Ht + 0.0 AA
Fruit cocktail in light syrup:
Shelf life = 5.91 - 0.001093 BT*HT + 0.00510 BT*Ht + 0.003645 AA
BT: Blanching temperature (the average of the highest and lowest temperature during blanching); HT: Heat treatment temperature; Ht: Heat treatment time; AA: AA concentration; Shelf life: The month when the product stored at 30°C is limited in terms of browning.
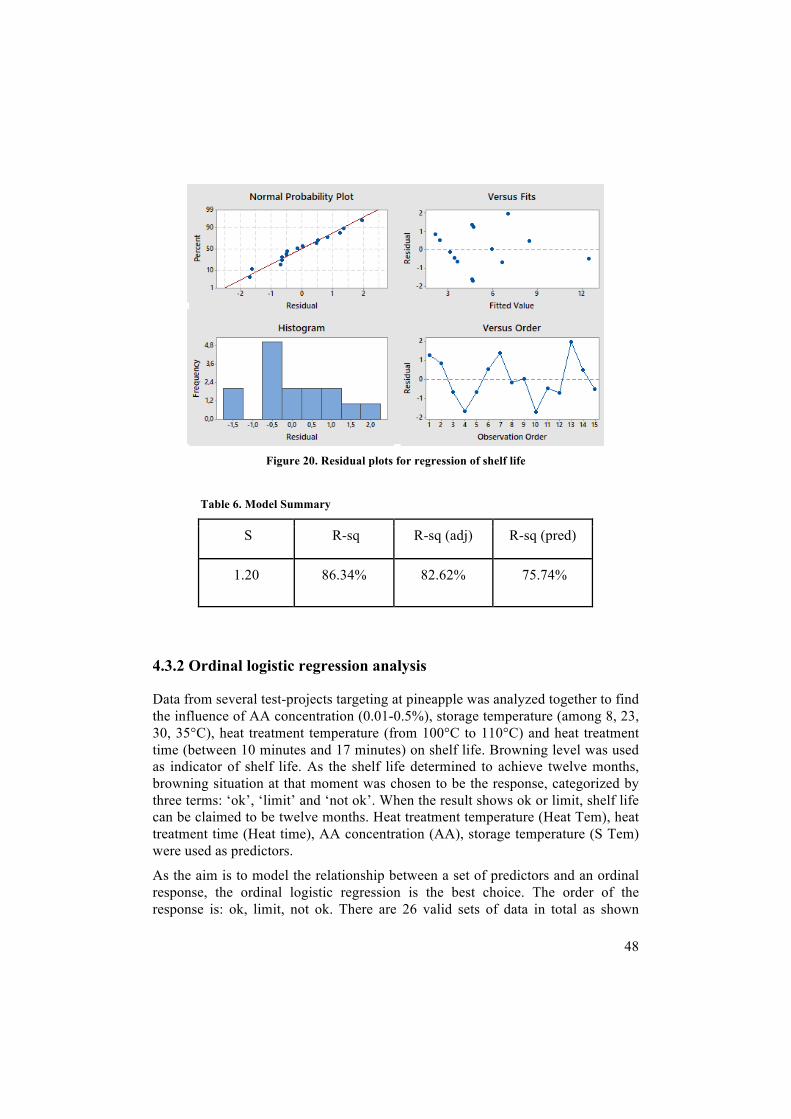
As shown in Figure 20, the residual is fairly random. The value of R2 (see Table 6) is relatively high. Thus, this model has good predictive ability of shelf life. According to the regression equation, AA (between 500 ppm and 2000 ppm) has a positive effect to extend the shelf life, which goes well with the theory. And for different fruit categories, the effect of AA varies. This can be explained by the fact that different fruits have different compositions. However, the effect of AA is 0 for pineapple which should not be correct. The reason might be that the data for shelf life was not very accurate. The results for shelf life were like 3, 6, 9 or 12. To get more reliable regression results, more accurate data for shelf life is needed. For a certain blanching temperature, lower heat treatment temperature (between 102°C and 106°C) and longer heat treatment time (between 6 minutes and 16 minutes) can contribute to longer shelf life. As for blanching temperature (between 23°C and 62°C), higher blanching temperature leads to shorter shelf life.
48
Figure 20. Residual plots for regression of shelf life
Table 6. Model Summary
S R-sq R-sq (adj) R-sq (pred)
1.20 86.34% 82.62% 75.74%
4.3.2 Ordinal logistic regression analysis
Data from several test-projects targeting at pineapple was analyzed together to find the influence of AA concentration (0.01-0.5%), storage temperature (among 8, 23, 30, 35°C), heat treatment temperature (from 100°C to 110°C) and heat treatment time (between 10 minutes and 17 minutes) on shelf life. Browning level was used as indicator of shelf life. As the shelf life determined to achieve twelve months, browning situation at that moment was chosen to be the response, categorized by three terms: ‘ok’, ‘limit’ and ‘not ok’. When the result shows ok or limit, shelf life can be claimed to be twelve months. Heat treatment temperature (Heat Tem), heat treatment time (Heat time), AA concentration (AA), storage temperature (S Tem) were used as predictors.
As the aim is to model the relationship between a set of predictors and an ordinal response, the ordinal logistic regression is the best choice. The order of the response is: ok, limit, not ok. There are 26 valid sets of data in total as shown
49
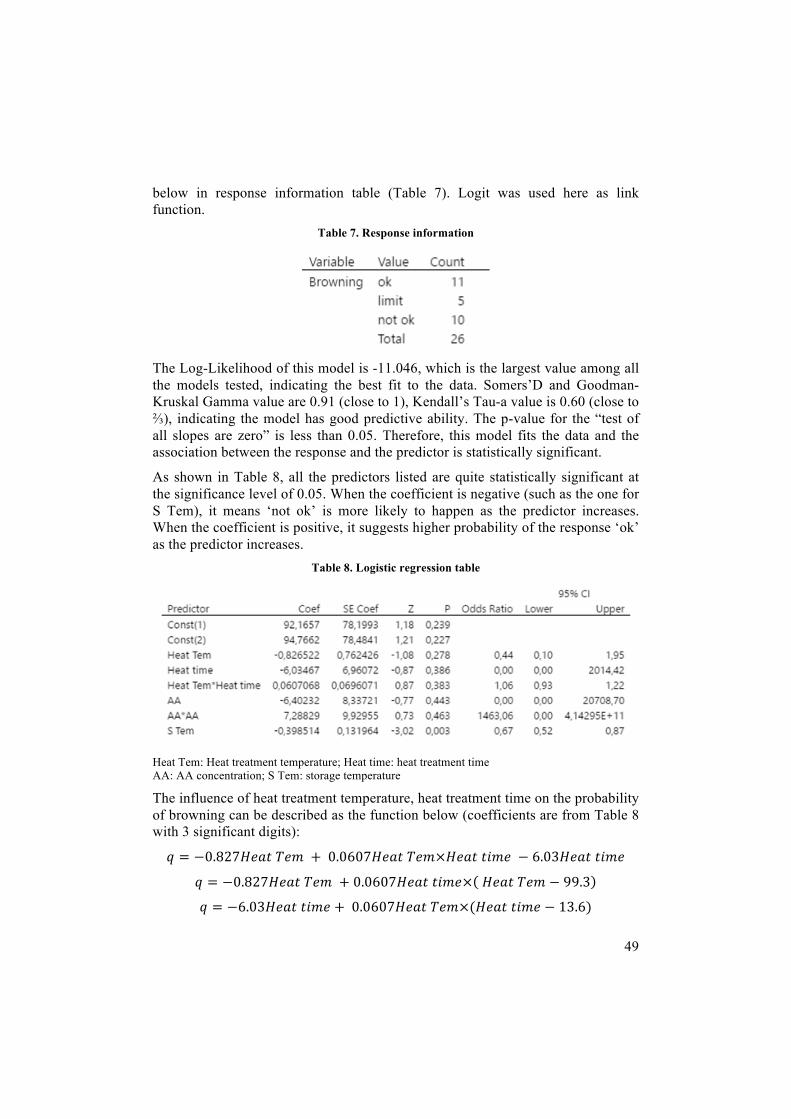
below in response information table (Table 7). Logit was used here as link function.
Table 7. Response information
The Log-Likelihood of this model is -11.046, which is the largest value among all the models tested, indicating the best fit to the data. Somers’D and Goodman-Kruskal Gamma value are 0.91 (close to 1), Kendall’s Tau-a value is 0.60 (close to ⅔), indicating the model has good predictive ability. The p-value for the “test of all slopes are zero” is less than 0.05. Therefore, this model fits the data and the association between the response and the predictor is statistically significant.
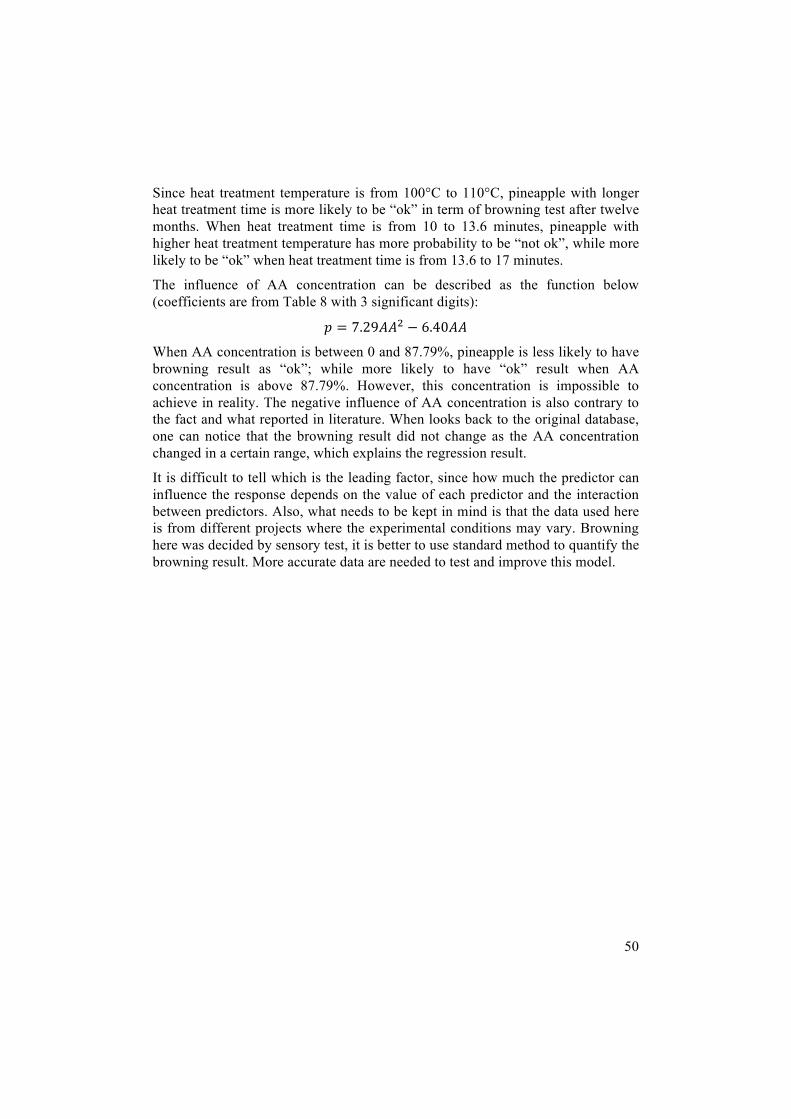
As shown in Table 8, all the predictors listed are quite statistically significant at the significance level of 0.05. When the coefficient is negative (such as the one for S Tem), it means ‘not ok’ is more likely to happen as the predictor increases. When the coefficient is positive, it suggests higher probability of the response ‘ok’ as the predictor increases.
Table 8. Logistic regression table
Heat Tem: Heat treatment temperature; Heat time: heat treatment time AA: AA concentration; S Tem: storage temperature
The influence of heat treatment temperature, heat treatment time on the probability of browning can be described as the function below (coefficients are from Table 8 with 3 significant digits):
𝑞 = −0.827𝐻𝑒𝑎𝑡𝑇𝑒𝑚 + 0.0607𝐻𝑒𝑎𝑡𝑇𝑒𝑚×𝐻𝑒𝑎𝑡𝑡𝑖𝑚𝑒 − 6.03𝐻𝑒𝑎𝑡𝑡𝑖𝑚𝑒
𝑞 = −0.827𝐻𝑒𝑎𝑡𝑇𝑒𝑚 + 0.0607𝐻𝑒𝑎𝑡𝑡𝑖𝑚𝑒× 𝐻𝑒𝑎𝑡𝑇𝑒𝑚 − 99.3
𝑞 = −6.03𝐻𝑒𝑎𝑡𝑡𝑖𝑚𝑒 + 0.0607𝐻𝑒𝑎𝑡𝑇𝑒𝑚×(𝐻𝑒𝑎𝑡𝑡𝑖𝑚𝑒 − 13.6)
50
Since heat treatment temperature is from 100°C to 110°C, pineapple with longer heat treatment time is more likely to be “ok” in term of browning test after twelve months. When heat treatment time is from 10 to 13.6 minutes, pineapple with higher heat treatment temperature has more probability to be “not ok”, while more likely to be “ok” when heat treatment time is from 13.6 to 17 minutes.
The influence of AA concentration can be described as the function below (coefficients are from Table 8 with 3 significant digits):
𝑝 = 7.29𝐴𝐴B − 6.40𝐴𝐴
When AA concentration is between 0 and 87.79%, pineapple is less likely to have browning result as “ok”; while more likely to have “ok” result when AA concentration is above 87.79%. However, this concentration is impossible to achieve in reality. The negative influence of AA concentration is also contrary to the fact and what reported in literature. When looks back to the original database, one can notice that the browning result did not change as the AA concentration changed in a certain range, which explains the regression result.
It is difficult to tell which is the leading factor, since how much the predictor can influence the response depends on the value of each predictor and the interaction between predictors. Also, what needs to be kept in mind is that the data used here is from different projects where the experimental conditions may vary. Browning here was decided by sensory test, it is better to use standard method to quantify the browning result. More accurate data are needed to test and improve this model.
51
5 Conclusions and Future research
5.1 Conclusions
Regarding the effect of headspace volume and package volume, the degradation of AA is faster in large package, it will take 330 days when all AA is degraded in large package which is 20 days less than in the small package. At the same time, there is no big difference about how the total oxygen concentration changes along the storage time, both have a fast decreasing followed by an equilibrium at a very low value. All three types of oxygen: dissolved oxygen, oxygen in headspace, oxygen permeated through package, which are decided by headspace volume and package volume, have significant influence on AA degradation. However, when same amount of AA is degraded, less amount of oxygen will be lost in large package, implying more anaerobic degradation of AA happen at bottom of large package.
For browning reaction, the a value turned out to be a good indicator by using the tricolor metric system measurement. Based on the results of pineapple products stored at 30°C, the a value -3 is the threshold of the slight browning. When the a value exceeds -3, slight browning was observed in the pineapple product. As for the correlation of AA degradation and browning, the AA concentration is below 460 ppm when the a value is above -3. Thus, the AA concentration might be a predictor of browning. Further validation needs to be seen in the products of high AA concentration. If the pineapple also turns to be slight brown when the AA concentration is below 460 ppm or another concentration in the products of high AA concentration, AA concentration can be used as a predictor of browning.
According to the stepwise regression results, AA (between 500 ppm and 2000 ppm) has a positive effect to extend the shelf life, which goes well with the theory. For a certain blanching temperature, lower heat treatment temperature (between 102°C and 106°C) and longer heat treatment time (between 6 minutes and 16 minutes) can contribute to longer shelf life. As for blanching temperature (between 23°C and 62°C), higher blanching temperature leads to shorter shelf life. Ordinal logistic regression shows longer heat treatment time (10-17 min) can contribute to longer shelf life when heat treatment temperature is 100-110°C, which is the same as the stepwise regression result. When heat treatment time is 10-13.6 min, pineapple with higher heat treatment temperature (100-110°C) is more likely to be “not ok” as the result of browning test, while more likely to be “ok” when heat
52
treatment time is 13.6-17 min. The effect of AA depends on the concentration, but there is no literature to support the negative effect of low AA concentration (0-87.79%). To improve the model and get more reliable regression results, more sets of data for shelf life are needed. Instead of using visual manual inspection, standard measurement inspection needs to be implemented.
5.2 Future research
Based on this study, more anaerobic degradation of AA is noticed in TRC 390. This could also be applied to larger packages in TRC, such as TRC 440 and 500 mL, but further validation is needed. For future research, it is also interesting to investigate the degradation difference of different AA concentration. There might be more anaerobic degradation in the package with high AA concentration due to the ratio of AA and oxygen concentration. These can give suggestions about how much AA is needed to reach certain shelf life in different packages.
Based on the results from browning part, there are two interesting related research fields. First one is about the AA degradation during retort process. The results showed that around 35% AA degraded in the high AA concentration product and 15% AA degraded in the low AA concentration product. It can be interesting to find out the relationship between AA concentration and AA degradation during retort process. This knowledge is quite important when it comes to how much AA needs to be added into the product before retort process.
The other interesting field is about the AA degradation pathways during storage. The results showed that more oxygen consumed in low AA concentration product while more AA degraded in high AA concentration product during storage. It can be interesting to find out the relationship between AA concentration and AA degradation pathways during storage.
For future researches which goal would be to study the predictors of shelf life in processed fruit products, it would be advised to study some other indicators, such as the non-enzymatic browning index and the HMF content, to see if there is better correlation with browning reaction comparing with AA concentration.
It would be interesting to find out the leading factors during processing and storage on the shelf life of commercial fruit product, which can be applied to different kinds of fruit. But more variances of AA concentration, heat treatment time and temperature, diversity of fruit, quantitative browning result are expected in the database. Thus, the regression model to predict shelf life can be improved and more accurate leading factors might be found.
53
References
Alamprese, C., Cappa, C., Ratti, S., Limbo, S., Signorelli, M., Fessas, D., & Lucisano, M. (2017). Shelf life extension of whole-wheat breadsticks: Formulation and packaging strategies. Food chemistry, 230, 532-539.
Ayhan, Z., Yeom, H. W., Zhang, Q. H., & Min, D. B. (2001). Flavor, color, and vitamin C retention of pulsed electric field processed orange juice in different packaging materials. Journal of Agricultural and Food Chemistry, 49(2), 669-674.
Braverman, J.B.S., (1963). Introduction to the Biochemistry of Foods. Elsevier, Amsterdam.
Brown, M. (2011). Processing and food and beverage shelf life. In Food and beverage stability and shelf life, 184-243.
Buettner, G. R. (1988). In the absence of catalytic metals ascorbate does not autoxidize at pH 7: ascorbate as a test for catalytic metals. Journal of biochemical and biophysical methods, 16(1), 27-40.
Burdurlu, H. S., Koca, N., & Karadeniz, F. (2006). Degradation of vitamin C in citrus juice concentrates during storage. Journal of Food Engineering, 74(2), 211-216.
Campos, F. M., Ribeiro, S. M. R., Della Lucia, C. M., Pinheiro-Sant'Ana, H. M., & Stringheta, P. C. (2009). Optimization of methodology to analyze ascorbic and dehydroascorbic acid in vegetables. Química Nova, 32(1), 87-91.
Chutintrasri, B., Noomhorm, A., (2006). Thermal inactivation of poly- phenoloxidase in pineapple puree. LWT e Food Sci. Technol 39, 492-495.
Damodaran, S., & Parkin, K. L. (2017). Fennema’s food chemistry. CRC press.
De Man, J.M., (1980). Nonenzymatic browning. Principles of Food Chemistry, pp.98-112.
Dhuique-Mayer, C., Tbatou, M., Carail, M., Caris-Veyrat, C., Dornier, M., & Amiot, M. J. (2007). Thermal degradation of antioxidant micronutrients in citrus juice: kinetics and newly formed compounds. Journal of Agricultural and Food Chemistry, 55(10), 4209-4216.
Eskin, N. and Shahidi, F. (2012). Biochemistry of Foods. 3rd ed. Burlington: Elsevier Science, p.246.
54
Eskin, N. and Shahidi, F. (2012). Biochemistry of Foods. 3rd ed. Burlington: Elsevier Science, pp.387-391.
Espín, J.C.; García-Ruiz, P.A.; Tudela, J. Varón, R.; García-Cánovas, F. (1998) Monophenolase and diphenolase reaction mechanisms of apple and pear polyphenol oxidases. J. Agric. Food Chem. 46, 2968–2975.
FAO, IFAD, UNICEF, WFP, & WHO. (2017). The state of food security and nutrition in the world 2017: Building resilience for peace and food security. FAO, Rome.
Handwerk, R. L., & Coleman, R. L. (1988). Approaches to the citrus browning problem. A review. Journal of agricultural and food chemistry, 36(1), 231-236.
Heldman, D.R., Lund, D.B. and Sabliov, C. eds., (2006). Handbook of food engineering. CRC press, chapter 13.
Hiranvarachat, B., Devahastin, S., Chiewchan, N., (2011). Effects of acid pretreatments on some physicochemical properties of carrot undergoing hot air drying. Food Bioprod. Process. 89, 116-127.
IFST (1993). Shelf Life of Foods – Guidelines for its Determination and Prediction. IFST, London.
Jesse F. Gregory III. (1997). Vitamins. In Food Chemistry. 531-616.
Joslyn, M. A., & Supplee, H. (1949). Solubility of oxygen in solutions of various sugars. Food Research, 14(3), 209–215.
Kacem, B., Cornell, J. A., Marshall, M. R., Shireman, R. B., & Matthews, R. F. (1987). Nonenzymatic browning in aseptically packaged orange drinks: effect of ascorbic acid, amino acids and oxygen. Journal of Food Science, 52(6), 1668-1672.
Kennedy, J. F., Rivera, Z. S., Lloyd, L. L., Warner, F. P., & Jumel, K. (1992). L-Ascorbic acid stability in aseptically processed orange juice in TetraBrik cartons and the effect of oxygen. Food Chemistry, 45(5), 327-331.
Khan, M. T., & Martell, A. E. (1967). Metal ion and metal chelate catalyzed oxidation of ascorbic acid by molecular oxygen. I. Cupric and ferric ion catalyzed oxidation. Journal of the American Chemical Society, 89(16), 4176-4185.
Kong, F., & Singh, R. P. (2009). Process-Induced Food Toxicants: Occurrence, Formation, Mitigation, and Health Risks. Emerging food technologies, 621-643.
Lee, H. S., & Coates, G. A. (1999). Vitamin C in frozen, fresh squeezed, unpasteurized, polyethylene-bottled orange juice: A storage study. Food Chemistry, 65, 165–168.
Guerrero-Beltra ́ n, J.A., Swanson, B.G., Barbosa-Ca ́ novas, G.V.,(2005). Inhibition of polyphenoloxidase in mango puree with 4-hexylresorcinol, cysteine and ascorbic acid. LWT e Food Sci. Technol 38, 625-630.
55
Manfredi, M., Fantin, V., Vignali, G., & Gavara, R. (2015). Environmental assessment of antimicrobial coatings for packaged fresh milk. Journal of Cleaner Production, 95, 291-300.
Mohr, D. H. (1980). Oxygen mass-transfer effects on the degradation of vitamin-C in foods. Journal of Food Science, 45(5), 1432–1433.
Muneta, P., (1977). Enzymatic blackening in potatoes: influence of pH on dopachrome oxidation. Am. Potato Journal, 54, 387-393.
Nicoli, M. C. (2012). The shelf life assessment process. Shelf life assessment of food, 17.
Nkhili, E., & Brat, P. (2011). Reexamination of the ORAC assay: effect of metal ions. Analytical and bioanalytical chemistry, 400(5), 1451.
Queiroz, C., Mendes Lopes, M. L., Fialho, E., & Valente-Mesquita, V. L. (2008). Polyphenol oxidase: characteristics and mechanisms of browning control. Food reviews international, 24(4), 361-375.
Ranganna, S., (1986). Handbook of analysis and quality control for fruit and vegetable products. Tata McGraw-Hill Education.
Rathje, W.L., Reilly, M.D. and Hughes, W.W., (1985). Household Garbage and the Role of Packaging: The United States/Mexico City Household Refuse Comparison. Solid Waste Council of the Paper Industry.
Regulation (EU) No 1169/2011 of the European Parliament and of the council of 25 October 2011. (2011). the European Parliament and the Council.
Remini, H., Mertz, C., Belbahi, A., Achir, N., Dornier, M., & Madani, K. (2015). Degradation kinetic modelling of ascorbic acid and colour intensity in pasteurised blood orange juice during storage. Food chemistry, 173, 665-673.
Righetto, A. M., & Netto, F. M. (2006). Vitamin C stability in encapsulated green West Indian cherry juice and in encapsulated synthetic ascorbic acid. Journal of the Science of Food and Agriculture, 86(8), 1202-1208.
Robertson, G. L. (2011). Packaging and food and beverage shelf life. In Food and beverage stability and shelf life. 244-272.
Robertson, G. L., & Samaniego, C. M. L. (1986). Effect of initial dissolved oxygen levels on the degradation of ascorbic acid and the browning of lemon juice during storage. Journal of Food Science, 51(1), 184-187.
Sakač, M., Pestorić, M., Mandić, A., Mišan, A., Nedeljković, N., Jambrec, D., ... & Sedej, I. (2016). Shelf-life prediction of gluten-free rice-buckwheat cookies. Journal of Cereal Science, 69, 336-343.
56
Schoefs, B. (2002). Chlorophyll and carotenoid analysis in food products. Properties of the pigments and methods of analysis. Trends in food science & technology, 13(11), 361-371.
Singh, R. P., & Anderson, B. A. (2004). The major types of food spoilage: an overview. Understanding and Measuring the Shelf-life of Food, 3-23.
Subramaniam, P., & Wareing, P. (Eds.). (2016). The stability and shelf life of food. Woodhead Publishing.
Tawakkal, I. S., Cran, M. J., Miltz, J., & Bigger, S. W. (2014). A Review of Poly (Lactic Acid) Based Materials for Antimicrobial Packaging. Journal of food science, 79(8).
Van Bree, I., Baetens, J. M., Samapundo, S., Devlieghere, F., Laleman, R., Vandekinderen, I., & De Meulenaer, B. (2012). Modelling the degradation kinetics of vitamin C in fruit juice in relation to the initial headspace oxygen concentration. Food Chemistry, 134(1), 207-214.
Verbeyst, L., Bogaerts, R., Van der Plancken, I., Hendrickx, M. and Van Loey, A., (2013). Modelling of vitamin C degradation during thermal and high-pressure treatments of red fruit. Food and Bioprocess Technology, 6(4), pp.1015-1023.
World Health Organization. (2016). What is malnutrition?. [online] Available at: http://www.who.int/features/qa/malnutrition/en/ [Accessed 22 May 2018].
WRAP (2008). The Food We Waste. WRAP, Banbury.
Yildirim, S., Röcker, B., Pettersen, M. K., Nilsen- Nygaard, J., Ayhan, Z., Rutkaite, R., & Coma, V. (2018). Active Packaging Applications for Food. Comprehensive Reviews in Food Science and Food Safety, 17(1), 165-199.
Yoovidhya, T., Siriwattanayothin, S. and Chiewchan, N. (n.d.). Effects of Pretreatment and Thermal Process on Quality of Pineapple in Light Syrup. Bangkok: Department of Food Engineering, King Mongkut’s University of Technology Thonburi.
Ziena, H. M. S. (2000). Quality attributes of Bearss Seedless lime (Citrus latifolia Tan) juice during storage. Food chemistry, 71(2), 167-172.