Embed Size (px)
Citation preview

Critical Issues: Leading the RtI Process in Georgia
NEGARESADecember 3, 2008
John E. McCook, [email protected]
865-693-5884Copyright© 2008 John E. McCook

2
What Are the Areas of Concern?
• Commitment by ALL• CAPACITY must be built before Implementation• Universal Screening• Support Team Functioning• Progress Monitoring• Multi- Tiered Process with Increasing Intensity
and Frequency• FIDELITY

The Five Phases of Implementation
• Awareness• Commitment• Capacity• Implementation• Evaluation
3

4
Essential Components of RTI1. Universal screening
2. Multiple tiers of intervention
3. Progress monitoring
4. Problem-solving or standard protocol approach
5. Integrated data collection/assessment system
6. Scientific, research-based interventions
7. Fidelity

5
Awareness: The WHY
• Why change from what we have been doing for 30+ years?
• General educator’s response: It has worked for me
• Failure of discrepancy model• Carrot or Stick Approach

6
Why Change
• What we are doing hasn’t worked– Over identification– Disproportionality– Ineffective

7
Carrot
• Scores increase• Children provided interventions much earlier• Ineffectiveness of special education
– Caseload– Expectations– Delay
• Human resource effective – 30 minutes of intervention in K takes 2 hours per
day in fourth grade (National Institutes of Health study, 1999)

8
Stick Approach
• IDEA ‘04 language• NCLB• Pay me now or pay me later
– Scores down– NAEP standards– Global economy
• China graduates 300,000 scientists and engineers• US graduates 30,000 with 21,000 being foreign
students and they are not staying– Restructuring

9
Commitment by ALL• Realization that this is NOT a special education
issue• RTI is for ALL • Lead or be lead
– Two data paragraphs IDEA requires before or as part of referral
– Responsibility of special education teams (case study, ARC, ARDs etc) to send back referral if no data
• Move to SHOW ME, don’t Tell Me • Common vocabulary

10
Commitment by ALL
• Agreement on readiness• Staff agree to implement the model• Commitment built through:
• Understanding Need• Understanding Model• Mutual Outcomes• Development of Expertise

National Literacy Crisis
Below Basic Basic Proficient/Advanced
42%
29% 29%
8th Grade Students (2005)
(Source: National Center for Education Statistics)
Reading Math
32%29%
39%

10–(5+3)= ?
Sample Question

Guinevere went into Saul’s Bakery and spent five dollars to buy 3 packages of dinner rolls. She then went next door to the SuperShop Store and bought a container of milk for three dollars. How much money will she have left if she started with $10?
Actual State Test Example
As a Word Problem

Reading and Math: Whole Brain Learning
AuralAssociation
Number Sense
Number Recognition
WordMeaning
LetterIdentification
(D-O-G)
SoundRecognition

Unique Approach: Automaticity
Example: Read the following paragraph once to yourself, counting the number of “f”s you see:
“A large number of books I have read forged an
impression upon me that has remained to this
day. I will never forget how one book mixed fact
and fiction in recounting stories of the days when
dinosaurs roamed the earth. It was a colorful
history of where dinosaurs came from and how
they evolved. I will never forget some of the
lessons from this book.”

Reading Fluency
12
“A large number of books I have read forged an
impression upon me that has remained to this
day. I will never forget how one book mixed fact
and fiction in recounting stories of the days when
dinosaurs roamed the earth. It was a colorful
history of where dinosaurs came from and how
they evolved. I will never forget some of the
lessons from this book.”

Neuroscience: Cognitive Processing
Real-time fMRI scans of the same subject: (left) heavy processing load during early skill acquisition; (right) light load when skill is “automatized”
Moderate
Heavy
Peak
Source: San Diego State University

18
Capacity or Building Infrastructure• Common understanding of issues• Agree to redefine support team process
– Belief system– Structure– Purpose– Leadership
• Determine where you want to be in:– 6 months– 1 year– 3 years – 5 years

19
Capacity or Building Infrastructure
• What do we have NOW• What do we need to get there in (time
periods)• What do we need to do to build the road prior
to traveling the road

20
Capacity or Building Infrastructure
• Resource Needs– Staff– Materials– Time– Support– Training
• What are we willing to do when resistance occurs — or, how committed are we?

21
Steps to Capacity
• Support team process• Universal screening• Data drives decisions- move from tell me what
you’ve done system to SHOW ME• Getting the data• Using the data with all staff and all staff using
the data for decision making

22
Steps to Capacity
• The data define the problems• What are we going to do about it?• Determine model — protocol, problem-
solving or combination• Start redefining roles
– Job security issues– New rules-new roles
– Where do “I” fit in?

23
Steps to Capacity
• What are we going to do about the problems• Which problem do we address and in what
order– Determination of curricular, instructional or
student issues– Determination of data based norms
• District norms used?• School norms used?

24
Steps to Capacity: State- and District-Level Implementation Issues
That Must Be Addressed• Number of tiers of intervention• Duration of interventions at each tier• Criteria for entering/exiting tiers (rubric)• Criteria for sufficient/insufficient progress
(defined by state or team)• Method of universal screening and progress
monitoring• Paperwork required for documentation• Eligibility criteria for LD

25
Building-Level Implementation Issues to Be Decided
• Scheduling of Intervention Time– What do I come out of to get intervention?
• Scheduling Meeting Times– Regularly scheduled meetings or at need?
• Scheduling Progress Monitoring

26
Building-Level Implementation Issues to Be Decided
• Personnel to Conduct Interventions– Who is going to do the interventions?
• Communication with Parents– When, what, how
• Dealing with Resistance– Prepare for the enemy, he is within

27
Arriving at Capacity’s Door• Once the previous issues have been addressed
and achieved, then we have built the road to a point where we can start the journey to RTI Land
• It is extremely hard to fly the plane and build it at the same time

28
Support Team Process
• Paradigm shift• Why do we have support team process?• What is it’s purpose?• What is it’s effectiveness?• Who is a member of the support team?• Who leads the support team?• How often do we meet?

29
Support Teams Under Discrepancy
• What was purpose of support team– Altruistic answer was to help kids succeed– Real-life answer was that’s how you got a kid to
special education

30
Parent refers Support Team Teacher refers
Referral to Special Education
How did support team receive child?

31
Support Team Under RTI
• Purpose is to keep child in general education classroom
• Provide interventions and measure progress in general education
• Results in buy-in from general education teacher

32
How Does Child’s Situation Get to Support Team Under RTI?
Data Brings Child’s Needs to Attention of Support Team Through Benchmarks
Support Team Process
Parent Referral Teacher Referral
Vast Majority get done this way
Few come from teachersSome come from parents

33
Why the Change in Referrals?
• Universal screening data (benchmarks) identify children in need of intervention
• Teacher supports process through classroom data
• If parent referral, then parent provides information through parent referral form
34
Support Team Members
• Core team• Supplemental members• Who leads?
– Message is critical
• Types of roles important

35
Universal Screening
• Curriculum-Based Measurement (CBM) is the recommended tool to identify students who are at-risk (have low academic skills) and require interventions
• CBM is a technically sound and thoroughly researched progress monitoring system

36
Universal Screening• CBM:
– Is a standardized test– Is given to everyone– Measures critical skills– Is brief– Can be repeated frequently– Is inexpensive and easy to administer and score– Provides data to assist with decision making at the
individual student, class, school or district level– Tells us which students are “at-risk” and need
supplemental instruction/intervention
37
Universal Screening• Development of “benchmark” data norms
– Classroom– Grade level– School– District
• Benchmark data taken three times per year– Fall– Winter– Spring
38
Universal Screening
• Data from benchmarks must be available to teachers, principals and district staff and shared with parents
• Data must be “user friendly” in format

39
Example of Benchmark Data

40
Not Good! Look at the dropIn the spring!!!

41
One of “our” students—Lookat his progress!!!

42

43

44

45
Where’s the Data?
• Look at what you have – User friendly?– Quick?– Ability to track over long haul?– Ability to drill down to student and up to district
or national?
• If yes, then you have tools• If no, then you need tools

46
Typically CBM Data Probes
When using CBM, the examiner gives the student brief, timed samples, or "probes," made up of academic material taken from the expected skills for the particular grade level.

47
How are probes given and scored?
• CBM probes are given individually or in groups (depending on the probe), under standardized conditions, are timed and typically last from 1 to 6 minutes, depending on the skills being measured. The child's performance on a CBM probe is scored for speed, or fluency , and for accuracy of performance.

48
Reading R-CBM
This student read 72 WRC/8 Errors
What do probes look like?

49
Reading Comprehension Maze
15 correct with 1 error

50
CBM Used for Universal Screening
• Given to everyone • Tells us which students are “at-risk” and need
supplemental instruction/intervention —becomes a referral source in addition to teachers and parents
• Crucial to the RTI process — provides data to assist with decision making at the individual student, class, school or district level
• Tool should be a general outcome measure

51
Math
Computation

52
Math Concepts and Applications

53
What CBM Is and Is Not• CBM is considered a general outcome measure• CBM is designed to function as an “indicator”
of academic skills• It is NOT intended to represent all skills
associated with a particular domain such as reading
• CBM serves as an academic thermometer • CBM probes are considered formative
assessment tools that can be used to inform instruction

54
Summative vs. Formative Assessment
• Summative assessment occurs after instruction
• Example: “High Stakes” testing• Conducted infrequently• Does not provide teachers with ongoing
assessment data• Answers the question, “Did the students
learn?”

55
Summative vs. Formative Assessment
• Formative assessment occurs during instruction
• Example: CBM probes• Conducted frequently• Provides teachers with immediate feedback
on student performance• Answers the question, “Are the students
learning?”

56
CBM — Formative Assessment
• Dynamic—measures are designed to be sensitive to short-term effects of instructional interventions
• Measures fluency, which is more sensitive to change than accuracy
• As a result, CBM probes are useful for progress monitoring

57
Advantages of CBM
• Provides frequent “checks” of achievement over time
• Indicates student growth over time and across academic years
• Assists teachers in making decisions about instruction or grouping
• Can be used to document need for special education consideration

58
Classroom Comparisons• By comparing a student’s performance to his or
her classmates, we are able to identify the lowest 10 percent of the class.
• We are also able to determine whether the low achievement is specific to the student or whether it is a classroom issue. If the majority of the class is low-performing, that would indicate the need for a classroom intervention rather than a specific intervention with a student.

59
School Comparisons
• By using school norms, we are able to see how any individual student compares to other grade-level peers within that particular school.
• For schools with lower average achievement levels, school comparisons allow us to see how a student compares to others in the same school environment.

60
District Comparisons
• District comparisons allow a global comparison of any individual student that shows how that student is performing relative to other grade-level peers within the county.

61
Screening for RTI• Students below the 10th percentile are
identified as “at-risk” using CBM benchmark data.
• Once a student begins the RTI process, CBM data are used to monitor progress weekly to gauge student response to the intervention.
• Growth rates from progress monitoring are compared to the minimally average (25th percentile) growth rate for a student at that grade level using district norms.

62
75th
25th
10th
90th
Interpreting CBM scores
Box and Whisker Charts

63
Progress Monitoring• Formative • Uses a variety of data collection methods• Examines student performance frequently
over time, to evaluate response to intervention in making data-based decisions
• On-going, systematic process for gathering data– Academic – Social– Behavioral
64
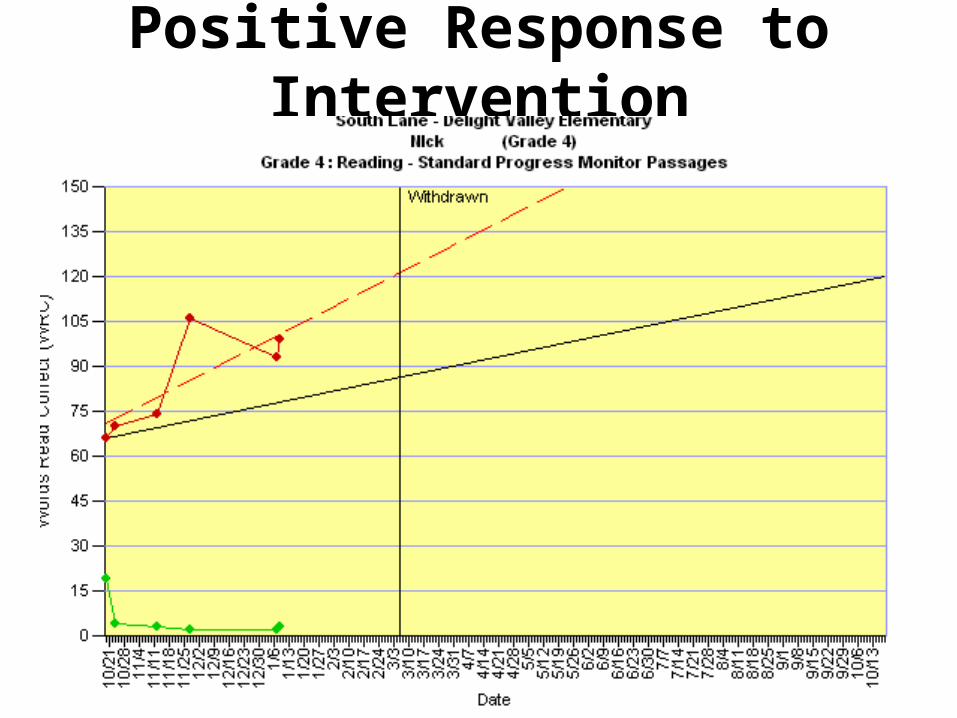
Positive Response to Intervention

65
Not Responding to First Intervention

66
Better Response to Intervention

67
Interpreting Progress

68

69

70
Interpreting CBM
• What is an appropriate achievement level?– at-risk range may be defined differently in different
districts• What is appropriate growth?
– Adequate improvement may be defined differently in different districts

71
Fall Winter Spring
Grade %ile Num WRC Num WRC Num WRC ROI
1
90
48 / 2857
50 / 60
52 / 2856
97 / 96
49 / 2872
128 / 119 2.2 / 1.6
75 22 / 27 56 / 64 94 / 91 2.0 / 1.8
50 11 / 10 35 / 33 73 / 61 1.7 / 1.4
25 4 / 4 21 / 18 43 / 34 1.1 / 0.8
10 2 / 1 14 / 9 26 / 17 0.7 / 0.4
Mean 21 / 21 45 / 44 72 / 66 1.4 / 1.3
StdDev 27 / 28 34 / 36 36 / 40 0.3 / 0.3
2
90
48 / 2724
120 / 117
50 / 2729
133 / 139
52 / 2727
154 / 151 0.9 / 0.9
75 97 / 91 114 / 114 135 / 128 1.1 / 1.0
50 78 / 67 93 / 88 108 / 101 0.8 / 0.9
25 36 / 40 47 / 64 70 / 75 0.9 / 1.0
10 11 / 18 18 / 36 30 / 51 0.5 / 0.9
Mean 71 / 68 85 / 89 101 / 101 0.8 / 0.9
StdDev 44 / 37 45 / 38 49 / 44 0.1 / 0.2
Reading - Curriculum Based MeasurementBearden Elementary 2005-2006 School Year/Knox County Schools

72
3
90
41 / 2685
170 / 140
41 / 2703
182 / 156
41 / 2719
192 / 168 0.6 / 0.8
75 138 / 114 159 / 135 156 / 146 0.5 / 0.9
50 102 / 88 119 / 106 131 / 120 0.8 / 0.9
25 64 / 60 87 / 82 102 / 91 1.1 / 0.9
10 46 / 37 59 / 51 80 / 60 0.9 / 0.6
Mean 104 / 88 120 / 106 131 / 118 0.8 / 0.8
StdDev 50 / 39 45 / 40 45 / 41 -0.1 / 0.1
4
90
51 / 2700
189 / 158
50 / 2688
198 / 177
49 / 2672
211 / 188 0.6 / 0.8
75 144 / 135 153 / 151 172 / 164 0.8 / 0.8
50 109 / 108 123 / 123 139 / 133 0.8 / 0.7
25 92 / 85 99 / 99 110 / 107 0.5 / 0.6
10 66 / 59 78 / 74 89 / 82 0.6 / 0.6
Mean 120 / 109 130 / 124 144 / 134 0.7 / 0.7
StdDev 49 / 39 49 / 41 51 / 42 0.1 / 0.1
5
90
46 / 2666
181 / 174
44 / 2679
188 / 188
42 / 2675
206 / 200 0.7 / 0.7
75 150 / 152 175 / 166 186 / 177 1.0 / 0.7
50 136 / 123 148 / 138 162 / 150 0.7 / 0.8
25 110 / 96 121 / 110 133 / 119 0.6 / 0.6
10 76 / 74 88 / 83 87 / 91 0.3 / 0.5
Mean 128 / 123 143 / 137 156 / 147 0.8 / 0.7
StdDev 40 / 40 41 / 41 42 / 43 0.1 / 0.1

73
What’s a Good Response to an Intervention?• Good Response
– Gap is closing– Can extrapolate a point at which target student
will “catch-up” to peers—even if this is a long-range target
• Questionable Response– Rate at which gap is widening slows considerably,
but gap is still widening– Gap stops widening but closure does not occur
• Poor Response– Gap continues to widen with no change in rate

74
Academic Systems Behavioral Systems
1-5% 1-5%
5-10% 5-10%
80-90% 80-90%
Intensive, Individual Interventions•Individual Students•Assessment-based•High Intensity
Intensive, Individual Interventions•Individual Students•Assessment-based•Intense, durable procedures
Targeted Group Interventions•Some students (at-risk)•High efficiency•Rapid response
Targeted Group Interventions•Some students (at-risk)•High efficiency•Rapid response
Universal Interventions•All students•Preventive, proactive
Universal Interventions•All settings, all students•Preventive, proactive
Theoretical Foundation


76
What Is the Three-Tier Model?
• A systematic approach for providing student interventions
• Identifies struggling students BEFORE they fall behind
• Provides struggling students with support throughout the educational process

77
Three-Tier Model
The Three-Tier Reading Model incorporates flexible grouping practices to group and regroup students based on their progress, interests and changing needs.

78
Tier I InterventionFocus For all students
Program Scientifically Based Curricula
Grouping Multiple grouping formats to meet student needs
Time 90 minutes per day or more in reading. A minimum of 50-60 minutes per day in math
Assessment Benchmark assessment at beginning, middle, and end of the academic year—we require weekly progress monitoring for 6-8 weeks prior to Tier II implementation
Interventionist General education teacher
Setting General education classroom

79
Tier II: Supplemental InstructionFocus For students identified with marked difficulties, and
who have not responded to Tier I efforts
Program Programs, strategies, and procedures designed and employed to supplement, enhance, and support Tier I
Grouping Homogeneous small group instruction (1:3, 1:4, or 1:5) Middle and high school based on adult: student ratio
Time Minimum of 30 minutes per day minimum 3 x per week in small group in addition to core instruction-we require 40 sessions of 30 minutes each within 60 school days for elementary—moves to semester for middle/high
Assessment Progress monitoring weekly on target skill to ensure adequate progress and learning (preferably 2x weekly)
Interventionist Personnel determined by the school
Setting Appropriate setting designated by the school; may be within or outside of the classroom

80
Tier IIIFocus For students identified with marked difficulties, and
who have not responded to Tier I or Tier II efforts
Program Sustained, intensive scientifically based interventions
Grouping Homogeneous small group instruction (1:1, 1:2, or 1:3) in elementary. Middle/high based upon adult: student ratio
Time Minimum of two 30 minutes per day in small group or individually in addition to core instruction elementary 45 sessions defined as 60 minutes total per day in 60 school days
Assessment Progress monitoring twice a week or at a minimum weekly on target skill to ensure adequate progress and learning
Interventionist Personnel determined by the school
Setting Appropriate setting designated by the school; may be within or outside of the classroom

Tier 1 Non-negotiables
Tier 1 STANDARDS-BASED CLASSROOM LEARNING:• All students participate in general education learning that
includes: – Universal screenings to target groups in need of specific instructional
support. – Implementation of the Georgia Performance Standards (GPS) through
a standards based classroom structure. – Differentiation of instruction including fluid, flexible grouping, multiple
means of learning, and demonstration of learning.– Progress monitoring of learning through multiple formative
assessments.
Georgia DOE RTI presentation Nov 2008

Tier 2 Non-negotiables
NEEDS-BASED LEARNING:• In addition to Tier 1, targeted students participate in
learning that is different by including:– Standard intervention protocol process for identifying and
providing research based interventions based on need and resources.
– On-going progress monitoring to measure student response to intervention and guide decision-making.
Georgia DOE RTI presentation Nov 2008

Tier 3 Non-negotiables
SST-DRIVEN LEARNING:• In addition to Tier 1 and Tier 2, targeted students
participate in learning that is different by including:– Intensive, formalized problem solving to identify individual
student needs.– Targeted research based interventions tailored to
individual needs.– Frequent progress monitoring and analysis of student
response to intervention(s).
Georgia DOE RTI presentation Nov 2008

Tier 4 Non-negotiables
Georgia DOE RTI presentation Nov 2008

85
Tier I is Critical!!!
• Scientifically based curriculum delivered with FIDELITY
• Continues during Tier II• Continues during Tier III• Better Tier I is, the fewer children will become
Tier II or Tier III

86
Tier II
• Elementary– Minimum of 30 minutes of SUPPLEMENTAL
scientifically based research intervention per day at least three days per week
– Tier I continues• Middle/High
– Minimum of a period of scientifically based intervention per day
– Middle• Usually occurs during “elective-exploratory periods”
– High• Usually a scheduled “class period” staffed richly

87
Tier II ImplementationTier I Classroom
• Teacher provides scientifically based research curriculum
• Teacher provides additional help to struggling students
• Teacher takes data through classroom activities and progress monitoring for “at-risk” students prior to going to Tier II—after going to Tier II, PM done at Tier II
Tier II Intervention
• Scientifically researched intervention provided in ADDITION to classroom
• Progress monitoring occurs at least weekly and preferably twice per week

88
Tier III Implementation
Tier I Classroom• Teacher provides
scientifically based research curriculum
• Teacher provides additional help to struggling students
• Teacher takes data through classroom activities and progress monitoring for “at-risk” students prior to going to Tier II—after going to Tier III, PM done at Tier III
Tier III• Tier II is deleted• At least two 30 minute
interventions for a targeted student per day for at least 45 days within 60 school days
• Progress monitoring is twice per week

89
The RTI ProcessTier I
Core Curriculum6-8 Weeks Progress monitoring
Weekly Progress Monitoring
Tier IISupplemental9-15 Weeks
Tier IIISupplemental9-15 Weeks
30 Minutes/DayProgress MonitoringTwice per week
Two 30-Minute sessions/DayProgress Monitoring Twice per week
Special Education Consideration or specially designed instruction
through Tier IV GADOE
Comprehensive Multi-faceted Evaluation

90
DATA: What Do I Do?
• Must have an integrated data analysis capacity to be able to keep the data and access the data for short term as well as long term
• Use data for decision making

91
Data• Minimal data usage
– Universal screening-• who needs help• What is rate of increase
– Progress monitoring• Where are we• Is it working• Do I need to make adjustments?
– How many enter Tier I– How many go from Tier I to Tier II– How many go from Tier II to Tier III– How many become eligible for special education?

92
Data
• Predictive usage– What is the minimal cut score at grade X for a
child to be proficient on state testing at grade Y?– How many children enter grade X at grade level
and leave grade X at grade level?
• Longitudinal• Parent information issues

93
Elementary Data
• 12 full RTI schools 2006-2007• 6,254 students in K-5• 464 students went through interventions• 433 students “successful” • 31 students identified as LD in K-5
– .5% versus non-RTI identification rate of 3.2% in same schools
– Average IQ of 94.43 (low of 81, high of 117)

94
High School Data
• In 2006-2007 pilot high• 26 ninth-graders identified
– Three consecutive years of lowest 25% reading on state testing
– Three consecutive years of lowest 25% reading in universal screening
– A full year (270 hours) of intervention with scientifically based program
• All 26 scored proficient and 2 advanced on state testing an end of year

95
Parents: When, Where, What• General education through printed material
prior to child being identified as at risk• At Tier I determination of at risk
– Documentation• Face to face• Phone call• FYI • data

96
Parents: When, Where, What• Tier II-FYI
– Invite to intervention team meeting– Letter– Data sharing
• Tier III-FYI– Invite to intervention team meeting– Letter– Data sharing
• IEP team– Permission to evaluate

97
Resistance
• Prepare for resistance• The enemy is within!!!!

98
LD Students and RTI/Intervention Students R-CBM Growth
0.3
0.530.61 0.58 0.570.62
0.78 0.780.84 0.81
0
0.2
0.4
0.6
0.8
1
1 2 3 4 5
Grade
Rat
e o
f In
crea
se
LD Students
RTI/InterventionStudents
Elementary Students Rate of Growth

99

100
Outcome measure Grade FW S
rReport4218334161,2,332291111trueFarragut IntermediateDisplay

![The McCook Tribune. (McCook, NE) 1901-03-01 [p ].zaess-SSsM'COOK TRIBUNE. 7. M. KIBI3IKIX, PnbllBher-.McCOOK., - - NEBEA8KA BRIEf TELEGRAMS. Florence Carlyle, a grandneice of Thomas](https://img.pdfslide.net/doc/110x75/60e48b043072420843787d65/the-mccook-tribune-mccook-ne-1901-03-01-p-zaess-sssmcook-tribune-7-m.jpg)
![McCook Weekly Tribune. (McCook, NE) 1885-02-12 [p ]. · 2019. 2. 1. · THE TKIBUNE.- F... M. & E. M. KUXBXEIiIi , I'ubn-.McCOOK., ::: JJEB NEWS OF NEBRASKA. * AHBOII DAY THEE PLANTING](https://img.pdfslide.net/doc/110x75/60b0a5f5e15ec915e36c8c9d/mccook-weekly-tribune-mccook-ne-1885-02-12-p-2019-2-1-the-tkibune-.jpg)
![The McCook Tribune. (McCook, NE) 1885-10-08 [p ].€¦ · Hochelorfc lost nearly all his money atthe-Trouville races in France. 100,000,000](https://img.pdfslide.net/doc/110x75/5f06bd3d7e708231d4197dcc/the-mccook-tribune-mccook-ne-1885-10-08-p-hochelorfc-lost-nearly-all-his.jpg)
![The McCook Tribune. (McCook, NE) 1889-04-19 [p ]....Thayor has.issued his pro-clamation-*&. * i"A " organizing Hooker county. Stella dispatch says the town was 111 * muchexcitedthe,](https://img.pdfslide.net/doc/110x75/5e5a5188001ebf1346211216/the-mccook-tribune-mccook-ne-1889-04-19-p-thayor-hasissued-his-pro-clamation-.jpg)

![The McCook Tribune. (McCook, NE) 1890-06-13 [p ]. · 2019-02-06 · H ' THE M'COOK TRIBUNE- B F. Iff. KIMrtlKLIi, Pnbllnhcr-.M. McCOOK, ..N-EB.H. state mewhl- H NEBRASKA MISCELLANEOUS](https://img.pdfslide.net/doc/110x75/5ecca2cea0af283cb576c29d/the-mccook-tribune-mccook-ne-1890-06-13-p-2019-02-06-h-the-mcook-tribune-.jpg)