Embed Size (px)
Citation preview

Complex & Intelligent Systems (2021) 7:367–378https://doi.org/10.1007/s40747-020-00210-y
ORIG INAL ART ICLE
Critical ranking of steam handling unit using integrated cloudmodeland extended PROMETHEE for maintenance purpose
Nitin Panwar1 · Sanjeev Kumar1
Received: 22 June 2020 / Accepted: 26 September 2020 / Published online: 24 October 2020© The Author(s) 2020
AbstractTo determine the critical component in an industry is one of the most important tasks performed by maintenance personnelto choose the best maintenance policy. Therefore, the purpose of the current paper is to develop a methodology based onintegrated cloud model and extended preference ranking organization method for enrichment evaluation (PROMETHEE)method for finding the most critical component of the framework by ranking the failure causes of the system from multipledecision maker perspective. For this purpose, ranking of failure causes is performed by taking into account five factors namelychances of occurrence of failure (F0), non-detection probability (Nd), downtime duration (Dd), spare part criticality (Spc)and safety risk (Sr). In this paper, first the primary and secondary weight of decision makers are calculated based on theuncertainty degree and divergence degree, respectively, to determine overall weight using cloud model theory by convertingthe uncertain linguistic evaluation matrix into interval cloud matrix, and then ranking of the steam handling subunit of papermaking unit in a paper mill using extended PROMETHEE. The effectiveness of the proposed methodology is explained byconsidering steam handling subunit of paper making unit to find the critical component.
Keywords Cloud model · Linguistic · PROMETHEE · Failure mode effect analysis ·Multi-criteria decision making (MCDM)
Introduction
In today’s world as the competition is increasing day byday, it is necessary for industries to meet the order regu-larly and to supply quality items as with time, disintegrationand break down of framework occurs which result in suddenbreakdown of the framework and safety risks. To evade suchcircumstances, it ismust to adopt an appropriatemaintenancepolicy which is imperative with a particular conclusion torepair/reinstate the disintegrated framework before total fail-ure. Kaplan and Garrick [1] measured the risk in terms ofprobability of disappointment event, in this way firms per-form maintenance procedures as a strategy for directing therisks. Grievink et al. [2] detailed that within start-up phase,servicing expenses are expected to be 2–6% of investmentexpenses and Bevilacqua and Braglia [3] stated due to need
B Nitin [email protected]
Sanjeev [email protected]
1 J.C Bose University of Science and Technology, YMCA,Faridabad 121006, India
of maintenance exercises, its cost may expend up to 70% oftotal manufacturing expenses based upon the industry, above15% for heavy process industries [4]. Also doing correc-tive maintenance will diminish the expenditure cost, but mayresult in failure of the machine which ultimately results inexcessive loss to the firm [5]. It causes according to Mooreand Starr [6] inherent misfortunes to the organization due tounsatisfied clients and Zaim et al. [7] augmentation in theproduction cost, shipment delay, benefit reduction, loss offuture growth chances. To overcome these situations, it ismust to adopt an appropriate maintenance strategy [8]. Forthis to achieve, the primary goal is to perform the criticalranking of failure causes of the system so that appropriatemaintenance policy can be adopted.
Literature review
To select a suitable maintenance policy, it is must to performthe failure mode and effect analysis (FMEA) [9] as throughFMEA it is possible to assess and eliminate root causes ofsystem/process failure. It is considered as an obvious tool toperform the criticality analysis for process industry through
123

368 Complex & Intelligent Systems (2021) 7:367–378
Risk Priority Number (RPN) that is defined as a productof probability of failure occurrence, severity and chance ofnon-detection and adopted by Xu et al. [10] in diesel engineturbocharger, Panchal and Kumar [11] in coal handling sys-tem and by many more researchers. The limitation of thetradition FMEA, i.e. considering only three attributes whichare of equal importance, sometimes combination of thesethree factors results in a same RPN but in actual, reality maybe different and ignorance of dependence among the factorsand performed the assessment of risk factors using Demp-ster’s combination rule [12]. Many researchers highlightedthat FMEA is not concerned to individuals but it is a grouporiented task which includes experts of multidisciplinaryfield. This makes the traditional FMEA inappropriate andto overcome these drawbacks, researchers have used numer-ousMulti-Criteria DecisionMaking (MCDM) approaches intheir research work.
Analytic hierarchy process (AHP) as explained by Saaty[13] is an approach where priority weights of the alterna-tives being used to rank the considered alternatives. Variousresearchers applied AHP method for various problems suchas Sachdeva et al. [14] in a process industry, Cascales andLamata [15] for diesel engine cleaning system part selectionmaintenance, Bahadir and Bahadir [16] in textile structureindustry.Hwang andYoon [17] proposedTechnique for orderpreference by similarity to ideal solution (TOPSIS) method.Song et al. [18] performed FMEA to evaluate the risk offailure modes in steam valve system using TOPSIS. Variousresearchers applied TOPSIS technique for various problemssuch as (Sachdeva et al. [19], Zhou and Lu [20]) for riskassessment; in a process industry and of dynamic alliance,respectively. Aktas and Kabak [21], Ahmed et al. [22] usedAHP-TOPSIS to evaluate the location site for solar energyplant, selection of material in the construction industry,respectively. Singh and Singh [23] used fuzzy AHP-TOPSISto find the ranking of alternative routes in multicriteriadecision situation. Chatterjee et al. [24] applied Vlse Kriter-ijumska Optimizacija Kompromisno Resenje (VIKOR) andELimination and Et Choice Translating Reality (ELECTRE)an outranking method for supplier selection. Panwar et al.[25] applied AHP-VIKOR for ranking the various failurecauses in pulping unit. Mohsen and Fereshteh [26] appliedfuzzy VIKOR to rank and prioritize the failure causes ofgeothermal power plant. Preference Ranking OrganizationMethod for Enrichment of Evaluations (PROMETHEE) isan outranking method in multi-criteria analysis [27]. Caval-cante and Almeida [28] used PROMETHEE for preventivemaintenance equipment breakdown. Abdelhadi [29] usedPROMETHEE for maintenance scheduling. Sen et al. [30]applied PROMETHEE II for selection of robot for indus-trial purpose. PROMETHEE method has been widely usedwidely to solve various MCDM problems such as airport
location selection [31], service quality evaluation [32], andemergency response assessment [33].
Lo and Liu [34] proposed a novel approach for FMEA-based risk assessment using best worse method and greyrelation analysis (GRA) in an electronics company. Accord-ing to Li et al. [35], Cloudmodel is an approach incorporatingrandomness with fuzziness. Due to its distinguished capabil-ity of handling uncertainty, various researchers have usedthis approach in various applications. Liu et al. [36] per-formed ranking of failure modes of C-arm of X-ray machineusing combination of cloud model and GRA. Wang et al.[37] solved MCDM problems using cloud model. Zhaoand Li [38] developed a model that integrates cloud com-puting and fuzzy method to perform the risk analysis inpower construction sector. Shi et al. [39] performed anintegrated cloud model and multi-attributive border approxi-mation area comparison method for selecting best healthcarewaste treatment advances by considering three decisionmak-ers.Wang et al. [40] developed an integrated cloudmodel andqualitative flexible multiple criteria method to an auto man-ufacturer industry. Using integrating cloud model theory andPROMETHEE II approach, Liu et al. [41] performed theFMEA of healthcare delivery system by incorporating eightfailure causes and Liu [42] performed FMEA of emergencydepartment. Wang et al. [43] performed robot selection forautomobile industry using cloud TODIM approach. Liu et al.[44] performed risk analysis of scraper arm control systemand Lei et al. [45] performed risk analysis using of metrovehicle by integrating cloud model and TOPSIS approach.Failure causes of a steam valve system is identified usingCloud model and extended TOPSIS [46]. Hu et al. [47]performed risk analysis of health care department by rank-ing the failure causes using cloud model and GRA-TOPSISapproach. Huang et al. [48] performed the risk analysis ofenterprise architecture and information system using proba-bilistic linguistic term sets to handle the intrinsic ambiguityand TODIM approach to rank the failure modes. Li et al.[49] performed risk assessment of CNCmachine using cloudmodel and best–worst method. Liu et al. [50] performed riskranking of identified failure causes in a process industry usingcloud model and extended GRA to overcome the limitationof traditional FMEA. Zhu et al. [51] obtained the risk priorityof failure modes in water gasification system using modifiedPROMETHEE under linguistic neutrosophic context.
With reference to the above literature analysis, effortshave been made to overcome the limitations of traditionalFMEA but still little attention has been paid to the vague-ness and randomness inherent in the group-based FMEAdecision makers. For this reason, we define an integratedapproach based on cloudmodel and extended PROMETHEEin which firstly using cloud model, the failure causes aredefined in terms of linguistic evaluators which are trans-formed into interval cloud matrix and then to group cloud
123

Complex & Intelligent Systems (2021) 7:367–378 369
matrix by taking into account the overall weights of the deci-sion maker. To calculate the overall weights of the decisionmakers, first, primary weights are calculated using uncer-tainty degree and then secondary weights using divergencedegree. By doing this, we can avoid the imprecise subjec-tive assigning of weights to the decision maker. Second, anextended PROMETHEE is used to rank the failure causesusing the concept of net outranking flow calculated based onleaving and entering flow. Finally, the proposed methodol-ogy is applied to rank the failure causes of Steam handlingsubunit to illustrate its effectiveness and also it will allow themaintenance personnel to select the best maintenance policy.
Cloudmodel methodology
According to Li et al. [35], cloud model is a moderncognition demonstrates of vulnerability proposed based onlikelihood hypothesis and fuzzy set hypothesis, which per-mits a stochastic unsettling influence of the membershipdegree encompassing a decided central esteem.
Definition 1: [35, 37]. Given a subjective concept N charac-terized on a universe of talk V , P ⊆ V , let p(p ∈ P) be anarbitrary instantiation of the concept N and FN (P) ∈ [0, 1]be the membership degree of p belonging to F , which corre-sponds to an arbitrary number with steady inclination. Then,the dispersion of the membership over the space is called amembership cloud, or basically, a cloud.
Definition 2: [35, 37]. The characteristics of a cloud z aredelineated by three numerical parameters, specially expec-tation Ep, entropy Sn and hyper entropy Se. Here, Ep isthe middle value of the subjective concept space, Sn mea-sures the uncertainty of the subjective concept, and Se reflectsthe scattering degree of a cloud’s beads and the irregularchanges of the membership. The cloud can be written as z̃ �(Ep, Sn , Se
).
Note that the cloud z̃ �([
Ep , Ep], Sn, Se
)is called
an interval integrated cloud when the anticipated value is an
interval range[Ep, Ep
].
Definition 3: Consider any two interval integrated
clouds z̃1 �([
Ep1 , Ep1], Sn1, Se1
)and z̃2 �
([Ep2 , Ep2
], Sn2, Se2
), then
z̃1 × z̃2 �([
Ep1Ep2, Ep1Ep2],√
(Sn1Ep2)2 + (Sn2Ep1)2,
√(Se1Ep2)2 + (Se2Ep1)2
)(1)
λz̃1 �([
λEp1 , λEp2],√
λSn1,√
λSe1), λ > 0 (2)
z̃λ1 �([
Epλ1 , Epλ
1
],√
λ(Ep1)λ−1Sn1,
√λ(Ep1)
λ−1Se1), λ > 0
(3)
where Ep1 � Ep1+Ep12 and Ep2 � Ep2+Ep2
2 .
Using Eq. 1, we can find multiplication of two intervalclouds and with Eq. 2, we can find out weighted intervalcloud.
Definition 4: Let z̃i �([
Epi , Epi], Sni , Sei
)
(i � 1, 2, .....n) be n interval integrated clouds in thespace V , and w � (w1, w2, ...., wn)
N be their associated
weights with wi ∈ [0, 1] andn∑
i�1wi � 1, then the floating
interval cloud z̃ �([
Ep , Ep], Sn, Se
)is generated as
follows:
z̃ �n∑
i�1
wi z̃i �n∑
i�1
wi
([Epi , Epi
], Sni , Sei )
z̃ �(
n∑
i�1
wi
[Epi , Epi
],
√√√√n∑
i�1
wi Sn2i ,
√√√√n∑
i�1
wi Se2i .
(4)
Definition 5: [37]. Let z̃1 �([
Ep1 , Ep1], Sn1, Se1
)and
z̃2 �([
Ep2 , Ep2], Sn2, Se2
)be two self-assertive inter-
val integrated clouds, then the distance between the two ischaracterized as
d(z̃1, z̃2) � 1
2
(∣∣∣∣
(1 − Sn1 + Se1
Sn1
)Ep1 −
(1 − Sn2 + Se2
Sn2
)Ep2
∣∣∣∣
+
∣∣∣∣
(1 − Sn1 + Se1
Sn1
)Ep1 −
(1 − Sn1 + Se2
Sn2
)Ep2
∣∣∣∣
).
(5)
If Sn1 � Se1 � Sn2 � Se2 � 0, then the interval inte-grated clouds changes to interval numbers and d(z̃1, z̃2) � 1
2(∣∣∣Ep1 − Ep2∣∣∣ +
∣∣Ep1 − Ep2∣∣).
Definition 6: S � {s0, s1.......sm} be linguistic term set,then m + 1 essential clouds corresponding to the expres-sion of linguistic values can be produced and denoted asz0 � (Ep0, Sn0, Se0), z1 � (Ep1, Sn1, Se1), ........, zm �(Epg , Sng , Seg
).
By golden section method [37, 39] basedon a seven label linguistic term set S �⎧⎪⎨
⎪⎩
s0 � Verylow(VL), s1 � Low(L), s2 � Mediumlow
(ML), s3 � Medium(M), s4 � Mediumhigh(MH ),
s5 � High(H), s6 � Veryhigh(VH )
⎫⎪⎬
⎪⎭,
and the corresponding expressions are shown below:
123

370 Complex & Intelligent Systems (2021) 7:367–378
Epi � i
m, i � 0, 2, ....., g,
Sn2 � Sn4 � 0.382(Ymax − Ymin)/6, Sn3 � 0.618Sn2,
Sn1 � Sn5 � Sn2/0.618, Sn0 � Sn6 � Sn1/0.618,
Se2 � Se4 � Se3/0.618, Se1 � Se5 � Se2/0.618,
Se0 � Se6 � Se1/0.618
The effective domain V � [Ymin, Ymax] � [0, 1] and Se3is designated in advance. The basic idea of the golden sectionis that the closer to the centre of the valid universe, the smallerthe Sn and Se of the cloud, and the further from the centre ofthe valid universe, the larger the Sn and Se of the cloud. Thelarger one of the Sn and Se of the adjacent cloud is 1/0.618times the smaller one.
Example 1: Assuming Se � 0.1, seven basic clouds can begenerated as z0 � (0, 0.167, 0.424), z1 � (0.167, 0.103,0.267), z2 � (0.333, 0.064, 0.162), z3 � (0.5, 0.039, 0.1),z4 � (0.667, 0.064, 0.162), z5 � (0.833, 0.103, 0.262), z6 �(1, 0.167, 0.424).
Definition 7: Let S � {s0, s1.......sm} be a linguistic term setand
[si , s j
]be an interval linguistic value, and then its equiv-
alent interval cloud z̃ �([
Ep , Ep], Sn, Se
)is acquired
by
Ep � min{Epi , Ep j
}, Ep � max
{Epi , Ep j
}
Sn �√
Sn2i + Sn2j2
, Se �√Se2i + Se2j
2,
(6)
where zi � (Epi , Sni , Sei ) and z j � (Ep j , Sn j , Se j )are the clouds formed from the linguistic term set S.
Example 2: Let the domain V be [0, 1] and [s1 and s2] bethe interval linguistic value. First, convert linguistic term s1and s2 into two clouds z1 � (0.167, 0.103, 0.267) and z2� (0.333, 0.064, 0.162), respectively, and then, Ep� min
{0.167, 0.333} � 0.167,−Ep� max {0.167, 0.333} � 0.333.
Sn �√
0.1032+0.06422 =0.086, Se �
√0.2672+0.1622
2 �0.218.
Proposed cloudmodel and extendedPROMETHEE
In the succeeding section, we build up a new risk assessmentranking model using cloud and extended PROMETHEEmethod. The proposedmethodology consists of three phases:
(1) Risk assessment of failure causes through cloud model.(2) Determining the weights of decision makers through
cloud model, and
(3) Using PROMETHEE II method to obtain the ranking offailure causes.
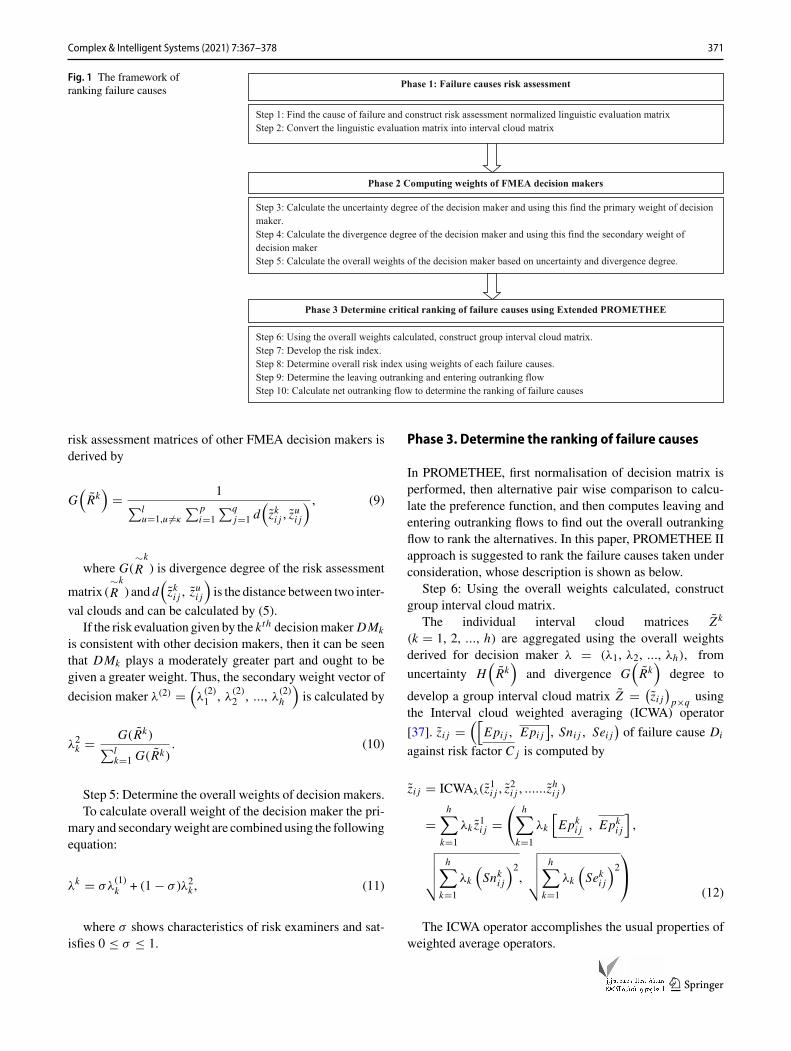
Figure 1 shows the schematic representation of the pro-posed methodology.
Phase 1. Failure causes risk assessment
Suppose there are p failure causes Di (i � 1, 2, ......p),and q risk factorsC j ( j � 1, 2, .....q)with the weight vectorw � (
w1, w2, ....wq), where w j ∈ [0, 1] and
∑qj�1 w j �
1. Assume that h decision makers DMk(k � 1, 2, ....h)
are included in the risk assessment process whose relative
weights are obscure. Let T k �(tki j
)
p×qbe the linguistic
assessment matrix of the kth decision maker, where dki j is thelinguistic rating of Di on CFj inferred from the linguistic
term set Sk � {
sk0 , sk1 , .....skm
}.
Step 1: Construct risk assessment normalized linguisticevaluation matrix using definition 6.
Step 2: Convert the linguistic evaluation matrix into inter-val cloud matrix using definition 7.
Phase 2. Computing weights of FMEA decisionmakers
Step 3: Determine the weights of FMEA decision makersbased on uncertainty degree.
For finding weightage of decision makers, the uncertaintydegree has been used in MCDM [37, 39] by the expression
H(R̃k
)�
p∑
i�1
q∑
j�1
Epki j − Epki j
m + 1, (7)
where H (∼Rk) is Uncertainty degree of the risk assessment
matrix (∼Rk)
Lower the uncertainty degree, the more exact the assess-ment information will be, which recommends that higherweight should be given to the decision maker. Hence,the primary weight vector of decision maker λ(1) �(λ
(1)1 , λ
(1)2 , ..., λ
(1)h
)is derived by
λ(1)k � 1/H (R̃k)
∑lk�1 1/H (R̃k)
(8)
Step 4: Determine the weights of FMEA decision makersbased on divergence degree.
While making a group decision, the risk rating of the indi-vidual team member should be consistent with the others tothe maximum extent. Therefore, according to [39], the diver-gence degree between the risk assessment matrix R̃k and the
123
Complex & Intelligent Systems (2021) 7:367–378 371
Fig. 1 The framework ofranking failure causes
Phase 1: Failure causes risk assessment
Step 1: Find the cause of failure and construct risk assessment normalized linguistic evaluation matrix
Step 2: Convert the linguistic evaluation matrix into interval cloud matrix
Step 3: Calculate the uncertainty degree of the decision maker and using this find the primary weight of decision
maker.
Step 4: Calculate the divergence degree of the decision maker and using this find the secondary weight of
decision maker
Step 5: Calculate the overall weights of the decision maker based on uncertainty and divergence degree.
Phase 2 Computing weights of FMEA decision makers
Phase 3 Determine critical ranking of failure causes using Extended PROMETHEE
Step 6: Using the overall weights calculated, construct group interval cloud matrix.
Step 7: Develop the risk index.
Step 8: Determine overall risk index using weights of each failure causes.
Step 9: Determine the leaving outranking and entering outranking flow
Step 10: Calculate net outranking flow to determine the ranking of failure causes
risk assessment matrices of other FMEA decision makers isderived by
G(R̃k
)� 1
∑lu�1,u ��κ
∑pi�1
∑qj�1 d
(z̃ki j , z̃
ui j
) , (9)
where G(∼Rk) is divergence degree of the risk assessment
matrix (∼Rk) and d
(z̃ki j , z̃
ui j
)is the distance between two inter-
val clouds and can be calculated by (5).If the risk evaluation given by the kth decisionmaker DMk
is consistent with other decision makers, then it can be seenthat DMk plays a moderately greater part and ought to begiven a greater weight. Thus, the secondary weight vector of
decision maker λ(2) �(λ
(2)1 , λ
(2)2 , ..., λ
(2)h
)is calculated by
λ2k � G(R̃k)∑l
k�1 G(R̃k). (10)
Step 5: Determine the overall weights of decision makers.To calculate overall weight of the decision maker the pri-
mary and secondaryweight are combined using the followingequation:
λk � σλ(1)k + (1 − σ )λ2k , (11)
where σ shows characteristics of risk examiners and sat-isfies 0 ≤ σ ≤ 1.
Phase 3. Determine the ranking of failure causes
In PROMETHEE, first normalisation of decision matrix isperformed, then alternative pair wise comparison to calcu-late the preference function, and then computes leaving andentering outranking flows to find out the overall outrankingflow to rank the alternatives. In this paper, PROMETHEE IIapproach is suggested to rank the failure causes taken underconsideration, whose description is shown as below.
Step 6: Using the overall weights calculated, constructgroup interval cloud matrix.
The individual interval cloud matrices Z̃ k
(k � 1, 2, ..., h) are aggregated using the overall weightsderived for decision maker λ � (λ1, λ2, ..., λh), from
uncertainty H(R̃k
)and divergence G
(R̃k
)degree to
develop a group interval cloud matrix Z̃ � (z̃i j
)p×q using
the Interval cloud weighted averaging (ICWA) operator
[37]. z̃i j �([
Epi j , Epi j], Sni j , Sei j
)of failure cause Di
against risk factor C j is computed by
(12)
z̃i j � ICWAλ(z̃1i j , z̃
2i j , ......z̃
hi j )
�h∑
k�1
λk z̃1i j �
(h∑
k�1
λk
[Epki j , Epki j
],
√√√√h∑
k�1
λk
(Snki j
)2,
√√√√h∑
k�1
λk
(Seki j
)2⎞
⎠
The ICWA operator accomplishes the usual properties ofweighted average operators.
123

372 Complex & Intelligent Systems (2021) 7:367–378
Step 7: Develop the risk index C j (Dr , Ds).According to [30], the risk index for each pair of failure
cause (Dr , Ds) (r , s � 1, 2, ...., p, r �� s) is designed as
C j (Dr , Ds) � 0 if z̃r j ≤ z̃s jC j (Dr , Ds) � d(z̃r j , z̃s j ) if z̃r j > z̃s j
, (13)
where j � 1, 2, . . . n and d(z̃r j , z̃s j
)is the distance
between two interval clouds z̃r j and z̃s j . The risk indexC j (Dr , Ds) is the measure to back the theory that Dr hasa higher risk than Ds concerning the risk factorC j .
Step 8: Determine overall risk index C(Dr , Ds) usingweights of each failure causes.
Considering risk factor weights, the overall risk index ofDr over Ds across q risk factors can be determined by
C(Dr , Ds) �q∑
j�1
w jC j (Dr , Ds),
r , s � 1, 2, ..........p, r �� s
(14)
where w j shows the priority weight of the j th risk factor.Step 9: Determine the leaving and the entering outranking
flows.The leavingoutrankingflowof failure cause Dr , ameasure
of the risk of failure cause Dr over the other failure causes,is denoted by
β+(Dr ) � 1
p − 1
p∑
r�1,r ��s
C(Dr , Ds), (15)
In the same way, the entering outranking flow of failurecause Dr , a measure of the risk of failure cause Dr over theother failure causes, is denoted by
β−(Dr ) � 1
p − 1
p∑
r�1,r ��s
C(Ds , Dr ), (16)
Step 10: Obtain the net outranking flow for each failurecause.
The net outranking flows can be obtained by
β(Dr ) � β+(Dr ) − β−(Dr ), r � 1, 2, . . . p (17)
Case study
In the current paper, an actual case study of northern regionof Indian paper mill is considered. There are numerous func-tional units in a paper plant (feeding, pulping, screening,bleaching and paper production unit). The current study is
done to perform risk analysis of steam handling subsystemin a paper production unit. The objective of the steam han-dling subunit is to heat the dryer’s rolls with the superheatedsteam to remove the moisture content of the paper rolledover the dryer rolls. To find the failure cause of steam han-dling subunit, a team is constructedwhich consist of graduateengineer trainee, maintenance assistant engineer and main-tenance head denoted as DMk(k � 1, 2, 3)). After that rootcause failures of steam handling subunit is identified and rootcause analysis diagram is drawn (Fig. 2), which shows thatthere are eight causes of failure. The entire three decisionmaker DM1, DM2, DM3 assesses the failure causes risksusing definition 6 in terms of seven label linguistic term.
Illustration of proposedmodel
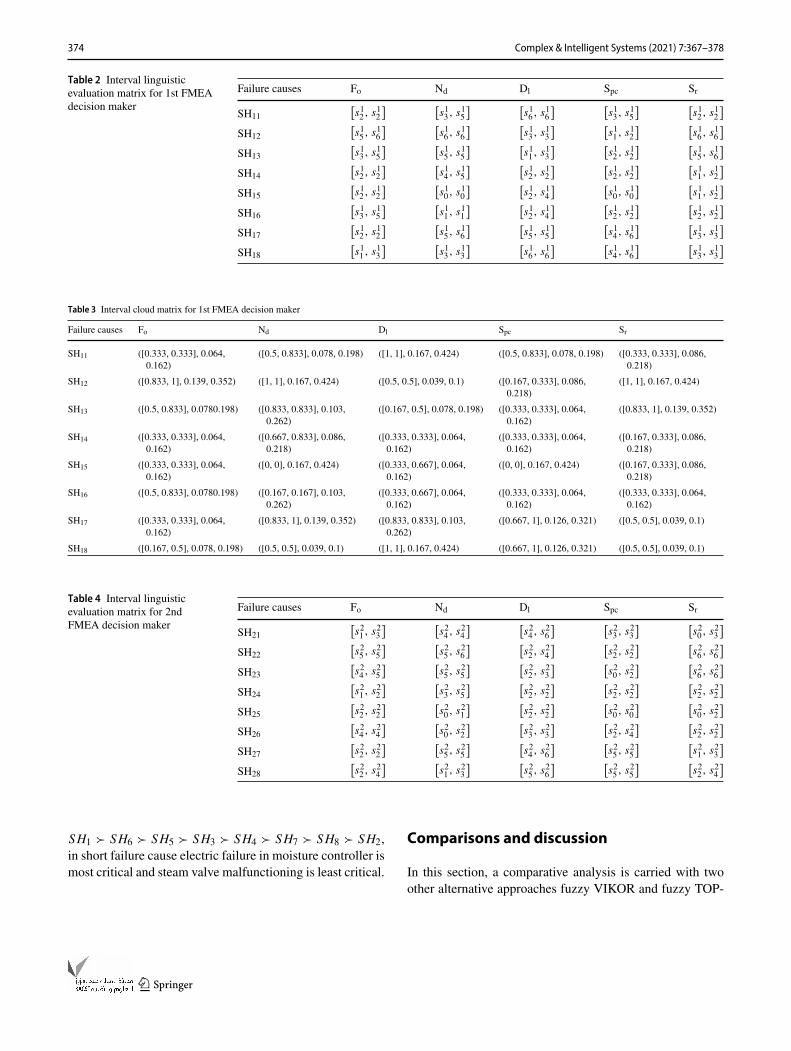
In the present paper, as discussed in the preceding sec-tions, we use the integrated cloud model and extendedPROMETHEE approach to find out the risk ranking of eightfailure causes of steam handling subunit. To begin within phase 1st, the different sorts of linguistic evaluationsgiven in Table 1 are represented as linguistic intervals todevelop the interval linguistic assessment evaluation matri-
ces C̃k �(c̃ki j
)
8×5(k � 1, 2, 3). Then, the interval cloud
matrices Z̃ k �(z̃ki j
)
8×5(k � 1, 2, 3) are determined in line
with the conversion method between linguistic ratings andinterval clouds. The interval linguistic evaluation matrix andthe interval cloud matrix are obtained for 1st decision makerDM1 as shown in Tables 2 and 3, 2nd decision maker DM2
as shown in Tables 4 and 5 and 3rd decision maker DM3 asshown in Tables 6 and 7, respectively.
In the 2nd phase, with the interval cloud matrices Z̃ k
(k � 1, 2, 3), as shown in Tables 3, 5, 7, the uncertaintydegree of each FMEA decision maker are determined by(7), and the primary weights λ
(1)k (k � 1, 2, 3) are deter-
mined based on (8). Similarly, the divergence degree ofeach decision maker is find out using (9), the secondaryweights λ
(2)k (k � 1, 2, 3) are obtained using (10). Lastly, the
overall weight related with the three decision makers λ �(λ1, λ2, λ3) can be obtained with (11). The results obtainedare shown in Table 8.
In the third phase of our approach, risk ranking of fail-ure causes of steam handling unit is determined. To beginwith individual interval cloud matrix of three decision mak-ers considered are aggregated using ICWA operator to setup the group interval cloud matrix Z̃ � (
z̃i j)8×5 as shown
in Table 9. Then, using (13) and (14), the risk indices C j
(Dr , Ds)(r , s � 1, 2, ......8, r �� s) related to the risk fac-tors Fo, Nd, Dl, Spc, Sr and the overall risk indicesC(Dr , Ds)
(r , s � 1, 2, ......8, r �� s) are calculated. Table 10 shows
123

Complex & Intelligent Systems (2021) 7:367–378 373
Fig. 2 Root cause analysis ofSteam handling subunit
Steam
Handling
Unit
Steam
valve
Valve Malfunctioning
(SH2)
Leakage (SH3)
Moisture
Controller
Electric failure
(SH1)
Condensate
tank
Separator Failure
(SH7)
Vacuum
PumpsResidual Heat
exchanger
Seal failure (SH4)
Noisy Operation (SH5)
Rotor Jam (SH6)Pressure drop (SH
8)
Table 1 Linguistic evaluation on the eight failure causes by the three FMEA decision makers
Decision maker Risk factors SH1 SH2 SH3 SH4 SH5 SH6 SH7 SH8
DM1 Fo ML H-VH M-H ML ML M-H ML L-M
Nd M-H VH H MH-H VL L H-VH M
Dl VH M L-M ML ML-MH ML-MH H VH
Spc M-H L-ML ML ML VL ML MH-VH MH-VH
Sr ML VH H-VH L-ML L-ML ML M M
DM2 Fo L-M H MH-H L-ML ML MH ML ML-MH
Nd MH H-VH H M-H VL-L VL-ML H L-M
Dl MH-VH ML-MH ML-M ML ML M H-VH H-VH
Spc M ML VL-ML ML VL ML-MH H H
Sr VL-M VH VH ML VL-ML ML L-M ML-MH
DM3 Fo ML-M MH-VH H ML VL-ML MH L-M M
Nd M-VH VH ML-H MH L L-M MH-H ML-M
Dl VH M M VL-ML ML ML-MH H H-VH
Spc ML-MH ML-M ML L-ML VL-L ML M-VH H
Sr VL-ML H-VH MH-VH ML L L-M ML-MH M
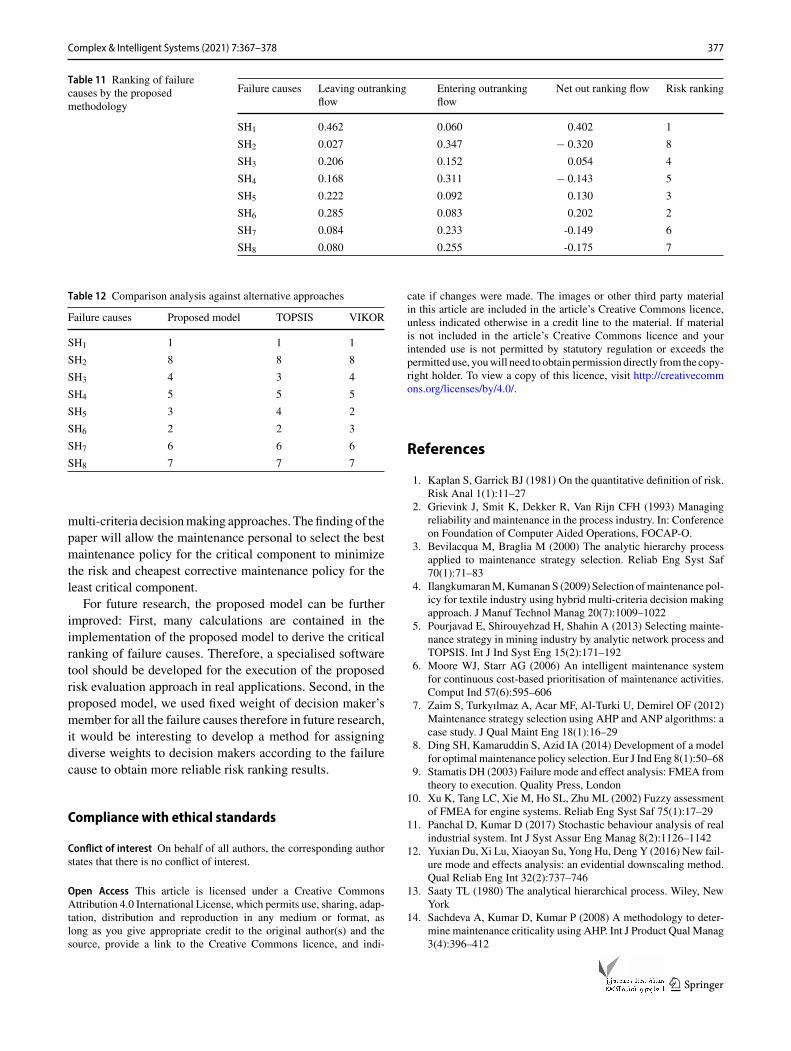
the overall risk indices for each eight pair of failure causes.The weights of the considered five risk factors are taken as0.427, 0.208, 0.191, 0.111 and 0.2, respectively using AHP.Subsequently, using (15) and (16), the leaving outrankingflows β+(Dr )(r � 1, 2, ..., 8) and the entering outranking
flows β−(Dr )(r � 1, 2, ..., 8) of the eight failure causes aredetermined and shown in Table 11. At last, the net outrank-ing flow for each failure causes β(Dr )(r � 1, 2, ..., 8) isderived using (17), as shown in Table 11. From Table 11, itcan be concluded that the order of eight failure causes are
123
374 Complex & Intelligent Systems (2021) 7:367–378
Table 2 Interval linguisticevaluation matrix for 1st FMEAdecision maker
Failure causes Fo Nd Dl Spc Sr
SH11
[s12 , s
12
] [s13 , s
15
] [s16 , s
16
] [s13 , s
15
] [s12 , s
12
]
SH12
[s15 , s
16
] [s16 , s
16
] [s13 , s
13
] [s11 , s
12
] [s16 , s
16
]
SH13
[s13 , s
15
] [s15 , s
15
] [s11 , s
13
] [s12 , s
12
] [s15 , s
16
]
SH14
[s12 , s
12
] [s14 , s
15
] [s12 , s
12
] [s12 , s
12
] [s11 , s
12
]
SH15
[s12 , s
12
] [s10 , s
10
] [s12 , s
14
] [s10 , s
10
] [s11 , s
12
]
SH16
[s13 , s
15
] [s11 , s
11
] [s12 , s
14
] [s12 , s
12
] [s12 , s
12
]
SH17
[s12 , s
12
] [s15 , s
16
] [s15 , s
15
] [s14 , s
16
] [s13 , s
13
]
SH18
[s11 , s
13
] [s13 , s
13
] [s16 , s
16
] [s14 , s
16
] [s13 , s
13
]
Table 3 Interval cloud matrix for 1st FMEA decision maker
Failure causes Fo Nd Dl Spc Sr
SH11 ([0.333, 0.333], 0.064,0.162)
([0.5, 0.833], 0.078, 0.198) ([1, 1], 0.167, 0.424) ([0.5, 0.833], 0.078, 0.198) ([0.333, 0.333], 0.086,0.218)
SH12 ([0.833, 1], 0.139, 0.352) ([1, 1], 0.167, 0.424) ([0.5, 0.5], 0.039, 0.1) ([0.167, 0.333], 0.086,0.218)
([1, 1], 0.167, 0.424)
SH13 ([0.5, 0.833], 0.0780.198) ([0.833, 0.833], 0.103,0.262)
([0.167, 0.5], 0.078, 0.198) ([0.333, 0.333], 0.064,0.162)
([0.833, 1], 0.139, 0.352)
SH14 ([0.333, 0.333], 0.064,0.162)
([0.667, 0.833], 0.086,0.218)
([0.333, 0.333], 0.064,0.162)
([0.333, 0.333], 0.064,0.162)
([0.167, 0.333], 0.086,0.218)
SH15 ([0.333, 0.333], 0.064,0.162)
([0, 0], 0.167, 0.424) ([0.333, 0.667], 0.064,0.162)
([0, 0], 0.167, 0.424) ([0.167, 0.333], 0.086,0.218)
SH16 ([0.5, 0.833], 0.0780.198) ([0.167, 0.167], 0.103,0.262)
([0.333, 0.667], 0.064,0.162)
([0.333, 0.333], 0.064,0.162)
([0.333, 0.333], 0.064,0.162)
SH17 ([0.333, 0.333], 0.064,0.162)
([0.833, 1], 0.139, 0.352) ([0.833, 0.833], 0.103,0.262)
([0.667, 1], 0.126, 0.321) ([0.5, 0.5], 0.039, 0.1)
SH18 ([0.167, 0.5], 0.078, 0.198) ([0.5, 0.5], 0.039, 0.1) ([1, 1], 0.167, 0.424) ([0.667, 1], 0.126, 0.321) ([0.5, 0.5], 0.039, 0.1)
Table 4 Interval linguisticevaluation matrix for 2ndFMEA decision maker
Failure causes Fo Nd Dl Spc Sr
SH21
[s21 , s
23
] [s24 , s
24
] [s24 , s
26
] [s23 , s
23
] [s20 , s
23
]
SH22
[s25 , s
25
] [s25 , s
26
] [s22 , s
24
] [s22 , s
22
] [s26 , s
26
]
SH23
[s24 , s
25
] [s25 , s
25
] [s22 , s
23
] [s20 , s
22
] [s26 , s
26
]
SH24
[s21 , s
22
] [s23 , s
25
] [s22 , s
22
] [s22 , s
22
] [s22 , s
22
]
SH25
[s22 , s
22
] [s20 , s
21
] [s22 , s
22
] [s20 , s
20
] [s20 , s
22
]
SH26
[s24 , s
24
] [s20 , s
22
] [s23 , s
23
] [s22 , s
24
] [s22 , s
22
]
SH27
[s22 , s
22
] [s25 , s
25
] [s24 , s
26
] [s25 , s
25
] [s21 , s
23
]
SH28
[s22 , s
24
] [s21 , s
23
] [s25 , s
26
] [s25 , s
25
] [s22 , s
24
]
SH1 SH6 SH5 SH3 SH4 SH7 SH8 SH2,in short failure cause electric failure in moisture controller ismost critical and steam valve malfunctioning is least critical.
Comparisons and discussion
In this section, a comparative analysis is carried with twoother alternative approaches fuzzy VIKOR and fuzzy TOP-
123

Complex & Intelligent Systems (2021) 7:367–378 375
Table 5 Interval cloud matrix for 2nd FMEA decision maker
Failure causes Fo Nd Dl Spc Sr
SH21 ([0.167, 0.5], 0.078, 0.198) ([0.667, 0.667], 0.064,0.162)
([0.667, 1], 0.126, 0.321) ([0.5, 0.5], 0.039, 0.1) ([0, 0.5], 0.121, 0.308)
SH22 ([0.833, 0.833], 0.103,0.262)
([0.833, 1], 0.139, 0.352) ([0.333, 0.667], 0.064,0.162)
([0.333, 0.333], 0.064,0.162)
([1,1], 0.167, 0.424)
SH23 ([0.667, 0.833], 0.086,0.218)
([0.833, 0.833], 0.103,0.262)
([0.333, 0.5], 0.053, 0.135) ([0, 0.333], 0.126, 0.32) ([1, 1], 0.167, 0.424)
SH24 ([0.167, 0.333], 0.086,0.218)
([0.5, 0.833], 0.0780.198) ([0.333, 0.333], 0.064,0.162)
([0.333, 0.333], 0.064,0.162)
([0.333, 0.333], 0.064,0.162)
SH25 ([0.333, 0.333], 0.064,0.162)
([0, 0.167], 0.139, 0.352) ([0.333, 0.333], 0.064,0.162)
([0, 0], 0.167, 0.424) ([0, 0.5], 0.121, 0.308)
SH26 ([0.667, 0.667], 0.064,0.162)
([0, 0.333], 0.126, 0.32) ([0.5, 0.5], 0.039, 0.1) ([0.333, 0.667], 0.064,0.162)
([0.333, 0.333], 0.064,0.162)
SH27 ([0.333, 0.333], 0.064,0.162)
([0.833, 0.833], 0.103,0.262)
([0.667, 1], 0.126, 0.321) ([0.833, 0.833], 0.103,0.262)
([0.167, 0.5], 0.078, 0.198)
SH28 ([0.333, 0.667], 0.064,0.162)
([0.167, 0.5], 0.078, 0.198) ([0.833, 1], 0.139, 0.352) ([0.833, 0.833], 0.103,0.262)
([0.333, 0.667], 0.064,0.162)
Table 6 Interval linguisticevaluation matrix for 3rd FMEAdecision maker
Failure causes Fo Nd Dl Spc Sr
SH31
[s32 , s
33
] [s33 , s
36
] [s36 , s
36
] [s32 , s
34
] [s30 , s
32
]
SH32
[s34 , s
36
] [s36 , s
36
] [s33 , s
33
] [s32 , s
33
] [s35 , s
36
]
SH33
[s35 , s
35
] [s32 , s
35
] [s33 , s
33
] [s32 , s
32
] [s34 , s
36
]
SH34
[s32 , s
32
] [s34 , s
34
] [s30 , s
32
] [s31 , s
32
] [s32 , s
32
]
SH35
[s30 , s
32
] [s31 , s
31
] [s32 , s
32
] [s30 , s
31
] [s31 , s
31
]
SH36
[s34 , s
34
] [s31 , s
33
] [s32 , s
34
] [s32 , s
32
] [s31 , s
33
]
SH37
[s31 , s
33
] [s34 , s
35
] [s35 , s
35
] [s33 , s
36
] [s32 , s
34
]
SH38
[s33 , s
33
] [s32 , s
33
] [s35 , s
36
] [s35 , s
35
] [s33 , s
33
]
Table 7 Interval cloud matrix for 3rd FMEA decision maker
Failure causes Fo Nd Dl Spc Sr
SH31 ([0.333, 0.5], 0.053, 0.135) ([0.5, 1], 0.121, 0.308) ([1, 1], 0.167, 0.424) ([0.333, 0.667], 0.064,0.162)
([0, 0.333], 0.126, 0.32)
SH32 ([0.667, 1], 0.126, 0.321) ([1, 1], 0.167, 0.424) ([0.5, 0.5], 0.039, 0.1) ([0.333, 0.5], 0.053, 0.135) ([0.833, 1], 0.139, 0.352)
SH33 ([0.5, 0.833], 0.0780.198) ([0.333, 0.833], 0.086,0.218)
([0.5, 0.5], 0.039, 0.1) ([0.333, 0.333], 0.064,0.162)
([0.667, 1], 0.126, 0.321)
SH34 ([0.333, 0.333], 0.064,0.162)
([0.667, 0.667], 0.064,0.162)
([0, 0.333], 0.126, 0.32) ([0.167, 0.333], 0.086,0.218)
([0.333, 0.333], 0.064,0.162)
SH35 ([0, 0.333], 0.126, 0.32) ([0.167, 0.167], 0.103,0.262)
([0.333, 0.333], 0.064,0.162)
([0, 0.167], 0.139, 0.352) ([0.167, 0.167], 0.103,0.262)
SH36 ([0.667, 0.667], 0.064,0.162)
([0.167, 0.5], 0.078, 0.198) ([0.333, 0.667], 0.064,0.162)
([0.333, 0.333], 0.064,0.162)
([0.167, 0.5], 0.078, 0.198)
SH37 ([0.167, 0.5], 0.078, 0.198) ([0.667, 0.833], 0.086,0.218)
([0.833, 0.833], 0.103,0.262)
([0.5, 1], 0.121, 0.308) ([0.333, 0.667], 0.064,0.162)
SH38 ([0.5, 0.5], 0.039, 0.1) ([0.333, 0.5], 0.053, 0.135) ([0.833, 1], 0.139, 0.352) ([0.833, 0.833], 0.103,0.262)
([0.5, 0.5], 0.039, 0.1)
SIS to illustrate the effectiveness of the proposed approach.The critical ranking of the failure causes acquired by thealternative approaches with the proposed approach is shownin Table 12.
From Table 12, it can be seen that the critical ranking offailure causes by the proposed model agrees almost com-pletely with those obtained by the fuzzy VIKOR and the
fuzzy TOPSIS methods except in failure causes; SH3, SH4
between proposed approach and alternative Fuzzy TOP-SIS approach and SH5, SH6 between proposed approachand alternative Fuzzy VIKOR approach. The main rea-son behind that is (1) the proposed method uses cloudmodel to describe the fuzziness and randomness of linguis-tic assessment information and deal with uncertainty and
123

376 Complex & Intelligent Systems (2021) 7:367–378
Table 8 Objective weights of the FMEA decision makers
x DM1 DM2 DM3
H(R̃k
)0.857 0.595 0.952
λ(1)k 0.299 0.432 0.269
G(R̃k
)0.0082 0.0056 0.0057
λ(2)k 0.421 0.287 0.292
λk 0.36 0.359 0.281
multi-granularity linguistic scale to assess the risk of failurecauses. (2) The proposed model determines the weights ofthe decision makers objectively based on uncertainty degreeand divergence degree which avoids the imprecise subjec-tive randomness of assigning weights to the decision maker.Furthermore, in the proposed model, ranking of the failurecauses is performed using PROMETHEE II which is a sim-ple and easily comprehensible approach in comparison toother multi-criteria decision making approaches and pro-duces complete ranking of alternatives.
The comparison analysis above manifests that the pro-posedmodel has ability to derive more accurate and practical
risk ranking of failure causes which will be useful for prac-tical risk management decision making.
Conclusion
In current research work, for ranking the failure causes ina process industry, an integrated approach based on cloudtheory and PROMETHEE II was developed in which fail-ure causes are evaluated by means of linguistic evaluations,then the interval linguistic evaluation are converted to intervalcloud matrix, then using uncertainty degree and divergencedegree weights of the decision makers are calculated whichare used to obtain the group interval cloud matrix. Then,extended PROMETHEE approach was applied to rank thefailure causes and determine the most critical one for riskreduction measures. An actual case study of steam handlingsubunit of paper production unit in a paper mill was pro-posed to illustrate the effectiveness of the proposed modeland from which it was found that failure cause SH1 is themost critical and SH2 is the least critical. Ranking orders asinferred through proposed methodology have shown almostsame result as obtained by other researcher through various
Table 9 Group interval cloud matrix
Failure causes Fo Nd Dl Spc Sr
SH1 ([0.273, 0.44], 0.067,0.169)
([0.56, 0.7], 0.088, 0.224) ([0.88, 1], 0.153, 0.39) ([0.453, 0.667], 0.062,0.158)
([0.12, 0.393], 0.111,0.283)
SH2 ([0.786, 0.94], 0.123,0.313)
([0.76, 0.82], 0.157, 0.25) ([0.44, 0.56], 0.049, 0.126) ([0.273, 0.38], 0.07, 0.178) ([0.953, 1], 0.16, 0.405)
SH3 ([0.56, 0.833], 0.081,0.205)
([0.753, 0.893], 0.098,0.25)
([0.32, 0.5], 0.06, 0.153) ([0.213, 0.333], 0.091,0.232)
([0.846, 1], 0.146, 0.372)
SH4 ([0.273, 0.333], 0.073,0.184)
([0.607, 0.727], 0.077,0.196)
([0.239, 0.333], 0.086,0.219)
([0.286, 0.333], 0.071,0.179)
([0.273, 0.333], 0.073,0.184)
SH5 ([0.239, 0.333], 0.086,0.219)
([0.227, 0.287], 0.141,0.358)
([0.333, 0.453], 0.064,0.162)
([0, 0.047], 0.16, 0.405) ([0.107, 0.346], 0.104,0.265)
SH6 ([0.607, 0.727], 0.069,0.176)
([0.347, 0.62], 0.106, 0.27) ([0.393, 0.607], 0.056,0.143)
([0.333, 0.453], 0.064,0.162)
([0.286, 0.38], 0.068,0.173)
SH7 ([0.286, 0.38], 0.068,0.173)
([0.666, 0.713], 0.113,0.287)
([0.773, 0.893], 0.111,0.284)
([0.68, 0.94], 0.117, 0.297) ([0.333, 0.547], 0.062,0.158)
SH8 ([0.32, 0.56], 0.064, 0.186) ([0.333, 0.5], 0.059, 0.151) ([0.893, 1], 0.15, 0.379) ([0.773, 0.893], 0.112,0.285)
([0.44, 0.56], 0.049, 0.126)
Table 10 Results of overall riskindices Failure causes SH1 SH2 SH3 SH4 SH5 SH6 SH7 SH8
SH1 0 0.632 0.305 0.634 0.316 0.255 0.546 0.548
SH2 0 0 0.005 0.131 0 0 0 0.053
SH3 0 0.332 0 0.387 0.068 0.101 0.251 0.301
SH4 0.156 0.286 0.214 0 0.102 0.115 0.143 0.157
SH5 0.078 0.394 0.135 0.342 0 0.053 0.270 0.281
SH6 0.08 0.457 0.230 0.418 0.116 0 0.345 0.347
SH7 0.063 0.150 0.073 0.138 0.025 0.038 0 0.099
SH8 0.042 0.180 0.100 0.130 0.013 0.018 0.076 0
123
Complex & Intelligent Systems (2021) 7:367–378 377
Table 11 Ranking of failurecauses by the proposedmethodology
Failure causes Leaving outrankingflow
Entering outrankingflow
Net out ranking flow Risk ranking
SH1 0.462 0.060 0.402 1
SH2 0.027 0.347 − 0.320 8
SH3 0.206 0.152 0.054 4
SH4 0.168 0.311 − 0.143 5
SH5 0.222 0.092 0.130 3
SH6 0.285 0.083 0.202 2
SH7 0.084 0.233 -0.149 6
SH8 0.080 0.255 -0.175 7
Table 12 Comparison analysis against alternative approaches
Failure causes Proposed model TOPSIS VIKOR
SH1 1 1 1
SH2 8 8 8
SH3 4 3 4
SH4 5 5 5
SH5 3 4 2
SH6 2 2 3
SH7 6 6 6
SH8 7 7 7
multi-criteria decisionmaking approaches. The finding of thepaper will allow the maintenance personal to select the bestmaintenance policy for the critical component to minimizethe risk and cheapest corrective maintenance policy for theleast critical component.
For future research, the proposed model can be furtherimproved: First, many calculations are contained in theimplementation of the proposed model to derive the criticalranking of failure causes. Therefore, a specialised softwaretool should be developed for the execution of the proposedrisk evaluation approach in real applications. Second, in theproposed model, we used fixed weight of decision maker’smember for all the failure causes therefore in future research,it would be interesting to develop a method for assigningdiverse weights to decision makers according to the failurecause to obtain more reliable risk ranking results.
Compliance with ethical standards
Conflict of interest On behalf of all authors, the corresponding authorstates that there is no conflict of interest.
Open Access This article is licensed under a Creative CommonsAttribution 4.0 International License, which permits use, sharing, adap-tation, distribution and reproduction in any medium or format, aslong as you give appropriate credit to the original author(s) and thesource, provide a link to the Creative Commons licence, and indi-
cate if changes were made. The images or other third party materialin this article are included in the article’s Creative Commons licence,unless indicated otherwise in a credit line to the material. If materialis not included in the article’s Creative Commons licence and yourintended use is not permitted by statutory regulation or exceeds thepermitted use, youwill need to obtain permission directly from the copy-right holder. To view a copy of this licence, visit http://creativecommons.org/licenses/by/4.0/.
References
1. Kaplan S, Garrick BJ (1981) On the quantitative definition of risk.Risk Anal 1(1):11–27
2. Grievink J, Smit K, Dekker R, Van Rijn CFH (1993) Managingreliability and maintenance in the process industry. In: Conferenceon Foundation of Computer Aided Operations, FOCAP-O.
3. Bevilacqua M, Braglia M (2000) The analytic hierarchy processapplied to maintenance strategy selection. Reliab Eng Syst Saf70(1):71–83
4. IlangkumaranM,Kumanan S (2009) Selection ofmaintenance pol-icy for textile industry using hybrid multi-criteria decision makingapproach. J Manuf Technol Manag 20(7):1009–1022
5. Pourjavad E, Shirouyehzad H, Shahin A (2013) Selecting mainte-nance strategy in mining industry by analytic network process andTOPSIS. Int J Ind Syst Eng 15(2):171–192
6. Moore WJ, Starr AG (2006) An intelligent maintenance systemfor continuous cost-based prioritisation of maintenance activities.Comput Ind 57(6):595–606
7. Zaim S, Turkyılmaz A, Acar MF, Al-Turki U, Demirel OF (2012)Maintenance strategy selection using AHP and ANP algorithms: acase study. J Qual Maint Eng 18(1):16–29
8. Ding SH, Kamaruddin S, Azid IA (2014) Development of a modelfor optimalmaintenance policy selection. Eur J Ind Eng 8(1):50–68
9. Stamatis DH (2003) Failure mode and effect analysis: FMEA fromtheory to execution. Quality Press, London
10. Xu K, Tang LC, Xie M, Ho SL, Zhu ML (2002) Fuzzy assessmentof FMEA for engine systems. Reliab Eng Syst Saf 75(1):17–29
11. Panchal D, Kumar D (2017) Stochastic behaviour analysis of realindustrial system. Int J Syst Assur Eng Manag 8(2):1126–1142
12. Yuxian Du, Xi Lu, Xiaoyan Su, Yong Hu, Deng Y (2016) New fail-ure mode and effects analysis: an evidential downscaling method.Qual Reliab Eng Int 32(2):737–746
13. Saaty TL (1980) The analytical hierarchical process. Wiley, NewYork
14. Sachdeva A, Kumar D, Kumar P (2008) A methodology to deter-mine maintenance criticality using AHP. Int J Product Qual Manag3(4):396–412
123

378 Complex & Intelligent Systems (2021) 7:367–378
15. García-Cascales MS, Lamata MT (2009) Selection of a cleaningsystem for engine maintenance based on the analytic hierarchyprocess. Comput Ind Eng 56(4):1442–1451
16. Bahadir MC, Bahadir SK (2015) Selection of appropriate e-textilestructure manufacturing process prior to sensor integration usingAHP. Int J Adv Manuf Technol 76(9–12):1719–1730
17. Hwang CL, Masud ASM (2012) Multiple objective deci-sion making-methods and applications: a state-of-the-art survey.Springer Science and Business Media, Berlin
18. Song W, Ming X, Wu Z, Zhu B (2014) A rough TOPSIS approachfor failure mode and effects analysis in uncertain environments.Qual Reliab Eng Int 30(4):473–486
19. Sachdeva A, Kumar D, Kumar P (2009) Multi-factor failure modecritically analysis using TOPSIS. J Ind Eng Int 5(8):1–9
20. Zhou X, Lu M (2012) Risk evaluation of dynamic alliance basedon fuzzy analytic network process and fuzzy TOPSIS. J Serv SciManag 5(3):230–240
21. AktasA,KabakM (2019)A hybrid hesitant fuzzy decision-makingapproach for evaluating solar power plant location sites. Arab J SciEng 44(8):7235–7247
22. Irfan M, Ali Y, Ahmed S, Iqbal S (2019) Wang H (2019) Ruttingand fatigue properties of cellulose fiber-added stone mastic asphaltconcrete mixtures. Adv Mater Sci Eng 1:1–12
23. Singh SP, Singh P (2018) A hybrid decision support model usingaxiomatic fuzzy set theory in AHP and TOPSIS for multicriteriaroute selection. Complex Intell Syst 4(2):133–143
24. Chatterjee P,Mukherjee P, Chakraborty S (2011) Supplier selectionusing compromise ranking and outranking methods. J Ind Eng Int7(14):61–73
25. Panwar N, Kumar S, Attri R (2020) AHP-VIKOR-based method-ology for determining maintenance criticality. Int J Product QualManag 29(2):167–186
26. MohsenO, Fereshteh N (2017) An extendedVIKORmethod basedon entropy measure for the failure modes risk assessment–A casestudy of the geothermal power plant (GPP). Saf Sci 92:160–172
27. Brans JP, Vincke P, Mareschal B (1986) How to select and howto rank projects: The PROMETHEE method. Eur J Oper Res24(2):228–238
28. Cavalcante CAV, De Almeida AT (2007) A multi-criteria decision-aiding model using PROMETHEE III for preventive mainte-nance planning under uncertain conditions. J Qual Maint Eng13(4):385–397
29. Abdelhadi A (2018) Maintenance scheduling based onPROMETHEE method in conjunction with group technologyphilosophy. Int J Qual Reliab Manag 35(7):1423–1444
30. Sen DK, Datta S, Patel SK, Mahapatra SS (2015) Multi-criteriadecision making towards selection of industrial robot. Benchmark-ing 22(3):465–487
31. Sennaroglu B, Celebi GV (2018) A military airport location selec-tion by AHP integrated PROMETHEE and VIKOR methods.Transp Res Part D 59:160–173
32. Tuzkaya G, Sennaroglu B, Kalender ZT, Mutlu M (2019) Hospi-tal service quality evaluation with IVIF-PROMETHEE and a casestudy. Socio-Econ Plann Sci 68:100705
33. Nassereddine M, Azar A, Rajabzadeh A, Afsar A (2019) Deci-sion making application in collaborative emergency response: anew PROMETHEE preference function. Int J Disaster Risk Red38:101221
34. Lo HW, Liou JJ (2018) A novel multiple-criteria decision-making-based FMEA model for risk assessment. Appl Soft Comput73:684–696
35. Li D, Liu C, Gan W (2009) A new cognitive model: cloud model.Int J Intell Syst 24(3):357–375
36. Liu HC, Li P, You JX, Chen YZ (2015) A novel approach forFMEA: combination of interval 2-tuple linguistic variables andgray relational analysis. Qual Reliab Eng Int 31(5):761–772
37. Wang JQ, Peng JJ, ZhangHY, Liu T, ChenXH (2015) An uncertainlinguistic multi-criteria group decision-making method based on acloud model. Group Decis Negot 24(1):171–192
38. Zhao H, Li N (2015) Risk evaluation of a UHV power transmissionconstruction project based on a cloud model and FCE method forsustainability. Sustainability 7(3):2885–2914
39. Shi H, Liu HC, Li P, Xu XG (2017) An integrated decision mak-ing approach for assessing healthcare waste treatment technologiesfrom a multiple stakeholder. Waste Manag 59:508–517
40. Wang KQ, Liu HC, Liu L, Huang J (2017) Green supplier evalua-tion and selection using cloud model theory and the QUALIFLEXmethod. Sustainability 9(5):688
41. LiuHC,LiZ, SongW,SuQ (2017) Failuremode and effect analysisusing cloud model theory and PROMETHEE method. IEEE TransReliab 66(4):1058–1072
42. Liu HC (2019) FMEA using cloud model and PROMETHEEmethod and its application to emergency department. ImprovedFMEA methods for proactive healthcare risk analysis. Springer,Singapore, pp 197–221
43. Wang JJ, Miao ZH, Cui FB, Liu HC (2018) Robot evaluationand selectionwith entropy-based combinationweighting and cloudTODIM approach. Entropy 20(5):349
44. LiuHC,WangLE, Li Z,HuYP (2018) Improving risk evaluation inFMEA with cloud model and hierarchical TOPSIS method. IEEETrans Fuzzy Syst 27(1):84–95
45. Lei L, Fang Z, GeG (2019) An improved TOPSISmethod based oncloud model for risk assessment of failure modes of metro vehicle.In: 2019ChineseControl andDecisionConference (CCDC), IEEE,pp. 6104–6110
46. Li J, Fang H, Song W (2019) Modified failure mode and effectsanalysis under uncertainty: a rough cloud theory-based approach.Appl Soft Comput 78:195–208
47. Hu YP, You XY, Wang L, Liu HC (2019) An integrated approachfor failure mode and effect analysis based on uncertain linguisticGRA–TOPSIS method. Soft Comput 23(18):8801–8814
48. Huang J, Liu HC, Duan CY, Song MS (2019) An improved relia-bility model for FMEA using probabilistic linguistic term sets andTODIM method. Ann Oper Res. https://doi.org/10.1007/s10479-019-03447-0
49. Li X, Ran Y, Zhang G, He Y (2019) A failure mode and risk assess-ment method based on cloud model. J Intell Manuf 31:1339–1352
50. Liu HC, Wang LE, You XY, Wu SM (2019) Failure mode andeffect analysis with extended grey relational analysis method incloud setting. Total Qual Manag Bus Excel 30(7–8):745–767
51. Zhu J, Shuai B, Li G, Chin KS, Wang R (2020) Failure modeand effect analysis using regret theory and PROMETHEE underlinguistic neutrosophic context. J Loss Prev Process Ind 64:104048
Publisher’s Note Springer Nature remains neutral with regard to juris-dictional claims in published maps and institutional affiliations.
123