Embed Size (px)
Citation preview
Georgia State University Georgia State University
ScholarWorks @ Georgia State University ScholarWorks @ Georgia State University
Middle-Secondary Education and Instructional Technology Dissertations
Department of Middle-Secondary Education and Instructional Technology (no new uploads as of
Jan. 2015)
Fall 1-10-2014
Critical Success Factors of Technological Innovation and Critical Success Factors of Technological Innovation and
Diffusion in Higher Education Diffusion in Higher Education
Terry Dennison
Follow this and additional works at: https://scholarworks.gsu.edu/msit_diss
Recommended Citation Recommended Citation Dennison, Terry, "Critical Success Factors of Technological Innovation and Diffusion in Higher Education." Dissertation, Georgia State University, 2014. https://scholarworks.gsu.edu/msit_diss/118
This Dissertation is brought to you for free and open access by the Department of Middle-Secondary Education and Instructional Technology (no new uploads as of Jan. 2015) at ScholarWorks @ Georgia State University. It has been accepted for inclusion in Middle-Secondary Education and Instructional Technology Dissertations by an authorized administrator of ScholarWorks @ Georgia State University. For more information, please contact [email protected].

ACCEPTANCE
This dissertation, CRITICAL SUCCESS FACTORS OF TECHNOLOGICAL
INNOVATION AND DIFFUSION IN HIGHER EDUCATION, by T. WAYNE
DENNISON, was prepared under the direction of the candidate‟s Dissertation Advisory
Committee. It is accepted by the committee members in partial fulfillment of the
requirements for the degree, Doctor of Philosophy, in the College of Education, Georgia
State University.
The Dissertation Advisory Committee and the student‟s Department Chairperson, as
representatives of the faculty, certify that this dissertation has met all standards of
excellence and scholarship as determined by the faculty. The Dean of the College of
Education concurs.
_______________________________ _____________________________
Stephen W. Harmon, Ph.D. Brendan Calandra, Ph.D.
Committee Chair Committee Member
_______________________________ _____________________________
Wanjira Kinuthia, Ph.D. Nancy King, Ph.D.
Committee Member Committee Member
_______________________________
Duane P. Truex III, Ph.D.
Committee Member
_______________________________
Date
_______________________________
Stephen W. Harmon, Ph.D.
Chair, Learning Technologies Division
_______________________________
Paul A. Alberto, Ph.D.
Interim Dean, College of Education

AUTHOR‟S STATEMENT
By presenting this dissertation as a partial fulfillment of the requirements for the
advanced degree from Georgia State University, I agree that the library of Georgia State
University shall make it available for inspection and circulation in accordance with its
regulations governing materials of this type. I agree that permission to quote, to copy
from, or to publish this dissertation may be granted by the professor under whose
direction it was written, by the College of Education‟s Director of Graduate Studies, or
by me. Such quoting, copying, or publishing must be solely for scholarly purposes and
will not involve potential financial gain. It is understood that any copying from or
publication of this dissertation which involves potential financial gain will not be allowed
without my written permission.
________________________________________________
T. Wayne Dennison

NOTICE TO BORROWERS
All dissertations deposited in the Georgia State University library must be used in
accordance with the stipulations prescribed by the author in the preceding statement. The
author of this dissertation is:
T. Wayne Dennison
28 Carrington Drive
Cartersville, GA 30120
The director of this dissertation is:
Dr. Stephen W. Harmon
Learning Technologies Division
College of Education
Georgia State University
Atlanta, GA 30307

CURRICULUM VITAE
T. Wayne Dennison
ADDRESS: 28 Carrington Drive
Cartersville, GA 30120
EDUCATION:
Ph.D. 2013 Georgia State University, Atlanta, GA
Instructional Technology
M.S. 1994 The University of Memphis, Memphis, TN
Management Information Systems
B.S. 1991 The University of Memphis, Memphis, TN
Computer Science
A.S. 1980 Jackson State Community College, Jackson, TN
Business Administration
PROFESSIONAL EXPERIENCE:
2006 – present Director – Enterprise Systems and Services
Kennesaw State University
Kennesaw, GA
1998-2006 Director - Banner Student Information System
Kennesaw State University
Kennesaw, GA
1996-1998 Assistant Director of Student Financial Aid
Kennesaw State University
Kennesaw, GA
PRESENTATIONS AND PUBLICATIONS:
Dennison, T. W. (2007). Living Electronically. Paper presented at the Georgia Association of Student Financial Aid Administrators Fall Conference, Duluth, GA.
Dennison, T. W. (2007). Improving Service and Reducing Risks with Touchnet: KSU’s Experience. Paper presented at State System of Higher Education Chief Business Officers’ Meeting & the State System of Higher Education Administrative Committee on Information Technology. St. Simon’s Island, GA.
T. W. Dennison (2007). Improve the Quality of Data Used to Make Decisions Using Electronic Surveys. Paper presented at the Georgia Association of Student Financial Aid Administrators Spring Conference, Savannah, GA.
T. W. Dennison (2004). SSN to ID Conversion at Kennesaw State University. Paper presented at the State System of Higher Education Summit, Savannah, GA.

PROFESSIONAL SOCIETIES AND ORGANIZATTIONS:
2012-present KSU President‟s 50th Anniversary Planning Committee
2012-present State System of Higher Education CIO Advisory Council Secretary
2011 Gartner Academy for Leadership Development, Palisades, NY
2010-present KSU President‟s Strategic Thinking and Planning Committee
2009-present KSU Marketing Council
1998-present KSU Banner Committee (Chair)
1996-present KSU Information Technology Advisory Committee (ITAC)
2008-2009 KSU Administrators‟ Senate (President)
2007-2010 KSU NCAA Self-Study Committee
2007-2009 President's Planning & Budget Advisory Committee
2007-2009 KSU University Council
2007-2008 KSU Administrators‟ Senate (President Elect)
2007 Investment in Excellence, The Pacific Institute, Seattle, WA
2004-present State System of Higher Education CIO Advisory Council Member
2004 Georgia Board of Regents “Best Practice” Award Recipient
2000 Kennesaw State University “Administrator of the Year”
2000-2002 KSU Diversity Planning Council
1999 Managing Technical Professionals & Organizations, MIT
1998-present EDUCAUSE

ABSTRACT
CRITICAL SUCCESS FACTORS OF TECHNOLOGICAL INNOVATION
AND DIFFUSION IN HIGHER EDUCATION
by
T. Wayne Dennison
This case study surveyed faculty members and information technology
(IT) leaders within the State System of Higher Education (SSHE) and at Southern
Regional State University (SRSU) to examine their perceptions of technological
innovation, adoption, and diffusion in higher education. The data gathered identified
seventeen critical success factors affecting technological innovation, adoption, and
diffusion and was used to evaluate how the perceptions faculty compared to those of IT
leaders within a single university setting. Examining and comparing the perceptions of
these two groups regarding critical success factors for innovation, adoption, and diffusion
of technology provided insight into elements influencing technological innovation efforts.
This insight may be beneficial for enhancing future endeavors and building
collaborations.
Rockart‟s (1979) Critical Success Factor (CSF) model was used as the theoretical
framework for this research and a mixed methods research approach was used to examine
the perceptions of faculty and IT leaders. Data collection methods combined web-based
surveys for all participants and in-depth follow-up interviews with selected participants.
An initial survey was distributed to a peer expert group of 2,091 individuals to solicit
feedback regarding CSFs for technological innovation, adoption, and diffusion in higher
education. The responses to the initial survey were collected and categorized into a
compilation of seventeen CSFs. Separate rankings were calculated for the faculty and IT

leader groups as well as for the combined group of peer experts. This information was
used to determine the median CSF. The results and analysis of the initial survey were
used to inform the final survey instrument, which was distributed to all full-time and part-
time faculty and IT leaders at SRSU. A quantitative analysis was performed to gain a
better understanding of the similarities and differences of faculty and IT leaders‟
perceptions regarding the research topic. Information obtained from this study may be
used to provide additional insight regarding innovation, adoption, and diffusion of
technology for similar institutions.
Keywords: adoption, critical success factors, diffusion, information technology,
information technology leader, innovation

CRITICAL SUCCESS FACTORS OF TECHNOLOGICAL INNOVATION
AND DIFFUSION IN HIGHER EDUCATION
by
T. Wayne Dennison
A Dissertation
Presented in Partial Fulfillment of Requirements for the
Degree of
Doctor of Philosophy
in
Instructional Technology
in
the Learning Technologies Division
in
the College of Education
Georgia State University
Atlanta, GA
2013

Copyright by
T. Wayne Dennison
2013

ii
ACKNOWLEDGMENTS
This dissertation is the culmination of many years of hard work and dedication
and was only possible through the continued support of the faculty, staff, and fellow
students at Georgia State University, my colleagues at Kennesaw State University, and
my wonderful family. I am extremely grateful to Dr. Stephen Harmon for his continued
guidance, encouragement, and mentorship. I would also like to acknowledge my other
dissertation committee members from Georgia State University: Dr. Brendan Calandra
who has provided helpful guidance and leadership; Dr. Wanjira Kinuthia who has
provided insightful suggestions and direction; and Dr. Duane Truex who has given me
inspiration and support. I would like to thank my final committee member, Dr. Nancy
King, from Kennesaw State University, who served as an outstanding role model and has
given me encouragement and reassurance over the years. Thank you to my classmates in
the Instructional Technology program at Georgia State University, who have served as
sounding boards and provided me much needed support. A special thanks to my
colleagues at Kennesaw State University who have provided inspiration throughout the
past several years and Dr. Randy Hinds who has served as my mentor and provided me
with ongoing encouragement and support.
A special thank you to my wife, Angela, my daughter, Rachel, and my son,
Adam, who have always believed in me. I would like to thank them for their patience and
understanding throughout the past several years of coursework and the many hours of
research.
I am grateful to all the faculty and IT personnel who contributed to this study and
to all the scholars upon whose work built the intellectual foundation that made this
dissertation possible.

iii
TABLE OF CONTENTS
Page
List of Tables .......................................................................................................................v
List of Figures .................................................................................................................... vi
Abbreviations .................................................................................................................... vii
Chapter
1 THE PROBLEM ......................................................................................................1
Problem Statement ...................................................................................................3
Purpose .....................................................................................................................4
Research Questions ..................................................................................................5
Conceptual Framework ............................................................................................6
Operational Definitions ............................................................................................9
Summary ................................................................................................................10
2 REVIEW OF THE LITERATURE .......................................................................12
Diffusion of Innovations ........................................................................................13
Critical Success Factors .........................................................................................18
Motivating Factors .................................................................................................21
Barriers ...................................................................................................................25
University Environment .........................................................................................28
University Leadership ............................................................................................31
Organizational Change...........................................................................................36
3 METHODOLOGY ................................................................................................41
Research Questions ................................................................................................41
Research Design.....................................................................................................42
Setting and Participants..........................................................................................45
Protection of Human Subjects ...............................................................................47
Instruments .............................................................................................................48
Reliability and Validity ..........................................................................................49
Data Collection ......................................................................................................50
Data Analysis .........................................................................................................53
Limitations .............................................................................................................55
Summary ................................................................................................................58
4 RESULTS ..............................................................................................................60
Phase I ....................................................................................................................61
Peer Expert Group Characteristics .............................................................61
Critical Success Factors Identified.............................................................63
Phase II...................................................................................................................68
Interview Feedback Regarding Survey ......................................................69

iv
Previous Literature Feedback Loop ...........................................................70
Research Direction Validation ...................................................................71
Phase III .................................................................................................................72
Case Study Group Characteristics .............................................................73
Comparison of CSFs to Median CSF.........................................................77
SRSU Performance ....................................................................................82
Origination of Innovative Ideas .................................................................87
Information Sharing by Peers ....................................................................88
Information Sharing by Hierarchical Levels..............................................92
Phase IV .................................................................................................................95
Confirmation of Survey Results ................................................................96
Summary ..................................................................................................102
Research Process Flow ........................................................................................103
5 DISCUSSION ......................................................................................................104
Findings and Conclusions ....................................................................................104
Comparison of CSFs Identified to Previous Literature ...........................105
Discussion of Research Questions Based on Survey Results ..................114
Additional Information Gained from Study .............................................122
Implications..........................................................................................................125
Suggestions for Further Research ........................................................................129
Conclusion ...........................................................................................................130
References ........................................................................................................................132
Appendixes ......................................................................................................................136

v
LIST OF TABLES
Table Page
1 Data Collection Matrix ..........................................................................................51
2 Peer Expert Group Demographics .........................................................................62
3 Critical Success Factors Identified by Peer Expert Group.....................................66
4 Critical Success Factors as Reported by Faculty and IT Leaders ..........................68
5 CSFs Compared to Median CSF Group Statistics .................................................79
6 Independent Samples Test CSFs Compared to Median CSF.................................82
7 Institutional Performance Regarding CSFs Group Statistics .................................84
8 Independent Samples Test SRSU‟s Performance for CSFs ...................................86
9 Peers Share Technological Innovation Information Group Statistics ....................90
10 Independent Samples Test Peers Share Technological Innovation Information ...91
11 Hierarchical Levels Share Technological Innovation Information Group
Statistics ................................................................................................................94
12 Independent Samples Test Hierarchical Levels Share Technological Innovation
Information ...........................................................................................................95
13 CSF Comparison to Previous Studies by Beggs (2000) and Groves & Zemel
(2000) ..................................................................................................................110
14 Comparison of Faculty vs. IT Leaders Critical Success Factors .........................116

vi
LIST OF FIGURES
Figure Page
1 Diffusion of Innovations ........................................................................................14
2 Rate of Adoption ....................................................................................................16
3 Variables Affecting Innovation and Adoption .......................................................18
4 Case Study Research ..............................................................................................43
5 Research Phases .....................................................................................................45
6 Data Collection Timeline .......................................................................................51
7 Gender of SRSU Case Study Participants .............................................................73
8 Age of SRSU Case Study Participants...................................................................74
9 Highest Educational Level of SRSU Case Study Participants...............................75
10 Teaching Status of SRSU Faculty Participants ......................................................76
11 College Affiliation of SRSU Faculty Participants .................................................77
12 CSFs Compared to “Availability of Technology/Infrastructure” ..........................78
13 SRSU‟s Performance on CSFs...............................................................................83
14 Where Do Most Innovative Ideas Originate? ........................................................88
15 Peers Share Information Regarding Technological Innovation .............................89
16 Technological Innovation Information Shared Between Hierarchical Levels .......93
17 Research Process Flow Diagram .........................................................................103
18 Higher Education Critical Success Factor Innovation Model ..............................127

vii
ABBREVIATIONS
CIO Chief Information Officer
CSF Critical Success Factor
CTO Chief Technology Officer
DI Digital Innovation
ERP Enterprise Resource Planning
ICT Information and Communications Technology
IRB Institutional Review Board
IS Information Systems
IT Information Technology
SATO Senior Academic Technology Officer
SPSS Statistical Product and Service Solutions
SRSU Southern Regional State University
SSHE State System of Higher Education

1
CHAPTER 1
THE PROBLEM
The rapid pace at which information and communication technologies are
advancing, along with the growing demand from a knowledge-driven society, places
increased pressure on higher education institutions in terms of technological innovation
and diffusion (Tan, 2010). The high velocity at which technology is moving, as well as
the increased use of technology for teaching and learning, gives universities a vested
interest in technological innovation and diffusion efforts. Multiple definitions of
innovation have been proposed by different researchers; however, innovation commonly
refers to “the introduction of a new idea, method, or device” (White & Glickman, 2007,
p. 97). In today‟s world, there is frequently a focus on technology when addressing
innovation. This is largely because new technologies are often looked upon to provide
flexibility and to enhance operations for those institutions willing to invest the time and
energy in the adoption process (White & Glickman, 2007). According to Swanson and
Ramiller (2004), an essential question facing most organizations at some point is whether
to pursue technological innovation. Once this hurdle is surpassed, the logistics of how the
process occurs, as well as the timing in which it is accomplished, complicate the process
further. This dilemma affects higher education institutions in various ways because there
are multiple diverse groups on university campuses with differing, and sometimes
competing, goals and priorities. The task of fully understanding the nuances of a major
technological innovation and its potential uses based upon a particular organization‟s
circumstances is daunting (Swanson & Ramiller, 2004). Groups concerned with
technological innovation and diffusion on university campuses include faculty, staff,

2
students, administrators, and other invested parties. Faculty members comprise a primary
constituent group on university campuses and make use of many different technologies.
The ubiquitous use of technology by faculty and other constituent groups poses a
challenge for university information technology (IT) leaders, one which will likely
continue to escalate in the foreseeable future as new tools for teaching and learning
continue to emerge (Ingerman & Yang, 2011). Being able to meet this challenge, while
ensuring faculty members have an innovative atmosphere in which to be creative is a
major consideration of IT leaders on university campuses.
According to Wang and Patterson (2006), diffusion of technology is a complex
and difficult process, which is further complicated in a university environment due to the
innovative culture typically encouraged in this setting. Batson (2010) suggested that the
technological innovation environment in higher education is similar to children on an
exciting new playground where they want to try all the pieces of equipment at once. The
contention is that a child “running from apparatus to apparatus is analogous to the grand
tour education has been on for thirty years, the technology rapture grand tour” (Batson,
2010, p. 1). This depiction of higher education‟s relationship with technology is an
analogy that describes the chaos that technology can encourage. Technological
innovation takes many forms on a university campus and multiple constituents routinely
experiment with one new technology after another in search of a magic bullet. The goal
of this experimentation is often to resolve a particular issue, enhance teaching, improve
operations, or help showcase their campus (Batson, 2010). This activity often leads to the
identification of technological tools that help benefit not only the faculty and other

3
university employees, but also the students and, ultimately, the overall educational
process.
A common belief in the information technology industry is that technology
reinvents itself every three to five years. According to Powers (2000), the pace at which
technology changes in higher education is just as rapid, if not more so, than in other
arenas. The need to be innovative to stay current is paramount. This is especially true for
universities as they prepare to educate a growing number of students in an increasingly
competitive business world. Innovation and the diffusion of beneficial instructional
technologies is one way to address the expanding needs of students. The nature of
technology will likely continue to change and flourish, especially in higher education. An
educational environment promotes growth and fosters a culture where technological
advances are not only in demand, but expected. As part of this evolution, faculty and IT
leaders play pivotal roles in determining the best fit for technology in their particular
university context. A traditional African proverb says “If you want to go quickly, go
alone. If you want to go far, go together” (Author Unknown). By working together,
faculty and IT leaders may discover new technological innovations, leveraging these
tools to benefit their university and students more than if they work separately or toward
opposing goals. This collaboration will help enhance teaching and learning, better
preparing universities to meet the demands of today‟s students.
Problem Statement
When examining the use of technology on university campuses, it has been
estimated by educational researchers that approximately 40 billion dollars were spent in
the United States on developing an educational technology infrastructure and providing

4
training between 1997 and 2007 (Amiel & Reeves, 2008). This is a large investment that
promises to grow as the number of technological innovations and demands from students
continue to expand. However, an “infusion of educational technology on college and
university campuses for faculty and student use does not always result in its successful
integration into either instruction or the campus” (Amiel & Reeves, 2008, p. 35). Because
faculty members comprise a primary user group of technology on university campuses
and IT leaders are largely responsible for the implementation and support of the
technology, it is important to understand technological innovation, adoption, and
diffusion from each of these perspectives. Examining the technological innovation and
diffusion process through these lenses helped determine which factors are critical to
successful innovation and diffusion efforts in a higher education setting.
Purpose
The purpose of this study was to explore the perceptions of faculty and IT leaders
at Southern Regional State University (SRSU) regarding critical success factors
impacting technological innovation, adoption, and diffusion. The resulting data may be
used to help university faculty members and IT leaders gain a better understanding of the
critical success factors that help ensure efficacious technological innovation and diffusion
in a university setting. By investigating this phenomenon in this manner, each group may
gain new insight by seeing other perspectives and be better positioned to use the
information gained to support the technological innovation and diffusion process on their
campus. Leveraging the information from this study, faculty and IT leaders may be able
to create new synergies through collaboration. The results of this study may be used by
similar institutions to understand technological innovation and diffusion from both

5
faculty and IT leaders‟ viewpoints. The results also allow insight into critical success
factors that support innovation and diffusion processes as determined by a peer
institution.
Surry and Brennan (1998) indicated that a major shortcoming of most research
presented in the area of adoption and diffusion of technology was that is focused on a
single group of adopters. This research study examined technological innovation,
adoption, and diffusion from the perspectives of two key groups on university campuses,
faculty and IT leaders. Examining the innovation process from the perspectives of these
two factions helped identify potential issues with making “adoption decisions at different
times and often with minimal interaction with one another” as well as the “competing
interests” of the two groups (Surry & Brennan, 1998, p. 3). In addition, this study
provided additional insight into technological innovation and adoption processes by
recognizing the multiple adopter groups involved and helped illustrate how “people at
different levels in an organization influence each other‟s decision to adopt or reject an
innovation” (Surry & Brennan, 1998, p. 3). As part of a larger system, each constituent
group has an impact on the outcomes related to the other constituent groups. When
studying technological innovation, adoption, and diffusion, faculty and IT leaders have a
discernible relationship. Each of these groups has a different connection to the
technology itself, but relies upon the other for the successful implementation and use of
the innovation.
Research Questions
The following research questions were examined:

6
1. What are the critical success factors for technological innovation and adoption as
reported by faculty?
2. What are the critical success factors for technological innovation and adoption as
reported by IT leaders?
3. How do faculty members‟ perceptions of critical success factors for technological
innovation, adoption, and diffusion compare to those of IT leaders?
Conceptual Framework
The research for this study was approached using Rockart‟s (1979) Critical
Success Factor (CSF) theory which defines critical success factors as the "limited number
of areas in which results, if they are satisfactory, will ensure successful competitive
performance for the organization” (p. 85). This technique is often used in business
environments to identify how an organization can become more competitive; however,
CSF studies can be “valuable for making sense out of problems where there are many
potential factors influencing the outcome” (Lam, 2005, p. 176). In this study, the CSF
theoretical perspective was used to identify critical success factors of technological
innovation and diffusion in a university setting where many different variables may have
an impact on the adoption and diffusion process. The information obtained through this
research may be used to help set priorities more knowledgeably and allow scarce
resources to be managed more efficiently (Bullen & Rockart, 1981). The CSFs identified
by a statewide peer expert grouping were ranked by faculty and IT leaders on SRSU‟s
campus to help identify which factors each group perceived as most critical to successful
innovation efforts.
When discussing the CSF approach, Bullen and Rockart (1981) presented five
main sources of critical success factors to consider. These sources included: 1) industry;

7
2) competitive strategy and industry position; 3) environmental factors; 4) temporal
factors; and 5) managerial position. Bullen and Rockart (1981) contended that critical
success factors are industry-specific or activity-specific and are determined by the
characteristics associated with the individual entity being reviewed (e.g. in higher
education, industry related critical success factors might include program and course
offerings, housing options, total cost of attendance, etc.). Competitive strategy and
industry position refers to the notion that each organization is affected by its prior history
and current competitive position within the overall industry (e.g. universities have their
individual histories and reputations to rely upon to help them attract and retain students)
(Bullen & Rockart, 1981). Competitive strategy and industry position allows higher
educational institutions either a better or worse competitive position in relation to their
peer institutions. Environmental factors are defined as those things that are beyond the
scope of control of an organization. Two environmental factors that impact almost every
organization are economic fluctuations and political mandates (Bullen & Rockart, 1981).
This is evident in higher education as universities see enrollment fluctuations based on
the performance of the economy and often have to implement and/or adjust processes and
procedures as governmental policies are created, changed, or discontinued. According to
Bullen and Rockart (1981), temporal factors are those things in an organization which
become critical for a specific period of time because of an event or condition occurred
outside the usual environmental stasis of the institution. An example of a temporal factor
is the sudden loss of a key leader or other crisis on a university campus which shifts the
focus to a factor which otherwise may not be considered critical. Finally, Bullen and
Rockart (1981) stated that managerial position is the idea that any position within an

8
organization with functional managerial responsibilities has its own corresponding set of
generic critical success factors. In this study, managerial position is equivalent to the
responsibilities that faculty have to provide quality instruction to their students and that
IT leaders have to provide the infrastructure, resources, and support needed for
technology on their campus.
Technological innovation and diffusion in higher education is a vital
consideration for universities, especially as technology becomes more ubiquitous and the
expectations of students continue to rise. According to Rogers (1995), diffusion occurs
over time and typically adheres to a cycle of slow growth, followed by a period of rapid
acceleration until a saturation point is reached and then followed by a period of decline.
Not all innovation efforts are successful; certain attributes of innovation and diffusion
help lead to successful innovation efforts while others lead to failure. Conducting a study
of innovation and diffusion using critical success factors as a theoretical basis helped
provide a better understanding of the overall process and facilitated the gathering of
information that can help lead to more successful innovation efforts or assist in predicting
successful innovation efforts. Ascertaining this information from the perspectives of both
faculty and IT leaders provided data for making adjustments in the diffusion process to
gain more support from the corresponding groups. For instance, by gaining an
understanding of the critical success factors from the faculty‟s perspective, IT leaders
may better target communication and training regarding new technology initiatives to
help acquire the support of faculty. By developing an understanding of the critical
success factors from the IT leaders‟ perspective, faculty may be better positioned to

9
garner resources and support for their innovation efforts by using this information to
enhance their requests.
Operational Definitions
The following operational definitions will be used throughout this study:
Adoption – Adoption refers to the process by which a technology is chosen
for use by an individual or organization.
Chief Information Officer Advisory Council – The Chief Information
Officer Advisory Council comprises approximately 70 information
technology leaders from each of the higher education institutions in the
State System of Higher Education who serve in an advisory capacity to the
system‟s Chief Information Officer.
Critical Success Factor – Critical Success Factors are the "limited number
of areas in which results, if they are satisfactory, will ensure successful
competitive performance for the organization” (Rockart, 1979, p. 85).
Diffusion – Diffusion is “the process by which an innovation is
communicated through certain channels over time among the members of
a social system” (Rogers, 1995, p. 35). Diffusion may occur at varying
rates throughout an organization. Rogers (1995) suggested that diffusion
occurs on a continuum whereby innovations begin diffusing slowly,
gradually increasing over time before a rapid and dramatic growth phase
followed by an eventual decline.
Digital Innovation Group – The Digital Innovation Group consists of
approximately 2,200 faculty and staff throughout the State System of

10
Higher Education who have a dedicated interest in technological
innovation, especially as it relates to teaching and learning.
Information technology – Information technology refers to the division
within a university that provides the technological infrastructure and
support for all technology related items. This includes, but is not limited
to, network infrastructure, computer hardware, software applications,
audio-visual technologies, administrative technology systems, technology
helpdesk, training functions, etc.
Information technology leader – Information technology leader refers to a
senior level technology leader within a university (e.g. Chief Information
Officer, Chief Technology Officer, etc.) as well as primary or secondary
leaders of departments within the technology division.
Innovation – Innovation is “the introduction of a new idea, method, or
device” (White & Glickman, 2007, p. 97). For the purposes of this study,
the focus will be on technological innovation, which requires a technology
component to be present within the innovation or be the innovation itself.
Peer experts – Peer experts will consist of individuals from the Digital
Innovation Group and the Chief Information Officer Advisory Council for
the State System of Higher Education.
Summary
This study focused on technological innovation and diffusion in higher education
in an attempt to determine critical success factors impacting this process. According to
White and Glickman (2007), it is imperative that universities continually examine their

11
internal processes to ensure that they are using technology efficiently and effectively to
help leverage the benefits made available by technological innovations. The information
uncovered through this research may be used to better understand the factors that help
ensure successful technological innovation and diffusion on SRSU‟s campus, which will
aid the efficient allocation of resources and effective support for those items that are most
critical. Approaching this research from Rockart‟s (1979) CSF theory and by focusing on
these factors from the perspectives of both faculty and IT leaders, a comparison was
performed to determine similar and dissimilar ideas these groups have in terms of
technological innovation and diffusion. The similarities identified may be used to help
create collaborations and build synergies to promote technological innovation further
while the differences identified may be used to help close the perceived gap between
faculty and IT leaders, creating better partnerships to drive future innovation efforts.

12
CHAPTER 2
REVIEW OF THE LITERATURE
This literature review investigated studies which examined and provided insight
into technological innovation, adoption, and diffusion. It specifically targeted articles
which explored the roles of faculty and IT leaders in the innovation and adoption process.
This review inspected contemporary literature regarding diffusion of innovations and
looked at the process of adoption by reviewing the multiple components involved. This
review investigated articles that examined factors which helped facilitate innovation as
well as those that deterred technological innovation and adoption. The literature reviewed
also examined critical success factors, those things which an organization must do well to
be successful, as this theoretical perspective pertains to technology-related initiatives.
Additionally, the literature discussed outlines the unique nature of a university
environment and presents challenges encountered by both faculty and IT leaders in the
innovation and adoption process. Since both faculty and IT leaders hold essential roles in
technological innovation and adoption in higher education, their input is crucial to the
successful adoption, implementation, and long-term use of technology.
Exploring technological innovation and diffusion from different perspectives
allowed the relationship between faculty and IT leaders to be studied in greater depth.
Articles regarding different cultures in academia and their relevance to technological
innovation and adoption were examined in this literature review. Relevant studies that
focused on technological innovation and adoption as a change process and the
examination of its effect on universities were also investigated. This line of research
chronicled the disruption that can occur because of technological innovation and adoption

13
by providing insight into the management of the resulting change. The dynamics of the
various relationships involved and other variables associated with technological
innovation and adoption are important considerations; therefore, this literature review
looked collectively at articles which addressed these topics.
Diffusion of Innovations
Researchers have approached technological innovation in organizations from
different perspectives. Rogers‟ 1995 Diffusion of Innovation theory is a model which
focused on the individuals who use the innovation instead of the innovation itself
(Antonacci, 2002; Gallivan, 2001; Groves & Zemel, 2000; Hall, 2010; Jacobsen, 1998;
Jazzar & Friedman, 2007). Rogers‟ (1995) model (see Figure 1) classified participants
based on their propensity to explore the use and adoption of new technologies. The
different classifications presented in Rogers‟ (1995) model were innovator, early adopter,
early majority, late majority, and laggard. The difference between each classification
depends upon the timeframe in which the participant begins using the technology and is
further defined based upon the continuum of the adoption lifecycle. This model also
provided a clear distinction when defining innovators as they compare to the other
adopter groups. The innovators are on the front end of the product curve and are often the
catalysts that take the lead in organizations by introducing and promoting new
technologies. The innovation process can be time-consuming because engaging with new
technologies is a task that is often added to the regular workload of the innovator;
however, this process provides opportunities for innovators to benefit by finding
technologies to help streamline instructional workload and assist with other time-
consuming tasks. A potential drawback faced by innovators is the time and effort needed

14
to explore and scrutinize many different technologies before finding one that is deemed
viable for long-term use. In contrast, the adopters typically follow the innovators when
embracing new technologies and may make decisions to adopt technological innovations
based on the innovators‟ initiatives. Adopters commit to an innovation for a variety of
reasons, ranging from encouragement by an innovating colleague to an official mandate
from higher levels within the organization.
Source: Rogers (1995)
Figure 1. Diffusion of Innovations

15
Rogers‟ (1995) model also classified adopters based on the speed in which they
adopt new technological innovations. Figure 1 illustrates how the number of adopters
starts out slowly and accelerates until a mid-level is reached and then gradually declines.
Many of the research studies reviewed focused on how innovation and the adoption
processes occur in an academic environment (Abrahams, 2010; Butler & Sellbom, 2002;
Baltaci-Goktalay & Ocak, 2006). Abrahams (2010) used adoption and diffusion theory to
conduct a mixed methods case study which examined how faculty and administration
react to the introduction of an innovation into their university environment. This research
found that even though universities stressed the infusion of technology into the
instruction and learning process, faculty were generally slow to adopt and integrate
technology into their instruction (Abrahams, 2010). By assessing the information
surrounding technological innovation and adoption in a higher education arena,
Abrahams (2010) developed a framework to help identify and prioritize items which
affected the successful use of technology in instruction. A research study conducted by
Butler & Sellbom (2002) at a large public university found that “the rate of adoption
usually starts low, accelerates until about 50 percent of the community has adopted the
technology, then decelerates, eventually approaching zero, as nearly everyone in the
community has adopted the technology” (p. 22). This observation supported Rogers‟
(1995) Rate of Adoption theory (see Figure 2) that contended that diffusion is a process
that occurs over time, starting out more slowly before accelerating and eventually
peaking before a decline (Baltaci-Goktalay & Ocak, 2006). The research reviewed
outlined many factors which may impact the pace of adoption and diffusion of a
particular technological innovation and must be analyzed to better understand its

16
associated adoption rate (Butler & Sellbom, 2002). This research also found that factors
affecting adoption and diffusion of an innovation included items such as the
characteristics of the innovation itself as well as numerous sociological, organizational,
psychological, and economic variables (Butler & Sellbom, 2002). By examining these
factors and the interaction between them, a better understanding may be gained of how
variables can impact how quickly – or if – an innovation is adopted within an
organization.
Source: Rogers (1995)
Figure 2. Rate of Adoption

17
Rogers (1995) outlined several variables that impact technological innovation and
adoption as illustrated in Figure 3. Factors affecting the adoption of technologies include
the speed at which an innovation is adopted and the ability of its benefits to be recognized
so that they may be capitalized upon. Understanding the characteristics of an innovation
and how it can be beneficial to the instructional process may help faculty develop a
greater inclination to adopt and use technology. Based on their busy schedules, faculty
may be apprehensive to devote the time necessary to incorporate a new technological
innovation into their instruction. In addition to faculty, the concept that university
leadership exerts influence in the adoption and diffusion of technology is supported by
Toledo‟s (2005) contention that there is “a need for university leadership at all levels to
support innovation, both monetarily and organizationally” (p. 184). IT leadership is
crucial when reviewing technological innovation and adoption on university campuses
because decisions to provide the funding and support for technological innovations are
often made at higher levels within the university structure. These decisions require the
commitment and support of informed IT leaders who have access to available resources
and the IT teams who are responsible for providing the frontline support (i.e. hardware
and software installation, training, ongoing support, etc.).

18
Source: Rogers (1995)
Figure 3. Variables Affecting Innovation and Adoption
Critical Success Factors
According to Lam (2005), the critical success factor approach has been widely
used in information systems (IS) research. Multiple studies were reviewed that
incorporated the CSF theoretical perspective when examining technological integration in
organizations (Kyung-Kwon & Young-Gul, 2002; Lam, 2005; Nah, et al., 2003; Remus
& Wiener, 2010; Singh & Sharma, 2010; Wannasiri, et al., 2012). However, few studies
were identified that used a critical success factor perspective when investigating
experiences in higher education. Both the Kyung-Kwon and Young-Gul (2002) and Nah,
et al. (2003) studies researched critical success factors of enterprise resource planning
19
(ERP) system implementations. ERP systems are those systems that support the basic
functions of the organization; for instance, most ERP systems in higher education support
the Admissions, Registrar, Financial Aid, Bursar, Human Resource, and Finance and
Accounting functions. Kyung-Kwon and Young-Gul (2002) specifically focused on the
high failure rate of ERP systems and demonstrated that organizational context was
critical for their successful implementation. Nah, et al. (2003) surveyed Chief
Information Officers (CIOs) at Fortune 1000 companies to gain insight into critical
factors impacting successful ERP system implementations. The information obtained
through this study was used to provide guidance for implementations of operational
systems.
Remus and Wiener (2010) approached critical success factor research from two
perspectives. One aspect of this study examined critical success factors of portal
implementations within multiple international organizations. Remus and Wiener (2010)
solicited information during this phase of their research to help create an exchange of
ideas between areas of research and practice; this information was proposed to drive
planning for future implementations. Much like Kyung-Kwon and Young-Gul (2002),
Remus and Wiener (2010) identified context as a critical element for system
implementations. “CSFs cannot be isolated from their research context nor necessarily
applied directly to practice” unless necessary adjustments are made (Remus & Wiener,
2010, p. 28). Another aspect of the study conducted by Remus and Wiener (2010) looked
at critical success factors of offshore software development. In both avenues of their
research, Remus and Wiener (2010) performed expert interviews and literature reviews to
identify critical success factors. They used the information obtained from their research

20
to develop client surveys that were used to identify and rank the critical success factors.
Singh and Sharma (2010) conducted related research by examining critical success
factors of IS implementations. Their study compared the information obtained to the
strategies used by the different organizations to help illustrate the value of CSF research
in planning IS implementations.
According to Wannasiri, et al. (2012), “information technology is increasing in
importance in education and is becoming much more prevalent” (p. 853). Their research
examined critical success factors that impacted e-learning in developing countries.
Wannasiri, et al. (2012) focused on critical success factors from the perspectives of two
stakeholder groups: Information and Communications Technology (ICT) experts and
faculty. Wannasiri, et al. (2012) used a Delphi technique to examine the different
dimensions of critical success factors on e-learning adoption and ranked them based on
feedback from the survey participants. In addition to context, this research identified six
factors critical to e-learning adoption in developing countries. These factors included 1)
learners‟ characteristics; 2) instructors‟ characteristics; 3) institution and service quality;
4) infrastructure and system quality; 5) course and information quality; and 6) motivation
(Wannasiri, et al., 2012). This study attempted to identify information useful in assuring
the success of future e-learning initiatives in developing countries by focusing on the
perspectives of the two key groups involved for the purpose of prioritizing the critical
success factors and identifying practical implications. Each of the studies discussed
focused on different aspects of technological initiatives by examining them using a
critical success factor theoretical framework.

21
Motivating Factors
Several studies discussed motivational factors that encouraged faculty to use new
technologies and led to successful adoption and diffusion practices (Chism, 2004; Cook,
2012; Dispensa, 2011). Chism (2004) discussed a framework for the engagement of
faculty in the use of instructional technologies and indicated that faculty members were
vital to the successful use of instructional technology in a university setting. The
framework presented by Chism (2004) contended that many aspects should be considered
when researching motivating factors impacting faculty‟s technological innovation and
adoption activities. Motivating factors identified that may help foster an innovative
climate included leadership, the use of incentives or rewards, policies and procedures,
and available resources (Chism, 2004). In Chism‟s (2004) article, several observations
were made regarding models for supporting and encouraging faculty to adopt
instructional technologies. These observations included the need for proper training,
coaching opportunities by experienced peers, an adequate reward structure, accounting
for the different motivations among faculty, and good working relationships between
individuals with expertise in instructional design and those in technology. Establishing
sustainable working relationships can help facilitate the coordination of the teaching
mission of the academic division with the strategic mission of the technology division.
Chism (2004) suggested that “centralized and distributed support for faculty using
instructional technology must be organized in a way that connects those who know about
learning theory and teaching strategies and those who know about technology” (p. 44). It
is vital that faculty and technology leaders are aligned and work together to meet the

22
goals of the university. This collaboration will help support the efficient allocation of
resources and allow universities to realize the benefit of using technological innovations.
Cook‟s (2012) investigation used a meta-analysis approach to examine data from
thirty-eight studies conducted at universities across the United States and Europe
regarding faculty participation in distance education. From this research, Cook (2012)
found that a lack of top level support within the academic units and at the university level
was ranked in the top ten motivating factors affecting faculty‟s decision to participate in
teaching online. The results of this study represent the impact of university leadership
support on technological adoption. This study showed that university faculty members
believed that it was critical to have the support from their administrative leaders when
working with technological innovations. Upper level support, including that from IT
leadership, plays a key role in the successful adoption of technology and the
incorporation of that technology into the instructional process by faculty. Albright and
Nworie (2008) argued that every university should designate a senior academic
technology officer (SATO) to ensure that strategic leadership and direction is adequately
provided for technology applications and initiatives in the academic division. Many
colleges and universities have one position that fulfills the duties of both the SATO and
CIO; however, in larger universities it may be more practical to have two separate
positions to accommodate the needs associated with a large population. It is important to
note that a senior level position, which is informed and aware of the academic technology
needs on campus, will be able to better address and support technological needs on a
strategic level.

23
Dispensa (2011) surveyed faculty at a medium-size private university and
identified several motivating factors for faculty when deciding to integrate technological
innovations with teaching. This study identified the top five motivating factors as
reported by faculty when considering instructional technologies. These factors included:
1) enhancing teaching ability, 2) facilitating access to course materials, 3) addressing
different learning styles, 4) facilitating communication, and 5) saving time (Dispensa,
2011). The results of this study indicated that faculty members were largely concerned
with how innovations incorporated into their teaching impacted the students. This study
also revealed that while faculty members primarily strived to enhance the teaching and
learning process for students, they also searched for instructional technologies that
offered instructional management tools which provided time savings components.
Successful innovations require support from both the faculty that use them and from the
leadership groups on campus who are involved in making technology adoption decisions.
Baltaci-Goktalay and Ocak (2006) found that a combination of bottom-up and top-down
decision making processes worked best to ensure the successful technology adoption.
Top level support for innovations can be “beneficial by speeding up decisions that might
otherwise be difficult” to make; however, “the impetus for the innovation frequently
grows from individual users of the technology and moves through the institutional
administration to commit to adoption of the technology” (Baltaci-Goktalay & Ocak,
2006, p. 38). This research helped define the importance of the relationship between
faculty and the IT leaders when examining technological innovation and adoption in a
university environment. Faculty often initiate the review and selection of technologies,
but the adoption of a technology has a higher likelihood of success when campus-wide
24
support is attained. Much of the research regarding motivational factors impacting
technological innovation in higher education suggested that the adoption process
occurred more quickly and with less resistance when the users of the innovation
recognized the benefits to be gained. The adoption process was also enhanced when the
university leadership responsible for providing the funding and resources to support
innovation realized and understood the benefits and significance of the innovation‟s use.
Mumtaz (2000) presented information from multiple studies that researched the
use of ICT by teachers across the U.S. This research identified three factors that led to the
successful use of ICT by teachers. These included “teacher motivation and commitment
to their students‟ learning and to their own development as teachers,” “the support they
experience in their schools,” and “access to sufficient quantities of technology” (Mumtaz,
2000, p. 324). Mumtaz (2000) contended that the teacher must believe in the benefits of
using the technology and be able to envision its effectiveness on the learning process for
both themselves and their students. Support is a key factor to foster the successful use of
technology in the classroom. Faculty members are expected to innovate without being
allowed extra time or incentive to do so. By having the support of their supervisors and
upper management, they are often provided more latitude in exploring and incorporating
innovation solutions to teaching in their curriculum. Lastly, access to technology is
vitally important because if technology and related resources are not provided for faculty
to experiment with and incorporate into their classroom instruction, it can present
daunting obstacles to technological innovation which may be difficult or impossible to
overcome.

25
Barriers
A variety of articles discussed the barriers associated with innovation in higher
education. The articles reviewed provided insight into critical success factors of the
innovation and diffusion process through their discussion of barriers to innovation.
Universities provide a unique environment for technological innovation and diffusion.
Faculty members are often interested in using innovative technology in the classroom;
however, as with any environment seeking to advance technology, they may encounter
barriers associated with technological innovation and diffusion. Researchers have
identified several common barriers that must be overcome for an innovation to be
successfully adopted in the classroom (Butler & Sellbom, 2002; Dispensa, 2011; Rogers,
2000; Schneckenberg, 2009). Butler and Sellbom (2002) identified three main barriers to
the adoption of technology. These included: 1) the reliability of the technology; 2) the
time and effort it takes to learn to use new technology; and 3) the level of institutional
support afforded to faculty throughout the adoption process. Research showed that to
address these barriers, faculty often seek support from the university‟s IT departments.
The responsibility for ensuring that the technology in use on a college campus is fully
available and reliable traditionally falls on the IT staff and their leadership. Their goal is
to help establish an environment that supports the ubiquitous use of technology. IT
groups also are responsible for providing training for faculty to help facilitate the
effective use of technology when developing and managing instructional content.
Obtaining the necessary training has been shown to be essential for faculty to become
confident in successfully incorporating technology into instructional use. Groves and
Zemel (2000) conducted an action research case study to identify factors that affected the

26
adoption of instructional technology in a university setting. Administrative support was
reported as a pivotal influencing factor impacting the use of instructional technology by
80% of their study participants. Campus IT administrative services were integral to
providing support for new instructional technologies requiring “a systematic
infrastructure,” which included “hardware, appropriate software, and training as was
previously needed when personal computers were first introduced in educational settings”
(Groves & Zemel, 2000, p. 62). This research suggested that technology leadership was
crucial to successful innovation, adoption, and diffusion efforts in this study.
Dispensa (2011) conducted research in a university setting to identify barriers
affecting technological adoption by faculty. Barriers identified in Dispensa‟s (2011)
study included: 1) the time required to investigate and incorporate technologies into their
teaching; 2) difficulty keeping pace with technological changes; 3) lack of technical skills
required to make the best use of the technological innovations; 4) lack of knowledge on
how to best integrate technology into teaching; and 5) lack of financial support. These
barriers are consistent with the findings of Butler and Sellbom (2002) as both studies
addressed the need for institutional backing through training, support, and funding.
Dispensa (2011) found that the primary barrier for technological innovation and adoption
was the time involved by faculty in researching the uses of instructional technologies and
incorporating the technologies into teaching. Faculty members reported that in order to
invest the time required to investigate and pursue technological innovation and adoption
it was important to receive the necessary support. To address this concern, IT leaders can
make technological tools available to faculty and provide training and support to make
the use of these technologies more efficient and effective. Many of the barriers presented

27
by Dispensa (2011) addressed the need for sufficient training to help mitigate faculty‟s
fear of staying current with technology and incorporating technological innovations
effectively into their instruction. This is especially important considering the rapid pace
of technological advancement and the training needs associated with innovation in
today‟s universities.
In researching barriers to adopting emerging technologies in higher education,
Rogers (2000) found that a lack of institutional support, ranging from encouragement by
administration to experiment with new technologies to providing adequate funding for
technology purchases and corresponding support dramatically hindered the diffusion of
new technologies within a higher education institution. Decisions made regarding
funding for technology initiatives can help determine the success or failure of a
technological innovation. Rogers (2000) stated that unless funding for technology was
appropriately allocated it was wasted. Waste of this nature perpetuates negative attitudes
toward the technology creating an even bigger barrier to the adoption process. IT leaders
have a responsibility to provide support for technologies that benefit administrative and
instructional innovations while maintaining budgets and avoiding wastes. Antonacci
(2002) researched universities‟ integration of technology into instruction and found that
universities were heavily investing in instructional technologies, but needed to consider
both tangible (e.g. hardware, software, etc.) and intangible (e.g. expertise, access, etc.)
aspects of technology to achieve successful adoption and diffusion. Not only are
university IT groups instrumental in the purchase, installation, and support of hardware
and software, they are also responsible for providing the proper training to help faculty
develop the expertise needed to use the technologies effectively. IT units on university

28
campuses are charged with providing both the tangible and intangible components of a
technological innovation; they have the responsibility to safeguard access to the
technology and ensure it is provided and maintained in a secure and reliable manner.
University Environment
Groves and Zemel (2000) stated that “much like the societal changes earlier in
this century, such as the Great Depression and the civil rights movement, the technology
revolution is challenging and redirecting all forms of education, including higher
education” (p. 57). Universities must be able to embrace this ongoing revolution and
prepare their faculty to take advantage of technological innovations to enhance the
teaching and learning process. Universities are sometimes thought of as slow to adopt
change. This may be because the “basic model of higher education that exists today was
created in the 11th century, operates on a 19th-century calendar, yet is supposed to
prepare students for the life in the 21st century” (Mehaffy, 2012, p. 26). This statement
suggests that change in the higher education arena is important and that it is necessary to
secure involvement from integral members of the university to encourage functional
support for change. Studies have shown that when reviewing technological innovation
and diffusion, faculty and administrative leadership, especially IT leadership, are vital to
take into account. Groves and Zemel (2000) indicated that to effectively ensure the
adoption of viable new technologies by faculty, they must perceive that the necessary
infrastructure is in place to support the technology‟s use for teaching and learning. This
research supports the relevance and importance of the relationship between faculty and
university IT leaders.

29
Schneckenberg (2009) contended that the full innovative potential of instructional
technologies has yet to be recognized and exploited. This topic was examined in more
depth through a study that focused on the underlying structural and cultural barriers
encountered by university faculty when using technology-enhanced innovations
(Schneckenberg, 2009). This research gave a different perspective regarding barriers
encountered by faculty when innovating or adopting new technologies by examining the
organization and cultural aspects of universities. Differences may be largely attributed to
how universities are structured and the academic culture that exists in the higher
education environment. Universities have an operational component similar to non-
academic organizations, which requires operational technologies to help support the
functions associated with running an organization on a day-to-day basis. In contrast to
other organizations, the primary function of higher education is to provide education to
students. This function is principally supported by the academic branch of the university.
This environment brings to the surface two perspectives within the university: the
academic and administrative use of technology (Schneckenberg, 2009). Both of these
have very different viewpoints and missions which further supports the idea faculty and
IT leaders must work together to successfully address many of the barriers that exist in
the technological innovation and adoption process. Faculty participation is needed to
investigate new and innovative technologies and determine the best uses for these
technologies in the classroom. IT leaders must provide the necessary infrastructure and
support to allow faculty to successfully optimize the use of technological innovations.
Academic departments and individual faculty members often search for ways to
help improve the learning experience for their students and rely on technological

30
innovation to assist in this endeavor. Several studies have explored innovation and
adoption by faculty to gain a better understanding of technological innovation and
adoption in a university setting (Abrahams, 2010; Ajjan & Hartshorne, 2008; Antonacci,
2002; and Groves & Zemel, 2000). Abrahams (2010) researched how faculty and
administration in a university setting responded when a new innovation was introduced
and found that even though universities exhibited an increasing commitment to
incorporate information technology into the academic culture, faculty were typically slow
to integrate technology into their instruction. Educational quality was a main concern of
universities studied, however, the “infusion of educational technology on college and
university campuses for faculty and student use does not always result in its successful
integration into either instruction or the campus, nor does it mean that the quality of
education has improved” (Abrahams, 2010, p. 35) The lack of certainty surrounding the
benefits of incorporating technological innovations into the instructional environment
may have a direct impact on the pace at which faculty choose to adopt technologies into
their course curriculum.
The evolutionary nature of technology is a primary consideration when reviewing
technological innovation and adoption in higher education. Ajjan and Hartshorne (2008)
stated that the use of technology to support in-class learning has evolved over the
decades. To illustrate this point, Ajjan and Hartshorne (2008) conducted a study that
reviewed university faculty‟s awareness regarding the use of Web 2.0 technologies and
their decisions on whether to adopt these tools for use in their courses. The goal of this
research was to determine if faculty were aware of the benefits of using Web 2.0
technologies to supplement their in-class instruction and to identify contributing factors

31
that impacted their decision to use those technologies. Even when provided with the
tools, resources, training, and support necessary for new technologies, faculty
involvement in the innovation and adoption of useful technologies was shown to be
challenging; however, it was ultimately the faculty‟s decision to use (or not use) the
technologies to support or enhance their instruction (Ajjan & Hartshorne, 2008). To
encourage an innovative environment, faculty need to be involved in the innovation and
adoption process because they are able to identify the benefits technology offers.
Antonacci‟s (2002) meta-analysis reviewed theories of innovation and technology
adoption in higher education and surmised that the integration of technology into
instruction is a complex process and that there is not a simple plan or formula to success.
This is especially true today as faculty members attempt to make sense of the myriad of
technological innovations available and make decisions regarding the adoption of these
technologies. This process can be arduous for faculty as “those who want to improve
instruction through technology must apply what is known, research what is unknown, and
engage in the daily struggle that emerges as we seek to change and improve” (Antonacci,
2002, 22). Antonacci (2002) contended that a crucial factor affecting the successful
adoption of technological innovations, and a driving force which allowed universities to
fully realize the benefits of technological innovations, was their ability to balance all
aspects of the adoption process simultaneously.
University Leadership
According to Patterson (1997), “to lead is to influence others to achieve mutually
agreed upon and socially valued goals that help an organization stretch to a higher level”
(p. 5). This view stresses the importance of examining the perceptions of university

32
leadership when reviewing technological innovation and diffusion in higher education.
Included in the responsibilities of university IT leaders is the ability to work with
executive level groups to examine variables from external environments and decide how
these variables impact technological strategy. This allows the strategies developed to be
aligned to best leverage external conditions while staying true to the core mission of the
university (Abel, 2007). This process represents the higher order strategic responsibilities
of IT leadership in contrast to the operational responsibilities that directly relate to the
users of the technological innovations. In university settings, a large number of
technology users are represented by faculty. To help illustrate the dichotomy of
technological innovation found on university campuses, Metros (2010) described how IT
leadership is typically alienated from their faculty clients. Both faculty and IT leaders are
significantly involved in determining the success or failure of technological adoption
efforts though they often have divergent goals. Metros (2010) indicated that a gap exists
between the strategic direction of many IT groups and the needs of faculty on university
campuses. A major challenge of technological innovation and adoption in a university
setting is bridging the gap between technology and academics. Administrative leadership
and support is one of the most critical factors impacting the successful adoption of
technological innovations in a higher education setting (Antonacci, 2002). The
administrative level within the university is typically responsible for providing financial
resources for technology initiatives as well as setting expectations, providing incentives
and encouragement, and developing the overall technology vision and plan for the
university (Antonacci, 2002). IT leadership is responsible for providing technical support
which “not only includes the personnel for maintaining the technology, but it also

33
includes personnel who are knowledgeable about pedagogical issues, such as appropriate
instructional methods and media” (Antonacci, 2002, p. 3). The innovation fidelity of
faculty and IT leaders will play a major role in universities‟ ability to cultivate an
innovative culture and leverage technologies in new and creative ways.
Studies have shown that effective IT leadership as well as faculty dedication and
involvement are both important for encouraging technological innovation and adoption
on university campuses. “IT departments are often guilty of offering services that are
technically complex, user unfriendly, poorly communicated, and perceived as changing
too rapidly” (Metros, 2010, p. 54). To complicate matters further, many technology
systems implemented on university campuses are based on technical requirements chosen
solely by IT groups and may not be the most effective tool for a member teaching classes,
conducting research, and advancing scholarship (Metros, 2010). Research has shown that
IT leaders must be cognizant of the needs of the campus community and make the effort
to ensure that technology support needs are met. IT leadership has the responsibility of
cultivating an environment conducive to technological advancement and innovation as
well as establishing a support structure to facilitate the successful adoption of those
technologies. Conversely, faculty can sometimes become impatient with technology and
not invest the time required to learn new systems. A primary concern of faculty is to not
“look incompetent in front of their students when the technology doesn‟t work for them”
(Metros, 2010, p. 55). According to Chism (2004), faculty should be engaged in
technological innovation on university campuses because they are critical to the
innovation and diffusion process. Both faculty and IT leaders have ownership in the
innovation and diffusion process and should seek to elicit an understanding of the

34
relationship by embracing different perspectives, ultimately working together for the
advancement of the university‟s technology mission.
“Creating an organizational culture that embraces a philosophy of continuous
innovation requires leaders to invest, nurture and sustain an open, collaborative
environment in which innovation is viewed as a long-term journey” (Modi, 2011, p. 31).
This journey requires investment from multiple constituent groups, including faculty and
IT leadership. Several studies have outlined the importance of relationship building by
university IT leaders to encourage an innovative atmosphere (Chester, 2006; Chism,
2004; Chester, 2011; Metros, 2010; Wang & Patterson, 2006). The rapid rate at which
technology continues to change, as well as the increasing expectations of faculty and
students, places university IT leaders in a precarious position when it comes to
establishing and cultivating the relationships needed to increase and maintain innovation.
IT leaders do not “cross paths with faculty on a daily or even weekly basis” and when
they do “it is often in reactive mode” such as “to solve a problem, to fix a bug, or to
defend a policy” (Metros, 2010, p. 54). This issue is magnified because IT professionals
often do not work to build relationships with faculty founded on mutual trust and respect,
which can contribute to the development of a gap between IT services provided and
faculty needs. To help encourage relationship building with faculty, Chester (2006)
suggested that IT leadership should work to create IT advocates across the university by
ensuring the faculty and other technology users are aware of the benefits that technology
affords them. Chester (2011) reinforced the importance of developing alliances as a key
competency element for IT leaders. Wang and Patterson (2006) presented a framework
for technology adoption and diffusion and maintained that it is critical for IT leaders to

35
devote the time and effort necessary to understand and address faculty interests to ensure
the successful diffusion of technology. IT leaders failing to develop the necessary
relationships with faculty “will sabotage the technology diffusion process” (Wang &
Patterson, 2006, p. 73). A goal of faculty and IT leaders working in tandem is to
encourage successful technological innovation and diffusion and avoid creating
circumstances that promote failure.
According to Modi (2011), organizations should view innovation as a continuous
activity, indicating that organizational leaders need to reexamine how they consider and
promote innovation on a regular basis. Additionally, Haymes (2008) stated that
technology professionals often overlook how intimidated their user community can
become by technology. Understanding how users view technology as well as continually
examining the environment to ensure innovation is being approached effectively are
important considerations for university IT leaders. Perceptions of various constituent
groups may vastly differ. The 2011 Current Issues Survey, published by Ingerman and
Yang (2011), described the opinions of top university IT leaders from around the nation
and reported that teaching and learning with technology was ranked in the top three
reported issues that have the greatest potential to become even more significant on
university campuses in the upcoming years. To ensure adequate support is provided in
this type of environment, IT leaders need accurate information on which to base their
decisions regarding which initiatives work and which do not. This will allow them to
determine what adjustments need to be made to the current environment, to make better
decisions regarding future implementations, and to make the difficult choice of
discontinuing obsolete technology (Wang & Patterson, 2006). An ongoing challenge for

36
university IT leaders is staying abreast of the technological innovation and adoption
issues on their campuses to help facilitate successful innovation. IT organizations must be
able to work with their campus constituents to ensure that specialized technology services
are provided which align with the institution‟s strategic goals (Chester, 2006). This
alignment can sometimes be difficult for higher education IT leaders to achieve because
there must be a common understanding of the institution‟s priorities before the
information technology strategy can be aligned properly to address them (Pirani &
Sallaway, 2004). Every institution is unique and “enormously diverse in terms of size,
complexity, mission, culture, leadership, and a host of other variables” (Pirani &
Sallaway, 2004, p. 2). IT leaders and technology teams must have specialized expertise as
well as good working relationships with faculty and other campus users to achieve the
technology mission of the university. A combination of technological specialization and
cohesive relationship building can help promote successful innovation and diffusion
efforts.
Organizational Change
Garson (2006) described the impact of organizational change and innovation by
stating that “innovation is change, and IT has a disruptive aspect that has promoted
change on a large scale” (p. 458). Examining innovation through this particular lens
allows technological innovation to be viewed from a change management perspective.
Several studies focused on technological innovation and adoption from an organization
change view (Batson, 2010; Duin, et al., 2011; Modi, 2011; Wang & Patterson, 2006).
Organizations that are the most innovative realize that one size does not fit all because
innovation comes in many shapes and sizes. To capitalize on multiple facets of

37
innovation, innovative organizations often focus on the benefits innovation can provide
rather than being concerned with the disruption it may cause (Modi, 2011). Change is
often met with resistance; however, the change and the effects of change that come from
technological innovation and adoption can be positively managed when adoption efforts
are supported throughout all levels of the organization. As technology becomes more
ubiquitous in university classrooms, faculty will be expected to incorporate new
technologies into their pedagogy. Some will be more receptive to these technologies than
others (Beggs, 2000). To help reduce faculty‟s resistance to technological innovation, IT
leaders must consider the needs of faculty and provide the support required to encourage
their participation and cooperation. “Without understanding the reasons behind the
faculty‟s behaviors, IT leaders may tend to harbor the suspicion that faculty are never
sincere in their desire to learn technology” (Wang & Patterson, 2006, p. 77). This mindset
could severely undermine technological innovation efforts.
Patterson (1997) suggested that organizational change in a higher education
environment heavily depends on the organization‟s ability to motivate their faculty to
dynamically engage in the innovation process. To encourage faculty‟s active participation
in technological innovation, IT leaders must make an effort to create an environment
conducive to innovation by developing collaborative relationships and building a rapport
with faculty. Duin, et al. (2011) contended that IT leaders must have the expertise
required to navigate the complex avenues of change continuously present in
technological environments. Without sufficient support, faculty may be reluctant to
embrace technological innovation and remain indifferent, or worse, inactive in the
adoption process. Technological innovation “is not the technology, but the change in

38
behavior of humans using the technology” (Batson, 2010, p. 2). Without the buy-in and
support of faculty, technological innovation in university environments is difficult to
implement because faculty are essential in driving technological innovation and diffusion
in this type of environment.
Wang and Patterson (2006) reviewed a framework that looked at technological
innovation and adoption as an organizational change process because of the factors which
drive the adoption and diffusion process. This framework depicted several faculty
assumptions regarding technology adoption and diffusion and compared them to the
reality of a university environment. Findings of this research stated that faculty normally
assumed “people act first in the interests of the organization”; however, the reality of the
situation is “people act first in their own self-interests, not in the interests of the
organization” (Wang & Patterson, 2006, p. 71). This is an important consideration for
university leaders as they attempt to incorporate change into the environment. A primary
goal of IT leadership is to align the technological environment on campus to the strategic
goals of the university while considering the needs of campus constituents. Wang and
Patterson (2006) indicated that faculty placed more emphasis on their self-interests in a
technology diffusion situation. Their research supported the concept that addressing
faculty‟s self-interests does not mean the individual‟s self-interests take priority over the
interests of the organization. Instead, they asserted that the two interests are not mutually
exclusive. Wang and Patterson (2006) also suggested that the best approach is to work in
tandem to recognize and address the self-interests of faculty while also working toward
accomplishing the goal of technology diffusion. This contention views supporting
technological innovation and adoption in a university setting tantamount to walking a

39
tight rope, but with inclusive planning and careful attention to the issues and concerns
that are raised throughout the process to address the interests of faculty, IT groups, and
the university as a whole, it is possible to achieve a more balanced approach.
According to Beggs (2000), change in higher education is typically a very slow
process. Wang and Patterson (2006) indicated that “to choose not to change is effortless
and safe” but “to choose to change involves pain and risk” (p. 77). This may partially
explain the slow propensity for change in higher education. The safety of status quo may
be more appealing than the uncertainty of change and the reluctance for change in higher
education exacerbates the issues that occur from the rapid speed of technological change.
This drives universities to search for avenues to encourage technological innovation
while managing the change that it brings. Birnbaum (2000) suggested that change within
higher education can be better assessed at the operational level rather than from the top of
the organization as it is often done in the business world. The argument for this approach
is that innovation more often occurs in the work performed at the academic department
level rather than becoming embedded in the hierarchical structure of university.
Constructive IT leadership recognizes the need to incorporate faculty needs by soliciting
input and involving faculty in innovation efforts. Without this involvement, universities
risk allowing faculty to become “victims of change rather than architects of change”
(Patterson, 1997, p. 8). Victims of change often participate out of a sense of obligation
rather than working for the good of the organization and approaching change from an
innovative mindset. If involved in the initial phases of the innovation efforts, faculty can
become advocates and help ensure the successful adoption and diffusion of technological
innovations by serving as agents of change.

40
The paradox of technological innovation is a dilemma faced by higher education
institutions. Ayers (2004) argued that higher education has yet to be transformed by
information technology because the key areas of teaching and scholarship have remained
largely untouched by the new technologies as they emerge. This concept maintains that
“the university is built to be both a protected ivory tower and a fearless creator of the
future” (Ayers, 2004, p. 54). Universities are protected in the sense that educational
institutions are built on a foundation that has served society well for a long time, and
fearless in the sense that they must prepare to educate future students by abandoning
methods that have often been in place for decades. The description used by Ayers (2004)
suggested that “universities are ancient and unchanging institutions built to generate
change” and that “most academics welcome change in society and hate any change in
their immediate environments” (p. 54). These contradictions must somehow be
reconciled in order to bring universities into the 21st century and help them embrace
change to facilitate the level of technological innovation necessary to meet the needs of
today‟s universities and their constituents. According to Wang and Patterson (2006), a
paradigm shift in thinking about change within an organization is needed to promote the
systemic diffusion of technology. This shift is needed for higher education institutions to
move beyond the adoption mindset of the past and lead them into the future of
technological innovation. Modi‟s (2011) idea that universities must create an
organizational culture that encourages continuous innovation while cultivating an open
and collaborative environment in which innovation is considered an ongoing process of
tackling new endeavors further supports the need for this paradigm shift.

41
CHAPTER 3
METHODOLOGY
This study examined the views of university faculty members and IT leaders as
they relate to critical success factors of technological innovation, adoption, and diffusion.
The interests that helped generate this area of research stem from the researcher‟s
experience in higher education and a desire to better understand the perceptions of
university IT leadership and faculty as they relate to technological innovation and
diffusion. The researcher acquired a better understanding of the perceptions of university
faculty and IT leaders regarding technological innovation and diffusion through an
examination of the data generated by this research. Specifically, a deeper understanding
of where the views of each of these groups align and where they differ was obtained. This
information may be used to more fully recognize factors which enhance or deter
innovation and diffusion of technology in a university setting and the role organizational
culture might play in technological innovation and diffusion in higher education. With
the number of technology savvy students on college campuses growing each year, it is
increasingly important for faculty and IT leaders to be innovative and adopt technologies
that can help address the needs of these learners.
Research Questions
This chapter summarizes the procedures used to address the following research questions:
1. What are the critical success factors for technological innovation and adoption as
reported by faculty?
2. What are the critical success factors for technological innovation and adoption as
reported by IT leaders?
3. How do faculty members‟ perceptions of critical success factors for technological
innovation, adoption, and diffusion compare to those of IT leaders?

42
Research Design
This research was conducted using a case study approach, which provided an
efficient method to explore the research questions. Case study research, as defined by Yin
(2006), is “an empirical inquiry that investigates a contemporary phenomenon within its
real-life context; when the boundaries between phenomenon and context are not clearly
evident; and in which multiple sources of evidence are used” (p. 23). Case study research
is considered to be a linear, but also iterative, process as shown in Figure 4 (Yin, 2006).
Using this approach, technological innovation, diffusion, and adoption was reviewed in
an ordinary university setting. The boundaries, including the relationship between faculty
and IT leaders as well as other contributing variables, were researched to gain a more in-
depth understanding of the overall innovation and diffusion process. A mixed methods
research design was employed to provide evidence for the case study. According to
Creswell (2009), a mixed methods study is an approach to inquiry that incorporates tenets
of both qualitative and quantitative research. This study employed a qualitative approach
by soliciting open-ended responses from participants and using telephone and in-person
interviews as a means to verify and solicit feedback on the information collected via the
survey process. This study also used a quantitative approach by collecting numerically
ranked survey data which was analyzed to calculate group statistics and to perform
comparisons of the responses from faculty and IT leaders.

43
Source: Yin (2006)
Figure 4. Case Study Research
Rockart (1979) defined critical success factors as the "limited number of areas in
which results, if they are satisfactory, will ensure successful competitive performance for
the organization” (p. 85). Schelin and Garson (2004) used the CSF concept to study the
success of IT initiatives in public and private organizations. Schelin and Garson (2004)
identified 14 critical success factors that impacted the success of IT projects. These
factors included: 1) communication; 2) highly qualified IT staff; 3) use of rewards; 4)
strategic technology planning; 5) end user involvement; 6) stakeholder involvement; 7)
defined, measurable milestones; 8) top management support; 9) political support; 10)
prototyping/piloting; 11) use of cross-functional teams; 12) training; 13) location of CIO
in organization; and 14) financial resources. A similar CSF approach was used in this
study to determine the views of faculty and IT leaders when examining technological
innovation and diffusion in higher education. This study identified critical success factors
as reported by faculty and IT leaders throughout the State System of Higher Education

44
(SSHE) and used those CSFs to compare the perceptions of faculty and IT leaders in a
university environment at SRSU.
This study used a four-phase approach as outlined in Figure 5. Phase I consisted
of an initial survey of peer experts to solicit feedback regarding their perceptions of
critical success factors for technological innovation and diffusion in higher education.
During Phase II, follow-up interviews were conducted with randomly selected members
of the peer expert group as a form of member checking to validate the data obtained in
Phase I and to incorporate a feedback loop regarding the CSFs identified compared to
previous literature. The data collected in Phases I and II were tabulated to determine the
ranking of the reported critical success factors and the median CSF for use in Phase III.
The resulting information was used to formulate the questions for the final survey
instrument distributed in Phase III of the study. The final survey was disseminated to the
case study participants at SRSU and used to gauge their perceptions of the critical success
factors for technological innovation and diffusion as reported by the peer expert group.
The case study participants were asked to rank the critical success factors identified by
the peer expert group as compared to the median CSF identified as well as in terms of
their perception of their individual institution‟s performance regarding each CSF. Phase
IV, the final phase of the study, consisted of follow-up interviews with randomly selected
participants in the case study as a form of member checking to validate the results
obtained from the final round of surveys.

45
Figure 5. Research Phases
Setting and Participants
To collect critical success factors for use in the final survey, initial surveys were
distributed to a group of 2,091 faculty and IT leader peer experts within the SSHE. Two
statewide groups were engaged to solicit participation in Phase I of the research and form
the peer expert grouping. These individual groups consisted of the Digital Innovation
(DI) Group and the CIO Advisory Council for the State System of Higher Education. The
mission of the DI Group (2012) as outlined on their website is “to facilitate immersion,
sharing, collaboration and „dreaming‟ to foster innovation by faculty, staff and students,
as well as, corporate agency and community members in the use of digital technologies to
enhance the learning experience.” The DI Group comprises approximately 2,200 faculty
and staff throughout the SSHE who have participated in professional development
opportunities offered through this organization. The faculty peer experts were identified
in this population by selecting those faculty members who have self-identified by
registering for an online or face-to-face development session focused on innovative uses
of technology in teaching and learning. The CIO Advisory Council consists of IT leaders
from each of the SSHE higher education institutions. The membership listing for this
group contains 69 individuals who serve as either the primary representative or secondary
46
representative for their institution. Typically, the primary representative is the university
CIO, while secondary representatives are usually the campus Chief Technology Officer
(CTO) or IT Directors. This group has an executive committee that meets monthly; the
group at large meets four times a year to discuss technology-related matters and serves in
an advisory capacity to the SSHE CIO. To prevent duplication and to protect the integrity
of the survey process, any individuals from SRSU who were also members of the DI
Group and/or CIO Advisory Council were excluded from the peer expert grouping.
A link to the initial web-based survey was distributed to the group of peer experts
via e-mail. The survey instrument consisted of open-ended questions to allow participants
to freely report their thoughts regarding critical success factors for technological
innovation and diffusion in higher education. The survey also solicited volunteers from
the respondents to participate in follow-up interviews. Two faculty members and two IT
leaders, as self-reported by the participants, were randomly selected to participate in
follow-up interviews from those who volunteered. In the second phase of the research
process, telephone interviews were conducted with these individuals to review the results
of the initial survey and to solicit additional feedback. The results of the interviews
helped verify the survey results from the first phase of the study which informed later
phases of the research.
The setting for the case study conducted in Phase III was a large southern regional
state university. SRSU has nearly 25,000 undergraduate and graduate students from more
than 140 countries. SRSU offers 80 bachelor, master, and doctoral degree programs and
has approximately 1,300 full-time and part-time faculty. SRSU has an IT division which
consists of four individual IT departments, each with a Director and one or more

47
Associate and/or Assistant Directors. In addition, the IT division has a CTO who works
with the individual departments on new initiatives and on research and development
efforts. The IT division is led by a CIO who operates at the vice president level and
serves as a member of the president‟s cabinet. The CIO, CTO, and IT department
Directors, Associate Directors, and Assistant Directors comprised the IT leader group at
SRSU for the purposes of this study. There are twenty-five individuals at SRSU that meet
the IT leader designation as identified by SRSU‟s Information Technology Division
organizational chart.
A web-based survey with both quantitative and qualitative items was used during
Phase III of the study. A link to the survey instrument was sent via e-mail to all faculty,
both full-time and part-time, as well as the IT leaders at SRSU. The survey was used to
collect data about the perceptions of the faculty and IT leaders regarding technological
innovation and diffusion on their campus. Specifically, the survey focused on how the
faculty and IT leaders at SRSU viewed innovation and diffusion on their campus in
relation to the critical success factors identified by the peer expert group. As in Phase I,
the final survey solicited volunteers to participate in follow-up interviews. Interviewees
were randomly chosen from those who volunteered to obtain two faculty members and
two IT leaders as self-reported by the participants. In the fourth phase of the research
process, in-person interviews were conducted with these individuals from SRSU to solicit
feedback and verify the results of third phase of the study.
Protection of Human Subjects
Prior to conducting the study, the necessary Institutional Review Board (IRB)
approvals were obtained. The research methodology, survey instruments, and interview

48
protocols were submitted through both Georgia State University‟s and SRSU‟s IRB
processes. Prior to distribution of the final survey, senior administrators within the
university were asked to review the survey instrument and provide approval for it to be
conducted with the two groups. Separate e-mail messages introducing the participants,
both faculty and IT leaders, to the survey included contact information for the researcher
as well as a description of how the survey data would be used. All responses were kept
confidential and all individual or institutional identifiers removed from the data collected
prior to sharing with anyone outside the researcher‟s committee.
Instruments
Two survey instruments were used for this study, an initial survey (see Appendix
B) and a final survey instrument (see Appendix H). Fink (2003) defined a survey as “a
system for collecting information from or about people to describe, compare, or explain
their knowledge, attitudes, and behavior” (p. 1). Surveys were used in this study to collect
information from faculty and IT leaders‟ regarding their views of CSFs for technological
innovation, adoption, and diffusion. With permission of the publisher, both the initial
survey and final survey instruments were adapted from the study conducted by Schelin
and Garson (2004) which reviewed critical success factors of IT initiatives. The original
study by Schelin and Garson (2004) solicited the opinion of 38 CIOs deemed to be
experts in the field. The initial phase of their research identified fourteen critical success
factors. These factors were then incorporated into a final survey instrument with 29
questions, including demographic information. Schelin and Garson (2004) distributed the
final survey to 285 CIOs randomly selected from a national Leadership Library database.
This study adapted Schelin and Garson‟s (2004) survey instruments to focus on

49
technological innovation and diffusion. The initial instrument was modified to solicit
feedback from study participants to identify critical success factors which were
incorporated into the final survey instrument. Both instruments consisted of open-ended
and closed-ended questions. The closed-ended questions yielded short answers while the
open-ended questions permitted participants to freely provide information by allowing for
more narrative responses. The initial survey was used to identify critical success factors
from the faculty and IT leader peer expert group. This information was based on the
factors they believed to be critical to successful technological innovation and diffusion in
higher education. The final survey instrument incorporated the critical success factors
identified by the initial survey and was administered to the faculty and IT leaders at
SRSU. The information collected from the final survey was used to help compare the
critical success factors from the perspectives of both the faculty and IT leaders, to
determine how the faculty and IT leaders at SRSU viewed their institution‟s performance
in relation to the CSFs identified, and to gain insight into other factors affecting
technological innovation and diffusion in higher education.
Reliability and Validity
According to Fink (2003), a survey instrument is reliable if it is consistent and
valid if it is accurate. Fink (2003) explains that a reliable instrument consistently
produces the same information each time it is used. The consistency of the information
collected by a survey is vulnerable to such factors as poorly worded or incorrectly
worded questions or directions (Fink, 2003). Instrument reliability in this study was a
primary consideration as the majority of the data collected was via survey. Fink (2003)
explains that for a survey instrument to be valid it must serve the purpose for which it

50
was intended as well as provide correct information. Instrument validity was also a
consideration when conducting this study. Schelin and Garson (2004) conducted an initial
survey to evaluate reliability and validity of their instrument and to establish a median
CSF to use for comparison in their final study. The instruments used in this study were
adapted from the instrument used by Schelin and Garson (2004). The initial instrument
was used to gather critical success factors of technological innovation and diffusion from
the perspectives of a peer expert group consisting of faculty and IT leaders. The critical
success factors identified by the initial survey were incorporated into the final survey
instrument, which was distributed to the faculty population and IT leaders at SRSU.
Follow-up interviews were conducted with selected participants from both the initial and
final surveys to help validate the survey results. As an additional form of validation, the
interviews were transcribed and copies provided to the participants to allow for feedback.
Data Collection
Two data collection methods were used for this study: web-based surveys and
participant interviews. Data collection extended over a 20-week period as outlined in
Figure 6. The initial survey instrument was used to solicit feedback from the peer expert
group and the final survey instrument was used to obtain responses from the case study
participants at SRSU. Interviews were performed with randomly selected participants
from both the peer expert and case study groups. Interviews were conducted either via
telephone or in-person depending upon individual interviewee‟s location and availability.
The interview sessions were recorded and transcribed. Table 1 outlines the data collection
methods, participants, and data collection methods of this study.

51
Figure 6. Data Collection Timeline
Table 1.
Data Collection Matrix
Phase
Data
Collection
Method Participants Data Collection Purpose
Research
Question(s)
Addressed
IWeb-based
Survey
Faculty and
IT Leader
Peer Experts
Identify Critical
Success Factors1 & 2
IITelephone
Interview
Faculty and
IT Leader
Peer Experts
Member Checking and Feedback
Loop Regarding Previous
Literature
1 & 2
IIIWeb-based
Survey
Faculty and
IT Leader
Case Study
Participants
Opinions Regarding: 1)
Importance of individual CSFs as
Compared to Median CSF; 2)
SRSU's Performance Regarding
Each of the CSFs; 3) Origination
of Innovative Ideas; 4) Sharing of
Technological Innovation
Information by Peers; and 5)
Sharing of Technological
Innovation Information by
Hierarchical Levels.
3
IVIn-Person
Interview
Faculty and
IT Leader
Case Study
Participants
Member Checking 3

52
The link to the initial survey was distributed via e-mail to the peer expert group.
With the exception of demographic questions, this survey solicited qualitative feedback
regarding the participants‟ perceptions of critical success factors for technological
innovation and diffusion in higher education. The data collection period remained open
for four weeks. Reminder e-mails were sent at the end of the second week of the survey
window to encourage maximum participation. Two weeks were allocated to examine the
data collected from the survey. The data from the initial survey were used to inform the
peer expert interviews. The critical success factors and median CSF as reported by the
peer expert group were identified and used to help finalize the peer expert interview tool.
Interviews were performed over a three-week period and were conducted to validate the
data obtained during the initial survey period. Additionally, the interviews incorporated a
feedback loop to solicit opinions from the participants regarding the group responses to
the initial survey as well as a comparison to critical success factors for technological
innovation as outlined in the literature reviewed. Two weeks following the interviews
were allowed for incorporating the critical success factors and median CSF, as well as
any additional feedback obtained during the interviews, into the final survey instrument
and preparing for it distribution.
The link to the final survey was distributed via e-mail to the faculty and IT leaders
at SRSU requesting their participation in the study. This survey was used to solicit
feedback from SRSU‟s faculty and IT leaders to rank the overall influence of each of the
critical success factors identified by the peer expert group in relation to the median CSF
as well as to rate their institution‟s performance for each of the critical success factors.
The data collection period for the final survey remained open for four weeks. Reminder

53
e-mails were sent at the end of the second week and again at the end of the third week of
the survey window to encourage maximum participation. The information from the final
survey was used to inform the protocol for the faculty and IT leader interviews. Two
weeks were allocated to review the data collected during the final survey period and
finalize the final interview tool. The ranking of each of the critical success factors in
terms of influence and performance as reported by the faculty and IT leader groups was
determined and incorporated into the case study interview tool. Three weeks were used to
conduct follow-up interviews with randomly selected SRSU faculty and IT leaders who
volunteered to participate in follow-up interviews on the final survey.
All research participants were asked to acknowledge and/or sign an informed
consent form (see Appendixes A, D, G, and I) as approved through the IRB process based
on their participation in any particular phase of the study. Security of the data collection
process was a main priority to help protect the integrity of the study. All responses to the
survey were anonymous and cannot be tied to any individual participant. The data
collected from the surveys and interviews were maintained on a secure, password-
protected computer and/or in a locked file cabinet in the researcher‟s office.
Data Analysis
The data collected in this study were analyzed to gain a better understanding of
the critical success factors affecting technological innovation and adoption in a university
setting. To review the composition of the study participants, the demographic data were
examined by using Statistical Product and Service Solutions (SPSS) software to create
frequency distributions and tabulation tables. The data collected from the initial survey
instrument were inspected to allow for items with the same meaning that were reported

54
using different terms by the participants to be combined. For example, the terms
„support‟, „assistance‟, and „help‟ were all considered to represent the same factor and
categorized as „support‟. Once the data were aggregated, they were analyzed using a
histogram to determine the frequency of each critical success factor as reported by the
peer expert participants. This information was used to determine the overall ranking for
the critical success factors and the median CSF. The results of the initial survey were
validated during the interviews with randomly selected peer expert participants. A
feedback loop was incorporated into the interview process to gain information regarding
the CSFs reported by the peer expert group compared to those identified in related
literature. The top ranking critical success factors and median CSF identified in the initial
phases of the research were used to inform the final survey instrument. The data collected
from the final survey instrument were analyzed to determine if significant differences
existed between SRSU faculty and IT leaders‟ perceptions of the importance of each of
the individual CSFs as compared to the median CSF as well as SRSU‟s performance
regarding each CSF. To make this comparison, SPSS was used to generate independent
samples t-tests.
Null hypotheses were developed to review the data collected from the final survey
from multiple perspectives. Two main hypotheses stated that there was no difference
between the faculty and IT leader groups regarding the mean CSF influence level and the
mean CSF performance level by SRSU. Radar diagrams were used to visually compare
the mean scores of each of the critical success factors as reported the faculty and IT
leader groups and t-tests were used to determine if potential observed differences were
statistically significant. Additional hypotheses were tested to compare the means between

55
the two groups in terms of the following factors: innovative idea origination, sharing of
information by peers, sharing of information hierarchically, level of formalization,
inclusion of stakeholders, and use of tangible rewards. To help ensure that the study
produced meaningful results, an a priori power analysis was performed for the case study
populations (Cohen, 1988). Using standard power analysis calculations, a sample size of
297 was needed from the faculty group and a sample size of 21 from the IT leader group
to ensure a statistical power of .80. To arrive at these numbers, 95% confidence level and
5% sampling error parameters were used. As a concluding step in the analysis, the results
of the final survey were validated using interviews with selected SRSU faculty and IT
leaders. A systematic analysis approach was used to analyze the interview data to identify
emerging patterns and themes.
Limitations
As indicated by Creswell (2009), all research studies have fundamental
limitations, which are important to identify prior to conducting the research. Potential
limitations of this research stem from the boundaries which have been imposed on this
study. For instance, the peer expert grouping was formed by faculty and IT leader groups
within the SSHE. Therefore, their perceptions regarding CSFs for technological
innovation and diffusion may be impacted by system-wide guidelines and policies that
may or may not be present in other environments. Additionally, the perceptions of the
faculty and IT leaders at SRSU represent the views regarding technological innovation
and diffusion within the boundaries of a single university setting, which has its own
unique goals, plans, and reward systems in place. These influencing factors may differ
from those at other institutions.

56
Sampling was also a limiting factor. The groups used for both the initial survey
and final survey were selected by the researcher based on general attributes defined by
the researcher. The faculty members in the Digital Innovation Group were selected for
inclusion in the peer expert group based on their interest in and propensity for innovative
uses of technology in teaching and learning. The IT leaders in the CIO Advisory Council
were selected as peer experts based on their familiarly and experience with technology in
a higher education environment. The faculty and IT leaders at SRSU were chosen to be
case study participants based on convenience. As a member of the administration at
SRSU, the researcher strived to collect information through this study to help gain a
better understanding of critical success factors regarding technological innovation and
diffusion on SRSU‟s campus as reported by faculty and IT leaders.
The final phases of this study were conducted using a case study approach.
According to Yin (2006), a primary limitation of case study research is its lack of
scientific generalizability. As a case study, this research investigated the phenomenon of
technological innovation and diffusion at a single university. The perceptions of the
faculty and IT leaders at SRSU may not be indicative of the overall population, but the
information gained from this study may be of interest to other institutions and allow them
to decide whether the results may be beneficial in their particular environment. The
results of this study provide insight into the innovation and diffusion process and present
a comparison of faculty perspectives to those of IT leaders regarding the topic in a
specific setting.
Researcher bias is also a possible limitation of this study. It is important to note
that the researcher is a technology director at a public four-year university with more than

57
twenty years of experience in higher education. Working with technological innovations
and assisting users, including faculty, during the diffusion process is a normal course of
business for the researcher. The researcher is a member of both the SSHE CIO Advisory
Council and the SRSU administration and has been actively involved in the Digital
Innovation Group; therefore, the researcher was known to many of the study participants.
This familiarity with the researcher may have affected participants‟ decision to respond to
survey requests. Based on these attributes and experiences, the researcher brought an
emic perspective to this study. This allowed the research to be viewed from an insider‟s
perspective as many of the research participants had similar backgrounds and experiences
and each of them work in the higher education environment.
This research study was conducted in four phases. It consisted of two rounds of
web-based surveys, one round of telephone interviews, and one round of in-person
interviews. E-mail communications were sent to potential survey participants explaining
the purpose of the study and requesting their participation. Multiple faculty members
from the peer expert group and SRSU responded to the e-mail solicitations and declined
to participate in the study during both survey phases. The most common reason stated by
these individuals was a lack of technical knowledge. This limited the study by excluding
multiple faculty members whose input could have been valuable and contributed to the
overall information obtained. There appeared to be a presumption by some of the
potential survey participants that a certain level of technical expertise was required for
participation in this study. The researcher responded to the individuals who declined to
participate in the survey citing a lack of technical expertise via e-mail and explained that
no specific technical knowledge was required for participation in the study. In some
58
cases, individuals agreed to participate in the survey after the follow-up e-mail
communication, but in most cases they did not. The lack of participation by some
participants due to a perceived lack of technical knowledge impacted the overall number
of participants as well as the characteristics of the respondent group. Consequently,
faculty members who did not consider themselves to be technologically savvy may be
underrepresented in the survey respondents.
The researcher used peer review and member checking techniques to help reduce
bias and increase the rigor of this study. The use of peer reviews and member checking
helped increase the trustworthiness of the data collected (Merriam, 2009). Peer reviews
were used during the analysis of data to help offset potential researcher bias. Member
checking was performed by interviewing randomly selected survey respondents who
agreed to participate in follow-up interviews. The information collected during the
interviews helped validate the results obtained from the survey. Additional member
checking was performed by providing interview participants copies of their transcribed
interviews and requesting their feedback. This allowed the peer experts and the faculty
and IT leaders at SRSU to review their responses and provide feedback regarding their
interview responses prior to inclusion in the study.
Summary
This study employed a case study methodology and mixed methods approach to
address the research questions outlined previously. By using a case study methodology,
the phenomenon of innovation and diffusion was studied in the real world context of a
university setting. A variety of data were collected by incorporating a mixed methods
approach. Using web-based surveys allowed for the collection of information from a

59
large sample group and was beneficial in collecting both qualitative and quantitative data.
The use of interviews with each of the study populations allowed for deeper reflection
and explanation of the data collected via the surveys and helped to validate the results of
the survey instruments. The collection of quantitative data allowed for the comparison of
the perceptions of SRSU faculty and IT leaders regarding technological innovation and
diffusion to determine if they were more similar or different in nature.

60
CHAPTER 4
RESULTS
This study used a combination of research methodologies to examine the
perceptions of faculty and IT leaders regarding technological innovation, adoption, and
diffusion in higher education. A case study approach employing both quantitative and
qualitative methodologies was used. Data were collected through an amalgamation of
web-based surveys and interviews. The research was conducted in four phases. Phase I
entailed soliciting information from two statewide groups to identify critical success
factors for technological innovation, adoption, and diffusion. One group consisted of
higher education faculty with an expressed interest in innovative uses of technology in
the classroom. The other group consisted of IT leaders from institutions throughout the
SSHE. These groups were chosen based on their characteristics and familiarity with
implementing and using innovations in a higher education setting. Using this population
allowed data to be collected from two varying perspectives: faculty and IT leaders. Phase
II consisted of follow-up interviews with randomly selected volunteers from both groups
of survey respondents. The interviews were conducted as a form of member checking to
validate the information collected from the initial survey administered in Phase I and to
gather feedback regarding the CSFs identified by the peer experts compared to those
identified in previous literature. The third phase of this study involved collecting data
through a web-based survey from the case study participants at SRSU. The data collected
during this phase of the research represented the perceptions of SRSU‟s faculty and IT
leaders regarding technological innovation, adoption and diffusion at a specific institution
and were used to help address the study‟s research questions. The final phase of the

61
study, Phase IV, consisted of follow-up interviews with randomly selected volunteers
who participated in the survey distributed in Phase III. These interviews were conducted
to validate the data collected in Phase III and to solicit additional feedback from case
study participants.
Phase I
A web-based survey was created using Survey Monkey and distributed in this
initial phase of the study. A link to the survey was sent via e-mail to a peer expert
grouping of faculty and IT leaders within the SSHE. This group included 2,026 faculty
members from various SSHE higher education institutions and 65 IT leaders who serve
as members on the State System of Higher Education CIO Advisory Council. The survey
was open for participation for a period of four weeks. Reminder e-mails were sent two
weeks prior to the close of the survey to encourage participation. Surveys were
distributed to a total of 2,091 prospective participants. There were 405 individuals who
responded to the survey, which equated to an overall response rate of 19.37%.
Respondents self-reported their affiliation as either faculty or IT leader when completing
the survey. Of the 405 responses received, 354 were from faculty, which was equivalent
to a 17.47% faculty response rate, and 51 were from IT leaders, which equated to a
78.46% IT leader response rate.
Peer Expert Group Characteristics
Survey participants were asked to provide basic demographic information. Table
2 depicts the reported demographic characteristics of the faculty and IT leader
respondents from the peer expert group. Of the 354 faculty members who responded to
the survey, 32.2% were male and 67.8% were female. A total of 51 IT leaders responded

62
to the survey, of which 88.2% were male and 11.8% were female. Even though the
gender of the IT leader group was highly skewed male, the response rate percentages
approximately equated to the gender composition of the overall group. The majority of
the faculty respondents (59.6%) were between the ages of 41 and 60. Additionally,
21.19% of the faculty respondents were below the age of 41 and 19.21% were above the
age of 60. The IT leader respondents had a similar age distribution. Most (64.71%) were
between the ages of 41 and 60. Of the remaining IT leaders who responded, 25.49% were
below the age of 41 and 9.8% were above the age of 60. In terms of educational level,
most of the faculty respondents reported that they hold terminal degrees. Of the faculty
responding to the survey, 66.67% reported having a doctoral degree; 32.2% reported
having a master‟s degree; and 1.13% reported having a bachelor‟s degree as their highest
educational level attained. The IT leader respondents reported their highest educational
level attained as follows: 1.96% hold associate‟s degrees; 29.41% hold bachelor‟s
degrees; 50.98% hold master‟s degrees; and 17.65% hold doctoral degrees.
Table 2.
Peer Expert Group Demographics
Affiliation
Gender Age Education Level
Male Female
21-
30
31-
40
41-
50
51-
60
61-
70
>
70 Associate Bachelor Master Doctorate
Faculty 114 240 8 67 109 102 63 5 0 4 114 236
IT Leader 45 6 3 10 17 16 4 1 1 15 26 9
Total 159 246 11 77 126 118 67 6 1 19 40 245

63
Critical Success Factors Identified
The survey distributed in Phase I solicited open-ended responses from participants
regarding their perceptions of critical success factors for technological innovation,
adoption, and diffusion in higher education. CSFs were defined for the survey
participants as those limited number of things which help ensure the success of a
particular effort, in this case technological innovation, adoption, and diffusion. In
addition to the definition, an example describing CSFs was provided to the participants to
help clarify the concept. This example explained that CSFs for project management
might include such things as top management support, user involvement, and proper
communication.
Participants were asked to provide a list of the top five critical success factors
used to support technological innovation, adoption, and diffusion in higher education
based on their experience and perceptions. The 405 survey respondents listed a combined
total of 1,944 CSFs, which equated to 4.8 items per respondent. The 1,944 individual
items were entered into a spreadsheet and sorted alphabetically to produce an initial
grouping of similar terms. This sorted data was manually coded to look for emergent
patterns and themes. Saldana (2009) defines a code in qualitative inquiry as “a word or
short phrase that symbolically assigns a summative, salient, essence-capturing, and/or
evocative attribute for a portion of language-based or visual data” (p. 3). The researcher
used a thematic analysis approach to complete the coding process. Shank (2006) defined
thematic analysis as a process of analyzing and coding qualitative data by searching for
patterns that “emerge” when “observations pile up” (p. 148). Thematic analysis allowed
the researcher to identify key terms within phrases to help categorize the data. For

64
example, the phrases “money for purchase of needed hardware and software,” “provide
necessary funding for innovation and research,” and “provision of resources and
materials,” as well as the items “funding,” “money,” and “resources” all related to the
availability of funding or resources and were categorized as a CSF labeled “Availability
of Resources and Financial Support.” Similarly, phrases such as “great help,” “high level
of IT support,” “IT assistance,” and “flexible IT staff that know about new technology
and are willing to implement it and support it” were all categorized into a CSF labeled
“Availability of Skilled Technical Support.” In the context of this study, the term
“availability” was used to represent that the particular CSFs were readily available or
obtainable. For instance, “availability” when used with resources and financial support
may not indicate that funding was previously allocated for a particular innovation, but
that it could be reasonably obtained. “Availability” when used with skilled technical
support represented the perceived existence of technical support for innovation efforts.
All 1,944 items reported were systematically reviewed and categorized into
individual CSFs. The data review led to the individual items being classified into the
following seventeen CSFs: 1) Availability of Resources and Financial Support; 2)
Availability of Skilled Technical Support; 3) Availability of Technology/Infrastructure;
4) Cost Efficiency; 5) Ease of Use; 6) Enhances Teaching and Learning; 7)
Executive/Administrative Level Support; 8) Incentives/Rewards/Time for Innovation; 9)
Innovative Culture/Collaborative Environment; 10) Perceived Value/Addresses Need;
11) Professional Development and Training; 12) Project Management; 13) Proven
Effectiveness; 14) Quality, Reliability, and Flexibility of Technology; 15) Skill Level and
Commitment of Faculty/Students; 16) Stakeholder Involvement; and 17) Strategic

65
Planning and Governance (see Table 3). Each of the 1,944 items listed by the survey
respondents was assigned to one of the 17 CSF categories. To control for researcher bias
and ensure the trustworthiness of the coded data, the listing of categorized items was
provided to three peer reviewers for feedback and validation. Additionally, member
checking was performed through follow-up interviews with randomly selected survey
participants to further validate the categorized data. The final reviewed listing of CSFs
was used to inform later phases of the study. A listing of the CSFs identified in this study
along with the corresponding unique factors as reported by the survey participants is
presented in Appendix C.
The listing of categorized critical success factors identified by the peer expert
group was compiled and ranked based on the number of times each item was reported by
the combined group. The critical success factors were sorted from highest to lowest
according to the number of times each item was reported. This information is presented
in Table 3 below. Using the ordered listing of critical success factors, “Availability of
Technology/Infrastructure” was identified as the median critical success factor, which is
shaded in Table 3. There were eight items reported by the peer expert group more often
than “Availability of Technology/Infrastructure” and another eight items reported less
often than “Availability of Technology/Infrastructure.” “Professional Development and
Training” was the most reported item overall, identified by 265 of the survey
respondents. “Executive/ Administrative Level Support” was the second most frequently
reported CSF, reported by 188 of the respondents. Subsequently, “Availability of Skilled
Technical Support” was reported 168 times; “Stakeholder Involvement” was reported 160
times; “Skill Level and Commitment of Faculty/Students” was reported 139 times;

66
“Innovative Culture/ Collaborative Environment” was reported 133 times; “Availability
of Resources and Financial Support” was reported 131 times; “Incentives/Rewards/Time
for Innovation” was reported 116 times; “Availability of Technology/Infrastructure” was
reported 107 times; “Perceived Value/Addresses Need” was reported 102 times; “Ease of
Use” was reported 96 times; “Quality, Reliability, and Flexibility of Technology” was
reported 80 times; “Proven Effectiveness” was reported 72 times; “Strategic Planning and
Governance” was reported 55 times; “Project Management” was reported 51 times;
“Enhances Teaching and Learning” was reported 46 times; and “Cost Efficiency” was
reported 35 times. This information was used to inform the final survey instrument used
in Phase III of the study.
Table 3.
Critical Success Factors Identified by Peer Expert Group
Ranking Critical Success Factor
Frequency
Reported
1 Professional Development and Training 265
2 Executive/Administrative Level Support 188
3 Availability of Skilled Technical Support 168
4 Stakeholder Involvement 160
5 Skill Level and Commitment of Faculty/Students 139
6 Innovative Culture/Collaborative Environment 133
7 Availability of Resources and Financial Support 131
8 Incentives/Rewards/Time for Innovation 116
9 Availability of Technology/Infrastructure 107
10 Perceived Value/Addresses Need 102
11 Ease of Use 96
12 Quality, Reliability, & Flexibility of Technology 80
13 Proven Effectiveness 72
14 Strategic Planning and Governance 55
15 Project Management 51
16 Enhances Teaching and Learning 46
17 Cost Efficiency 35
Total 1944

67
In addition to calculating totals for the combined peer expert group, separate
counts were tabulated based on the number of times each CSF was reported by the
individual faculty and IT leader groups. When examining the data from the perspective of
the faculty separately from the IT leaders, a slightly different picture emerges when
compared to the combined data from the group as a whole. Table 4 below presents the
CSFs as reported by the individual groups of faculty and IT leaders. CSFs which rank in
the top five reported by faculty and/or IT leaders are shaded and the rank is displayed in
bold. Faculty listed “Professional Development and Training” most often when reporting
critical success factors for technological innovation, adoption, and diffusion, while IT
leaders listed “Executive/Administrative Level Support” most often. Four out of five of
the top CSFs listed by both groups are the same. Both faculty and IT leaders listed
“Professional Development and Training,” “Executive and Administrative Level
Support,” “Stakeholder Involvement,” and “Skill Level and Commitment of
Faculty/Students” in their top five CSFs for technological innovation in higher education.
The faculty reported “Availability of Skilled Technical Support” as one of the top five
items necessary for successful technological innovation and diffusion, while IT leaders
listed this item much less often. In contrast, IT leaders reported “Availability of
Resources and Financial Support” as one of the top five items necessary for successful
technological innovation and diffusion, while faculty reported this item slightly less
often.

68
Table 4.
Critical Success Factors as Reported by Faculty and IT Leaders
Critical Success Factor
Faculty
Reporting
Faculty
Rank
IT
Leaders
Reporting
IT
Leaders
Rank
Professional Development and Training 240
(14.1%) 1 25 (10.2%) 3
Executive/Administrative Level Support 151 (8.9%) 3 37 (15.1%) 1
Availability of Skilled Technical Support 157 (9.2%) 2 11 (4.5%) 13
Stakeholder Involvement 133 (7.8) 4 27 (11.0%) 2
Innovative Culture/Collaborative Environment 121 (7.1%) 6 12 (4.9%) 10
Skill Level and Commitment of
Faculty/Students 122 (7.2%) 5 17 (6.9%) 5
Availability of Resources & Financial Support 112 (6.6%) 7 19 (7.8%) 4
Incentives/Rewards/Time for Innovation 105 (6.2%) 8 11 (4.5%) 12
Availability of Technology/Infrastructure 103 (6.1%) 9 4 (1.6%) 14
Perceived Value/Addresses Need 90 (5.3%) 11 12 (4.9%) 11
Ease of Use 92 (5.4%) 10 4 (1.6%) 15
Quality, Reliability, and Flexibility of
Technology 65 (3.8%) 12 15 (6.1%) 8
Proven Effectiveness 55 (3.2%) 13 17 (6.9%) 6
Strategic Planning and Governance 39 (2.3%) 15 16 (6.5%) 7
Project Management 38 (2.2%) 16 13 (5.3%) 9
Enhances Teaching and Learning 44 (2.6%) 14 2 (0.8%) 17
Cost Efficiency 32 (1.9%) 17 3 (1.2%) 16
Phase II
Of the 405 people who responded to the initial survey in Phase I, 158 volunteered
to participate in follow-up interviews. The survey respondents who volunteered to
participate in follow-up interviews were requested to provide contact information through
a separate survey mechanism. There were 144 faculty and 14 IT leaders who provided
contact information for follow-up interview purposes. These respondents provided their
name, institution, affiliation, e-mail address, and phone number for contact purposes.
This identifying information was collected and stored separately from the survey
responses to ensure that no individual could be directly associated with the responses
they provided to the initial survey questions. The contact information provided was
sorted based on affiliation and stored in two separate Excel spreadsheets: one containing

69
the list of 144 faculty members and another containing the list of 14 IT leaders. Two
faculty members and two IT leaders were randomly selected from each list using the
MRAND function in Microsoft Excel. E-mails were sent to these four individuals to
request and confirm their availability for an interview as outlined in the survey protocol
presented in Appendix E. After a date and time for the interview was confirmed via e-
mail, an electronic copy of the informed consent document presented in Appendix D was
sent to each interview candidate. Interview participants were asked to complete the
informed consent form and return it digitally or via fax prior to the scheduled interview
time. All informed consent forms were collected before performing the individual
interviews. The interviews were conducted by telephone using the survey tool outlined in
Appendix F to guide the discussion while using participants‟ responses to direct the
conversation. The anticipated time to complete each interview was 30 minutes or less as
outlined in the informed consent document. The actual interview times ranged from 11
minutes 25 seconds to 21 minutes 31 seconds. Each interview was recorded and later
transcribed by the researcher. The transcriptions of these interviews are presented in
Appendixes G, H, I, and J. Copies of the transcriptions were provided to the respective
interview participants for review and correction prior to being included in this study.
Interview Feedback Regarding Survey
Phase II was conducted to validate the results of the initial survey, solicit
additional feedback, and to incorporate a feedback loop to gain insight regarding the
CSFs reported by the peer expert group compared to those identified in related literature.
Each of the interview participants confirmed that the CSFs identified from the initial
survey were expected. When asked if the CSFs identified by the initial survey accurately

70
represented their thoughts, each of the interview participants agreed with the individual
items on the list, but may or may not have agreed with the ordinal positioning of a
particular CSF on the list based on how often it was reported. For instance, when
addressing if the items accurately represent CSFs for technological innovation, Faculty
Peer Expert #2 stated:
For the most part, yes.
But, this faculty member went on to say:
I was a little surprised that “Enhances Teaching and Learning” was so low
on the list.
IT Leader Peer Expert #1 had a similar response and stated:
I‟m surprised that faculty reported “Cost Efficiency” at the bottom. I‟m
also surprised that “Enhances Teaching and Learning” is as low as it was.
IT Leader Peer Expert #2 confirmed that the CSFs identified in the initial survey were
valid by stating:
Seem like valid indicators.
IT Leader Peer Expert #2 agreed with the other peer experts in terms of ordering of the
items by stating:
The only thing that jumped out at me when reading through the list was
the item “Enhances Teaching and Learning” seemed like a more narrow
view than my initial thoughts on the subject. While that‟s obviously
important and teaching is a large portion of what we do, it probably
doesn‟t address things holistically. But I do not see anything on the list
that doesn‟t belong there.
Previous Literature Feedback Loop
To incorporate a feedback loop regarding prior literature on this subject, interview
participants were asked to relate CSFs identified from Phase I to previous studies and
familiar literature. They were then asked to address any concerns regarding items that

71
they felt were missing from the CSF listing or were present but were not expected based
on previous experience and readings. Overall, the interview participants agreed that the
list of CSFs identified in Phase I of the study seemed comprehensive in their views.
Faculty Peer Expert #1 made the following observation:
The only thing that I thought of was the needs assessment, but from
looking at the list, I think that is probably addressed in the “Perceived
Value/Addresses Need” item. Other than that, I think I‟ve seen all of these
items come up in one way or another.
Additionally, Faculty Peer Expert #2 stated:
I don‟t see anything that was missing.
IT Leader Peer Expert #1 stated:
I didn‟t see anything on the list that I would eliminate as being a critical
success factor.
and:
There were no surprises in the list. These are the kinds of things that
if you think about it long enough, you could probably come up with
all of them.
Research Direction Validation
To help confirm the direction of this research, each interview participant was
asked the level of importance they attribute to promoting an innovative culture in higher
education. Overwhelmingly, the response was that innovation is a crucial component in
higher education and is needed to help address the needs of our students. Faculty Peer
Expert #1 stated:
I think it is huge because we are the next step before people go on to an
area in which they want to work and I believe technology is infused in all
businesses and it is helpful to have that training within higher ed. This is
especially true for the non-traditional students, but even our traditional-
aged students going into a world where technology reigns, if they don‟t
have the proper background it can be a problem and may cause them to
have to go back for additional training at the college level. I think it is

72
even more important for the faculty to know how to use technology and
model it for the students so when they go out into the workforce they will
have the skills they need. They need to model it in such a way that the
students are actually involved in creating and using the technology rather
than just passively learning from the technology.
Faculty Peer Expert #2 confirmed this sentiment by stating:
I think it is very important.
IT Leader Peer Expert #1 stated:
I think it is very important…especially in today‟s day and age.
IT Leader Peer Expert #1 also stated:
It is important for universities to have infrastructure and tools available so
that faculty can incorporate that into their pedagogy.
IT Leader Peer Expert #2 agreed by stating:
The writing is on the wall – we‟ve got to be more innovative.
But IT Leader Peer Expert #2 qualified this statement with these words:
I don‟t know that the innovativeness in the academic field is the
technology per se, but how do we utilize the technology and ensure that
we‟re still doing quality academics? That‟s the space for innovation and
diffusion. Technology is an important component, but it does not foster
diffusion in and of itself. How people are using technology in innovative
ways is the main thing. I think technology is a critical piece to consider or
we‟re going to be left behind.
Phase III
A web-based survey was created using Survey Monkey and distributed to the case
study participants at SRSU in Phase III of this study. The survey population in this phase
consisted of 1,356 faculty and 25 IT leaders. This survey requested participants to rank
the top eight CSFs and bottom eight CSFs in relation to the median CSF. A link to the
web-based survey was distributed to the case study population through personalized e-

73
mails. The survey remained open for participation for a period of four weeks. Reminder
e-mails were sent two weeks prior to the close of the survey and again one week prior to
the close of the survey to encourage participation. Of the 1,381 surveys distributed, 343
responses were received, which equated to an overall response rate of 24.84%.
Examining the responses based on the individual affiliation as self-reported on the
survey, 23.75% of faculty and 84.0% of the IT leaders provided responses. These
response rates satisfy the a priori power analysis performed prior to the survey
distribution.
Case Study Group Characteristics
Participants in the survey were asked to provide basic demographic information
as part of their responses. Figure 7 denotes the gender of the faculty and IT leaders of the
case study respondents. Of the 322 faculty members who responded to the survey,
40.99% were male and 56.52% were female. There were 8 faculty members who did not
provide a gender status. Of the 21 IT leaders who responded to the survey, 42.86% were
male and 52.38% were female. One IT leader did not provide a gender status.
Figure 7. Gender of SRSU Case Study Participants

74
Figure 8 depicts the age distribution of the case study survey respondents. The
majority of the faculty respondents (81.06%) were between the ages of 41 and 70.
Another 22.67% of the faculty respondents were below the age of 41 and 1.24% were
above the age of 70. There were 4 faculty members who did not provide an age
designation when responding to the survey. The IT leader respondents had a slightly
different age distribution. 76.19% IT leaders who responded to the survey were between
with ages of 31 and 60; 9.52% were between the ages of 21 and 30; and 9.52% were
between the ages of 61 and 70. One IT leader did not provide an age response when
responding to the survey.
Figure 8. Age of SRSU Case Study Participants

75
Case study respondents were asked to provide their highest educational level
attained, which is presented in Figure 9. The majority of the faculty respondents reported
that their highest degree attained was at the doctoral level. The following is a breakdown
of the faculty responses to this question: 204 (63.35%) reported having a doctoral degree;
114 (35.4%) reported having a master‟s degree; and 4 (1.24%) reported having a
bachelor‟s degree as their highest educational level attained. The IT leaders reported their
highest educational level attained as follows: 2 (9.52%) reported a high school diploma as
their highest level of education; 1 (4.76%) indicated they have attended college, but have
not earned a degree; 6 (28.57%) reported holding a bachelor‟s degree; 26 (47.61%)
reported holding a master‟s degree; and 1 (4.76%) reported holding a doctoral degree.
One IT leader did not report an educational level.
Figure 9. Highest Educational Level of SRSU Case Study Participants

76
In addition to their education level, faculty respondents were asked to report their
teaching status as represented in Figure 10. Faculty reported either a full-time or part-
time teaching status, as well as the primary college affiliation in which they teach (see
Figure 11 below). The majority of the faculty respondents (66%) indicated that they hold
full-time instructor positions, while the remaining 34% indicated that they teach on a
part-time basis. Faculty responses were received from all seven colleges within SRSU.
The data showed that 11.8% of the faculty respondents teach in the College of Business;
26.09% teach in College of Education; 10.56% teach in the College of Health and Human
Services; 20.5% teach in the College of Humanities and Social Science; 19.25% teach in
the College of Science and Mathematics; 5.59% teach in the College of the Arts; and
3.73% teach in the University College. An additional 2.48% of the faculty respondents
did not respond to this question.
Figure 10. Teaching Status of SRSU Faculty Participants

77
Figure 11. College Affiliation of SRSU Faculty Participants
Comparison of CSFs to Median CSF
“Availability of Technology/Infrastructure” was identified as the median CSF in
Phase I of this study. Respondents were asked to rank the top eight CSFs and bottom
eight CSFs in comparison to the median CSF using the following scale: 1 = significantly
less important; 2 = slightly less important; 3 = equal importance; 4 = slightly more
important; and 5 = significantly more important. This information was used to gauge the
level of importance participants attribute to each of the remaining critical success factors.
The mean responses for each group were graphed on a radar chart (see Figure 12) to
visually represent areas of potential agreement and disagreement between the perceptions
of faculty and IT leaders. Radar charts are useful in presenting data regarding multiple
variables collected from two or more groups. They can easily help identify overlapping
and outlying observations. From examining the radar diagram in Figure 12, it seemed that
faculty and IT leaders had different opinions regarding the following CSFs: “Availability

78
of Resources and Financial Support,” “Incentives/Rewards/Time for Innovation,”
“Proven Effectiveness,” and “Stakeholder Involvement.” This was surmised because the
gaps between the mean faculty response and the mean IT leader response on the radar
diagram for each of these CSFs appeared to be larger in comparison to the other CSFs.
Figure 12. CSFs Compared to “Availability of Technology/Infrastructure”

79
The same data used to create the radar diagram were entered in SPSS and used to
generate an independent samples t-test. The results of the t-test analysis were used to
compare the CSF rankings of the faculty and IT leaders to determine if significant
differences are present between the mean scores for each of the CSFs for two groups. The
group statistic output from the SPSS analysis is presented in Table 5. The group statistics
output provides the mean and standard deviation for each of the CSFs by the individual
faculty and IT leader groups.
Table 5.
CSFs Compared to Median CSF Group Statistics
Affiliation N Mean Std.
Deviation
Std. Error
Mean
Availability of Resources & Financial Support
Faculty 322 3.78 .954 .053
IT Leader 21 4.24 .768 .168
Availability of Skilled Technical Support Faculty 322 3.89 .954 .053
IT Leader 21 3.95 .805 .176
Cost Efficiency Faculty 322 3.26 .976 .054
IT Leader 21 3.00 .949 .207
Ease of Use Faculty 322 3.93 .964 .054
IT Leader 21 3.71 1.056 .230
Enhances Teaching and Learning Faculty 322 4.08 .914 .051
IT Leader 21 3.86 .478 .104
Executive/Admin Level Support Faculty 322 3.36 1.050 .059
IT Leader 21 3.76 1.044 .228
Incentives/Rewards/Time for Innovation Faculty 322 3.40 1.151 .064
IT Leader 21 2.67 .796 .174
Innovative Culture/Collaborative
Environment
Faculty 322 3.39 1.078 .060
IT Leader 21 3.05 .805 .176
Perceived Value/Addresses Need Faculty 322 3.73 .934 .052
IT Leader 21 3.67 .730 .159
Professional Development and Training Faculty 322 3.68 1.050 .058
IT Leader 21 3.62 .973 .212
Project Management Faculty 322 3.00 1.005 .056
IT Leader 21 2.67 .730 .159
Proven Effectiveness Faculty 322 3.58 1.045 .058
IT Leader 21 3.00 .707 .154
Quality, Reliability, and Flexibility of Technology
Faculty 322 3.94 .932 .052
IT Leader 21 3.81 .873 .190
Skill Level and Commitment of
Faculty/Students
Faculty 322 3.66 .979 .055
IT Leader 21 3.57 .978 .213
Stakeholder Involvement Faculty 322 3.25 1.071 .060
IT Leader 21 3.90 .889 .194
Strategic Planning and Governance Faculty 322 3.01 1.053 .059
IT Leader 21 3.43 .978 .213

80
The SPSS output generated from the independent samples t-test is presented in
Table 6. The Levene‟s (1960) Test for Equality of Variances was generated by SPSS. The
Levene‟s (1960) test allowed the researcher to determine the amount of variability
between the means of the two groups and was used to determine if variances were
assumed to be equal or unequal for each of the CSFs compared. This information was
used to determine which significance level from the SPSS output was the most
appropriate to examine. The Levene‟s (1960) test indicated that the variances were
assumed to be equal between the faculty and IT leaders for the majority of the CSFs;
however, they were not assumed to be equal for the following CSFs: “Enhances Teaching
and Learning,” “Incentives/Rewards/Time for Innovation,” “Innovative Culture/
Collabortive Environment,” and “Proven Effectiveness.” The CSFs determined not to
have equal assumed variances were identified by reviewing the significance level for the
Levene‟s (1960) test and noting that the significance level for these four CSFs was less
than .05. The significance level for the Levene‟s (1960) test was greater than .05 for each
of the remaining CSFs. Table 6 outlines separate t-test significance levels for the mean
comparison of the CSFs when variances are assumed to be equal and when variances are
not assumed to be equal. Reviewing the SPSS output, it was determined that the
difference between the perceptions of faculty and IT leaders was large enough to be
statistically significant for the following CSFs: “Availability of Resources and Financial
Support,” “Incentives/Rewards/Time for Innovation,” “Proven Effectiveness,” and
“Stakeholder Involvement.” The CSFs identified to have a statistically significant
difference between faculty and IT leaders were determined by examining the t value and
the significance level for each CSF in the SPSS output and are shaded in Table 6 below.

81
The calculated t value for “Availability of Resources and Financial Support” was -2.172
with a significance level of .031 (equal variances assumed). The calculated t value for
“Incentives/Rewards/Time for Innovation” was 3.948 with a significance level of .001
(equal variances not assumed). The calculated t value for “Proven Effectiveness” was
3.540 with a significance level of .002 (equal variances not assumed). The calculated t
value for “Stakeholder Involvement” was -2.746 with a significance level of .006 (equal
variances assumed). This information shows that there was a significant difference
between the perceived importance of each of these CSFs as compared to the median CSF
by faculty and IT leaders. Since the test yielded no significant difference for the
remaining CSFs in comparison to the median CSF by faculty and IT leaders, it may be
concluded that the other CSFs were relatively balanced in terms of their perceived
importance among the two groups surveyed.

82
Table 6.
Independent Samples Test CSFs Compared to Median CSF
Levene‟s Test for
Equality of
Variances
t-test for Equality of Means
F
Sig.
t
Df
Sig.
(2-tailed)
Mean
Diff
Std.
Error
Diff
95% Confidence
Interval of the
Difference
Lower Upper
Available Resources and
Financial Support
Equal variances assumed 3.138 .077 -2.172 341 .031 -.462 .213 -.880 -.044
Equal variances not assumed -2.625 24.204 .015 -.462 .176 -.825 -.099
Availability of Skilled
Technical Support
Equal variances assumed 3.406 .066 -.301 341 .763 -.064 .213 -.483 .355
Equal variances not assumed -.350 23.819 .730 -.064 .183 -.443 .315
Cost Efficiency Equal variances assumed 2.152 .143 1.188 341 .236 .261 .220 -.171 .693
Equal variances not assumed 1.219 22.853 .235 .261 .214 -.182 .704
Ease of Use Equal variances assumed .049 .825 .967 341 .334 .211 .218 -.218 .641
Equal variances not assumed .893 22.230 .382 .211 .237 -.279 .701
Enhances Teaching and
Learning
Equal variances assumed 10.018 .002 1.111 341 .267 .224 .201 -.172 .620
Equal variances not assumed 1.926 30.551 .063 .224 .116 -.013 .461
Exec/Admin Level
Support
Equal variances assumed .000 .990 -1.698 341 .090 -.402 .237 -.867 .064
Equal variances not assumed -1.707 22.721 .101 -.402 .235 -.889 .085
Incentives/Rewards/Time
for Innovation
Equal variances assumed 4.857 .028 2.864 341 .004 .731 .255 .229 1.233
Equal variances not assumed 3.948 25.797 .001 .731 .185 .350 1.112
Innovative Culture/
Collaborative
Environment
Equal variances assumed 4.050 .045 1.435 341 .152 .344 .240 -.127 .815
Equal variances not assumed 1.852 24.929 .076 .344 .186 -.039 .726
Perceived Value/
Addresses Need
Equal variances assumed 1.009 .316 .289 341 .773 .060 .208 -.349 .469
Equal variances not assumed .358 24.476 .723 .060 .168 -.286 .406
Professional
Development & Training
Equal variances assumed .204 .652 .273 341 .785 .064 .235 -.399 .527
Equal variances not assumed .291 23.140 .773 .064 .220 -.391 .520
Project Management Equal variances assumed .244 .622 1.494 341 .136 .333 .223 -.106 .772
Equal variances not assumed 1.973 25.218 .060 .333 .169 -.014 .681
Proven Effectiveness Equal variances assumed 14.855 .000 2.522 341 .012 .584 .231 .129 1.039
Equal variances not assumed 3.540 26.065 .002 .584 .165 .245 .923
Quality, Reliability, &
Flexibility of Technology
Equal variances assumed .054 .817 .614 341 .540 .128 .209 -.283 .540
Equal variances not assumed .650 23.076 .522 .128 .197 -.280 .537
Skill Level and
Commitment of
Faculty/Students
Equal variances assumed .003 .959 .422 341 .673 .093 .221 -.341 .527
Equal variances not assumed .423 22.693 .676 .093 .220 -.363 .549
Stakeholder Involvement Equal variances assumed 2.621 .106 -2.746 341 .006 -.656 .239 -1.126 -.186
Equal variances not assumed -3.233 23.950 .004 -.656 .203 -1.075 -.237
Strategic Planning and
Governance
Equal variances assumed .378 .539 -1.762 341 .079 -.416 .236 -.881 .048
Equal variances not assumed -1.880 23.128 .073 -.416 .221 -.874 .042
SRSU Performance
Respondents were also asked to rank all 17 criticial success factors identified in
Phase I of the study based upon their perception of SRSU‟s performance on each of the
CSFs. Respondents were asked to rank SRSU‟s performance for each CSF on the
following scale: 1 = very poor; 2 = poor; 3 = adequate; 4 = good; and 5 = very good. The

83
mean responses for each group were graphed on a radar chart (see Figure 13) to represent
areas of potential agreement or disagreement between the faculty and IT leaders‟
responses in terms of SRSU‟s performance for each CSF. From examining the radar
chart, it appears that faculty and IT leaders have different perceptions of SRSU‟s level of
performance regarding the following CSFs: “Availability of Resources and Financial
Support,” “Incentives/Rewards/Time for Innovation,” and “Professional Development
and Training.” This was concluded because the gaps between the mean faculty response
and the mean IT leader response on the radar chart for each of these CSFs appear to be
larger in comparison to the other CSFs.
Figure 13. SRSU‟s Performance on CSFs

84
The same data used to create the radar chart were entered in SPSS to generate an
independent samples t-test. This analysis was conducted to compare the ratings of
SRSU‟s performance in terms of each of the CSFs by faculty and IT leaders to determine
if significant differences are present between the two groups. The group statistics output
from this analysis is presented in Table 7. This information presents the mean and
standard deviation related to SRSU‟s performance on each CSF by the faculty and IT
leader groups.
Table 7.
Institutional Performance Regarding CSFs Group Statistics
Affiliation N Mean Std. Deviation Std. Error Mean
Availability of Resources/
Financial Support
Faculty 322 3.50 .980 .055
IT Leader 21 3.05 .865 .189
Availability of Skilled
Technical Support
Faculty 322 3.95 .939 .052
IT Leader 21 3.00 .632 .138
Availability Technology &
Infrastructure
Faculty 322 3.71 .904 .050
IT Leader 21 3.67 .730 .159
Cost Efficiency Faculty 322 3.27 .877 .049
IT Leader 21 3.05 .973 .212
Ease of Use Faculty 322 3.38 .906 .051
IT Leader 21 3.48 .680 .148
Enhances Teaching and
Learning
Faculty 322 3.65 .895 .050
IT Leader 21 3.67 .658 .144
Executive/Admin Level
Support
Faculty 322 3.50 .968 .054
IT Leader 21 3.57 .598 .130
Incentives/Rewards/Time for
Innovation
Faculty 322 2.99 1.074 .060
IT Leader 21 2.33 .658 .144
Innovative Culture/
Collaborative Environment
Faculty 322 3.23 1.019 .057
IT Leader 21 2.90 .700 .153
Perceived Value/Addresses
Need
Faculty 322 3.28 .955 .053
IT Leader 21 3.48 .602 .131
Professional Development
and Training
Faculty 322 3.58 1.026 .057
IT Leader 21 2.81 .873 .190
Project Management Faculty 322 3.19 .847 .047
IT Leader 21 3.29 .644 .140
Proven Effectiveness Faculty 322 3.17 .890 .050
IT Leader 21 3.29 .784 .171
Quality, Reliability, and
Flexibility of Technology
Faculty 322 3.30 .991 .055
IT Leader 21 3.43 .676 .148
Skill Level and Commitment
of Faculty/Students
Faculty 322 3.21 .838 .047
IT Leader 21 3.10 .700 .153
Stakeholder Involvement Faculty 322 3.00 .973 .054
IT Leader 21 3.29 .463 .101
Strategic Planning and
Governance
Faculty 322 3.06 1.019 .057
IT Leader 21 3.10 .944 .206

85
The SPSS output generated from the independent samples t-test is presented in
Table 8. The Levene‟s (1960) Test for Equality of Variances was again used to determine
if variances between the two groups may be assumed equal for each of the CSFs. The
Levene‟s (1960) test indicated that the variances were assumed to be equal between
means for all CSFs except “Availability of Skilled Technical Support.” This was
determined by examining the significance level for the Levene‟s (1960) test and noting
that the significance level for this CSF was .014, which is less than .05. The significance
level for the Levene‟s (1960) test was greater than .05 for all other CSFs. Table 8 outlines
separate t-test significance levels for the instances when variances are assumed to be
equal and when variances are not assumed to be equal. A review of the SPSS output
showed that the difference between the perceptions of faculty and IT leaders regarding
SRSU‟s performance was statistically significant for the following CSFs, which are
highlighted in Table 8 below: “Availability of Resources and Financial Support,”
“Availability of Skilled Technical Support,” “Incentives/Rewards/Time for Innovation,”
and “Professional Development and Training.” Statistical significance was determined by
examining the t value and the significance level for each CSF. The calculated t value for
“Availability of Resources and Financial Support” was 2.077 with a significance level of
.039 (equal variances assumed). The calculated t value for “Availability of Skilled
Technical Support” was 6.438 with a significance level of .000 (equal variances not
assumed). The calculated t value for “Incentives/Rewards/Time for Innovation” was
2.783 with a significance level of .006 (equal variances not assumed). The calculated t
value for “Professional Development and Training” was 3.377 with a significance level
of .001 (equal variances assumed). Since the test yielded no significant difference

86
between the faculty and IT leader views of SRSU‟s performance on each of the
remaining CSFs, it may be concluded that the university‟s performance was relatively
balanced as perceived by the two groups surveyed.
Table 8.
Independent Samples Test SRSU’s Performance for CSFs
Levene‟s Test for
Equal Variances t-test for Equality of Means
F Sig. t df Sig.
(2-
tailed)
Mean
Diff
Std.
Error
Diff
95% Confidence
Interval of the
Difference
Lower Upper
Available Resources
Financial & Support
Equal variances assumed 2.863 .092 2.077 341 .039 .455 .219 .024 .887
Equal variances not assumed 2.319 23.484 .029 .455 .196 .050 .861
Availability of Skilled
Technical Support
Equal variances assumed 6.151 .014 4.566 341 .000 .950 .208 .541 1.360
Equal variances not assumed
6.438 26.134 .000 .950 .148 .647 1.254
Availability of Tech &
Infrastructure
Equal variances assumed 1.047 .307 .205 341 .837 .041 .202 -.355 .438
Equal variances not assumed
.248 24.186 .806 .041 .167 -.303 .386
Cost Efficiency Equal variances assumed .207 .650 1.103 341 .271 .219 .199 -.172 .611
Equal variances not assumed 1.007 22.171 .325 .219 .218 -.232 .671
Ease of Use Equal variances assumed 2.029 .155 -.483 341 .630 -.097 .202 -.494 .299
Equal variances not assumed
-.621 24.889 .540 -.097 .157 -.420 .225
Enhances Teaching and
Learning
Equal variances assumed 2.081 .150 -.073 341 .942 -.014 .199 -.406 .377
Equal variances not assumed
-.095 25.088 .925 -.014 .152 -.328 .299
Exec/Admin Level
Support
Equal variances assumed 5.835 .016 -.319 341 .750 -.068 .214 -.489 .352
Equal variances not assumed -.484 27.372 .632 -.068 .141 -.358 .221
Incentives/Rewards/ Time
for Innovation
Equal variances assumed 3.241 .073 2.783 341 .006 .660 .237 .194 1.127
Equal variances not assumed 4.244 27.489 .000 .660 .156 .341 .979
Innovative Culture/
Collaborative
Environment
Equal variances assumed 3.835 .051 1.439 341 .151 .325 .226 -.119 .769
Equal variances not assumed
1.994 25.867 .057 .325 .163 -.010 .660
Perceived Value
/Addresses Need
Equal variances assumed 2.868 .091 -.931 341 .353 -.197 .211 -.612 .219
Equal variances not assumed
-1.388 27.071 .176 -.197 .142 -.487 .094
Prof Development &
Training
Equal variances assumed 1.600 .207 3.377 341 .001 .774 .229 .323 1.225
Equal variances not assumed
3.893 23.758 .001 .774 .199 .364 1.185
Project Management Equal variances assumed .393 .531 -.495 341 .621 -.093 .188 -.464 .277
Equal variances not assumed -.629 24.748 .535 -.093 .148 -.398 .212
Proven Effectiveness Equal variances assumed .213 .645 -.561 341 .575 -.112 .199 -.503 .280
Equal variances not assumed -.628 23.495 .536 -.112 .178 -.480 .256
Quality, Reliability, and
Flexibility of Technology
Equal variances assumed 3.167 .076 -.594 341 .553 -.130 .220 -.563 .302
Equal variances not assumed -.828 25.968 .415 -.130 .158 -.454 .193
Skill Level and
Commitment of
Faculty/Students
Equal variances assumed 1.286 .258 .620 341 .536 .116 .187 -.252 .484
Equal variances not assumed
.726 23.900 .475 .116 .160 -.214 .446
Stakeholder Involvement Equal variances assumed 3.293 .070 -1.334 341 .183 -.286 .214 -.707 .135
Equal variances not assumed
-2.492 33.020 .018 -.286 .115 -.519 -.052
Strategic Planning and
Governance
Equal variances assumed .010 .919 -.172 341 .863 -.039 .228 -.489 .410
Equal variances not assumed
-.184 23.146 .855 -.039 .214 -.481 .402

87
Origination of Innovative Ideas
The remaining survey questions attempted to gain further insight into faculty and
IT leader perceptions of technological innovation, adoption, and diffusion on SRSU‟s
campus. One survey question requested SRSU case study participants to indicate where
the majority of innovative ideas originate on their campus. Figure 14 outlines the
responses provided by SRSU faculty and IT leaders to this question. The largest
percentage of faculty (50.31%) reported that the most innovative ideas originated within
the faculty ranks. The remaining faculty reported that most innovative ideas originated as
follows: 18.63% from technical departments; 7.45% from external sources; 4.97% from
management; 3.11% from executive leaders; 1.8% from staff; and 6.83% from a source
other than those listed. An additional 6.83% of the faculty did not respond to this
question. In comparison, the majority of the IT leaders (61.90%) reported that most of the
innovative ideas on SRSU‟s campus originated within the technical departments.
Additionally, 19.05% of the IT leaders reported that the majority of the innovative ideas
originated with faculty and the remaining 19.05% reported that the majority of innovative
ideas originated with management.

88
Figure 14. Where do Most Innovative Ideas Originate?
Information Sharing by Peers
Another question on the survey distributed to SRSU faculty and IT leaders asked
about the frequency respondents perceived technological innovation information was
shared among their peers on their campus. Survey respondents rated the sharing of
technological innovation information by peers on the following scale: 1 = never; 2 =
rarely; 3 = occasionally; 4 = frequently; and 5 = always. Figure 15 depicts the responses
received to this question. The largest percentage of faculty (37.89%) reported that their
peers shared technological innovation occasionally. Of the remaining faculty members,
34.78% reported that technological innovation information was rarely or never shared by
peers and 35.46% reported that information regarding technological innovation was
frequently or always shared. An additional 1.86% of the faculty did not respond to this
question. The majority of the IT leaders (52.38%) reported that information regarding
technological innovation was occasionally shared by peers. An additional 42.86% of the

89
IT leaders reported that technological innovation information was frequently shared by
peers, while 4.76% of IT leaders reported that information regarding technological
innovation was rarely shared by peers.
Figure 15. Peers Share Information Regarding Technological Innovation

90
SPSS was used to analyze the data regarding faculty and IT leaders‟ responses
regarding the sharing of technological innovation information by peers on SRSU‟s
campus. Group statistics were generated from this analysis and are presented in Table 9.
On a continuum of 1 to 5, where 1 = never and 5 = always, the mean value for faculty
members‟ perception of innovation information being shared by peers was 2.80 with a
standard deviation of .967. The mean score for IT leaders‟ perception of innovation
information being shared by peers was 3.33 with a standard deviation of .577.
Table 9.
Peers Share Technological Innovation Information Group Statistics
Affiliation N Mean Std. Deviation Std. Error Mean
Technological Innovation
Information Shared by Peers
Faculty 322 2.80 .967 .054
IT Leader 21 3.33 .577 .126

91
To test if the observed difference in means between the faculty and IT leader
groups was significant, an independent samples t-test was generated using SPSS. The
output from this analysis is presented in Table 10 below. Equal variances may not be
assumed because the .029 significance level calculated by SPSS for the Levene‟s (1960)
Test for Equality of Variances was less than .05. By examining the calculated t value and
significance level generated for the comparison of the means, it was interpreted the
difference in means was statistically significant. The calculated t value for this analysis
was -3.928, with a significance level of .001. Because the calculated significance level of
.001 was less than .05, it was concluded that there was a significant difference in faculty
and IT leader perceptions regarding the sharing of technological innovation information
by peers on SRSU‟s campus.
Table 10.
Independent Samples Test Peers Share Technological Innovation Information
Levene‟s
Test for Equality of
Variances
t-test for Equality of Means
F Sig. t df Sig. (2-
tailed)
Mean
Diff
Std.
Error Diff
95% Confidence
Interval of the Difference
Lower Upper
Technological
Innovation
Information Shared by Peers
Equal variances
assumed 4.786 .029 -2.518 341 .012 -.538 .214 -.959 -.118
Equal variances not
assumed
-3.928 27.938 .001 -.538 .137 -.819 -.258

92
Information Sharing by Hierarchical Levels
Survey respondents were asked to rate their perception of technological
innovation information being shared between hierarchical levels on SRSU‟s campus
using the following scale: 1 = never; 2 = rarely; 3 = occasionally; 4 = frequently; and 5 =
always. Figure 16 illustrates the responses provided by SRSU faculty and IT leaders for
this question. The largest percentage of faculty (40.37%) reported that technological
innovation was occasionally shared between hierarchical levels. The remaining faculty
(36.03%) reported that technological innovation information was frequently or always
shared between hierarchical levels and 20.50% reported that information regarding
technological innovation was rarely or never shared between hierarchical levels. An
additional 3.11% of the faculty did not respond to this question. The largest percentage of
the IT leaders (47.62%) reported that information regarding technological innovation was
frequently shared between hierarchical levels. Another 42.86% of the IT leaders reported
that this information was occasionally shared between hierarchical levels and 9.52% of
IT leaders reported that information regarding technological innovation was always
shared between hierarchical levels.

93
Figure 16. Technological Innovation Information Shared Between Hierarchical Levels
SPSS was used to analyze the data regarding technological innovation
information being shared between hierarchical levels and group statistics were generated
(see Table 11). On a continuum of 1 to 5, where 1 = never and 5 = always, the mean
value for faculty members‟ perception of technological innovation information being
shared hierarchically was 3.08 with a standard deviation of 1.023. In comparison, the
mean score for IT leaders‟ perception of technological innovation information being
shared hierarchically was 3.67 with a standard deviation of .658.

94
Table 11.
Hierarchical Levels Share Technological Innovation Information Group Statistics
Affiliation N Mean Std. Deviation Std. Error Mean
Technological Innovation
Information Shared between
Hierarchical Levels
Faculty 322 3.08 1.023 .057
IT Leader 21 3.67 .658 .144
To test if the observed difference in means between the faculty and IT leader
groups was significant, an independent samples t-test was generated using SPSS. The
output of this test is presented in Table 12. Equal variances may be assumed because the
.245 significance level calculated by SPSS for the Levene‟s (1960) Test for Equality of
Variances was greater than .05. By examining the calculated t value and significance
level generated for the comparison of the means, it was interpreted that the difference in
means was statistically significant. The calculated t value for this analysis was -2.588
with a significance level of .010. This information shows that there was a significant
difference in faculty and IT leader perceptions of the hierarchical sharing of information
regarding technological innovation on SRSU‟s campus. This was determined by
reviewing the significance level and noting that it was less than .05.

95
Table 12.
Independent Samples Test Hierarchical Levels Share Technological Innovation Information
Levene‟s Test for Equality of
Variances
t-test for Equality of Means
F
Sig. t df Sig. (2-
tailed)
Mean
Diff
Std.
Error Diff
95% Confidence
Interval of the Difference
Lower Upper
Technological
Innovation Information
Shared between
Hierarchical
Levels
Equal variances
assumed 1.355 .245 -2.588 341 .010 -.586 .226 -1.031 -.141
Equal variances
not assumed
-3.791 26.754 .001 -.586 .155 -.903 -.269
Phase IV
Survey respondents were asked to indicate their willingness to participate in a
follow-up interview. Of the 322 faculty and 21 IT leaders who responded to the survey,
25 faculty and 5 IT leaders volunteered to participate in follow-up interviews. These
individuals were asked to provide their contact information via a separate survey tool.
They provided their name, affiliation, e-mail address, and phone number for contact
purposes. The identifying information for the participants volunteering to participate in
follow-up interviews was collected and stored separately from the survey responses to
ensure that no individual could be directly associated with their responses to the survey
questions. The contact information was sorted by affiliation and stored in two separate
Excel spreadsheets, one containing the list of 25 faculty members and another containing
the list of 5 IT leaders. Two faculty and two IT leaders were randomly selected from each
listing by using the MRAND function in Excel. These four individuals were contacted by
phone to schedule follow-up interviews as outlined in the survey protocol presented in
Appendix N. A date and time was scheduled and confirmed for each interview. An
electronic copy of the informed consent document presented in Appendix M was sent to

96
each interview candidate via e-mail. Interview participants were asked to complete the
informed consent form and to provide it to the interviewer on the day of their interview.
The completed informed consent forms were collected at the beginning of each interview
session. The interviews were conducted in-person using the survey tool outlined in
Appendix O to guide the discussion while using participants‟ responses to direct the
overall discussion. The anticipated time for each interview was less than one hour as
outlined in the informed consent document. Actual interview times ranged 19 minutes 24
seconds to 48 minutes 54 seconds. The interviews were recorded and later transcribed by
the researcher. Copies of the transcribed interviews were provided to the respective
interview participants for review and correction prior to being included in this study. The
transcripts of these interviews are presented in Appendixes P, Q, R, and S.
Confirmation of Survey Results
The interviews conducted in Phase IV of this study served as a form of member
checking to help validate the results of the web-based survey distributed to the SRSU
faculty and IT leaders in Phase III. Overall, the case study participants interviewed
substantiated the data obtained from the survey. Each of the interview participants
confirmed that the responses of their particular affiliation group closely aligned with their
thoughts and experiences when identifying the top five critical success factors. For
example, SRSU Faculty #2 stated:
I think all of these five items contribute to the success of technological
innovation.
SRSU Faculty #2 reported:
I think they very much mirror my responses. Also, some of the research
I have found is ease of use and availability.

97
SRSU IT Leader #2 stated:
Actually, I think that is probably about the same order that I ranked them
because we can‟t do very much without resources.
Both the faculty and IT leaders interviewed indicated that the top critical success
factors reported by the other affiliation group were also relatively aligned with their
individual thoughts. For example, SRSU Faculty #1 stated:
I think #2 is perfectly placed. For me, trying to help my IT leader, I would
say that support is the second most important thing.
Similarly, SRSU Faculty #2 replied:
I‟m not surprised that “Availability of Resources and Financial Support”
was the top item for IT leaders. I think for most decision makers
anywhere, even faculty, cost would be an important factor.
From an IT perspective, SRSU IT Leader #1 stated:
I‟m not surprised by the responses of either group.
With a slightly different response, SRSU IT Leader #2 reported:
I‟m a little surprised by this. I would have expected resources to be a top
concern and enhanced teaching to be below that. We must have the resources
in order for training to occur. But, I do see in my position that faculty are
beginning to have a lot of apprehension about so many different technologies
coming through for them to learn.
When asked about the similarity between the top critical success factors reported
by the two affiliation groups, SRSU Faculty #1 stated:
I‟m not surprised at all. They make sense.
SRSU Faculty #1 went on to clarify this statement by saying:
I think that this shows that we really are communicating. We have the
same needs, so somebody just needs to facilitate the process. IT wants to
support the faculty and we want that support.
Supplying a different perspective, SRSU Faculty #2 stated:

98
The IT leader is looking at a bigger picture where the faculty are looking
mainly at their program or classroom specifically.
To provide additional information regarding this statement, SRSU Faculty #2 stated:
I am surprised though that IT leaders had instructional effectiveness lower
on their list. I am glad that it is on the list.
From an IT perspective, SRSU IT Leader #2 reported:
I‟m a little surprised. I do expect “Ease of Use” to be a primary concern for
faculty and I can see why that might not seem as important for the technical
side. I would have expected faculty to see things more differently than the
IT side. It‟s actually a positive thing to see that they are so aligned.
Each of the interviewees provided insight when discussing the faculty and IT
leader survey responses regarding the origination of innovative ideas on campus. When
discussing the large percentage of faculty who reported that most innovative ideas
originated with faculty, SRSU Faculty #1 stated:
I am not surprised. Having been a member of both groups at one time, I
would have expected this.
SRSU Faculty #2 reported:
I think it is which camp you are in. You would have more of an awareness
based on the particular lens you are looking for.
When learning that the largest percentage of IT leaders reported that the majority of the
innovative ideas originated within the IT organization, SRSU Faculty #1 stated:
That is interesting and I‟m very glad to hear that IT leaders believe that
they have the innovative ideas. To me, if you have the ideas, why don‟t you
sell it? Why don‟t you tell the faculty that we can help you with this?
SRSU Faculty #2 stated:
I‟m not surprised by this, but I don‟t think it is accurate. I think that people
are myopic in general.

99
In response to the information that the majority of faculty reported that most innovative
ideas originated with faculty and that the majority of IT leaders reported that most
innovative ideas originated with IT, SRSU IT Leader #1 stated:
This is a case where I think they are both right because they are talking
about two different things. Faculty are talking about how to use the
technology to be a better teacher and from the perspective of meeting
the expectations of the students. The IT people are looking at it from
a different angle.
SRSU IT Leader #2 substantiated this perspective by saying:
I would definitely say that these results are probably a good representation
of what‟s going on in terms of innovation on campus.
Each of the interview participants provided insightful observations when
discussing faculty members‟ relatively low level of confidence that information regarding
technological innovation was shared among their peers. When addressing the faculty
response, SRSU Faculty #1 stated:
Yes, I am surprised about this response. I think there is more collegiality
on our campus.
Providing additional insight, SRSU Faculty #2 stated:
I think that information is shared, but I don‟t know that it is systematically
shared. It depends upon what you‟re listening for. I think that
predominantly faculty members are interested in their own content or
subject. Therefore, they‟re not listening for other information.
Attempting to explain the faculty responses, SRSU IT Leader #2 stated:
I think time is a factor.
When discussing the high level of confidence expressed by IT leaders regarding
technological innovation information being shared among their peers, SRSU Faculty #1
stated:

100
That‟s really good to know because they are the ones that use it the most.
I‟m not surprised by this. Having worked in a technical department at one
time, I believe that the technical people don‟t tend to compete as much as
they tend to learn from one another.
Providing an IT perspective, SRSU IT Leader #2 stated:
I would agree with that as well. Typically, in IT we do not want duplication
of effort. I think this helps encourage sharing of information with each other
and between areas.
When comparing the lower perception of information being shared by faculty peers to the
higher perception of information being shared by IT peers, SRSU IT Leader #1 stated:
IT people communicate differently than managers and faculty members.
IT people communicate horizontally. Administrators and others
communicate vertically. This is because administrators and others tend
to follow the organization chart. IT people are not worried about that.
They are interested in solving a technical problem.
Addressing the survey responses regarding technological innovation information
being shared among hierarchical levels, SRSU Faculty #1 reported:
One thing that I tend to harp on is communication. I‟m not sure we do a
good job at the communication process.
Additionally, SRSU Faculty #2 stated:
I don‟t know how information is flowing up or down. It is interesting that
I have first line technical support people that are saying or mirroring the
same thing that their bosses are saying.
From an IT perspective, SRSU IT Leader #2 stated:
I see this information as valid. You need this type of information sharing
for funding to happen.
Responding to a question asking why there might be confusion in both the faculty
and IT affiliation groups regarding the presence of formalized rules and procedures
governing instructional technology on SRSU‟s campus, SRSU Faculty #1 responded:

101
I think a lot of people don‟t know where to find the information. It‟s
either because they don‟t read the e-mail or there wasn‟t an e-mail to say
where to find the information.
SRSU Faculty #2 had a slightly different perspective and stated:
I think it is the definition of instructional technology. When you say
instructional technology my first thought is the use of classroom
technology integration.
SRSU Faculty #2 clarified further by saying:
We have plenty of rules about what you can and can‟t do with technology –
management rules of technology. I would not consider these rules for instructional
technology.
SRSU IT Leader #2 confirmed that confusion exists regarding this topic by stating:
There is definitely confusion regarding this point on our campus. We
have so many different entities doing different things on campus that
faculty as well as IT personnel don‟t always know where to go for
particular resources.
When discussing stakeholder involvement in the deployment of new instructional
technologies, SRSU Faculty #1 stated:
Faculty in general would think that we‟re not involved.
SRSU Faculty #2 stated:
Overall, I think we are very responsive to stakeholders. However,
my question would still be what is the definition of instructional
technology? Because I haven‟t seen a lot of innovation in that area
unless you‟re using projection systems as a standard – then we‟ve
exceeded the standard.
SRSU IT Leader #1 stated:
I would agree that as a university, we are doing a fairly good job at
including stakeholders, but we can always do better.
SRSU IT Leader #2 stated:
I would agree. I think our campus does a fairly good job at including
stakeholders when deploying new instructional technologies.

102
Finally, in terms of the data collected regarding SRSU providing tangible rewards
and incentives for innovation efforts, SRSU Faculty #1 stated:
I‟m not surprised by these numbers. I definitely think we could do better,
but at the same time we need to find guidelines.
SRSU Faculty #2 stated:
I would tend to agree that the reward system in general is not systematic.
It‟s spotty at best. It‟s hit or miss based on whatever initiative and
whatever vision the dean of that particular college has.
SRSU IT Leader #1 stated:
I think the numbers reported by the faculty and IT groups give us more
credit than we actually deserve in this particular area. I think because we
don‟t have a reward or incentive structure in place that there are probably
many innovations that are occurring that are not being recognized.
SRSU IT Leader #2 stated:
I‟m not surprised by this information.
Summary
The data collected from these interviews provided a form of member checking
and aided in validating the results of the survey distributed in Phase III of this study. The
faculty and IT leaders who participated in the interviews helped substantiate the survey
responses and provided additional insight into potential reasons for particular
observations. Interview participants predominantly agreed with the responses of their
particular affiliation group and provided additional understanding of those responses as
well as potential explanations for the responses of the other affiliation group.

103
Research Process Flow
The process flow outlining the four phases of this study and the characteristics of
each step within the individual phases is presented in Figure 17 below. The information
provided in this diagram presents the process followed by the researcher throughout the
study. The diagram summarizes several key elements of the study including: survey
distribution, number of individuals solicited for each of the surveys; number and
percentage of respondents for each survey; data analysis; telephone and in-person
interviews; and time of each interview conducted.
Figure 17. Research Process Flow Diagram

104
CHAPTER 5
DISCUSSION
This study focused on the relationship between faculty and IT leaders and how
these factions viewed the process of technological innovation, and specifically their
perceptions regarding critical factors affecting the adoption and diffusion of technology
within a university setting. This chapter summarizes the findings of the study as they
relate to the research questions posed and discusses conclusions drawn, potential
implications, and suggestions for further research. The results of this study helped extend
the current understanding of technological innovation, adoption, and diffusion in higher
education by providing insight regarding this process from the perspectives of faculty and
IT leaders working in this environment.
Findings and Conclusions
The purpose of this study was to explore faculty and IT leaders‟ perceptions
regarding critical success factors which impact technological innovation, adoption, and
diffusion in higher education. The following research questions were investigated:
1. What are the critical success factors for technological innovation and adoption as
reported by faculty?
2. What are the critical success factors for technological innovation and adoption as
reported by IT leaders?
3. How do faculty members‟ perceptions of critical success factors for technological
innovation, adoption, and diffusion compare to those of IT leaders?
According to the data collected from the Phase I survey, it was found that the
faculty and IT leaders who comprised the peer expert grouping have similar beliefs
regarding critical success factors for technological innovation, adoption, and diffusion.

105
The information gathered by this survey helped address the first two research questions
by producing a compilation of seventeen critical success factors. These CSFs included: 1)
Availability of Resources and Financial Support; 2) Availability of Skilled Technical
Support; 3) Availability of Technology/Infrastructure; 4) Cost Efficiency; 5) Ease of Use;
6) Enhances Teaching and Learning; 7) Executive/Administrative Level Support; 8)
Incentives/Rewards/Time for Innovation; 9) Innovative Culture/Collaborative
Environment; 10) Perceived Value/Addresses Need; 11) Professional Development
&Training; 12) Project Management; 13) Proven Effectiveness; 14) Quality, Reliability
and Flexibility of Technology; 15) Skill Level and Commitment of Faculty/Students; 16)
Stakeholder Involvement; and 17) Strategic Planning and Governance. Each of the
seventeen factors was reported by both faculty and IT leaders as a critical success factor
to technological innovation; however, incidents of occurrence varied. Additionally, the
information collected in Phase I was substantiated by the follow-up interviews conducted
with individual faculty and IT leaders in Phase II of this study.
Comparison of CSFs Identified to Previous Literature
Critical success factors identified in Phase I of this study elucidated many
similarities when compared to previous studies. For instance, Surry and Land (2000)
discussed several strategies for motivating faculty to use technology in a higher education
setting using Rogers‟ 1995 Diffusion of Innovation theory as a framework for their study.
Innovator classifications presented in Rogers‟ (1995) model were discussed by Surry and
Land (2000) who proposed that “demonstrations of leading-edge technologies” should be
provided and an “awareness of other innovators” should be cultivated to gain the
attention of faculty and encourage innovation on university campuses (p. 150). The

106
concepts presented by Surry and Land (2000) directly corresponded to three of the
critical success factors identified in Phase I of this study. The CSFs addressed by Surry
and Land (2000) included “Quality, Reliability, and Flexibility of Technology,”
“Perceived Value/Addresses Need,” and “Innovative Culture/Collaborative
Environment.” By recognizing the quality, reliability, and flexibility of leading-edge
technologies and how they may be used in the classroom, faculty may be more inclined to
adopt and incorporate these technologies into their teaching strategies. IT leaders may
tend to be more likely to procure and implement these types of technologies. For faculty
members and IT leaders to be encouraged to leverage innovative new technologies, they
must be able to see the value associated with the technology or be able to identify a
specific need that the technology will address. Additionally, cultivating an innovative and
collaborative culture contributes to an awareness surrounding innovation and encourages
open sharing of innovative ideas and uses of technology, which is important at all levels
within a university.
Surry and Land (2000) suggested that “organizational commitment to change”
and “advanced facilities for development and utilization” were key elements for faculty
to understand the relevance of technological innovation (p. 151). These elements
correlated to the following CSFs identified in Phase I of this study:
“Executive/Administrative Level Support,” “Innovative Culture/Collaborative
Environment,” and “Availability of Technology and Infrastructure.” A commitment of
change must be reinforced from the executive level downward through the administrative
ranks to support innovative efforts and progress. Unless they perceive the presence of
upper level support, faculty and IT leaders alike may be reluctant to pursue innovative

107
solutions. Executive and administrative support contributes to fostering a culture where
innovation and change are encouraged. To build confidence in the innovative use of
technology by faculty, Surry and Land (2000) stated that “organizational acceptance of
failure” was important. An organization‟s acceptance of failure helps support a culture
conducive to promoting innovation and collaborative efforts where faculty and IT
personnel can experiment to find the most innovative and creative solutions for problems
without fear of retribution in the event the endeavor is unsuccessful. The acceptance of
failure was noted by several initial survey participants as a critical factor to encouraging
technological innovation. The contention by Surry and Land (2000) that having advanced
facilities allowing for the distribution and use of technologies was represented by the
results of this study as research study participants identified the need to have the
technology and appropriate supporting infrastructure available for experimentation as
critical success factors for technological innovation. Ensuring that priority is given to
providing the necessary equipment and facilities is crucial to innovative efforts because
without the proper technology and supporting infrastructure, technological innovation can
be hindered, if not rendered completely incapacitated.
Surry and Land (2000) also stated that “ongoing training in advanced hardware
and software” was important to help build confidence in the innovators and to support
technological innovation (p. 151). This specifically relates to the CSF of “Professional
Development and Training,” which was reported by 14.1% of faculty and 10.2% of the
IT leaders in Phase I. Training is critical to a successful implementation of a
technological innovation as well as for its ongoing use and future expansion. Surry and
Land (2000) discussed several factors that may influence the satisfaction level of

108
innovators and lead to more technological innovation efforts. These included “university
awards,” “priority for equipment and facilities,” “release time,” and “travel” (p. 152).
Rewards, release time, travel, etc. were all listed by the survey respondents in Phase I of
this study and were included in the “Incentives/Rewards/Time for Innovation” CSF
category. This CSF was reported by 6.2% of faculty and 4.5% of the IT leader
respondents and was clearly identified as an important factor that should be considered
when attempting to promote technological innovation in a higher education setting.
Abrahams (2010) outlined several elements that, when present, contribute to
faculty‟s adoption of technological innovations. These included a perception that the
innovation is “something they can try out before adopting,” compatibility “with their
personal and professional goals,” that “it is not too complex,” “it is better than another
innovation (or the status quo),” and “it has some observable benefits” (Abrahams, 2010,
p. 36). The elements discussed by Abrahams (2010) related to several of the CSFs
identified in Phase I of this study. The ability to try a technology before adopting it may
be associated to multiple CSFs including “Availability of Technology/Infrastructure,”
“Proven Effectiveness,” and “Stakeholder Involvement.” It is reasonable to conclude that
faculty and IT leaders would be reluctant to adopt technological innovations which have
not been previously investigated and deemed viable and beneficial. The availability of the
technology and corresponding infrastructure to support the technology are vital for
successful technological adoption. Having information that a specific technology will be
effective in an environment will help make buy-in by stakeholders more likely and lead
to a widespread use. A reluctance to “buy before you try” is understandable in a caveat
emptor era where resources are scarce and time is limited. It is rare that a university

109
devotes the time, effort, and resources to purchase and adopt a technology that has not
been proven beneficial or pilot tested. The idea that an innovation should not be too
complex directly correlated to the CSF of “Ease of Use,” which was reported by 5.4% of
faculty and 1.6% of the IT leaders in Phase I of this study. A technological innovation
which is difficult to use or maintain could impede the adoption and diffusion process
regardless of its perceived benefits. Faculty expect a technology to assist them in
attaining their personal and professional goals and enhance classroom instruction. This
expectation corresponds to the followings CSFs identified by this study: “Enhances
Teaching and Learning,” “Perceived Value/Addresses Need,” and “Skill Level and
Commitment of Faculty/Students.” When adopting a particular technological innovation,
faculty often expect the innovation to enhance their classroom instruction and/or provide
a benefit to students. By identifying the value or specific need being addressed by the
innovation upfront, faculty and student commitment is easier to obtain.
Beggs (2000) and Groves and Zemel (2000) studied the use of technology in
higher education based on the following thirteen influencing factors: 1) Improved student
learning; 2) Advantage over traditional teaching; 3) Equipment availability; 4) Increased
student interest; 5) Ease of use; 6) Compatibility with discipline; 7) Time needed to learn;
8) Materials in discipline; 9) Compatibility with materials; 10) Training; 11)
Administrative support; 12) Personal comfort; and 13) Colleague use. These factors are
outlined in Table 13 below as a comparison showing how they relate to specific critical
success factors identified by this study. Several of the factors studied by Beggs (2000)
and Groves and Zemel (2000) were instructionally focused and are closely related to the
CSF “Enhances Teaching and Learning.” The instructionally focused factors presented in

110
these two studies included: “improved student learning,” “advantage over traditional
teaching,” “increased student interest,” “compatibility with discipline,” and
“compatibility with materials.” Several other factors studied by these researchers relate to
the CSF “Skill Level and Commitment of Faculty/Students.” These factors included:
“increased student interest,” “personal comfort,” and “colleague use.” Other factors
studied by Beggs (2000) and Groves and Zemel (2000) were more directly aligned with
individual CSFs identified by this study. For instance, the factor “equipment availability”
directly corresponds to the CSF “Availability of Technology/Infrastructure”; the factor
“ease of use” equates to the CSF “Ease of Use”; the factor “time needed to learn”
parallels the CSF “Incentives/Rewards/Time for Innovation”; the “training” factor is
represented by the CSF “Professional Development and Training”; and the factor
“administrative support” corresponds to “Executive/Administrative Level Support.”
Table 13.
CSF Comparison to Previous Studies by Beggs (2000) and Groves & Zemel (2000)
Beggs (2000) and
Groves & Zemel (2000) Corresponding CSF(s)
Improved student learning Enhances Teaching and Learning
Advantage over traditional teaching Enhances Teaching and Learning
Equipment availability Availability of Technology/Infrastructure
Increased student interest Enhances Teaching and Learning
Skill Level and Commitment of Faculty/Students
Ease of use Ease of Use
Compatibility with discipline Enhances Teaching and Learning
Time needed to learn Incentives/Rewards/Time for Innovation
Materials in discipline Enhances Teaching and Learning
Compatibility with materials Enhances Teaching and Learning
Training Professional Development and Training
Administrative support Executive/Administrative Level Support
Personal comfort Skill Level and Commitment of Faculty/Students
Ease of Use
Colleague use Innovative Culture/Collaborative Environment
Skill Level and Commitment of Faculty/Students

111
Butler and Sellbom (2002) identified twelve factors that affected the adoption of
technology. These included: 1) Reliability of the technology; 2) Knowledge of how to use
the technology; 3) Believe the technology improves or enhances learning; 4) Difficulty in
using the technology; 5) Institutional support for using the technology now; 6)
Institutional support for using the technology in the future; 7) Difficulty in learning to use
the technology; 8) Have used the technology often in the past; 9) Technology helps with
thinking and planning; 10) Expect the technology to save time in the long run; 11)
Unique or innovative technology; and 12) Others in department are using the technology
(p. 25). These factors directly correlate to many of the CSFs identified by faculty and IT
leaders in Phase I of this study. For instance, reliability of technology identified by Butler
and Sellbom (2002) corresponds to the CSF “Quality, Reliability, and Flexibility of
Technology,” which was reported by 3.8% of faculty and 6.1% of the IT leaders in Phase
I. Knowledge of how to use the technology relate to the CSF “Professional Development
and Training.” Believing that the technology improves or enhances teaching was
identified by Butler and Sellbom (2002) and validated by the participants in Phase I of
this study. Difficulty in using the technology, as identified by Butler and Sellbom (2002),
relates to the CSF “Ease of Use.” Institutional support for using the technology relates to
“Availability of Skilled Technical Support,” which was reported by 9.2% of faculty and
4.5% of the IT leaders in Phase I, and “Executive/ Administrative Level Support.”
Difficulty in learning to use the technology corresponds to the CSFs “Ease of Use” and
“Professional Development and Training.” The thought that technology helps with the
thinking and planning process and saves time identified by Butler and Sellbom (2002)
correlates to the CSFs “Perceived Value/Addresses Need” and “Proven Effectiveness.”

112
Technological innovation is often viewed in terms of attributes that encourage or
deter the process. Antonnacci (2002) discussed barriers to technology integration and
identified several such barriers including: time, expertise, access, resources, and support.
These barriers correlate to several of the CSFs identified in this study. For instance, time
as a barrier suggests that a CSF for technological innovation includes the time to
innovate, which correlates to the CSF “Incentives/Rewards/Time for Innovation.”
Expertise as a barrier suggests that the CSF “Skill Level and Commitment of Faculty/
Students” is important to successful technological innovation. Access as a barrier
suggests that it is critical to have access to technology to encourage successful
technology integration, which corresponds to the CSF “Availability of Technology/
Infrastructure.” A barrier of resources suggests a lack of resources hinders technological
innovation efforts and correlates to the CSF “Availability of Resources and Financial
Support,” which was reported by 6.6% of the faculty and 7.8% of the IT leaders in Phase
I of this study. Support as a barrier corresponds to multiple CSFs identified in Phase I of
this study. Support may represent financial support, technical support, as well as
administrative support and relates to the following CSFs identified in this study:
“Availability of Resources and Financial Support,” “Availability of Skilled Technical
Support,” and “Executive/Administrative Level Support.”
Powers (2000) developed a planning model which incorporated CSFs to examine
innovation and change processes and attempted to identify what “must go right for
universities while introducing information technology to how they do business, both in
the classroom and in administrative settings and evaluating the results compared with the
critical success factors” (Powers, 2000, p. 15). The model presented by Powers (2000)
113
looked at the overall vision, perspectives of all groups involved, the impact on IT, and
metrics, in addition to the CSFs access, communication, cooperation, financial plan,
leadership, rewards, strategic plan, and training/support. The CSFs identified by Powers
(2000) were similar to the CSFs identified by faculty and IT leaders in this study. For
example, access corresponds to the CSF “Availability of Technology/Infrastructure”
identified in this study. Communication is an important factor and relates to the CSF
“Stakeholder Involvement.” Cooperation is critical to successful innovation and
corresponds to the CSF “Innovative Culture/Collaborative Environment.” Financial plan
relates to two of the CSFs identified in this study: “Availability of Resources and
Financial Support” and “Strategic Planning and Governance.” Leadership relates to the
CSF “Executive/Administrative Level Support,” which occurs at many levels including
executive, division, and department. Leadership at any level within a university may have
an impact on the innovation process. Rewards directly correspond to the CSF
“Incentives/Rewards/Time for Innovation.” Strategic plan corresponds to the CSF
“Strategic Planning and Governance.” Training/Support relates to the CSFs “Professional
Development and Training” as well as “Availability of Skilled Technical Support.” The
CSFs identified by Powers (2000) accounted for more than half of the CSFs identified by
this study.
Osarenkhoe, et al. (2007) identified five enablers that increased the potential for
success of technological innovations. These enablers included “leadership, policy and
strategy, people, partnerships and resources, and processes” (p. 9). Leadership is
represented by the CSF “Executive/Administrative Level Support.” Leadership at the
executive and administrative level is important to facilitating successful adoption and

114
diffusion of technology and provides the encouragement needed to inspire the
experimentation required to find innovative uses of technology. Policy and strategy
surrounding technological innovation is represented by the CSF “Strategic Planning and
Governance” and is paramount as it provides a foundation for faculty and IT leaders to
base their innovative efforts upon. People, as identified by Osarenkhoe, et al. (2007), are
critical to successful innovation efforts and are represented by several of the CSFs
identified in Phase I especially: “Availability of Skilled Technical Support,” “Skill Level
and Commitment of Faculty/Students,” and “Stakeholder Involvement.” Skilled technical
support personnel are crucial to successful technological innovation efforts and help
encourage or dissuade the adoption of technologies. By providing a high level of support,
campus users may be encouraged to take advantage of innovations. Poor technical
support can lead to the demise of a technology because the users can lose confidence in
an innovation if they feel that their problems or concerns cannot easily be addressed by
the technical support staff. The skill level of faculty and students, along with their
commitment to leverage technological innovations, is crucial to successful technological
innovation. “Stakeholder Involvement,” which relates to the enabler people (Osarenkhoe,
et al. (2007), helps determine the success or failure of a technological innovation effort.
The overall adoption process relies heavily upon their acceptance and may be the catalyst
in the incorporation of the technological innovation into campus routines.
Discussion of Research Questions Based on Study Results
The data collected from the four phases of this study were used to address the
three research questions posed. Specifically, the researcher was interested in determining
what factors faculty members and IT leaders in higher education viewed as critical to

115
successful technological innovation, adoption and diffusion and how the views of these
individual groups compared. Table 14 presents a list of the CSFs collected from faculty
and IT leaders in Phase I of this study and provides a comparison of how often each CSF
was reported by the individual affiliation groups. The data is presented in percentages to
compensate for the difference in population sizes between the faculty and IT leader
groups surveyed. Each of the seventeen critical success factors identified by this study
was reported by members from both faculty and IT leader groups; however, faculty
reported some CSFs more often than IT leaders and IT leaders reported some items more
often than faculty. Using the information amassed from the first two phases of this study,
a survey was designed to compare the perceptions of faculty and IT leaders at SRSU
regarding technological innovation, adoption, and diffusion in a higher education setting.
The shaded CSF categories in the table below represent the CSFs identified as having a
significant difference in means between the faculty and IT leader survey groups at SRSU.
The non-shaded CSF categories displayed in Table 14 had no significant difference in
means between the SRSU faculty and IT leader groups when analyzed with SPSS.
The data collected from the surveys distributed in Phase III, along with the
follow-up interviews conducted in Phase IV, provided additional information to help
answer the final research question. The data show that faculty and IT leaders overall have
many of the same concerns regarding technological innovation; however, their focus on
particular items may vary. An analysis of the data showed a significant difference existed
between the mean responses of faculty and IT leaders for four out of the seventeen CSFs
studied. These CSFs include: 1) Availability of Resources and Financial Support; 2)

116
Incentives/Rewards/Time for Innovation; 3) Proven Effectiveness; and 4) Stakeholder
Involvement.
Table 14.
Comparison of Faculty vs. IT Leaders Critical Success Factors
Critical Success Factor % Faculty % IT Leaders
Availability of Resources and Financial Support 6.6% 7.8%
Availability of Skilled Technical Support 9.2% 4.5%
Availability of Technology/Infrastructure 6.1% 1.6%
Cost Efficiency 1.9% 1.2%
Ease of Use 5.4% 1.6%
Enhances Teaching and Learning 2.6% 0.8%
Executive/Administrative Level Support 8.9% 15.1%
Incentives/Rewards/Time for Innovation 6.2% 4.5%
Innovative Culture/Collaborative Environment 7.1% 4.9%
Perceived Value/Addresses Need 5.3% 4.9%
Professional Development and Training 14.1% 10.2%
Project Management 2.2% 5.3%
Proven Effectiveness 3.2% 6.9%
Quality, Reliability, and Flexibility of Technology 3.8% 6.1%
Skill Level and Commitment of Faculty/Students 7.2% 6.9%
Stakeholder Involvement 7.8% 11.0%
Strategic Planning and Governance 2.3% 6.5%

117
The survey participants at SRSU were asked to rank each of the CSFs in terms of
importance as compared to the median CSF. The results of the Phase III survey showed
that IT leaders reported a higher mean ranking for “Availability of Resources and
Financial Support” than faculty members, for a mean ranking of 4.24 for this CSF
compared to faculty members‟ ranking of 3.78. The difference in these two means was
determined to be significant when analyzed with SPSS. A higher importance attributed to
this CSF by IT leaders was also supported by the follow-up interviews conducted with
the two faculty and two IT leaders at SRSU. These results may represent the
responsibility that IT leaders often have for securing initial funding for technological
innovation efforts as well as funding the ongoing support for such initiatives. It is
understandable that faculty would rank availability of resources and financial support as
less of a concern because even though they have the challenge of seeking university
funding for individual projects, they are typically not responsible for securing funding for
an innovation that will be used campus-wide or by a large number of individuals.
“Incentives/Rewards/Time for Innovation” had a mean ranking of 3.40 by faculty
participants and 2.67 by the IT leader respondents in the SRSU case study survey. The
difference in these mean scores was determined to be significant during the SPSS
analysis. It is a logical that incentives, rewards, and time to conduct innovative efforts
had a higher mean score from faculty than IT leaders. This supports the perception that
faculty often devote time necessary to work with technology and determine innovative
uses for it in the classroom in addition to their normal workload and duties. In contrast,
innovation is often expected of IT leaders and their personnel due to ever changing
advances in technology. Staying current with the new technological trends and finding

118
creative and innovative uses of current technology are considered part of the technology
work environment. Therefore, the need to have an incentive or reward structure in place
or providing dedicated time for innovation would be less important to this group.
“Proven Effectiveness” had a mean ranking of 3.58 by the SRSU faculty and 3.00
by the SRSU IT leaders who participated in the Phase III survey. The difference in the
means between these two groups for this CSF was shown to be significant when
analyzing the data in SPSS. Overall, faculty considered the effectiveness of a
technological innovation as slightly more important than the median CSF “Availability of
Technology and Infrastructure.” The slightly higher ranking for this success factor may
be attributed to the impact the effectiveness of the innovation has on their ability to teach
or their students‟ ability to perform assignments or other classroom activities. IT leaders
considered the CSF “Proven Effectiveness” to be equal in terms of importance as
compared to the median CSF. When comparing the two factors, it is understandable that
IT leaders would value these two items equal in terms of importance because both would
be important to meet customers‟ demands. Either the absence of the appropriate
infrastructure or an ineffective technical innovation could sabotage a technical project.
The final CSF shown to have a significant difference in means between the
faculty and IT leader groups in Phase III was “Stakeholder Involvement.” The faculty
participants had a mean ranking of 3.25 for this CSF while IT leaders had a mean ranking
of 3.90. A higher level of importance attributed to this CSF by IT leaders was not
surprising because IT leaders are tasked with including stakeholders when working with
technological innovations and attempting to encourage adoption and diffusion of specific
technologies. Faculty members, on the other hand, are often considered the stakeholders

119
looking to be included in the technology initiatives which will impact them and/or their
students.
From examining the responses from the faculty and IT leaders at SRSU regarding
the other thirteen CSFs, seemingly large differences in mean rankings may be noted;
however, the differences in means were not determined to be significant when the data
were analyzed in SPSS. Therefore, the majority of the CSFs identified in Phase I and
ranked by faculty and IT leaders in Phase III showed no significant difference in means.
This led the researcher to conclude that the majority of the critical success factors for
technological innovation, adoption, and diffusion identified in Phase I and ranked by the
faculty and IT leaders I Phase III were fairly comparable in terms of importance between
the two groups. The CSFs which display a significant difference in means were not
surprising and may be attributed to the normal operational structure of a university.
In addition to ranking the CSFs in comparison to the median CSF, faculty and IT
leaders surveyed in Phase III were asked to rate SRSU‟s performance regarding each of
the CSFs. When analyzing the data with SPSS, four of the seventeen CSFs were
determined to have a significant difference between mean ratings by faculty the IT
leaders. These include “Availability of Resources/ Financial Support,” “Availability of
Skilled Technical Support,” “Incentives/Rewards/ Time for Innovation,” “Professional
Development and Training.” The remaining thirteen CSFs displayed no significant
difference in means when comparing faculty and IT leaders‟ mean ratings of SRSU‟s
performance.
The results of the Phase III survey showed that faculty reported a higher mean
rating for SRSU‟s performance regarding “Availability of Resources and Financial

120
Support” than IT leaders. Faculty reported a mean rating of 3.50 (midway between
adequate and good) for this CSF compared to IT leaders‟ mean rating of 3.05, which
represented slightly above adequate. The difference in these two means was determined
to be significant when analyzed with SPSS. These results indicated that faculty rate
SRSU‟s performance on providing the necessary resources and financial support for
technological innovation slightly higher than IT leaders. This information led the
researcher to conclude that the SRSU faculty members believe the university performs an
above average job at funding technological innovation. A potential reason for this
perception by faculty is that they may view funding for technological innovation from the
perspective of their independent projects. This also led the researcher to conclude that
SRSU IT leaders believe that the university does an average job at funding technological
innovation efforts. Their less optimistic view may be because IT leaders are typically
more involved with the annual budgeting process and may see first-hand the difficulty
involved in obtaining funding for particular initiatives.
The results of the Phase III survey also showed that faculty reported a higher
mean rating for SRSU‟s performance regarding “Availability of Skilled Technical
Support” than IT leaders. Faculty had a mean rating of 3.95 for this CSF compared to IT
leaders‟ mean rating of 3.00. The difference in these two means was determined to be
significant when analyzed with SPSS. The rating of SRSU‟s performance on providing
the skilled technical support for technological innovation being higher for faculty than IT
leaders led the researcher to conclude that SRSU faculty members believe the university
does a good job at providing technical support for innovations, while IT leaders believe
the university is only adequate in terms of this CSF. This difference may be attributed to

121
the different focus from each of these affiliation groups. Faculty may be looking at this
CSF in terms of the support they are provided by the IT departments and their rating of
good is a testament to the performance levels of the IT departments. The IT leaders, on
the other hand, may be looking at this CSF in terms of their ability to attract, hire, and
retain skilled technical staff, which in today‟s market is a difficult task, especially for
universities competing with the private sector for technical experts.
“Incentives/Rewards/Time for Innovation” had a mean rating of 2.99 by faculty
participants and 2.33 by the IT leader respondents in terms of SRSU‟s performance
regarding this CSF. The difference in these mean scores was determined to be significant
when the data were analyzed using SPSS. Both groups seemed to perceive that SRSU
does a less than adequate job in providing incentives, rewards, and time for innovation
efforts. Faculty reported that the university does a slightly less than adequate job in terms
of this CSF while IT leaders reported that the university does closer to a poor job at
providing incentives, rewards, and time for innovation. This information was
substantiated by the follow-up interviews conducted in Phase IV when faculty
interviewees outlined ways in which academic colleges are inconsistent and sporadic in
providing incentives and rewards for innovation and the IT leaders interviewed discussed
their lack of ability to provide bonuses and incentives.
The final CSF in the SPSS analysis to show a significant difference in means
between faculty and IT leader groups regarding SRSU‟s performance was “Professional
Development and Training.” Faculty participants had a mean rating of 3.58 for this CSF
while IT leaders had a mean rating of 2.81. These results indicated that faculty rate
SRSU‟s performance on providing the skilled technical support for technological

122
innovation higher than IT leaders. This led the researcher to conclude that the SRSU
faculty members believe the university does a relatively good job at providing
professional development and training opportunities, while IT leaders believe the
university is less than adequate in terms of this CSF. This difference in perceptions may
be attributed to the different point of view each of these affiliation groups may have
regarding this factor. Faculty may be looking at this CSF in terms of the training
opportunities they are afforded by their department heads or provided by the IT
departments. The rating attributed to the faculty for this CSF seemed to indicate that they
are relatively satisfied with the professional development and training they are provided
at SRSU. The IT leaders on the other had may view this CSF in terms of their ability to
obtain technical training for their staff or their department‟s ability to provide training to
the faculty, staff, and students at SRSU. Having a different focus regarding this CSF may
contribute to the difference in means observed.
Additional Information Gained from Study
When responding to the survey question regarding where the majority of
innovative ideas originated on campus, 50.31% of the SRSU faculty reported they
originated with faculty and 61.90% of the IT leaders reported that they originated with
IT. Both faculty and IT leaders surveyed perceived that the majority of innovative ideas
originated within their own affiliation group. This was not surprising and was supported
by the response of IT Leader #1 during a follow-up interview in Phase IV. In this
interview, IT Leader #1 stated:
This is a case where I think they are both right because they are talking
about two different things. Faculty are talking about how to use the
technology to be a better teacher and from the perspective of meeting

123
the expectations of the students. The IT people are looking at it from
a different angle.
Faculty may have responded to this question based on their perception of innovative uses
of technology in the classroom. On the other hand, IT leaders may have responded to this
question on a larger scale and not considering the individual applications of innovative
technology.
SRSU faculty and IT leaders were asked about the how often technological
innovation information is shared among their peers on their campus. The highest
percentage of faculty (37.89%) reported that their peers shared technological innovation
occasionally and another 34.78% of the faculty reported that technological innovation
information is rarely or never shared by peers. The majority of the IT leaders (52.38%)
reported that information regarding technological innovation is only occasionally shared
by peers. The mean rating for faculty members‟ perception of innovation information
being shared among peers was 2.80, which is representative of just less than occasionally.
The mean rating for IT leaders‟ perception of innovation information being shared by
peers was 3.33, which is slighly better than occasionally. The perception of information
being shared among IT leaders was not surprising because there are many channels for IT
professionals to share information. It is common in the technology arena to collaborate on
innovative initiatives and to work together to accomplish tasks. Faculty on the other hand
may be less likely to have the time and opportunities available for information sharing to
occur on a regular basis. This is supported by the following statement made by IT Leader
#1 during the follow-up interview conducted in Phase IV:
In general terms, I would say that IT people are going to beat faculty in
terms of sharing information among their peers. It‟s just the nature of the
business. IT has a much better system, in terms of trade journals and those

124
sorts of things, to keep up with things. I think we have much better sources
of information than they have on the faculty side. For faculty, they have
research journals and things like that, but by the time something gets
published in that medium, it is often old news. In the IT business, things
are moving so fast, you have to share information continuously.
SRSU faculty and IT leaders were also asked about the how often technological
innovation information is shared among hierarchical levels on their campus. The highest
percentage of faculty (40.37%) reported that technological innovation is occasionally
shared among hierarchical levels on campus. The highest percentage of IT leaders
(47.62%) reported that technological innovation is frequently shared among hierarchical
levels on campus. The mean rating for faculty members‟ perception of innovation
information being shared among hierarchical levels was 3.08, which is slightly better than
occasionally. The mean rating for IT leaders‟ perception of innovation information being
shared among hierarchical levels was 3.67. The better perception of information being
shared among hierarchical levels by IT leaders was also not surprising. IT leaders are
often part of the planning process for new innovation efforts and therefore may be more
aware of information being dessimiated from higher levels. Faculty are often privy to
information at higher hierarchical levels only if shared by their particular dean or
department head, which may vary widely and depend upon management and
communication styles.
From examining the responses of Phase III survey participants regarding SRSU‟s
performance on each of the individual CSFs identified in Phase I, four proved to have
significant differences in means between the faculty and IT leaders. Even though the
remaining thirteen CSFs had differences in their mean scores, the differences were not
determined to be significant when the data were analyzed in SPSS. This led the

125
researcher to conclude that the perceptions SRSU‟s faculty members regarding their
university‟s performance in terms of the critical success factors identified for
technological innovation, adoption, and diffusion are fairly comparable to those of
SRSU‟s IT leaders. The factors which displayed a significant difference in means were
not surprising and may be explained based upon the individual focus and motivation of
specific affiliation groups.
Implications
This study provided insight into the perceptions of faculty and IT leaders
regarding technological innovation, adoption, and diffusion within a higher education
setting. The information gathered from this study helped identify the different viewpoints
faculty and IT leaders have regarding technological innovation processes. The data
showed that these groups agreed on the importance level of many factors regarding
technological innovation, adoption, and diffusion; however, there were some significant
differences regarding the two groups‟ perceptions. A significant difference in means was
observed between faculty and IT leaders for the factors involving resources, technical
support, incentives, and training. The differences that were found helped define the
relationship between faculty and IT leaders and identify the priorities and focus of their
respective affiliation. Both groups are responsible for achieving the overall mission of the
university and are often required to work together to accomplish university goals in terms
of technological innovation. Dependencies exist that require faculty and IT leaders to rely
upon each other for various components of the innovation process. Faculty often depend
on the technology departments for training and support while IT leaders rely on faculty
and academic departments for involvement and commitment which contribute to the

126
success of innovation projects. Faculty‟s adoption of technological innovations, open
sharing with colleagues, and devotion of the time and effort to help IT leaders do their
jobs more effectively.
As a result of this research, a Higher Education Critical Success Factor Innovation
Model was created (see Figure 18) to help illustrate the critical success factors for
technological innovation in a higher education environment. The descriptive model
incorporates seventeen critical success factors for technological innovation and diffusion
identified by the peer expert group in this study. It was developed by using the average of
the mean scores calculated from the survey responses of the faculty and IT leaders at
SRSU when ranking the remaining CSFs to the median CSF. The median CSF was
assigned a mean score of 3.0 since that rating represented the “equal” value on the rating
scale. The model starts with the highest ranking CSF represented by the darkest shaded
portion of the model and rotates clockwise as the average rating for each CSF decreases.
To correspond to the decreasing rating, the size and the shading associated with each CSF
in the model is decreased in order until reaching the lowest ranking CSF in the lightest
shaded portion of the model. This model provides a practical illustration for universities
to use when focusing on technological innovation and emphasizes the fact that higher
education institutions have many considerations regarding the adoption and use of
innovations.

127
Figure 18. Higher Education Critical Success Factor Innovation Model
The Higher Education Critical Success Factor Innovation Model presented above
was developed based on feedback from faculty and IT leaders; however, students are also
impacted by this model. Students are the key to any university‟s mission and should be
considered when pursuing new innovations. Most of the CSFs contained in the model
relate to the student population either directly or indirectly. For instance, students would
be directly affected by how easy a particular innovation is to use or whether it enhances
the teaching and learning process, but may be indirectly affected by the cost or the level
of project management associated with an innovation. Faculty are primarily responsible
for fulfilling the teaching mission of the university and, as a result, are heavily impacted
by technological adoption. Faculty members are responsible for making technological
innovations work in the classroom and using them to develop or enrich course content.
128
Additionally, faculty incorporate the technology in their courses so it enhances the
teaching and learning process rather than being a resource drain that creates additional
work. IT leaders are impacted by new technology adoptions because their departments
are typically required to provide support for the system, integrate it with other campus
systems, ensure the security of any data that is transmitted, etc. An innovation decision
made by any one group has a broader impact on other constituent groups. For instance,
planning groups are often charged with making decisions regarding innovations for use in
the classroom which impact faculty members, IT leaders, students, and others who are
involved in using, implementing, providing or participating in training, and/or supporting
the system. When a faculty member decides to adopt a new innovation for classroom use,
there may be funding or support implications that need to be considered by other factions.
By focusing on the components of the Higher Education Critical Success Factor
Innovation Model individually and collectively, universities can help meet the needs of
multiple constituent groups.
University planning and development structures are also affected by the adoption
of technological innovations because they are responsible for ensuring the innovations
adhere to the overall mission of the university, meeting the needs of all constituents
involved, and identifying funding for technology initiatives. The Higher Education
Critical Success Factor Innovation Model presents factors to be considered during new
innovation efforts, will assist in addressing the needs of the factions involved and will
help ensure the proper functioning of the innovation in the campus environment. The
results of this study contribute to the body of knowledge surrounding adoption of
technological innovations and may be used by academic and IT groups alike to

129
understand the process of technological innovation, adoption, and diffusion from a
broader perspective. With the constantly changing nature of technology and the
expectations of students continuing to rise, the need for universities to understand the
factors critical to successful innovation is paramount to staying abreast of technology and
meeting student expectations. The information collected from this study may be used by
faculty, IT leaders, and university administration to help them gain insight into the
technological innovation process and augment future planning and adoption efforts. This
study also provided information that may be employed by universities to encourage IT
departments and their constituent groups to work together with clearly articulated goals.
An informed collaboration between faculty and IT leaders can create a foundation for
technological innovations to be leveraged and built upon to meet the needs of today‟s
students more efficiently and effectively.
Suggestions for Further Research
This study contributes to previous research by identifying critical success factors
regarding the adoption and diffusion of technological innovations in a higher education
environment and presenting the Higher Education Critical Success Factor Innovation
Model. The critical success factors identified in this study were determined by surveying
statewide groups of faculty and IT leaders and are representative of information presented
in previous research studies. Based on the findings of this study, recommendations for
future research include:
Examining “Executive/Administrative Level Support” in more detail to
gain a better understanding of the lessened importance attributed to this
CSF in the Higher Education Critical Success Factor Innovation Model.
Examining other universities within the SSHE as individual case studies.
Examining the universities within the SSHE as a whole.

130
Expanding this study to be more representative of a general university
population by traversing the boundary of the SSHE and including private
and other non-SSHE institutions.
Developing a prescriptive model for addressing the critical success factors
identified in this study.
Expanding the scope of this research and including a broader range of survey
participants would help determine if the results found are representative of this case study
population or may be applied to broader populations. Using the information presented in
the Higher Education Critical Success Factor Innovation Model to develop a prescriptive
model would help expand this research by providing a guide to assist in addressing each
of the factors rather than simply describing what they are.
Conclusion
Technological innovation requires an investment in time, money, infrastructure,
and other resources. As technological innovation efforts continue to progress, the
investment most universities devote to these endeavors continues to expand and it
becomes increasingly important for universities to encourage efficiency and to use their
resources effectively to meet growing demands. The information collected from this
study provides a better understanding of technological innovation, adoption, and
diffusion from the perspectives of two key campus groups, faculty and IT leaders, and
can assist in enhancing planning and governance processes surrounding innovation.
Effective use of the information and insight gained from this study may help increase the
likelihood of successful innovation efforts on university campuses.
University leadership can use the information from this study to enhance
innovation efforts by focusing on and developing initiatives that address the concerns of
faculty and IT leaders to be considered during initial planning processes. Understanding
131
what is pertinent to each of the constituent groups will assist with resource allocation and
securing buy-in and support. Understanding what is least important to each of the
constituent groups will help identify areas that need further research, communication,
and/or elucidation to elicit the necessary support and involvement. Identifying factors
where faculty and IT leaders are in agreement regarding technological innovation
provides opportunities to gain synergies and create partnerships that allow the two
factions to work together toward a mutual goal based on their commonalities while
recognizing their differences. Identifying factors where faculty and IT leaders are not in
agreement affords university leadership opportunities to provide avenues for information
sharing.
Universities faced with reduced budgets and increased demand for technological
resources must be more efficient in their technology-focused innovation efforts by
identifying the most critical items impacting innovation and focusing their resources on
those factors. This study identified seventeen factors that faculty and IT leaders believe
are critical to a university‟s ability to be competitive in today‟s higher education market.
The researcher used those factors to develop the Higher Education Critical Success
Factor Innovation Model. The critical success factors identified and the model presented
in this study may be used to enhance university innovation efforts. By gaining a better
understanding of the critical factors for technological innovation, universities can focus
their efforts to address those factors that are most critical, thereby maximizing their
chances for success.

132
References
Abel, R. (2007). Innovation, adoption and learning impact creating the future of IT.
EDUCAUSE Review, March/April(18), 13-31.
Abrahams, D. A. (2010). Technology adoption in higher education: A framework for
identifying & prioritizing issues and barriers to adoption of instructional
technology. Journal of Applied Research in Higher Education, 2(2) 33-49.
Ajjan, H., & Hartshorne, R. (2008). Investigating faculty decisions to adopt Web 2.0
technologies: Theory and empirical tests. The Internet and Higher Education,
11(2), 71-80.
Albright, M. J., & Nworie, J. (2008). Rethinking academic technology leadership in an
era of change. EDUCAUSE Quarterly, 1, 14-23.
Amiel, T., & Reeves, T. C. (2008). Design-based research and educational technology:
Rethinking technology and the research agenda. Educational Technology &
Society, 11(4), 29-40.
Antonacci, D. M. (2002). Integrating technology into instruction in higher education. 1-
24. Retrieved from http://associations.missouristate.edu/assets/mohighedweb/IS-
TechnologyIntegrationinHigherEducation.pdf.
Author Unknown. Traditional African proverb.
Ayers, E. L. (2004). The academic culture and the IT culture: Their effect on teaching
and scholarship. EDUCAUSE Review, 48-56.
Baltaci-Goktalay, S., & Ocak, M. A. (2006). Faculty adoption of online technology in
higher education. The Turkish Online Journal of Educational Technology, 5(4),
37-43.
Batson, T. (2010). Innovation in higher education it‟s not the technology. Campus
Technology, 1-3.
Beggs, T. A. (2000) Influences and barriers to the adoption of IT. 1-14.
Birnbaum, R. (2000). Management fads in higher education: Where they come from,
what they do, why they fail. San Francisco, Jossey-Bass.
Bullen, C. V., & Rockart, J. F. (1981). A primer on critical success factors. Center for
Information Systems Research, Sloan School of Management, Massachusetts
Institution of Technology.
Butler, D. L., & Sellbom, M. (2002). Barriers to adopting technology for teaching and
learning. EDUCAUSE Quarterly, 2, 22-28.
Chester, T. M. (2006). A roadmap for IT leadership and the next ten years. EDUCAUSE
Quarterly, 2, 56-60.
Chester, T. M. (2011). Technical skills no longer matter. EDUCAUSE Review,
January/February(46), 62-63.
Chism, N. (2004). Using a framework to engage faculty in instructional technologies.
EDUCAUSE Quarterly, 2, 39-45.
Cohen, J. (1988). Statistical power analysis for the behavioral sciences (2nd ed.).
Hillsdale, NJ: Lawrence Earlbaum Associates.
Cook, R. G. (2012). Facts and fiction: lessons from research on faculty motivators and
incentives to teach online. E-Learning - Engineering, On-Job Training and
Interactive Teaching. E. P. Anderson Silva, Adilson Guelfi, and Sergio Takeo
Kofuji, InTeO.

133
Creswell, J. W. (2009). Research design: Qualitative, quantitative, and mixed methods
approaches. Los Angeles, CA: Sage.
Dispensa, M. (2011). Faculty survey on instructional technology final report. Ithaca, New
York, Ithaca College.
Duin, A. H., Cawley, S., Gulachek, B., O‟Sullivan, D., & Wollner, D. (2011). Shared
leadership transforms higher education IT. EDUCAUSE Quarterly, 34(2), 1-5.
Fink, A. (2003). The survey handbook. Thousand Oaks, Sage.
Gallivan, M. J. (2001). Organizational adoption and assimilation of complex
technological innovations: Development and application of a new framework. The
Data Base for Advances in Information Systems, 32(3), 51-85.
Garson, G. D. (2006). Organization behavior and organization theory. Public information
technology and e-governance: Managing the virtual state. Raleigh, NC: Jones and
Bartlett Publishers.
The Georgia Digital Innovation Group: Enhancing the learning experience website.
http://digroup.gcsu.edu/about_us/mission_statement.html. Accessed November 9,
2012.
Groves, M. M., & Zemel, P. C. (2000). Instructional technology adoption in higher
education: An action research case study. International Journal of Instructional
Media, 27(1), 57-65.
Hall, G. E. (2010). Technology's Achilles heel: Achieving high-quality implementation.
Journal of Research on Technology in Education, 42(3), 231-253.
Haymes, T. (2008). The three-e strategy for overcoming resistance to technological
change. EDUCAUSE Quarterly, 4, 67-69.
Ingerman, B. L., & Yang, C. (2011). Top-ten issues 2011. EDUCAUSE Review,
May/June, 24-40.
Jacobsen, D. M. (1998). Adoption patterns of faculty who integrate computer technology
for teaching and learning in higher education. Paper presented at ED-MEDIA
and ED-TELECOM 98: World Conference on Educational Multimedia and
Hypermedia & World Conference on Educational Communications, Freiburg,
Germany.
Jazzar, M., & Friedman, A. (2007). Highly effective IT leadership that promotes student
achievement. Version 1.3: Jul 5, 2007, http://creativecommons.org/licenses/
by/2.0/.
Kyung-Kwon, H., & Young-Gul, K. (2002). The critical success factors for ERP
implementation: An organizational fit perspective. Information & Management,
40, 25-40.
Lam, W. (2005). Investigating success factors in enterprise application integration: a
case-driven analysis. European Journal of Information Systems, 14(2), 175-187.
Levene, H. (1960). Robust tests for equality of variances. In I. Olkin, et al. (Eds.),
Contributions to probability and statistics (pp. 278-292). Stanford University
Press.
Mehaffy, G. L. (2012). Challenge and change. EDUCAUSE Review, September/October,
25-42.
Merriam, S. B. (2009). Qualitative research: A guide to design and implementation. San
Francisco: John Wiley & Sons.

134
Metros, S. E. (2010). Faculty voices and IT partners. EDUCAUSE Review,
January/February, 54-55.
Modi, T. (2011). Living in the innovation age. Baseline (New York), (113), 30-31.
Mumtaz, S. (2000). Factors affecting teachers' use of information and communications
technology: A review of the literature. Journal of Information Technology for
Teacher Education, 9(3), 319-342.
Nah, F. F., Zuckweiler, K. M., & Lau, J. L. (2003). ERP implementation: Chief
information officers' perceptions of critical success factors. International Journal
of Human-Computer Interaction, 16(1), 5-22.
Osarenkhoe, A., Bennani, A. E., & Lhajji, D. (2007). A study for the prerequisites for
successful deployment and governance of the process of technological
innovations. Journal of Information Technology, 6(1), 1-20.
Patterson, J. L. (1997). Coming clean about organizational change: Leadership in the
real world. American Association of School Administrators, Arlington, Va.
Pirani, J. A., & Salaway, G. (2004). Information technology alignment in higher
education. ECAR Research Bulletin: 1-10.
Powers, J. (2000). A new planning model for information technology in higher education.
Primary Specialization Comprehensive Paper. Spring: 1-32.
Remus, U., & Wiener, M. (2010). A multi-method, holistic strategy for researching
critical success factors in IT projects. Information Systems Journal, 20(1), 25-52.
Rockart, J. F. (1979). Chief executives define their own data needs, Harvard Business
Review, March-April, 81-93.
Rogers, E. M. (1995). Diffusion of innovations (4th
ed.). New York, NY: The Free Press.
Rogers, P. L. (2000). Barriers to adopting emerging technologies in education. Journal of
Educational Computing Research, 22(4), 455-472.
Saldana, J. (2009). The coding manual for qualitative researchers. Los Angeles, CA:
Sage.
Schelin, S. H., & Garson, G. D. (2004). IT solutions series: Humanizing information
technology: Advice from experts, IGI Global.
Schneckenberg, D. (2009). Understanding the real barriers to technology-enhanced
innovation in higher education. Educational Research, 51(4), 411-424.
Shank, G. D. (2006). Qualitative research: A personal skills approach (2nd
ed.). Upper
Saddle River, NJ: Merrill Prentice Hall.
Singh, V., & Sharma, R. R. K. (2010). Relating critical success factors of information
system implementation with organizational strategy. International Journal of
Business Strategy, 10(2), 119-123.
Surry, D. W., & Brennan, J. P. (1998). Diffusion of instructional innovations: Five
important, unexplored questions. Paper presented at Annual Conference of the
Association for Educational Communications & Technology (AECT), St. Louis,
MO.
Surry, D. W., & Land, S. M. (2000). Strategies for motivating higher education faculty to
use technology. Innovations in Education & Training International, 37(2), 145-
153.
Swanson, E. B., & Ramiller, N. C. (2004). Innovating mindfully with information
technology. MIS Quarterly, 28(4), 553-583.
135
Tan, S. C. (2010). School technology leadership: Lessons from empirical research.
ASCILITE, Sydney, Australia.
Toledo, C. (2005). A five-stage model of computer technology integration into teacher
education curriculum. Contemporary Issues in Technology and Teacher
Education, 5(2), 177-191.
Van Rooij, S. (2011). Higher education sub-cultures and open source adoption.
Computers & Education, 57(1), 1171-1183.
Wang, Y. M., & Patterson, J. (2006). Learning to see differently: Viewing technology
diffusion in teacher education through the lens of organizational change. Journal
of Educational Technology Systems, 34(1), 69-82.
Wannasiri, B., Xaymoungkhoun, O., Zo, H., Rho, J. J., & Ciganek, A. P. (2012). Critical
success factors for e-learning in developing countries: A comparative analysis
between ICT experts and faculty. Computers & Education, 58(2), 843-855.
White, S. C., & Glickman, T. S. (2007). Innovation in higher education: Implications for
the future. New Directions for Higher Education, 2007(137), 97-105.
Yin, R. K. (2006). Case Study Research: Design and Methods. Thousand Oaks: Sage.
136
APPENDIXES
APPENDIX A
INFORMED CONSENT FOR INITIAL SURVEY
Georgia State University
Department of Middle Secondary Education and Instructional Technology
Informed Consent
Title: Critical Success Factors of Technological Innovation and Diffusion in Higher
Education
Principal Investigator: Dr. Stephen W. Harmon
Georgia State University
P.O. Box 3978
Atlanta, GA 30302-3978
Phone: (404) 413-8064
Email: [email protected]
Student Principal Investigator: T. Wayne Dennison
Kennesaw State University
1000 Chastain Road
Kennesaw, GA 30144-5591
Phone: (770) 499-3151
Email: [email protected]
I. Purpose:
The purpose of this study is to explore and compare faculty and IT leaders‟
perceptions regarding innovation and diffusion of technology. You have been
selected for this study as either a faculty member or information technology (IT)
leader based on your affiliation with the Digital Innovation Group and/or State
System of Higher Education CIO Advisory Council. Please note the following:
A total number of 2091 participants will be recruited for this portion of the
research.
The survey should take about 10 to 12 minutes to complete.
You must be 18+ years of age to take part in this study.
Your participation is completely voluntary and anonymous.
There are no known risks to participation in this study.
Your IP address will not be collected.

137
II. Procedures:
If you decide to participate, you will be asked to complete an online survey
regarding your perceptions of critical success factors for technological
innovation and diffusion in higher education.
III. Risks:
In this study, you will not have any more risks than you would in a normal day of
life.
IV. Benefits:
Participation in this study may not benefit you personally. Overall, we hope to gain
information that may help support the process of technological innovation and
diffusion. The results of this study may also be used to better understand
technological innovation and diffusion from the points of view of both faculty and
IT leaders and to provide insight to the critical success factors that support these
processes.
V. Voluntary Participation and Withdrawal:
Participation in research is voluntary. You do not have to be in this study. If you
decide to be in the study and change your mind, you have the right to drop out at
any time. You may skip questions or stop participating at any time.
VI. Confidentiality:
We will keep your records private to the extent allowed by law. Only Dr. Stephen
Harmon, principal researcher, and Wayne Dennison, student researcher, will have
access to the information you provide. Information may also be shared with those
who make sure the study is done correctly (GSU Institutional Review Board, the
Office for Human Research Protection (OHRP)). The information you provide
will be stored electronically on a firewall-protected computer until December 31,
2014, and then destroyed. Your name and other facts that might point to you will
not appear when we present this study or publish its results. The findings will be
summarized and reported in group form. Please note that data transmitted over the
Internet may not be secure; however, to protect the information you submit, IP
addresses will not be collected and you will not be identified personally.
VII. Contact Persons:
Contact Dr. Stephen Harmon at (404) 413-8064/[email protected] or Wayne
Dennison at (770) 499-3151/[email protected] if you have questions,
concerns, or complaints about this study. You can also call if think you have been
harmed by the study. Call Susan Vogtner in the Georgia State University Office of
Research Integrity at 404-413-3513 or [email protected] if you want to talk to

138
someone who is not part of the study team. You can talk about questions, concerns,
offer input, obtain information, or suggestions about the study. You can also call
Susan Vogtner if you have questions or concerns about your rights in this study.
Research at Kennesaw State University that involves human participants is carried
out under the oversight of an Institutional Review Board. Questions or problems
regarding these activities should be addressed to the Institutional Review Board,
Kennesaw State University, 1000 Chastain Road, #0112 Kennesaw, GA, 30144-
5591, (678) 797-2268.
VIII. Copy of Consent Form to Subject:
PLEASE PRINT A COPY OF THIS CONSENT DOCUMENT FOR YOUR
RECORDS, OR IF YOU DO NOT HAVE PRINT CAPABILITIES, YOU MAY
CONTACT THE RESEARCHER TO OBTAIN A COPY
☐ I agree and give my consent to participate in this research project. I understand
that participation is voluntary and that I may withdraw my consent at any time
without penalty.
☐ I do not agree to participate and will be excluded from the remainder of the
questions.

139
APPENDIX B
INITIAL SURVEY INSTRUMENT
Critical success factors (CSFs) are those limited number of things which help ensure the
success of a particular effort. For instance, critical success factors for project
management might include such things as top management support, user involvement,
proper communication, etc. This study is attempting to determine CSFs for technological
innovation, adoption, and diffusion in higher education. Please respond to the following
questions as they relate to technological innovation, adoption, and diffusion only.
1. In your opinion, what are the top five critical success factors used to support
technological innovation, adoption, and diffusion in higher education?
1) ______________
2) ______________
3) ______________
4) ______________
5) ______________
2. Please describe other critical success factors that you feel are relevant to
successful technological innovation, adoption, and diffusion in the higher
education arena.
__________________________________________________________________
__________________________________________________________________
__________________________________________________________________
3. Please provide any additional insights you might have concerning critical success
factors for technological innovation, adoption, and diffusion in higher education.
__________________________________________________________________
__________________________________________________________________
__________________________________________________________________
4. What is your gender?
1) Male
2) Female

140
5. What is your age?
1) Less than 21
2) 21 – 30
3) 31 – 40
4) 41 – 50
5) 51 – 60
6) 61 – 70
7) Over 70
6. What best describes your highest level of education?
1) High school
2) Some college
3) Associate‟s degree
4) Bachelor‟s degree
5) Master‟s degree
6) Doctoral degree
7) Other Graduate or Professional degree, please specify
_________________
7. What best describes your primary affiliation?
1) Part-time Faculty
2) Full-time Faculty
3) IT Leader/Manager
4) Manager/administrator (Non-IT)
5) Other, please specify ____________________
8. Are you willing to participate in a brief follow-up telephone interview to discuss
the results of this survey and provide additional feedback? If you answer “Yes” to
this question, your contact information will be requested separately for follow-up
purposes. Upon submitting this survey, you will be directed to a site allowing you
to enter this information.
1) Yes
2) No
Thank you for taking the time to complete this survey.
Your input is extremely important and greatly appreciated.
Survey adapted from Schelin & Garson (2004) Humanizing Information Technology: Advice from Experts
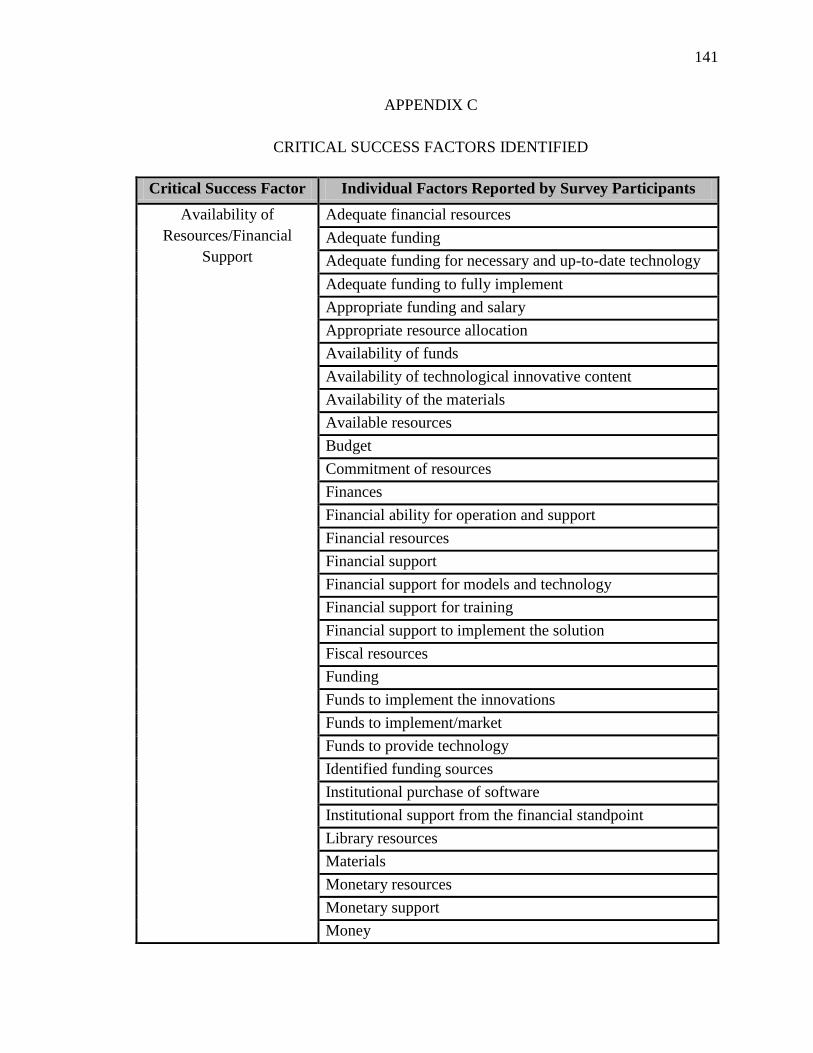
141
APPENDIX C
CRITICAL SUCCESS FACTORS IDENTIFIED
Critical Success Factor Individual Factors Reported by Survey Participants
Availability of
Resources/Financial
Support
Adequate financial resources
Adequate funding
Adequate funding for necessary and up-to-date technology
Adequate funding to fully implement
Appropriate funding and salary
Appropriate resource allocation
Availability of funds
Availability of technological innovative content
Availability of the materials
Available resources
Budget
Commitment of resources
Finances
Financial ability for operation and support
Financial resources
Financial support
Financial support for models and technology
Financial support for training
Financial support to implement the solution
Fiscal resources
Funding
Funds to implement the innovations
Funds to implement/market
Funds to provide technology
Identified funding sources
Institutional purchase of software
Institutional support from the financial standpoint
Library resources
Materials
Monetary resources
Monetary support
Money

142
Money = budget = funding
Online resources
Proper funding
Provision of resources and materials
R&D budget
Realistic budget
Resource allocation
Resources
Sufficient financial support
Sufficient funding
Suitable resource availability
Support
Support and funding
Availability of Skilled
Technical Support
24 x 7 x 365 technical support for faculty and students
24/7 IT support
Academic support services
Academic technology support staff
Access to technical support that understands how the
innovation supports teaching and learning
Adaptive technical support
adequate and timely tech support
Adequate IT support
Adequate staff for technical support
Adequate staff to support the user
Adequate staffing for technical support
Adequate support
Adequate support for faculty during the implementation
phase
Adequate support for users after the technology has been
adopted
Adequate technology resources
Adequate technology support for faculty
Adequate technology support from IT
Availability of "expert(s)" to assist with the implementation
of the innovations
Availability of quality technical support
Availability of technical support

143
Available and supportive support staff
Available support phone line, instant message, or people
serving technically challenged users
Available technical support
Campus support that promotes and supports innovation
Constant and comprehensive technical support
Continuing support for faculty
Continuing support for students
Continuous technical support
Convenient access to support staff
Easily accessible and immediately available IT support for
faculty and students
Effective technical support
Excellent support
Excellent technological support
Flexible IT staff that know about new technology and are
willing to implement it and support it
Functional IT department
Glitches are fixed quickly and information is not lost
Good backup support for technology problems
Good IT support for new technology
Good technical support
Great help
Hands on direct support for faculty
Hands-on faculty support
Hardware and software personnel available
Having a great support staff
Having support personnel for questions
High level of IT support
High quality customer service
Integration support
Intensive technical support
IT assistance
IT help desk commitment
IT proficiency/capabilities (well trained and competitively
paid tech support)
IT staffing support for students and faculty

144
IT support
IT support - 24/7
IT support - there is someone I can ask for help
IT support of the kind that fixes things when and where
needed
IT support, including flexibility on policies and procedures
where necessary
Knowledgeable support personnel to assist with technical
challenges of technological innovation
Knowledgeable technical support
Knowledgeable, continuous support
Local personnel to provide on-going support for the
technological innovation
On-campus technical support
Ongoing support
Personnel to maintain
Providing clear directions for seeking assistance
Quick response to support request
Readily available support
Reliable local (to the institution) support specifically for the
program
Reliable local tech services support for all other related
matters (technological)
Responsive technical support
Responsive, timely technological support
Staffing Support
Standing team of technical experts to provide prompt
support when needed
Strong IT support
Strong Support/Help Network
Sufficient technological support (including 24/7 access to
support)
Sufficient number of technology support personnel
Sufficient support staff to train and maintain hardware and
software
Support by the IT staff at the institution
Support for faculty

145
Support for faculty and students in the use of the
technology
Support for implementation
Support for students
Support for technology
Support from educational technology staff on campus
Support from IT
Support personnel who are familiar with the innovation
Support phone line
Support readily available
Support readily available from person knowledgeable about
the technology and about higher education
Support staff
Support staffing
Support technicians
Systems support
Technical support that is accessible and knowledgeable
Technical assistance
Technical personnel should be available to respond to
troubleshoot
Technical staff competency
Technical staff skill set
Technical support
Technical support availability
Technical support during use
Technical support for instructors
Technical support for students and faculty
Technical support services
Technical support staff for the innovation
Technical support system
Technical support to faculty
Technical support to users
Technology support
Technology support staff availability to assist faculty
Timely responses to problems
Timely troubleshooting support

146
User support from qualified techs (of the site/software
involved)
User support or technical help/assistance
Availability of
Technology/Infrastructure
Ability of IT to support concepts taught
Access
Access and availability of technology
Access by users
Access on and off campus
Access to equipment
Access to hardware
Access to innovations
Access to internet, software, and hardware in and out of the
classroom
Access to latest technology
Access to necessary hardware.
Access to software
Access to technology
Access to technology - internet, software, hardware should
be available both in and out of class
Access to technology that best supports each discipline
Access to the technology
Accessibility
Accessibility for all users
Accessibility for everyone
Accessibility of whatever is created
Acquiring and maintaining up-to-date technology - both
hardware and software
Adequate equipment in terms of internet connections that
can handle the volume without reduction in speed
Adequate infrastructural support from institution
Adequate infrastructure
Adequate servers, hardware, software, etc.
Adequate software
Adequate technological infrastructure (Fiber backbone, etc.)
An institutional commitment to provide the infrastructure
and technology tools which faculty desire
Appropriate infrastructure
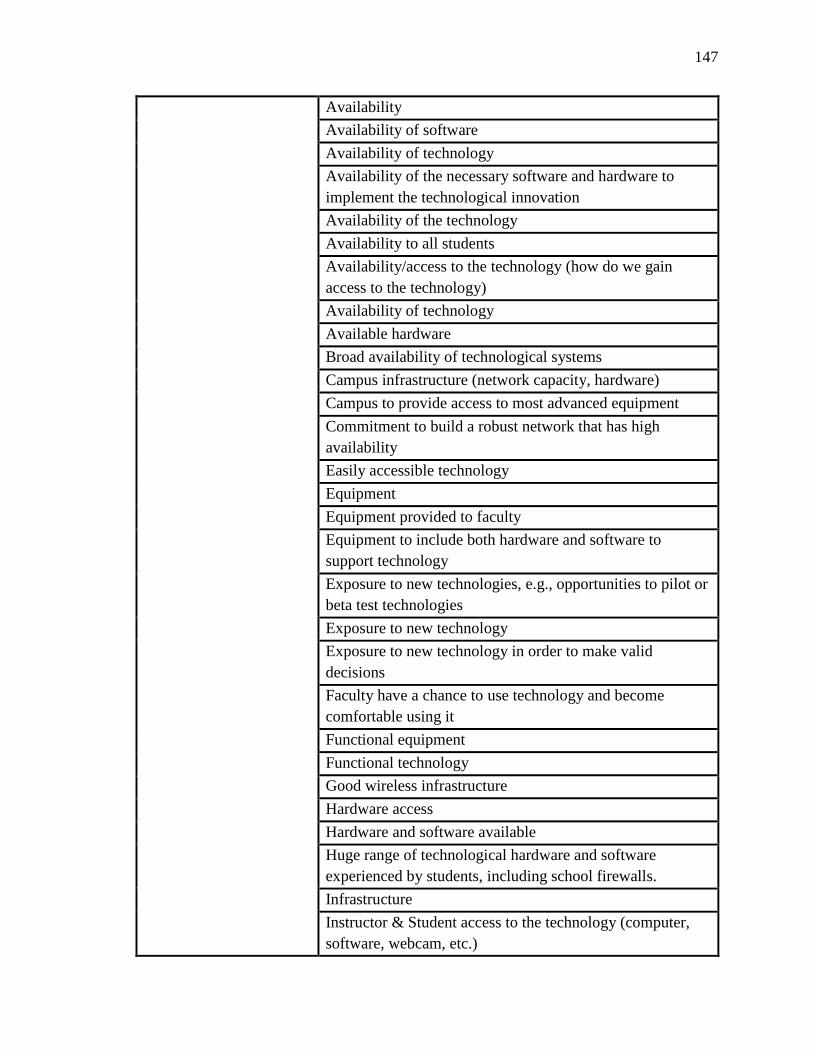
147
Availability
Availability of software
Availability of technology
Availability of the necessary software and hardware to
implement the technological innovation
Availability of the technology
Availability to all students
Availability/access to the technology (how do we gain
access to the technology)
Availability of technology
Available hardware
Broad availability of technological systems
Campus infrastructure (network capacity, hardware)
Campus to provide access to most advanced equipment
Commitment to build a robust network that has high
availability
Easily accessible technology
Equipment
Equipment provided to faculty
Equipment to include both hardware and software to
support technology
Exposure to new technologies, e.g., opportunities to pilot or
beta test technologies
Exposure to new technology
Exposure to new technology in order to make valid
decisions
Faculty have a chance to use technology and become
comfortable using it
Functional equipment
Functional technology
Good wireless infrastructure
Hardware access
Hardware and software available
Huge range of technological hardware and software
experienced by students, including school firewalls.
Infrastructure
Instructor & Student access to the technology (computer,
software, webcam, etc.)

148
Internet Access
Internet must work and be functional all the time,
accessibility
Internet should be accessible
Need to have the framework, network facilities, access that
make innovation possible
New technology
Provision of hardware/devices and software
Reliable infrastructure
Robust infrastructure
Robust network
Server capabilities and bandwidth
Software access
Sound technical infrastructure
Strong infrastructure
Strong technological infrastructure starting from the ground
up
Sufficient access to technology so use is not a challenge
Technological availability
Technology available in a classroom
University infrastructure for technology
Up to date equipment
Up to date technology
Updated computers in faculty offices
Updated technology
Up-to-date computers, sustainable internet connection, user
friendly applications, etc.
Up-to-date hardware and software
Up-to-date software
Variety of delivery methods available
Cost Efficient Affordable
Cost
Cost effective
Cost effectiveness
Cost of the technology must be kept low
Efficient
Free for faculty

149
Inexpensive
Low cost
Price
Technology should be affordable
Ease of Use A system that is easy for students to navigate
Availability to easily employ technology tools
Convenient/easy to use
Ease of adaptation
Ease of adoption
Ease of data extraction from system
Ease of integration into course format (face-to-face, hybrid,
on-line).
Ease of setup by faculty in pre-course preparation
Ease of tool navigation (e.g., intuitive design of the tool)
Ease of uploading information into technological
framework
Ease of use
Ease of use - if the technology is too difficult, it will not be
adopted
Ease of use and implementation in the education setting
Ease of use and integration into practice
Ease of use by faculty
Ease of use by faculty and student in live environment
Ease of use by the instructor
Ease of use by the students
Ease of use for all students, including non-traditional
Ease of use for faculty and students
Ease of use for instructor
Ease of use for students
Ease of use of the technology
Ease of use/degree of difficulty for end-users
Ease of use/user friendliness
Ease of use: the technology itself is user friendly
ease of using multiple systems in the same course
Ease with which professionals can use the technology for a
variety of tasks
Easy for student to use

150
Easy sharing of materials with the class, and among
classmates
Easy to explain
Easy to follow directions/knowledge-base
Easy to integrate with other aspects of the course etc.
Easy to use
Easy to use to communicate with the instructor
Intuitive platforms for student users
Intuitiveness
It must be relatively intuitive for both the teacher and the
learner
KISS - Keep it Simple, as possible starting out
Makes things easier, not more complicated
Meaningful and intuitive platforms
Must be seen "approachable" to less technology savvy
Must be user friendly
New technology needs to be easy to use so that we are not
spending large amounts of time setting it up
Perceived ease of use
Perceived user-friendliness of the technology
Reliable, easy to use course software
Simplicity
Simplicity -- technology should be easy to use to be
adopted
Simplicity of the interface and use thereof
Sound, user-friendly technology tools
Usability
Usability - technology that is easy to learn, and difficult to
master into instruction.
Usability of technology
User friendliness
User friendliness of the technology
User friendly
User friendly directions
User interface design: intuitive and pleasant to use
User-friendly features
User-friendly interface for all integrated software

151
User-friendly technology
Enhances Teaching and
Learning
Active learning oriented
Aids student learning
Appropriate use of technology by students
Audio visual media
Be sure classes have hands on activities
Benefits both faculty and student
Enhanced student learning
Enhances online discussion
Enhances teaching
Enhances teaching and learning
Enhances/supports substantive learning
Faculty believe tech innovation will transform learning
Focus on human cognition and how technology is related to
cognition
Improved learning by students
Improves student outcomes
Improves student retention
Improves student understanding of the subject matter
Improves teaching
Incorporates effective use of social media for teaching
Incorporation of technology into courses aids student
learning
Increases communication between student/student and
student/teacher
Increases student satisfaction with coursework
Integration into the curriculum enhances student learning in
a meaningful manner
It complements the pedagogy
Meaningful applications beneficial for teaching
Must enhance the learning experience
Pedagogical appropriateness of usage
Pedagogical theory training behind technology integration
Pedagogical purpose
Software that aids educator with teaching
Student learning
Student learning outcomes

152
Students are often more engaged in learning
Technologies demonstrably supportive of course goals
should be used
Technology allows all students to contribute to the
conversation
Technology is a natural part of the learning outcome
Technology makes a difference in educational
outcomes/learning objectives
The technology is usable to the student AFTER they leave
class
Ties to course materials e.g. ebooks, wileyplus
Underlying reason or impetus for the technology must be
student-centered
Understanding of how the technology impacts instruction
Use clearly makes teaching, communication, research,
easier and/or better
Use enhances classroom experience
Value placed on iRadar diagrams were used to provide
visual representations of the responses to easily identify
where there was potential agreement Innovation supports
student success
Executive/Administrative
Level Support
A "sponsor" at sufficient level of authority to follow
through on initiative and remove barriers
Administration support
Administration support - provide time for development and
learning of technology
Administration support and feasibility
Administration's support of innovation
Administrative buy-in
Administrative buy-in to push faculty members, staff, and
students forward
Administrative encouragement for faculty
Administrative leadership supportive
Administrative leadership/support
Administrative level support
Administrative support
Administrative support (i.e., deans' advocacy)

153
Administrative support and commitment for funding, time,
and goals
Administrative support for faculty
Administrative support in faculty experimenting with
different methods
Administrative support of innovation
Administrative support, buy-in
Administrator buy-in
Administrative support
Administrative support/buy-in
Adoption by university leadership
An administration that supports online teaching
An institutional champion
Buy-in at executive level
Buy-in from administration so that there will be upper level
support
Buy-in from administration to support the innovation
Buy-in from deans and department heads so they there will
be support there
Buy-in from department leaders
Champion at administrative level
Champion(s)
Commitment and focus from leadership to develop an
online learning program
Commitment from leaders
Committed leadership at the college and department levels
Current results must be noticed by those with the power to
make a difference
Departmental support
Departmental support and encouragement
Departmental/college support for tenure
Department-level support
Enthusiastic support from school top executive
Evangelists -- from top leadership to well-connected folks
throughout the organization
Executive level support

154
Executive Management leading the vision: i.e. top priority
for Presidents, Provosts, etc.
Executive sponsorship
Executive sponsorship and support.
Expert leadership
Great technology leadership
Higher administration support
High-level support - president and his reports must
understand how it helps the campus and believe in it
Idea champion at administrative level
Institutional administrative buy-in
Institutional and administrative advocacy and commitment
Institutional support of chief technology officer(s)
Institutional support/mandates
Interpersonal skills of leaders
Knowledge of technology at decision making level
Leaders support that not everyone will embrace the
innovation
Leaders take steps to embed the innovation/adoption in to
the culture of the institution
Leadership
Leadership empowers units to develop programs and
initiatives
Leadership focused on innovation and open to financial
support
Leadership in the form of a VP or Asst. VP in charge of
teaching technology
Leadership must support innovation
Leadership support
Leadership who promotes innovation and has the ability to
attract and keep the best employees for the project
Management needs to understand the technology and be
aware of what is required for implementation
Management support
Management support for new way of working
Management support of the innovations
Management needs to lead the initiative, and provide clear
separation of tasks to avoid duplication of efforts

155
Mid-level support - deans and mid-level managers must
understand how it helps the campus and believe in it
Motivated leadership
Necessary to have a VP on the central administration team
with a technology/information portfolio
People in power must care about results and communicate
the opportunity to faculty
Post-implementation support from administration
Senior academic leadership support (president, provost,
dean)
Senior leadership that listens to the needs of its
communities on interest and practice
Senior level support
Senior management support
Sponsorship from the executive level
Strong and stated support from leadership
Strong leadership behind the innovation
Strong support from administration
Strong, supportive leadership -- to some extent, have to
mandate some changes to get people to adopt them
Support by administration for new technology
Support from above
Support from administration
Support from administrators
Support from administrators/those who control the money
Support from higher level decision makers
Support from leadership
Support from leadership and colleagues
Support from management
Support from the administration for the technology
Support from the president's office
Support from upper administration
Support from upper management
Support in the form of adoption of technology by upper
level management
Support of administration
Support of administration - all levels

156
Support of administrators
Support of campus leadership (president's cabinet)
Support of department
Support of management (university and college level)
Support of technological leadership
Support of the administration
Support of the institution's top leadership (e.g., president,
provost, deans)
Support of upper-level administrators
Technology-wise intelligent and experienced
management/administration
Top administrative support
Top down support
Top Down Support - Encouragement from administration,
tying to mission, etc.
Top level administrative support
Top level institutional support for innovation
Top level support
Top management emphasis on need for innovation
Top management honesty about the benefits both
institutionally and personally to those switching to new
technologies
Top management support
Top management support for adaptation and retooling
Top management support for desired goal of the technology
innovation
Top management supports technology in all its aspects
Top management team support
Top management who have some understanding the stress
on faculty when there are so many IT changes and classes
have to still go on
Top-level management support (leaders should be early
adopters)
Total management support
Understanding of student needs by top management and
principal decision makers
University support

157
University support through purchase, dissemination and
training of products to faculty
Upper administration understanding of the time and costs
needs
Upper administrative support
Upper level management support
Upper management support
Upper management support, help and understanding
Valuing of innovation/adoption/diffusion by administrators
at the college/university
Visible senior management involvement
Vision by leaders but also ability to listen to users
Visionary leadership
Visionary support (leadership)
Incentives/Rewards/Time
for Innovation
A compelling reason, purpose, or problem that is solved by
the technology such that is answers the question, "what's in
it for me?"
A reward system that encourages innovation in teaching
Adequate release time for training/research
Adequate time to assimilate into curriculum
Adequate time to create and prepare materials
Available time - many facilitators cannot find the time to
acquire and practice knowledge and skills
Competitive salaries for support personnel
Course reduction while new skills are being mastered and
implemented
Credit towards tenure and promotion for technological
innovation and leadership
Faculty and staff time to explore new ideas and experiment
faculty have time to pilot innovative technologies and
assess those pilots
Faculty having the time to explore new technologies or
methods for the classroom
Faculty incentives
Faculty must be rewarded for using new technologies
Faculty or end-user's free time to explore new applications
of technology

158
Faculty release time
Faculty release time to develop materials
Faculty release time/stipend
Faculty rewards
Financial and/or release time support for development
Funding of staff salaries
Give users adequate time to assimilate new technologies
Incentive for collaboration
Incentive for innovation in teaching
Incentives
Incentives for adoption
Incentives for adoption of innovation in the classroom
Incentives for faculty
Incentives for faculty who are early adopters
Incentives for faculty/staff to develop/implement new
technology
Incentives for incorporating new technology (e.g. faculty
development fund as a reward)
Incentives for training
Incentives of using technology
Incentives to use the technology
Incentives/stipends
Innovators and early adapters given time to implement
strategies and form templates for use by hesitant adapters
Make it desirable by providing incentives
Match of innovation to rewards structure or policies
Motivate faculty by offering rewards/incentives
Motivating faculty to embrace it through use of incentives
Motivation of faculty
Motivation of stakeholders
Motivation of using technology
Motivation/incentive for those who are lagging behind
Promotion
Promotion and tenure process takes faculty efforts into
account
Providing release time for faculty training and demos

159
Recognition for faculty in terms of the promotion and
tenure process
Recognition of and reward for the amount of time a person
spends to integrate technology
Recognition of effort
Recognition of innovators
Recognition in areas such as promotion and tenure
decisions
Relation to T&P process
Relative advantage for person using the technology
Release time for faculty
Release time for innovation
Release time to learn new technology
Release time to prepare materials and learn new systems &
applications
Reward for using the technology
Reward structures are in place for faculty to take risk with
innovation, adoption, and diffusion
Reward successful researcher and innovator
Reward system for adoption
Reward system--small grants for innovative project
implementation
Rewarding users for adopting new technologies
Rewards for innovators
Some type of compensation for early adopters and others
who buy in
Sufficient integration time
Sufficient time for innovation
System that enables reassigned time for faculty who help
defuse technology at their institutions
Time
Time - do we have the release time granted to us to
develop/learn/utilize the technology
TIME - for planning, diffusion, training, implementation -
creative work doesn't happen on top of overload
Time available for faculty to explore and stay current with
using the technology
Time commitment for adoption

160
Time for development
Time for exploration
Time for faculty to design instruction
Time for faculty to develop technology-based lessons
Time for faculty to innovate - load
Time for faculty to learn how to use new technology
Time for the innovation/adoption/diffusion to take place
Time for training
Time in schedule and encouragement
Time in schedule to innovate
Time management
Time release from other duties for
Time to adapt to change
Time to explore
Time to incorporate technological tools (course release to
prepare new courses, etc...)
Time to prepare and test technology
Time to prepare materials
Time to train users
Time to trial or practice a technological innovation
Time, time, time
Time--reasonable faculty workload to allow time for
technological innovation
User incentives
User time to experiment
Work environment that gives time for innovation and
creativity
Work related to technological innovation and diffusion,
depending on the context, is recognized as scholarly work
that is counted for tenure and promotion
Innovative
Culture/Collaborative
Environment
A community of colleagues that encourage and support the
use of technology to improve learning
Ability to experiment with technology without retribution
Ability to fail without negative repercussions
Acceptance among persons using the technology
Acceptance of the populous, part of culture, to accept and
adopt change

161
Accepting that students like different and new technology
An atmosphere conducive to new ideas
An environment (company or school) that promotes
innovation
An environment that encourages risk taking
Appropriate institutional consideration of technology
innovations
Atmosphere that supports taking chances
Being open to technological innovations for increasing
speed and accuracy of processes
Breaking inertia
Change factor
Changing the culture to embrace change
Collaboration
Collaboration among colleagues
Collaboration among departments and universities
Collaboration beyond IT
Collaboration with corporate stakeholders
Collaborations
Collaborative efforts for sharing and creating innovative
ideas
Collaborative environment
Collaborative teams of colleagues implementing a
technological innovation
Communication among users of technology
Communication amongst educators
Communication between stakeholders
Communication regarding innovation
Critical thinking encouraged
Cross departmental working groups
Culture of innovation at the institution
Culture of pedagogic improvement and excellence
Culture of risk taking and understanding that things aren't
perfect at inception
Culture or climate where innovation is encouraged, from
the program through the institution

162
Culture should support user training (communication +time
and money)
Culture that supports trying new things and processes for
getting help when stuck
Current practices support innovation
Diffuse, collect and collaborate the feedback received
Effective collaboration between instructional technology
and IT
Empowered instructional faculty to experiment with
technology
Environment where risk-taking is rewarded and failure is
not punished
Facilitated sharing -- dialog
Faculty and administration open-mindedness to change
Faculty who want to innovate not having the innovation
thrust upon them (example: you will teach online physics)
Flexible, responsive culture to innovation in learning
Fostering an environment that accepts change and rewards
creativity
Good examples of early adopters
Good IRB processes
Having access to people who can forecast trends accurately
for your industry
Having an open-mindedness for using technology
Having brainstorming groups to share innovative ways it is
being used
Having the ability to fail repeatedly before success
Informal leadership support on campus from faculty
respected by peers
Information exchange
Infusion of younger faculty willing to experiment with
technology
Innovation
Institutional climate that allows innovation
Institutional commitment
Institutional culture
Institutional culture that supports change and innovation

163
Institutional culture valuing technology and technology
innovation
Institutional policies that encourage, not discourage,
innovation
Invoking critical thinking
Make it OK to fail
Mentoring and/or instructor-to-instructor discussion or
sharing of ideas
Mentoring best practices for technologies
Modeling use
Observing another professor use tech in interesting ways
Once a few faculty members have used the particular
innovation and can demonstrate its success, other faculty
are more likely to get involved
Open-minded environment & seeking innovation
Openness to change from participants
Opportunities for faculty to learn from each other and
discuss implementation of innovations
Opportunities for faculty to practice the use of technology
outside classroom
Outside rotations to shadow/participate in the corporate use
of like equipment
Participation and support for colleagues and students
Partnerships with K-12 schools that are doing incredibly
innovative work
Peer adoption
Peer support
Peer support groups
Personnel whose primary responsibility is to facilitate
innovation and diffusion
Persuasion - provide a persuasive approach (positive
psychology).
Positive attitudes of employees toward the innovations
Positive outlook in regards to the fast pace of change in the
field
Positive word of mouth
Promote independence
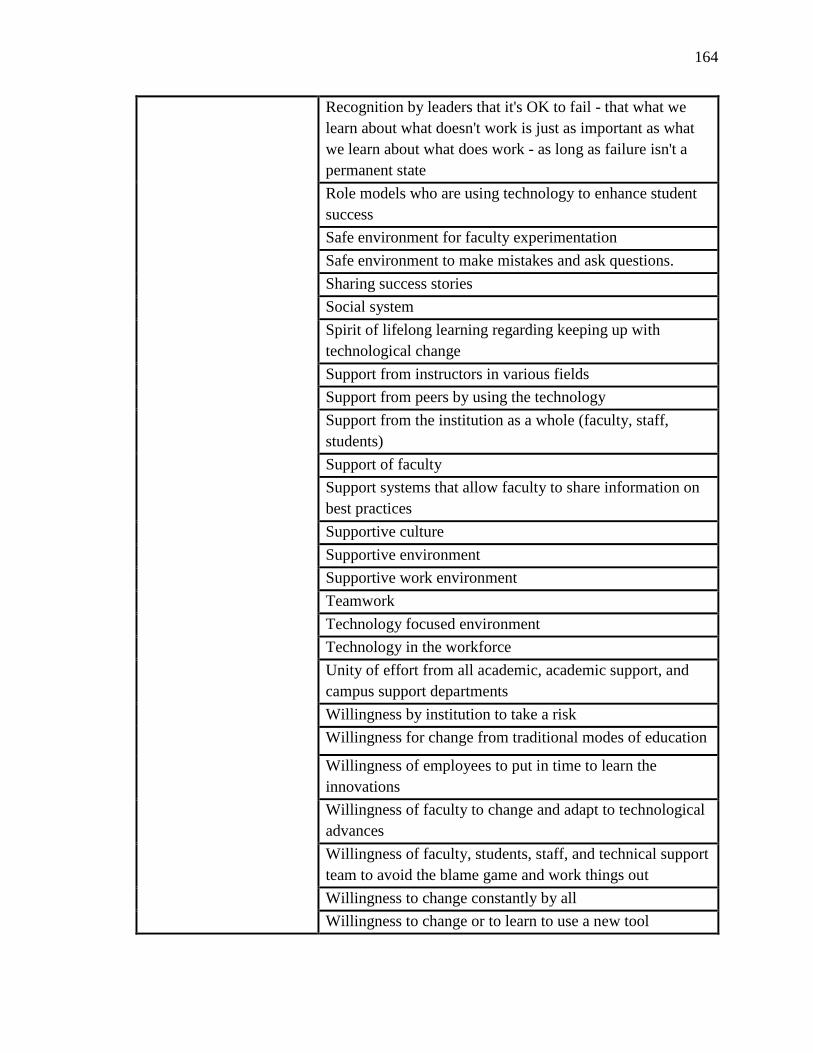
164
Recognition by leaders that it's OK to fail - that what we
learn about what doesn't work is just as important as what
we learn about what does work - as long as failure isn't a
permanent state
Role models who are using technology to enhance student
success
Safe environment for faculty experimentation
Safe environment to make mistakes and ask questions.
Sharing success stories
Social system
Spirit of lifelong learning regarding keeping up with
technological change
Support from instructors in various fields
Support from peers by using the technology
Support from the institution as a whole (faculty, staff,
students)
Support of faculty
Support systems that allow faculty to share information on
best practices
Supportive culture
Supportive environment
Supportive work environment
Teamwork
Technology focused environment
Technology in the workforce
Unity of effort from all academic, academic support, and
campus support departments
Willingness by institution to take a risk
Willingness for change from traditional modes of education
Willingness of employees to put in time to learn the
innovations
Willingness of faculty to change and adapt to technological
advances
Willingness of faculty, students, staff, and technical support
team to avoid the blame game and work things out
Willingness to change constantly by all
Willingness to change or to learn to use a new tool

165
Willingness to change/adopt
Willingness to open to new technologies
Willingness to succeed by all involved
Willingness to take risk
Willingness to try new things.
Work environment that's conducive to innovation
Perceived
Value/Addresses Need
A compelling idea or need
A need
A practical need for a product
A software driven solution
A system that gives professors detailed information about
course and individual grades and such
Ability of the new technology to address or overcome an
existing problem
Actual need/usefulness
Actual relevance of the technology to the pedagogical
situations in which it is expected to be applied
Addressed a need or problem
Addresses need for change
Adds value to distant learning
Applicability or practicability of technology
Application in all fields
Appropriate business case
Clarity of practical value
Clear demonstration of value
Clear identification of the value the technology
Clear rationale as to value the technological change-
innovation-diffusion will add
Communication about available opportunities and benefits
of technology
Communication about the need for change
Confidence by early adopters that the innovation is widely
usable in multiple settings - prove it works for me
Create excitement about using item by showing its value
Degree to which the technology allows individuals to meet
goals

166
Demonstrated need - implemented to solve a particular
issue/problem
Demonstrations of real-classroom applications in a large
variety of disciplines
Easily identifiable benefits and uses
Faculty buy-in/perceived benefits
Faculty must see the need for the use of new technologies
Faculty support - must understand how it helps the campus
and believe in it
Feeling by faculty and staff of success
Finding out what MOOCS can be transferred (articulation
agreements) to regular courses
Fit of innovation within the existing system
Fit of the innovation within the learning environment
For adoption, buy-in from users that a change is needed and
the new way will be better
Fully understand the problem or the issue to be addressed
by the technological innovation
Functionality
Good choices in terms of the technology chosen
Having real world applications
Identification of critical areas that require technological
intervention
Identified need
Improves delivery system
In education, pre-service teachers can see a use for it in
their future classrooms
It extends the role of the nurse and makes it possible to do
more or document more accurately
It must reach some critical threshold in terms of functions
or services rendered
It simplifies patient care or documentation
Keep up with trends in society
Local business support/needs - Do they want
technologically proficient employees or see the value?
Making sure the innovation/change is
worthwhile/meaningful
Matching technology to need

167
Meaningful for faculty and staff
Meaningful for students
Meets a need
Must be viewed as necessary by the student
Must meet a need or help solve a problem
Need
Need assessed by classroom teacher
Need for improvements
Need for technology
Need of tools - applicability
Perceived benefit
Perceived need - the innovation must meet a perceived need
for faculty, staff, and or students
Perceived need for innovation
Perceived need for/benefit of the technology
Perceived need to change/adopt
Perceived usefulness
Personal gain
Prior evidence of the technology's utility
Problems to solve -- improvement orientation as opposed to
status quo
Rationale
Relevance
Relevance - sometimes technology is introduced that does
not add to more effective output
Relevance to what and who you are teaching
Relevancy - new technology needs to align with a real
campus need in a way that's meaningful to faculty and
students
Relevant to my research or teaching
Satisfies a specific need
Sense of urgent need
Solve an identified problem - identified by those who will
be most affected by the innovation & adoption
Solves a known problem for constituents
Students evaluate that the technology is meeting their needs
Students understand the purpose for its use

168
System selection to address current needs
Technology that makes people's work easier and not just
technology for the sake of technology
The actual viability and usability of the technology and its
ability to make a given process BETTER
The identification of issues/problems that can be addressed
through using technology
The needs of society
The technology is applicable
Understanding how it will help with my job
Understanding its benefits
Understanding of and skills in matching what technology
can do and what activities education requires
Understanding the benefits
Use technology must have clear benefits to both faculty and
students to be useful
Usefulness
Usefulness of the innovation
Usefulness of the technology
Users can see a need for the technology
Utility
Utility provided by the technology
Professional
Development & Training
A series of promotion and adoption workshops on a new
technology
Access to technology training
Adequate "how-to" training and support
Adequate development opportunities for faculty, staff, and
students (to include follow-on training)
Adequate instruction in how to use
Adequate IT training for faculty and students
Adequate training
Adequate training (providing a practice environment to
make errors and learn to solve problems)
Adequate training for faculty
Adequate training for faculty and staff to utilize technology
currently available to them
Adequate training for faculty, staff, and students

169
Adequate training for users
Adequate training is provided to faculty and students
Alternative instruction
An orientation system for first-time online students
Appropriate and adequate training of users
Appropriate preparation of student users
Appropriate professional development
Appropriate training in the use of new technology
Appropriate training opportunities
Appropriate training over time, not just a few weeks
Appropriate training to prepare students and faculty as both
users and innovators; standards and best practices should be
emphasized
Attending relevant conferences and sessions
Availability of training
Available online documentation- detailed instructions and
FAQ
Available training
Being sure the individuals teaching the new technology
understand that those in the audience are new to the system
and they do more than just quickly go thru it
Best practices for training for faculty and staff to better
include technology in their work
Books and training materials
Buy-in of all faculty through training
Carefully constructed course templates and training
materials for use by adjuncts and limited term instructors
Coaching - beyond training meet/consult with those most
affected by the change
Comprehensive training for professors
Continued education on new technology
Continuous education of faculty/staff in utilization of
technology
Convenient training that involves actually using the
technology
Curriculum Design Services: We need to increase the
amount of support we provide to the faculty to revise their
curriculum to leverage new technology in their teaching.

170
Easy to use or learn tutorials online, onsite seminars
available
Education
Education and training
Education for faculty
Education of the users
Education, you can buy all the technology but if the end
user does not know how to use the success rate will be low
Education/training
Education/workshops on the project/technology
Educational resources to train faculty
Effective development
Effective faculty development center
Effective training for users
End-user education - the audience needs to know how to
use it
End-user training
Excellent - high quality faculty training
Excellent support for assisting faculty to learn how to make
effective pedagogical use of software, applications, and
technologies
Faculty and staff must have access to quality training with
qualified trainers
Faculty development
Faculty development - we need to increase the comfort of
faculty in leveraging/using new technologies
Faculty development and continued support
Faculty development offerings for train the trainer
Faculty development opportunities
Faculty development programming
Faculty development/training
Faculty education and buy-in
Faculty training
Faculty training and support for use in classrooms
Faculty training in best practices
Faculty/staff development
Follow up training

171
Funded training
Good training and support
Good training support
Hands-on training
Having a tech trainer that is easy to ask even the most basic
questions makes faculty feel empowered
Having a wide variety of training opportunities available to
prospective adopters
Highly trained experts to train faculty
In-service training for faculty and staff should be made
available
Instruction availability about how to use technological
interventions
Instruction on how-to-use
Instructor & student training on how to use and implement
the technology
Instructor training
Instructor training and learning of useful skills/knowledge
Instructor training courses and workshops
Multiple paths to learn the technology (workshops, online
tutorials, consultations)
Multiple versions of tutorials (you-tube, computer
interactive, pdf, group and individual instructions)
Offering a variety of training methods to address all
learners
Offering timely training and providing clear tutorials
On-campus faculty development support
Ongoing professional development of IT staff
Ongoing professional development opportunities for faculty
and staff
Ongoing training
Ongoing training for instructors
Ongoing training opportunities
Opportunities for ongoing training
Opportunities for technology training
Orientation on "how to" for non-traditional students who
might be more apprehensive or unsure
Paid training opportunities

172
Pedagogical and technological training of faculty
Professional development
Professional development and training
Professional development in the use of the technology to
support teaching and learning
Professional development on campus
Professional development on technology use
Professional development opportunities
Professional development opportunities for end users
Professional development opportunities for implementation
of technological innovation
Professional development specific to content area
Proper faculty development to provide support for the
change and potential curricular design
Proper instruction for deployment of technology in
education
Proper instructional professional development
Proper training
Proper training and development
Proper training and resources
Proper, across the board training
Providing training to support faculty innovation and
adoption
Quality faculty training on how it can be implemented in
the classroom
Quality faculty training on how to operate the technology
Quality training
Quick, dependable access to help aids - resume
development, interview skills, etc.
Staff development
Staff development for professors in ways to use tech
innovation
Staff training and development
Stakeholder training
Student training
Student training -- don't assume millennials know how to
use tech!
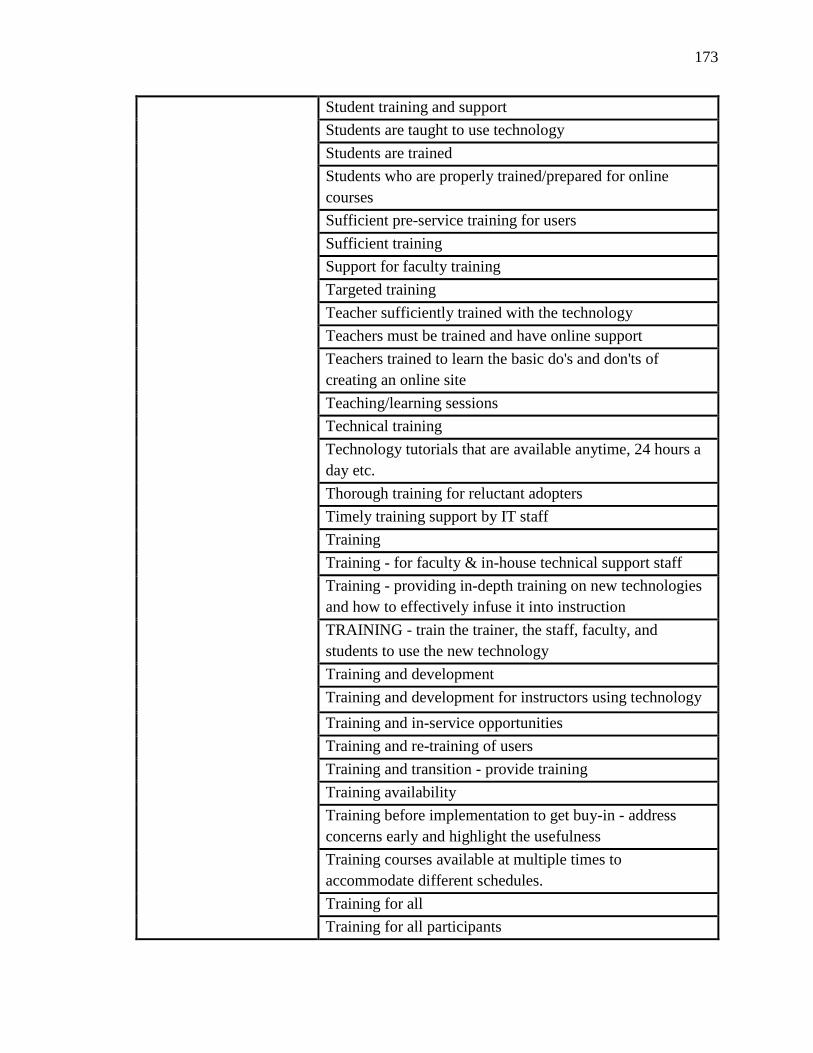
173
Student training and support
Students are taught to use technology
Students are trained
Students who are properly trained/prepared for online
courses
Sufficient pre-service training for users
Sufficient training
Support for faculty training
Targeted training
Teacher sufficiently trained with the technology
Teachers must be trained and have online support
Teachers trained to learn the basic do's and don'ts of
creating an online site
Teaching/learning sessions
Technical training
Technology tutorials that are available anytime, 24 hours a
day etc.
Thorough training for reluctant adopters
Timely training support by IT staff
Training
Training - for faculty & in-house technical support staff
Training - providing in-depth training on new technologies
and how to effectively infuse it into instruction
TRAINING - train the trainer, the staff, faculty, and
students to use the new technology
Training and development
Training and development for instructors using technology
Training and in-service opportunities
Training and re-training of users
Training and transition - provide training
Training availability
Training before implementation to get buy-in - address
concerns early and highlight the usefulness
Training courses available at multiple times to
accommodate different schedules.
Training for all
Training for all participants

174
Training for faculty
Training for faculty and facilitators in effective pedagogy
and methods to effectively incorporate technology for
powerful learning
Training for our students in how to ready for and use
various tools we'll use (as we cannot/should not have to do
that)
Training for students
Training for usage
Training in new technologies
Training in the effective use of technology
Training in the ethical use of intellectual property for both
students and faculty
Training in the innovations
TRAINING of faculty and students expected to use the
technology
Training of faculty in proper use of technology
Training of staff who will use the technology
Training of students by professors
Training of students in proper use and access to technology
Training opportunities for instructors
Training opportunities for students
Training opportunities that match the needs of the faculty
Training or continuing education when appropriate
Training regarding legal issues pertaining to use of various
technologies available
Training the users
Training, training, training
Training, training, training (and self-help/FAQs)
Trainings
Tutorials or workshops related to technology use
User training
User training: huge range of student technological
capability and comfort
Varied and user-friendly teaching seminars/how-to demos
in new technological innovations
Window of training/implementation for mandatory systems,
i.e., changing to a new LMS

175
Workshop demonstrations
Workshops and/or training sessions
Workshops for dissemination
Written resources that are readily available
Project Management A small and empowered project implementation team
A successful pilot test
A well-developed project management implement plan
A well-defined yet flexible execution process
Adequate project testing
Appropriate project management infrastructure
Back-up plan in the event of failure
Defined timeline
Early project management
Effective communication plan
Empower the best people/team members
Excellent project management
Excellent project management - there are many
stakeholders in higher education who must all have a voice
Flexibility and timing of implementation
For evaluation of technologies and test runs, use the most
talented, creative people to work on the project
Fully developed plans for adoption, implementation and
diffusion
Good change management
Good project management
Good time management
Implementation during the down time of academic calendar
Implementation management
Limit on the number of changes occurring in the same time
span
Long periods of overlap between older systems and newly-
adopted systems/technologies
Pilot projects
Pilot/testing prior to adoption
Piloting
Project management plan in place

176
Project management that expresses a clear delineation of
the purpose and goals of the technology
Project preparation
Project team expertise
Reasonable scheduling
Reasonable timeline
Remaining within project scope of initiative (do not tolerate
much scope creep)
Roll out with few glitches - sufficient testing time and
resources through adequate project management
Set reasonable expectations for transition and
implementation
Slow, gradual implementation of technology if
implementation is required school-wide
Staffing the project with the right level of technical
expertise to properly engineer truly innovative solutions
Successful pilots need to be widely replicated to get buy in
from faculty throughout the institution - diffusion
Team of creative, yet realistic, person or persons to work on
the problem/project who also share a strong work ethic and
the ability to get things done
Team of leaders in successful pilots must be given positions
of leadership in diffusion
Technology management
The ability to change the project plan in midstream (i.e. if
something isn't working, change it)
The RIGHT people on the project
Thorough testing
Thorough testing before implementation
Timing
Understanding of the effective implementation and usage of
technological innovation
Well thought out implementation plan
Proven Effectiveness "Selling" effectiveness of the idea to those users especially
older ones
A method for rapidly measuring results and broadcasting
them (marketing)

177
Accurate understanding of the possibilities and
requirements, and the difference between them.
After inception of the new technology, frequent checks on
its efficiency fulfilling its objectives
Assessment
Assessment of content
Assessment of teaching
Assessment of use of technology
Assessment to ensure that the technology is meeting long-
term goals and needs
Clear, widely published evidence of success from
pioneers/innovators - prove it works
Come with supporting elements like data collection abilities
Competitive analysis
Continued follow up and improvement
Continuous program evaluation
Cool factor
Data driven
Data-based decision making
Does it have data to support its claims or intents i.e. does it
have tractability?
Don't jump on the latest greatest every time something new
appears
Educational research or survey
Effective methods to monitor and measure performance to
those outcomes
Effective presentation of content
Effectiveness
Enthusiastic proponents based on successful use of said
technology
Evaluate to make sure that it is meeting the objectives of the
department / program
Evaluation
Evaluation of faculty's use of tools
Evaluation of the viability of technology to solve problems,
not being a solution looking for a problem
Evaluation system that recognizes and encourages faculty
efforts in this respect

178
Examples of benefits
Focus on improvement and efficiency
Follow up evaluation after implementation (does it work)
Follow up to ensure tech is working as intended once
deployed
Follow-up
Follow-up survey - continue measure users‟ satisfaction and
obtain feedback from users
Having sound data about your key constituents and their
needs
Identification of best practices
Is it destructive technology or supplemental i.e. does it
replace other tried and tested methods or supplement them?
It provides additional data to use in making assessments and
decision making
Lessons learned
Methodology for assessing learning
More research on the compatibility of current techniques
used in classrooms and student achievement
Need for change from status based on research or results
Outcomes stated in terms of the higher education
institution's priorities
People to monitor the innovation for challenges in its
implementation and use
Positive results
Proven educational outcomes
Realistic expectations
Reassessment after evaluation by students
Reflective lessons as a follow-up
Research
Research into best practices
Re-visioning of traditional evaluation tools
Secure, reliable student identification for evaluation of
learning
Showing the educational benefits of the technology
involved
Solid assessment to establish future implementation

179
Sound reasoning behind proposed changes
Staying current and competitive
Student success and feedback being truly valued by the
faculty and the administration
Success - continuation
Successful application of knowledge
The "cool" factor
There must be evidence of a positive impact on learning
outcomes of students
Thinking through and dealing with the secondary
implications of use of the technology by faculty and schools
Thorough investigation of current process(es) and
limitations (focus groups of end users)
Use of best practices in course design
User studies and feedback
What comparable colleges are doing
Quality, Reliability &
Flexibility of Technology
Ability for technology to adapt to change
Ability to be upgraded
Ability to integrate with other technologies students and
faculty already use
Able to integrate with other systems
Adaptability of the technology, how customizable is the
innovation
Adaptability
Adaptability to other software
Adaptable technology
Adaptable to classroom needs
Adaptation
Adequate protection for students and faculty
Adoption of systems that are compatible (share
information)
Build on systems when possible rather than replace - which
means expanding skills rather than requiring new skills
Clear focus on service capacity and reliability in support of
client expectation
Consistency
Consistency in application
Consistent technology infrastructure

180
Constant availability of new information online
Correctness of the content
Cross-platform
Cross-platform implementations
Cross-platform support (ubiquitous mentality)
Ensures confidentiality
Excellent technical administration - the technology must
seem trouble-free and be integrated with other systems
Features of system
Flexibility of innovation
Flexibility of the technology
Flexibility within the curriculum
Good platform
Good quality equipment
Integration of components (i.e. programs that "talk" with
each other)
Is it durable/adaptable to continuing changes in technology?
IT clearly able to articulate risk and capacity profile for the
management and security of info systems
It is reliable?
It should be flexible and capable of some degree of format
personalization
Latest technology
Multi-platform compatibility
Must be consistently working properly
Obviously the teachers need a usable platform and
necessary add-ons and training--handouts usually work fine
Open standards based
Openly stated assumption of and statement of the risks
associated with deployment of innovative solutions
Openness
Opportunities to teach difficult topics (i.e. TB pts., disaster
drills, etc.) in a safe environment
OS agnostic
Perceived reliability of the technology
Perception of the technology's persistence (i.e. - is it worth
learning this? Will it be replaced in a year?)

181
Persistence
Quality
Quality of infrastructure
quality of innovation
Quality product
Reliability
Reliability of technology when used for teaching
Reliability of the technology itself
Reliable
Robust security
Sate of the art in local market
Software flexibility
Stability and usefulness of the new technology (diffusion)
Strong interface with multiple software/websites/apps
Supported development of websites, course managements
systems, and other resources (library, etc.) for mobile and
tablet devices
Supports many platforms (mobile, etc.)
Technology from various companies "playing well"
together (i.e., D2L and Pearson textbook software)
That it works as it is supposed to work every time
The innovative technology must work - no bugs upon
distribution
The technology must be reliable
The technology works across platforms (compatible with
PCs, Macs, tablets, and other devices).
The technology works as a seamless and unobstructed
support mechanism (i.e., the course does not become
focused on learning the technology at the expense of
substance).
Too many upgrades/new systems that do not transfer prior
work to new software
Type of technology to be adopted and diffused must be
flexible and reliable
Use of excellent applications, programs, software that have
been sufficient tested, and provide top quality learning
experiences for students
Use of risk management and mitigation tracking

182
Versatile (expandable to different types of student activity
and engagement)
Very few glitches or hiccups during early deployment and
continued use
Well-designed, reliable program--e.g., many consider
Blackboard much more "user friendly" than D2L
Skill Level &
Commitment of
Faculty/Students
A technologically literate "final audience" (the students in
our case)
Capability of students to participate in technologically
advanced courses
Clear communication skills on part of faculty
Commitment
Commitment and belief by faculty that technology is useful
- better than traditional methods
Commitment from the participants
Communication skills of faculty and students
Competent instructor
Computer literacy of student population
Emphasis on technical subject matter expertise over
teaching matter expertise
Faculty acceptance of the new technology (adoption)
Faculty and student support for changes
Faculty attitude
Faculty buy in
Faculty buy-in
Faculty buy-in in the process
Faculty buy-in in the technology itself - faculty must be
involved, for example, in the choice of learning platforms
Faculty buy-in, participation
Faculty commitment
Faculty creativity
Faculty dispositions/attitudes toward change and innovation
Faculty familiarity, or similarity with other prevalent
technologies
Faculty initiative and willingness to explore
Faculty interest
Faculty interest/support

183
Faculty skill
Faculty skills
Faculty skills and adoption
Faculty support
Faculty that are adaptive and proactive in a quickly
changing learning environment
Faculty willing to utilize
Faculty willingness to try new things
Having technological knowledge, expertise, experience
with current technology
Human relations: dealing with students claiming tech
problems as the reason for not submitting assignments.
Instructional designers/technologies primary duties should
be instructional design and training
Instructors giving themselves and students enough time to
learn instructional technologies before implementing them
(or assigning them)
Instructors' skills and willingness
Intelligence of participants
Invested faculty convinced that technological innovations
will improve student learning
It sounds hokey, but enthusiasm in all stages! with the end
user in mind
Knowledgeable individuals
Knowledge and skills
Knowledge by the stakeholders of all options
Knowledge of application of ICT
Knowledge of modes of technological communication
Knowledge of technology
Knowledge of the use of the technology, knowledge of the
existence of the technology
Knowledge
Low resistance to change
Math skills
Open minded faculty
Patience
PATIENCE - give it time
Patience, in getting the user to adopt

184
Personal interest
Positive attitude
Positive attitude by users
Positive attitudes
Proactive creative talent
Product knowledge, product awareness among potential
users
Receptive students and faculty
Reiteration of staying the course (maintaining focus and
sense of urgency)
Self-sufficient users
Skilled and motivated users
Social influence - it has been used by the majority of people
and gain popularity.
Student acceptance of innovation
Student acceptance of the technology
Student buy-in
Student buy-in (for instance, regarding innovation in
delivery of education)
Student capability to reciprocate--technology, access,
training, etc...
Student commitment
Student interest
Student readiness
Student skills with technology
Student support
Student support for classroom alternatives to lecture
Student support of technology
Student support, including participation in pilots and other
experiments
Student usage
Student willingness to engage with different learning
experiences
Students
Students become responsible for their success
Student's flexibility in regard to trial and error - if they are
guinea pigs and don't like it, it won't work

185
Students have the requisite technological skills to use the
technology and a willingness to utilize it
Students well-suited to online course work
Students who understand that learning is a life-long activity
Sufficient number of adopters
Teacher must already have a good grip on how to organize
and present material to students
Teacher open-minded to innovation
Technical-pedagogical knowledge
Technology capabilities for faculty
Technology experience of the participants
Traditional age students have little issue with innovation,
but that is not true with non-traditional students
Use it!
User acceptance and willingness
User buy-in
User readiness
User support
Users buy-in
Users willing to take risks
Verbal skill of faculty in explaining the technologies
Visionary users
Willing faculty
Willing supporters
Willingness and effort to innovate
Willingness of faculty
Stakeholder Involvement A variety of communication channels to include
stakeholders
Ability of unknowledgeable stakeholders to ask questions in
an open climate
Active engagement of students and faculty in online
environments
Agreement in the general direction of the project by all
stakeholders, including faculty, staff, and administration
All stakeholders involved in decision
Allowing for feedback from stakeholders
Ample pre-discussion with users/stakeholders

186
Awareness by all stakeholders
Awareness of current findings in the area by all users
Awareness(communication) of MISSION on ALL staffing
levels
Being able to bring staff and users into a common focus of
what's important
Buy in from the academic stakeholders
Buy in to the program success by stakeholders
Buy-in at all stakeholders
Buy-in by faculty and other stakeholders
Buy-in by stakeholders to use the innovation
Buy-in from participants
Buy-in from the local community - parents and community
members
Buy-in from the student stakeholders
Buy-in of stakeholders through inclusion in the purchasing
process
Buy-in or organic support from educators tasked with using
and promoting the technology (cannot be forced on the
untrained or unwilling)
Clear & frequent communication among stakeholders
Clear and timely communication with stakeholders
Clear communication with stakeholders
Clear communication - find out what the needs are and then
draft solutions
Clear communication and information
Clear communication and interaction with stakeholders
Clear communication of value-added
Clear communication with stakeholders (which should be
more than "use this technology!").
Clearly communicating the reasons of technology adoption
Clearly discuss expectations to students on results expected
Clearly discuss grading rubric to judge student work
Clearly stated and shared vision and mission which are, or
to which will be applied, the innovations.
Communicating about innovations to make folks aware of
its benefits
Communication

187
Communication and input from persons likely to use the
technology
Communication before, during, and after the change
Communication channels
Communication from innovators regarding the success and
progress of technology
Communication from the top down to the user
Communication loop to capture and distribute "lessons
learned" - need to pay special attention to stakeholders on
the front lines!
Communication with faculty and students
Communication within the institution
Communication/guidelines
Communications
Communications - communicate that to faculty, who need
to introduce it to students
Communications of availability to users
communications skills (verbal and written)
Community readiness (since the community supports
higher-education, we have to make decisions with some
regard to this aspect)
Control for Admins over areas that affect their department
Decisions made by administration such as adoption of
WEBCT etc., no input from faculty
Defined means of communication including social networks
Direct contact with students
Discussion
Dissemination of information (advertisements) - everyone
knows and anticipates the technology change via different
channels
Early adopters being included in initial discussions
Effective communication
Effective communication at a level the end user understands
End user engagement in planning, procurement, and
deployment process
End-user engagement and buy-in
End-user involvement in planning

188
Faculty are informed and are aware of its availability (this
may seem obvious but we are swamped with info)
Faculty engagement
Faculty input
Faculty input into decision to introduce technology
Faculty input into the products used on campus: course
management system, lecture capture etc.
Faculty involvement
Faculty involvement in decision-making
Faculty voice/being at the table when institutional
technological innovations are selected and implemented
Faculty/staff involvement, including participation in pilots
and other experiments
Feedback from end-users - people don't use technology that
frustrates them
Feedback on effectiveness to drive improvements
Feeling of choice by stakeholders as opposed to no choice
Forums for discussion around the technology integration
Get students engaged - we like knowing what they want
Getting early buy-in by end users
Giving the new technology a prominent place in campus
activities...in other words, the more exposure, the more
likely it is for people to use it.
Good communication
Ground up support - TAs, administrative assistants, etc.
Identifying and engaging the right stakeholders
If system wide mandates, early explanations and rationales
for implementation of mandated technology
Inclusion of all stakeholders (faculty, students and staff) in
the discussions about Tech. innovations to be adopted. A
great deal of information sharing and marketing of the
innovation is needed to get the stakeholders' Buy In.
Inclusion of users and those who support the end-user in the
decision making process
Input from users during the development of the RFP
process
Involve students

189
Involve the user community and those on the fringe in the
decision making and selection process
Involvement
Involvement of IT staff before listening to salespeople and
entering into contracts
Involvement of those using the technology
Listening to needs of campus users
Maintaining communication to diffuse frustration
Majority use/buy-in/awareness
Marketing
Over-communication to stakeholders and support groups
Participation by/support of key staff
Participation in the process--do faculty feel like they had a
voice
Pre-adoption communication to users of the advantages and
limitations of the new technology
Proper communication
Proper communication between faculty & students
Proper communications among all stakeholders
Public buy-in
Public relations campaign
Regular input from instructional faculty
Stakeholder acceptance
Stakeholder buy in
Stakeholder buy-in
Stakeholder discussion
Stakeholder input prior to implementation
Stakeholder involvement
Strong communication throughout implementation
Student engagement
Support bottom-up "grass roots" application of technologies
Support by textbook publishers
Support of a major publishing company
User (faculty and student) understanding
User awareness
User involvement
User Involvement - Cannot stress that enough

190
User involvement in the decision
User involvement in the design & implementation
User participation
Users by audience should be informed of its relevance to
them in a brief catching statement
Widespread involvement in the process
Strategic Planning &
Governance
A clear organizational plan
A decision-making model that fosters teamwork
A goal oriented consistent approach
A strategic vision
A well thought on plan on initial tries
Accountability and standards
Accurate understanding of the near-term and long-term
costs
All technology purchases need to go through ONE
governing body, doesn't matter if it is IT, central
purchasing.
An absolute linkage to the mission of the institution
considering the adoption
An eye on the future rather than the past, in other words,
move forward and seek what can be not what was
Careful planning
Clear and generous rules on sharing of IP and patent rights
Clear goals and objectives
Committee-backed decisions about technology roll-out
Creation of standards, do not need to support two different
brands of Smart Boards in different colleges
Dedicated high level of prioritization of the university
Developing a long-term strategic plan for using technology
and understanding how available solutions could fit in the
plan
Diffusion plan to the university/higher education
organization
Elimination of politics
Faculty and administrative governance mechanisms that
strongly encourage use of the technology
Governance

191
Have a clear understanding of the organizations core values
IT Governance
Know the objectives and goals of what it to be achieved by
this innovation--its value - why do you want to implement
this technology
Long-term planning and retention
Must have a well thought out strategic plan regarding
directions, implementation
ONE committee represented by each department
directors/chairs that meet monthly to discuss unity of
mission
Organization
Organization at the system level
Part of university IT plan
Part of university strategic plan
Planning
Policy - people don't adopt because they don't feel they
need to.
Prioritization based on university's strategic plan
Proper analysis of feasibility of the technology innovation
for the university's goals
Proper strategic planning
Proper vetting of instructional materials through
governance process - LMS systems, third-party software,
etc.
Properly vetted innovations through governance committee
Responsible Board or School must be prepared to make
sustained investment in technological innovation and
decision-making
Similarity of effort with other processes or procedures in
place
Standardization
Standardization of technologies across departments and
universities
Strategic planning
Strategic planning is key
Strategic Planning that ties innovation to the organizations
vision, mission, purpose, goals, and objectives.

192
Technology linked to the institution's academic plan
Transparency of IT governance
Unit and departmental active participation for the
governance and accountability of data
Vision of new technology use
Well-paced, controlled growth and development through
proper governance

193
APPENDIX D
INFORMED CONSENT FOR PEER EXPERT INTERVIEWS
Georgia State University
Department of Middle Secondary Education and Instructional Technology
Informed Consent
Title: Critical Success Factors of Technological Innovation and Diffusion in Higher
Education
Principal Investigator: Dr. Stephen W. Harmon
Georgia State University
P.O. Box 3978
Atlanta, GA 30302-3978
Phone: (404) 413-8064
Email: [email protected]
Student Principal Investigator: T. Wayne Dennison
Kennesaw State University
1000 Chastain Road
Kennesaw, GA 30144-5591
Phone: (770) 499-3151
Email: [email protected]
I. Purpose:
The purpose of this study is to explore and compare faculty and IT leaders‟
perceptions regarding innovation and diffusion of technology. You have been
selected for this study as either a faculty member or information technology (IT)
leader based on your affiliation with the Digital Innovation Group and/or State
System of Higher Education CIO Advisory Council.
Please note the following:
A total number of 4-8 participants will be recruited for this portion of the
research.
The interview should approximately 30 minutes to complete.
The interview will be audio recorded. The audio recordings will be destroyed
on December 31, 2014.
You must be 18+ years of age to take part in this study.
Your participation is completely voluntary and anonymous.
There are no known risks to participation in this study.
This study maintains complete confidentiality in compliance with IRB

194
requirements.
Select faculty members and IT leaders are invited to participate in the
interview process and they are over 18 years of age.
II. Procedures:
If you decide to participate, you will be asked to take part in a 30 minute
interview session, which will be audio recorded, to gain a better
understanding of your perceptions regarding critical success factors for
technological innovation and diffusion in higher education. The
transcribed text of this interview will be sent to you via e-mail within one
week following the interview. You will be allowed one week from the
date the e-mail is sent to review the transcription and submit any
corrections; otherwise, the remarks will be included in this study as
originally transcribed.
III. Risks:
In this study, you will not have any more risks than you would in a normal
day of life.
IV. Benefits:
Participation in this study may not benefit you personally. Overall, we hope to gain
information that may help support the process of technological innovation and
diffusion. The results of this study may also be used to better understand
technological innovation and diffusion from the points of view of both faculty and
IT leaders and to provide insight to the critical success factors that support these
processes.
V. Voluntary Participation and Withdrawal:
Participation in research is voluntary. You do not have to be in this study. If you
decide to be in the study and change your mind, you have the right to drop out
at any time. You may skip questions or stop participating at any time.
VI. Confidentiality:
We will keep your records private to the extent allowed by law. Only Dr. Stephen
Harmon, principal researcher, and Wayne Dennison, student researcher, will have
access to the information you provide. Information may also be shared with those
who make sure the study is done correctly (GSU Institutional Review Board, the
Office for Human Research Protection (OHRP), and KSU Institutional Review
Board). The digital recordings from this interview will be stored electronically on
a firewall-protected computer until December 31, 2014, and then destroyed. Paper
records from this interview session will be stored in a locked file cabinet and the

195
key maintained of student researcher‟s key ring until December 31, 2014, and
then destroyed. Your name and other facts that might point to you will not appear
when we present this study or publish its results. The findings will be summarized
and reported in group form and you will not be identified personally.
VII. Contact Persons:
Contact Dr. Stephen Harmon at (404) 413-8064/[email protected] or Wayne
Dennison at (770) 499-3151/[email protected] if you have questions,
concerns, or complaints about this study. You can also call if think you have been
harmed by the study. Call Susan Vogtner in the Georgia State University Office of
Research Integrity at 404-413-3513 or [email protected] if you want to talk to
someone who is not part of the study team. You can talk about questions, concerns,
offer input, obtain information, or suggestions about the study. You can also call
Susan Vogtner if you have questions or concerns about your rights in this study.
Research at Kennesaw State University that involves human participants is carried
out under the oversight of an Institutional Review Board. Questions or problems
regarding these activities should be addressed to the Institutional Review Board,
Kennesaw State University, 1000 Chastain Road, #0112 Kennesaw, GA, 30144-
5591, (678) 797-2268.
VIII. Copy of Consent Form to Subject:
We will give you a copy of this consent form to keep.
If you are willing to volunteer for this research and be audio recorded, please sign
below.
_________________________________________ _________________
Participant Date
_________________________________________ _________________
Principal Investigator or Researcher Obtaining Consent Date

196
APPENDIX E
PROTOCOL FOR PEER EXPERT INTERVIEWS
I. Contact interview participants and confirm willingness to participate in interview
process.
II. Schedule date/time for phone interview.
III. Send interview participants electronic copy of informed consent form for
completion.
IV. Collect signed informed consent form digitally or via fax.
V. Interview steps
a. Welcome and thank the interview participant
i. Describe the purpose of the study
ii. Explain the interview process
1. Length will be approximately 30 minutes
2. Interview will be recorded with their permission
iii. Remind the participant that all data will be help confidential
iv. Inform the participant that notes of the interview will be provided
for their review
b. Conduct the interview
i. Start recording
ii. Use questions on Peer Expert Interview Tool as a guide for the
interview while following participants‟ responses and concerns
iii. Take detailed notes
c. Thank participant for their time and help with the study
d. Stop recording
VI. Post-Interview
a. Send a thank you note to the participants
b. Transcribe interview
c. Send participant a transcription of interview via e-mail and allowing one
week for corrections to be submitted; otherwise, the original transcription
will be used for study purposes
d. Review corrections submitted by participant and make any requested
changes to the transcription

197
APPENDIX F
PEER EXPERT INTERVIEW TOOL
Critical Success Factors for Technological Innovation,
Adoption, and Diffusion in Higher Education
This study explores faculty members‟ and IT leaders‟ perceptions of technological
innovation and diffusion in higher education. The questions below will be used to guide
the discussion; however, the interview will be flexible and will follow the responses and
concerns of the participants.
Interviewer: ______________________________________________________
Interviewee: ______________________________________________________
Setting: __________________________________________________________
Date: ____________________________________________________________
Time: ____________________________________________________________
Questions:
The expert group (consisting of faculty and IT leaders from around the state) who
completed the initial survey identified the following items as the top 17 critical success
factors for technological innovation and diffusion in higher education.
1. Professional Development and Training
2. Executive/Administrative Level Support
3. Availability of Skilled Technical Support
4. Stakeholder Involvement
5. Skill Level and Commitment of Faculty/Students
6. Innovative Culture/Collaborative Environment
7. Availability of Resources and Financial Support
8. Incentives/Rewards/Time for Innovation
9. Availability of Technology/Infrastructure
10. Perceived Value/Addresses Need
11. Ease of Use
12. Quality, Reliability, and Flexibility of Technology
13. Proven Effectiveness
14. Strategic Planning and Governance
15. Project Management
16. Enhances Teaching and Learning
17. Cost Efficient

198
1. Do these responses accurately represent your thoughts regarding this topic? Why
or why not?
2. The faculty members from the peer expert group identified Professional
Development and Training as the top critical success factor regarding
technological innovation and diffusion in higher education. Why do you think this
was the most critical item according to this group?
3. The IT leaders from the peer expert group identified Executive and
Administrative Support as the top critical success factor regarding technological
innovation and diffusion in higher education. Why do you think this was the most
critical item according to this group?
4. Many of the critical success factors identified in this survey have been previously
reported though other studies. Were there any items on the list that surprised you?
If so what and why?
5. The two groups that comprised the peer expert group (Faculty and IT Leaders)
had 4 of the same critical success factors listed in their top six. Are you surprised
that the two groups have such similar responses? Why or why not?
6. There were some key differences between what the faculty and IT leaders
reported. For instance, faculty ranked “Availability of Skilled Technical Support”
very high (#2), while IT leaders ranked it #14. In contrast, faculty ranked
“Strategic Planning and Governance” #15 while IT leaders ranked this item #7.
Do you observations regarding these rankings?
7. Overall, how important do you believe it is for technological innovation to be
promoted in a higher education setting? Why?
8. Do you have any other thoughts to share on this topic?
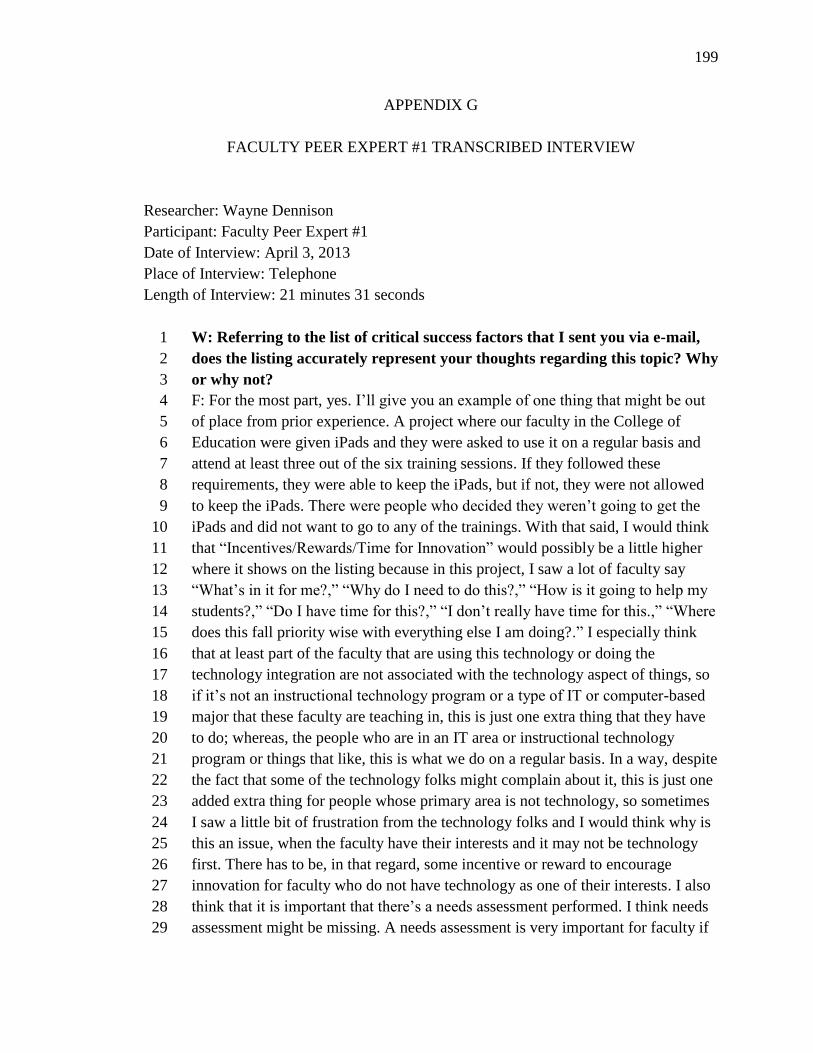
199
APPENDIX G
FACULTY PEER EXPERT #1 TRANSCRIBED INTERVIEW
Researcher: Wayne Dennison
Participant: Faculty Peer Expert #1
Date of Interview: April 3, 2013
Place of Interview: Telephone
Length of Interview: 21 minutes 31 seconds
W: Referring to the list of critical success factors that I sent you via e-mail, 1
does the listing accurately represent your thoughts regarding this topic? Why 2
or why not? 3
F: For the most part, yes. I‟ll give you an example of one thing that might be out 4
of place from prior experience. A project where our faculty in the College of 5
Education were given iPads and they were asked to use it on a regular basis and 6
attend at least three out of the six training sessions. If they followed these 7
requirements, they were able to keep the iPads, but if not, they were not allowed 8
to keep the iPads. There were people who decided they weren‟t going to get the 9
iPads and did not want to go to any of the trainings. With that said, I would think 10
that “Incentives/Rewards/Time for Innovation” would possibly be a little higher 11
where it shows on the listing because in this project, I saw a lot of faculty say 12
“What‟s in it for me?,” “Why do I need to do this?,” “How is it going to help my 13
students?,” “Do I have time for this?,” “I don‟t really have time for this.,” “Where 14
does this fall priority wise with everything else I am doing?.” I especially think 15
that at least part of the faculty that are using this technology or doing the 16
technology integration are not associated with the technology aspect of things, so 17
if it‟s not an instructional technology program or a type of IT or computer-based 18
major that these faculty are teaching in, this is just one extra thing that they have 19
to do; whereas, the people who are in an IT area or instructional technology 20
program or things that like, this is what we do on a regular basis. In a way, despite 21
the fact that some of the technology folks might complain about it, this is just one 22
added extra thing for people whose primary area is not technology, so sometimes 23
I saw a little bit of frustration from the technology folks and I would think why is 24
this an issue, when the faculty have their interests and it may not be technology 25
first. There has to be, in that regard, some incentive or reward to encourage 26
innovation for faculty who do not have technology as one of their interests. I also 27
think that it is important that there‟s a needs assessment performed. I think needs 28
assessment might be missing. A needs assessment is very important for faculty if 29

200
they are going to be asked to use the technology or integrate it into their courses. 30
That‟s something else that I thought of when looking at the list. Other than that 31
everything else looks solid to me. 32
W: Good points. When looking at the data collected from the faculty and IT 33
leaders collectively, “Professional Development and Training” was reported 34
the most often. When looking at the data for each of the groups separately, 35
faculty reported “Professional Development and Training” far more often 36
than any other factor. IT leaders reported executive and administrative level 37
support more often than any other item affecting technological innovation 38
and diffusion. Do you have any thoughts or observations about the two 39
groups and what they each reported the most often as a critical success factor 40
for technological innovation and diffusion? 41
F: Definitely, I agree 100%. Seeing it from both sides, it‟s no surprise that 42
“Professional Development and Training” was the highest reported for faculty. 43
Relating to the project that I previously talked about, “Professional Development 44
and Training” was the key to the successful technology integration process that 45
we were trying to do with the iPads. If the training had not been provided, people 46
would have a tool and maybe know how to turn it on, but not have to really use it. 47
The specific training was very important for the faculty side, but I can see where 48
the IT folks ranked executive and administrative level support very high because 49
they are the ones that have to seek buy-in at every single stage of the process. I 50
completely agree that it makes sense which group reported each item the most 51
often. 52
W: Most of the critical success factors identified by the responses to the 53
initial survey have been presented in other studies or academic articles. Were 54
there any items on this list that surprised you or was that anything that you 55
felt was missing was from the list? 56
F: The only thing that I thought of was the needs assessment, but from looking at 57
the list, I think that is probably addressed in the “Perceived Value/Addresses 58
Need” item. Other than that, I think I‟ve seen all of these items come up in one 59
way or another, especially right now with the work that I do in K-12 online and 60
blending learning. I‟m seeing a lot about innovation culture and the culture of 61
change. Maybe one thing that is possibly missing is change management. Maybe 62
the “Innovative Culture/Collaborative Environment” success factor could possibly 63
include the idea of change management. How are we going to get the faculty who 64
are so traditional in their teaching background (“this is how I was taught, so this is 65
how I am teaching now” type mentality) look at the technologies that are out there 66
and how they can be meaningfully integrated into their classrooms. The idea is 67
“How am I going to change to make this happen?” and for the people who are 68
managing the programs, how are we going to encourage people to change from 69

201
the way they currently do things, especially if they are not already behind 70
technology integration? Often, it is hard to get people to change. I work a lot with 71
K-12 and I‟ve seen senior teachers pick up technology before junior teachers, so I 72
guess it just depends. So, change management is an important consideration. 73
W: The two groups that comprise the peer expert grouping, faculty and IT 74
leaders, reported four of the same success factors out of the top six. Are you 75
surprised about how similar the responses were? 76
F: Given the background of the faculty selected for the initial survey and their 77
experience with technology, I‟m not surprised. I would be interested in knowing 78
more about the similarities and differences between the two groups. 79
W: To give some examples of where the two groups differed, faculty reported 80
“Availability of Skilled Technical Support” second most often and IT leaders 81
reported that 13 out of 17. Also, the groups differed regarding their ideas of 82
“Strategic Planning and Governance.” IT leaders reported this item very 83
high and the faculty reported this item very low. 84
F: Those two definitely make sense. What are the four that they agreed upon? 85
W: They were “Professional Development and Training,” “Stakeholder 86
Involvement,” “Executive/Administrative Level Support,” and “Skill Level 87
and Commitment of Faculty/Students” were reported in the top six by both 88
faculty and IT leaders. 89
F: Those all make sense. I guess that‟s not too surprising, when thinking back to 90
the “Availability of Skilled Technical Support,” when I was working physically 91
on campus, a lot of people were interested in having technical support there. I can 92
see how IT leaders could have ranked that lower because that‟s just an inherent 93
part of the process and not forefront in your mind. In terms of technology 94
integration, if we provide professional development and training ahead of time, 95
typically access to skilled technical support would not be required as often after a 96
technology has been successfully implemented. 97
W: Overall, how important do you believe it is for technological innovation 98
to be promoted in a higher education setting and why? 99
F: I think it is huge because we are the next step before people go on to an area in 100
which they want to work and I believe technology is infused in all businesses and 101
it is helpful to have that training within higher ed. This is especially true for the 102
non-traditional students, but even our traditional aged students going into a world 103
where technology reigns, if they don‟t have the proper background it can be a 104
problem and may cause them to have to go back for additional training at the 105
college level. I think it is even more important for the faculty to know how to use 106
technology and model it for the students so when they go out into the workforce, 107
they will have the skills they need. They need to model it in such a way that the 108
students are actually involved in creating and using the technology rather than just 109

202
passively learning from the technology. I think the use of the technology once the 110
technology is integrated is very important so it is not so much teacher centered, 111
but student centered. This allows the students to actively use the technology and 112
gives them the information they need to use technology when they are out in the 113
workforce. This is how it was modeled for me and also how I use it in my own 114
program. 115
W: Do you have any final thoughts on this topic? 116
F: Not at this point, but if you need any follow-up information feel free to contact 117
me. 118
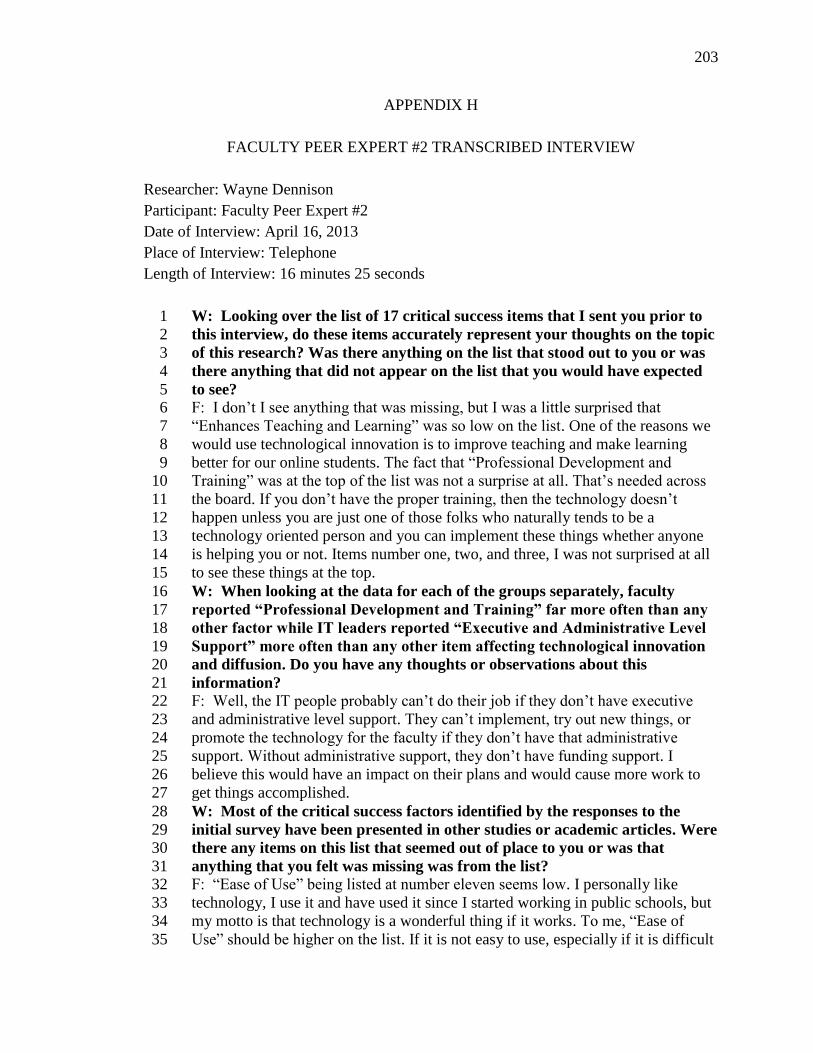
203
APPENDIX H
FACULTY PEER EXPERT #2 TRANSCRIBED INTERVIEW
Researcher: Wayne Dennison
Participant: Faculty Peer Expert #2
Date of Interview: April 16, 2013
Place of Interview: Telephone
Length of Interview: 16 minutes 25 seconds
W: Looking over the list of 17 critical success items that I sent you prior to 1
this interview, do these items accurately represent your thoughts on the topic 2
of this research? Was there anything on the list that stood out to you or was 3
there anything that did not appear on the list that you would have expected 4
to see? 5 F: I don‟t I see anything that was missing, but I was a little surprised that 6
“Enhances Teaching and Learning” was so low on the list. One of the reasons we 7
would use technological innovation is to improve teaching and make learning 8
better for our online students. The fact that “Professional Development and 9
Training” was at the top of the list was not a surprise at all. That‟s needed across 10
the board. If you don‟t have the proper training, then the technology doesn‟t 11
happen unless you are just one of those folks who naturally tends to be a 12
technology oriented person and you can implement these things whether anyone 13
is helping you or not. Items number one, two, and three, I was not surprised at all 14
to see these things at the top. 15
W: When looking at the data for each of the groups separately, faculty 16
reported “Professional Development and Training” far more often than any 17
other factor while IT leaders reported “Executive and Administrative Level 18
Support” more often than any other item affecting technological innovation 19
and diffusion. Do you have any thoughts or observations about this 20
information? 21 F: Well, the IT people probably can‟t do their job if they don‟t have executive 22
and administrative level support. They can‟t implement, try out new things, or 23
promote the technology for the faculty if they don‟t have that administrative 24
support. Without administrative support, they don‟t have funding support. I 25
believe this would have an impact on their plans and would cause more work to 26
get things accomplished. 27
W: Most of the critical success factors identified by the responses to the 28
initial survey have been presented in other studies or academic articles. Were 29
there any items on this list that seemed out of place to you or was that 30
anything that you felt was missing was from the list? 31 F: “Ease of Use” being listed at number eleven seems low. I personally like 32
technology, I use it and have used it since I started working in public schools, but 33
my motto is that technology is a wonderful thing if it works. To me, “Ease of 34
Use” should be higher on the list. If it is not easy to use, especially if it is difficult 35

204
to use when working with my students or preparing something, I find another way 36
without the technology it get it done. I don‟t want to waste my time by having to 37
worry with it. So, I think “Ease of Use” and “Enhances Teaching and Learning” 38
should both be higher on the list. If I can‟t use it easily and it‟s not going to 39
benefit my students or enhance my teaching strategies, then I don‟t want to waste 40
time doing it. 41
W: You make some very good points. Hopefully, I will learn more about this 42
in Phase III of my research when I ask my case study participants to rate 43
these items in terms of importance and specifically compare the faculty 44
perspectives to those of the IT leaders. I can see where “Ease of Use” would 45
be important to faculty and might rank higher in their eyes than IT leaders. 46 F: Sometimes we get excited about the novelty of a new technology. If the 47
students are using something new, faculty often think they need to look at it, but it 48
may or may not turn out to be what we perceive it to be. I have a friend who is all 49
about technology and we often have discussions about different uses. I‟m 50
sometimes a little more cautious and look at technology in terms of how easy is it 51
to use, how workable is it, or how effective is it instead of just using something 52
based on the novelty of it. 53
W: The two groups that comprise the peer expert grouping, faculty and IT 54
leaders, reported four of the same success factors out of the top six. Are you 55
surprised about how similar the responses were or would you have expected 56
them to be more different? 57 F: So, they reported 4 out of the top 6 as the same? 58
W: Yes, when looking at the items reported, both groups reported 59
“Professional Development and Training,” “Executive/Administrative Level 60
Support,” “Stakeholder Involvement,” and “Skill Level and Commitment of 61
Faculty/Students” in their top six most reported items. 62 F: That really doesn‟t surprise me coming from a faculty standpoint. The “Skill 63
Level and Commitment of Faculty/Students is not surprising. Coming from a 64
public education background into the college, I have seen a wide range of 65
technological skills coming from my students. Sometimes I have students who are 66
light years ahead of me and then I‟ve had others who are farther behind me who 67
you have to spend more time with to move them ahead in their use of technology. 68
Of course, from a technology viewpoint, if the people you are working with don‟t 69
have an appropriate skill level, you have to drop back and train them to make sure 70
they can use the technology you are implementing. All of these make sense. 71
W: Even though there were a lot of similarities between the faculty and IT 72
leader responses, there were some key differences. For example, faculty 73
reported “Strategic Planning and Governance” very low on this list of items 74
and IT leaders reported this item in the top half. Also, in terms of 75
“Availability of Skilled Technical Support” faculty reported this item the 76
second most often of all the items and IT leaders reported this item 77
fourteenth out of the seventeen items listed. 78 F: The IT people are the skilled technical support, while faculty on the other hand 79
are not and they need support. So, I understand why faculty would report 80
availability of skilled technical support very high. Technical support is great, you 81

205
really have to have that. I call on technical support whenever I need it and they 82
are always very helpful. Having technology that works is very important. When I 83
have a class in Wimba, sometimes students have to phone in because they can‟t 84
get their system to work. Sometimes it is not up to date enough to work with what 85
Wimba needs. I had to try three computers at my house one day before I could 86
find one that would work. I ended up having to use my PC and reinstall something 87
before I could get Wimba to work properly. All that plays into the technology 88
being successful. The other item you said they disagreed on was “Strategic 89
Planning and Governance.” 90
W: That’s correct. 91 F: From the IT viewpoint or perspective, they would need planning and 92
governance because they need to be able to talk to the people making the 93
decisions to get the resources and funding included in the planning. The faculty 94
are on the receiving end of the technology where strategic planning would be 95
important but not a major consideration. As users, faculty would expect that the 96
strategic planning has already occurred. Most faculty aren‟t involved in the 97
planning process for new technologies, they are the recipients. IT on the other 98
hand wants to be involved in the strategic planning process to make sure they get 99
the resources and support they need to be able to implement things successfully. 100
W: Just a couple of wrap-up questions. Overall, how important do you 101
believe it is to cultivate an innovative culture around technology on college 102
campuses? 103 F: On campus as in the faculty? 104
W: Yes, specifically as it relates to instructional use of technology. 105 F: I think it is very important. We have a really good collaborative network 106
within our department. We share things. My university has lots of training and 107
you get the chance to meet faculty from other areas within those classes. I‟m not 108
sure if there‟s an organized unit of collaboration on campus, but it happens 109
informally on a regular basis within my department. We don‟t really need another 110
committee to be on, but I think developing that innovative culture on campus is 111
important. 112
W: Do you have any final thoughts you would like to share on this topic? 113 F: No, but I would be interested to see how this study turns out. I look forward to 114
seeing your finished work and hope you will include me on the results. 115

206
APPENDIX I
IT LEADER PEER EXPERT #1 TRANSCRIBED INTERVIEW
Researcher: Wayne Dennison
Participant: IT Leader Peer Expert #1
Date of Interview: April 3, 2013
Place of Interview: Telephone
Length of Interview: 11 minutes 25 seconds
W: When I sent you the e-mail scheduling this interview, I provided a listing 1
of the critical success factors that were identified by the initial survey. There 2
were a total of seventeen. Did you get a chance to look those over? 3
L: Yes, I did. 4
W: I didn’t have the individual success factors numbered, but the order that 5
I sent them in is the order in which the peer expert group as a whole ranked 6
them. From looking at the listing, did the information accurately represent 7
your thoughts on the topic? Were there any surprises or do you have any 8
general observations about the items on the listing? 9
L: I didn‟t see anything on the list that I would eliminate as being a critical 10
success factor. There were no surprises in the list. These are the kinds of things 11
that if you think about it long enough, you could probably come up with all of 12
them, but no individual probably ever does. 13
W: After collecting the responses to the survey, the data were reviewed by 14
looking at the responses received from the faculty and IT leaders separately 15
as well as collectively. The faculty members most often reported 16
“Professional Development and Training” as the most critical item for 17
successful technological innovation, diffusion, and adoption. The IT leaders 18
most often reported “Executive/Administrative Level Support” as their most 19
critical success factor. Do you have any thoughts or insights on this 20
information? 21
L: I definitely understand the faculty‟s response to that because my experience 22
has always been that the primary concern regarding technology for faculty is the 23
kind of training you give them. The perceived faculty development aspect of it is 24
even better because it impacts their annual evaluations or their course evaluations. 25
From the IT perspective, executive and administrative level support is important, 26
but I would have probably ranked “Stakeholder Involvement” higher. It doesn‟t 27
matter how much the executives support what you want to do if you can‟t get the 28
support of the faculty, it isn‟t going to be successful. 29

207
W: “Stakeholder Involvement” overall, when combining the faculty and IT 30
leaders responses, was reported fourth most often. However, then looking at 31
the data for IT leaders only, it was reported second and for faculty only, it 32
was reported fourth. 33
L: I‟m surprised it was that high for faculty. I‟m not surprised for the IT leaders. I 34
would probably rank “Stakeholder Involvement” higher than executive support. 35
W: The two groups, faculty and IT leaders, reported four of the same success 36
factors out of the top six. Are you surprised about how similar the responses 37
were? There often seems to be a perception that faculty and people in IT are 38
often on opposing sides of issues. Why or why not? 39
L: I‟m not surprised because of the faculty selected. You have the early adopters. 40
Usually when you see a disconnect between faculty and IT leaders it‟s because 41
we‟re talking about the middle of the road and the follower groups as opposed to 42
the early adopters. There are people on every campus that you can count on to 43
implement your new technology which almost don‟t count. It‟s the next group 44
that matters to get the technology used widespread and mainstream. I think they 45
would probably have different critical factors. That‟s why I think you will find it 46
interesting when you follow-up with the faculty at your school. I would be 47
interested to see how that turns out. 48
W: That’s a good point. Looking at some of the key differences between the 49
two groups, there were four items where there was a substantial difference in 50
how often the faculty reported an item as compared to the IT leaders. To give 51
a couple of examples, faculty reported “Availability of Skilled Technical 52
Support” as the second most often reported item while IT leaders reported 53
this item as fourteenth. A second example is “Strategic Planning and 54
Governance.” Faculty reported it as number fifteen on the list and IT leaders 55
reported it seventh. IT leaders reported this item in the middle, while faculty 56
reported it at the bottom. 57
L: I‟m surprised that faculty reported “Cost Efficiency” at the bottom. I‟m also 58
surprised that “Enhances Teaching and Learning” is as low as it was. 59
W: Faculty reported cost efficiency as their lowest item and IT leaders 60
reported it as the next to lowest item. Teaching and learning was reported 61
last for IT leaders and number fourteen out of seventeen for faculty. 62
L: I would have also thought that “Ease of Use” would have been reported higher. 63
W: Overall, how important do you feel that is to promote technological 64
innovation in a higher education arena and why? 65
L: I think it is very important. I think that especially in today‟s day and age and IT 66
leaders have been saying this for the past twenty years, but it seems to be as true 67
today as it was then, that the demands of our client base forces us into that. We 68
have a generation of students that grew up using computers from birth. I have a 69

208
two-year-old granddaughter that can navigate an iPad nearly as well as an adult. 70
When these students come into campus, the methodologies and technologies that 71
we used twenty or thirty years ago just aren‟t going to meet their needs. It is 72
important for universities to have infrastructure and tools available so that faculty 73
can incorporate that into their pedagogy. 74
W: Do you have any other thoughts or anything else you would like to share 75
regarding this research topic? 76
L: No, but it sounds interesting and I would be interested in seeing the results. 77

209
APPENDIX J
IT LEADER PEER EXPERT #2 TRANSCRIBED INTERVIEW
Researcher: Wayne Dennison
Participant: IT Leader Peer Expert #2
Date of Interview: April 10, 2013
Place of Interview: Telephone
Length of Interview: 14 minutes 55 seconds
W: Looking over the list of 17 critical success items that I sent you prior to 1
this interview, do these items accurately represent your thoughts on the topic 2
of this research? Was there anything on the list that stood out to you or was 3
there anything that did not appear on the list that you would have expected 4
to see? 5
L: They seem like valid indicators to me. The only thing that jumped out at me 6
when reading through the list was the item “Enhances Teaching and Learning” 7
seemed like a more narrow view than my initial thoughts on the subject. While 8
that‟s obviously important and teaching is a large portion of what we do, it 9
probably doesn‟t address things holistically. But I do not see anything on the list 10
that doesn‟t belong there. 11
W: Is there anything that you would have expected to see on the list that you 12
don’t see? 13
L: No, but there are some things I might have said differently which are probably 14
covered in the items listed. For instance, “Executive/Administrative Level 15
Support” would probably cover some things like shared vision with executive 16
team, mutual understanding, and some of the other things that I‟m looking at such 17
as strategic alignment. I think some of that is covered and even though I might 18
have worded it differently, I think it exists within some aspect of the items you 19
have listed. 20
W: When looking at the responses of the faculty and IT leaders separately, 21
faculty reported “Professional Development and Training” the most often 22
when listing critical success factors for technological innovation. Why do you 23
think this item was reported the most often by faculty? Is this surprising or 24
would this be expected from this group? 25
L: Just having known and talked with several faculty, they often feel like 26
technology is pushed on them and they are not given the proper training or time to 27
develop skills with it. When they are told to use it, I know that‟s been an issue 28
sometimes with our LMS systems. What training we provide, it never seems to be 29

210
quite enough. That is in part a response to feeling like they are being told to use 30
things that they are not adequately prepared to use in some cases. That‟s also 31
based on my discussions with fellow faculty members. It‟s not that they don‟t 32
want to use technology or make it useful in the classroom, but often because of 33
the way we budget, the lead time is not as much as they would like. They don‟t 34
feel like they are developed or trained well enough to do it well. It doesn‟t 35
necessarily surprise me that this item was important for the faculty. 36
W: When looking at the responses for IT leaders, they reported 37
“Executive/Administrative Level Support” the most often when listing 38
critical success factors for technological innovation. Do you have any 39
thoughts about this? 40
L: I think that is important but I don‟t know for me personally that would be the 41
most important item. You know the bottom line brass tax issue is when we‟re 42
going to do something, is the money going to be there? That, to some extent, goes 43
into executive and administrative support because obviously if you don‟t have 44
that support, you‟re not going to get funding for it. I think we like to say a lot of 45
these other things and how they are going to have an impact, but most of us know 46
that at the end of the day, the number one critical aspect is do we have the money 47
to pay for it or not? But I think that‟s a more formal way of saying the same thing. 48
You have to have executive and administrative level support. I will say too that it 49
is important to make sure that things are not seen as an IT project. The acceptance 50
of the technology when you talk about diffusion, it is critical to make sure it is not 51
seen as simply an IT project. I think having that is important, so it doesn‟t surprise 52
me that “Executive/Administrative Level Support” was reported highly, but that 53
may actually vary depending upon the size of the institution. 54
W: When looking at the responses of the faculty and IT leader groups, they 55
had four of the same responses in the top six reported items. Are you 56
surprised that the two groups had such similar responses? Would you have 57
expected their responses to be this similar or would you have expected them 58
to be more different? 59
L: I may be a little surprised but I‟m not taken back by it. I would not expect 60
something like “Strategic Planning and Governance” to be high on the faculty list 61
although I think it would be important to IT leaders. I think sometimes the 62
terminology, like “Project Management,” might have an impact. For instance, 63
with instructors or faculty, some of the wording might appeal more to them more 64
so than others, like “Professional Development and Training” and “Stakeholder 65
Involvement,” because most of them probably see themselves as stakeholders. 66
“Skilled Technical Support” is one of the faculty complaints in a lot of places. 67
They may or may not be thrilled with IT support. Whether they interpret that 68
properly, it is not surprising that they came up with those. As far as the 69

211
congruence between faculty and IT leaders, there are probably similar reasons. It 70
may go back to orientation of the individual CIO. If they are more of a strategist 71
at the high level, they might differ a little more. Personally, being at a smaller 72
institution, my thoughts are probably more in line with the top five or six reported 73
items, simply because I‟m closer to the front line. It doesn‟t surprise me a lot. It‟s 74
intriguing, but I don‟t see anything particularly surprising. 75
W: In contrast, there were some key differences between the faculty and IT 76
leader groups. For instance, the faculty group reported the “Availability of 77
Skilled Technical Support” very high, number two overall, while IT leaders 78
reported it fourteenth. Another key difference is “Strategic Planning and 79
Governance.” Faculty reported it fifteenth and IT leaders reported it 80
seventh. Do you have any observations regarding this information? 81
L: The ranking of “Strategic Planning and Governance” doesn‟t surprise me. The 82
“Availability of Skilled Technical Support” probably goes to what I perceive as 83
some of the faculty‟s mindset toward professional development and training. 84
They are given these things, they are not trained on them, and a lot of time it 85
seems like IT doesn‟t really understand it either. I imagine most CIOs presume 86
that their organizations are much better at that than they probably are. 87
W: That’s a good observation and may help explain why “Availability of 88
Skilled Technical Support” was lower on the IT list than the faculty list. 89
L: I think that many of IT leaders already assume that it is technology, we can 90
handle it. That really translates too, particularly when looking at diffusion and 91
innovation. Because, ideally, innovativeness and diffusion are not reliant on IT. 92
It‟s almost completely non-reliant on IT. Because we‟re not the ones that are 93
going to innovate, particularly in the classroom. 94
W: As a wrap-up, how important do you believe to cultivate an innovative 95
culture for technology on a college or university campus or do you have any 96
other thoughts regarding this topic? 97
L: The writing is on the wall, we‟ve got to be more innovative particularly when 98
you look at the university system. I‟m not a great supporter of the for-profit 99
schools, but the things that they have done as far as outreach in making things 100
available, we seem to be dragging our heels on that. I don‟t know that the 101
innovativeness in the academic field is the technology per se, but how do we 102
utilize the technology and ensure that we‟re still doing quality academics? That‟s 103
the space for innovation and diffusion. How do we do what the for-profit schools 104
are doing, but still deliver a quality product. That certainly depends on the 105
technology, but I don‟t think the technology in and of itself is innovative. It is the 106
way the people, those experts in that particular content field, are utilizing that and 107
how they are spreading that out whether it be to other faculty in the same area or 108
like-minded faculty or how the students use it. Technology is an important 109

212
component but it does not foster diffusion in and of itself. How people are using 110
technology in innovative ways is the main thing. I think technology is a critical 111
piece to consider or we‟re going to be left behind. For good or bad, students, who 112
we don‟t want to call customers, call them clients, constituents, or whatever we 113
want to call them, have a certain expectation predicated on the Googles, 114
Amazons, and all the other companies they deal with. They expect, maybe not the 115
same exact experience but, an experience that is enabled in much the same way. 116
We are not doing that well at all. 117

213
APPENDIX K
INFORMED CONSENT FOR FINAL SURVEY
Georgia State University
Department of Middle Secondary Education and Instructional Technology
Kennesaw State University
Enterprise Systems and Services
Informed Consent
Title: Critical Success Factors of Technological Innovation and Diffusion in Higher
Education
Principal Investigator: Dr. Stephen W. Harmon
Georgia State University
P.O. Box 3978
Atlanta, GA 30302-3978
Phone: (404) 413-8064
Email: [email protected]
Student Principal Investigator: T. Wayne Dennison
Kennesaw State University
1000 Chastain Road
Kennesaw, GA 30144-5591
Phone: (770) 499-3151
Email: [email protected]
I. Purpose:
The purpose of this study is to explore and compare faculty and IT leaders‟
perceptions regarding innovation and diffusion of technology. You have been
selected for this study as either a faculty member or information technology (IT)
leader based on your affiliation at Kennesaw State University.
Please note the following:
A total number of 1381 participants will be recruited for this portion of the
research.
The survey should take about 12 to 15 minutes to complete.
You must be 18+ years of age to take part in this study.
Your participation is completely voluntary and anonymous.
There are no known risks to participation in this study.
Your IP address will not be collected.

214
II. Procedures:
If you decide to participate, you will be asked to complete an online survey
regarding your perceptions of critical success factors for technological
innovation and diffusion in higher education.
III. Risks:
In this study, you will not have any more risks than you would in a normal day of
life.
IV. Benefits:
Participation in this study may not benefit you personally. Overall, we hope to gain
information that may help support the process of technological innovation and
diffusion. The results of this study may also be used to better understand
technological innovation and diffusion from the points of view of both faculty and
IT leaders and to provide insight to the critical success factors that support these
processes.
V. Voluntary Participation and Withdrawal:
Participation in research is voluntary. You do not have to be in this study. If you
decide to be in the study and change your mind, you have the right to drop out at
any time. You may skip questions or stop participating at any time.
VI. Confidentiality:
We will keep your records private to the extent allowed by law. Only Dr. Stephen
Harmon, principal researcher, and Wayne Dennison, student researcher, will have
access to the information you provide. Information may also be shared with those
who make sure the study is done correctly (GSU Institutional Review Board, the
Office for Human Research Protection (OHRP)). The information you provide
will be stored electronically on a firewall-protected computer for one year after
the study is completed and then destroyed. Your name and other facts that might
point to you will not appear when we present this study or publish its results. The
findings will be summarized and reported in group form. Please note that data
transmitted over the Internet may not be secure; however, to protect the
information you submit, IP addresses will not be collected and you will not be
identified personally.
VII. Contact Persons:
Contact Dr. Stephen Harmon at (404) 413-8064/[email protected] or Wayne
Dennison at (770) 499-3151/[email protected] if you have questions,
concerns, or complaints about this study. You can also call if you think you have been
harmed by the study. Call Susan Vogtner in the Georgia State University Office of

215
Research Integrity at 404-413-3513 or [email protected] if you want to talk to
someone who is not part of the study team. You can talk about questions, concerns,
offer input, obtain information, or suggestions about the study. You can also call
Susan Vogtner if you have questions or concerns about your rights in this study.
Research at Kennesaw State University that involves human participants is carried
out under the oversight of an Institutional Review Board. Questions or problems
regarding these activities should be addressed to the Institutional Review Board,
Kennesaw State University, 1000 Chastain Road, #0112 Kennesaw, GA, 30144-
5591, (678) 797-2268.
VIII. Copy of Consent Form to Subject:
PLEASE PRINT A COPY OF THIS CONSENT DOCUMENT FOR YOUR
RECORDS, OR IF YOU DO NOT HAVE PRINT CAPABILITIES, YOU MAY
CONTACT THE RESEARCHER TO OBTAIN A COPY
☐ I agree and give my consent to participate in this research project. I understand
that participation is voluntary and that I may withdraw my consent at any time
without penalty.
☐ I do not agree to participate and will be excluded from the remainder of the
questions.

216
APPENDIX L
FINAL SURVEY INSTRUMENT
1. The Availability of Technology and Infrastructure has been identified as the
median critical success factor for innovation, adoption, and diffusion of
technology in higher education, according to a statewide group of faculty and IT
leaders who completed an initial survey. Please indicate your opinion regarding
the influence of the following factors on successful technological innovation,
adoption, and diffusion at your institution compared to the Availability of
Technology and Infrastructure (the median response).
Scale:
1 = significantly less influence than the Availability of Technology and
Infrastructure
2 = slightly less influence than the Availability of Technology and Infrastructure
3 = equal influence to the Availability of Technology and Infrastructure
4 = slightly more influence than the Availability of Technology and Infrastructure
5 = significantly more influence than the Availability of Technology and
Infrastructure
Please rank each of the following critical success factors as compared to the
Availability of Technology and Infrastructure.
Critical
Success
Factor
Significantly
Less
Influence
Slightly
Less
Influence
Equal
Influence
Slightly
More
Influence
Significantly
More
Influence
Availability of
Resources and
Financial Support
1
2
3
4
5
Availability of
Skilled Technical
Support
1
2
3
4
5
Cost
Efficiency
1
2
3
4
5
Ease
of Use
1
2
3
4
5
Enhances Teaching
and Learning
1
2
3
4
5

217
Executive/
Administrative
Level Support
1
2
3
4
5
Incentives/Rewards/
Time for Innovation
1
2
3
4
5
Innovative Culture/
Collaborative
Environment
1
2
3
4
5
Perceived Value/
Addresses Need
1
2
3
4
5
Professional
Development
and Training
1
2
3
4
5
Project
Management
1
2
3
4
5
Proven
Effectiveness
1
2
3
4
5
Quality, Reliability,
and Flexibility of
Technology
1
2
3
4
5
Skill Level and
Commitment of
Faculty/Students
1
2
3
4
5
Stakeholder
Involvement
1
2
3
4
5
Strategic Planning
and Governance
1
2
3
4
5

218
2. Now, please rate your institution‟s performance on the following success factors.
Scale:
1 = very poor
2 = poor
3 = adequate
4 = good
5 = very good
Please rank your institution’s performance in regard to each of the following
critical success factors.
Critical
Success
Factor
Very
Poor
Poor
Adequate
Good
Very
Good
Availability of
Resources and
Financial Support
1
2
3
4
5
Availability of
Skilled Technical
Support
1
2
3
4
5
Availability of
Technology/
Infrastructure
1
2
3
4
5
Cost
Efficiency
1
2
3
4
5
Ease
of Use
1
2
3
4
5
Enhances Teaching
and Learning
1
2
3
4
5
Executive/
Administrative
Level Support
1
2
3
4
5
Incentives/Rewards/
Time for Innovation
1
2
3
4
5
Innovative Culture/
Collaborative
Environment
1
2
3
4
5
Perceived Value/
Addresses Need
1
2
3
4
5

219
Professional
Development
and Training
1
2
3
4
5
Project
Management
1
2
3
4
5
Proven
Effectiveness
1
2
3
4
5
Quality, Reliability,
and Flexibility of
Technology
1
2
3
4
5
Skill Level and
Commitment of
Faculty/Students
1
2
3
4
5
Stakeholder
Involvement
1
2
3
4
5
Strategic Planning
and Governance
1
2
3
4
5
3. Please list other critical success factors that you feel are relevant to technological
innovation and diffusion, which are not included above.
__________________________________________________________________
__________________________________________________________________
__________________________________________________________________
4. Please give an example of when the success factor you believe is the most critical
played an important role technological innovation and diffusion at your
institution.
__________________________________________________________________
__________________________________________________________________
__________________________________________________________________
5. When you think about a past successful technological innovation effort at your
institution, what made it a success?
__________________________________________________________________
__________________________________________________________________
__________________________________________________________________

220
6. When you think about a past failed technological innovation effort at your
institution, what made it fail?
__________________________________________________________________
__________________________________________________________________
__________________________________________________________________
7. From which group do the majority of your institution‟s innovative ideas
originate?
a) Executive leaders
b) Technology departments
c) Management
d) Faculty
e) Staff
f) Students
g) External (federal, state, SSHE, etc.)
h) Other, please specify _______________
8. Within your institution, how often do peers in different departments share
information regarding technological innovation?
a) Always
b) Frequently
c) Occasionally
d) Rarely
e) Never
9. How often does your institution share information between hierarchical levels (i.e.
between management/administration and faculty)?
a) Always
b) Frequently
c) Occasionally
d) Rarely
e) Never
10. Does your institution have formalized rules and procedures that guide daily use of
instructional technology?
a) Yes
b) No

221
11. When deploying new instructional technology, does your institution include
various stakeholders (i.e. faculty, end users, management, customers/clients,
etc.)?
a) Always
b) Frequently
c) Occasionally
d) Rarely
e) Never
12. Does your institution reward technological innovation in tangible ways?
a) Always
b) Frequently
c) Occasionally
d) Rarely
e) Never
13. What is your gender?
a) Male
b) Female
14. What is your age?
a) Less than 21
b) 21 – 30
c) 31 – 40
d) 41 – 50
e) 51 – 60
f) 61 – 70
g) Over 70
15. What best describes your highest level of education?
a) High school
b) Some college
c) Associate‟s degree
d) Bachelor‟s degree
e) Master‟s degree
f) Doctoral degree
g) Other Graduate or Professional degree, please specify ________________

222
16. What best describes your primary affiliation?
a) Part-time Faculty
b) Full-time Faculty
c) IT Leader
d) Manager/administrator
e) Other, please specify ____________________
17. Please select your primary academic college affiliation?
a) Does not apply
b) College of the Arts
c) College of Business
d) College of Education
e) College of Health & Human Services
f) College of Humanities & Social Sciences
g) College of Science & Mathematics
h) University College
i) Other, please specify ________________
18. Are you willing to participate in a brief follow-up interview to discuss the results
of this survey and provide additional feedback? If you answer “Yes” to this
question, your contact information will be requested separately for follow-up
purposes. Upon submitting this survey, you will be directed to a site allowing you
to enter this information.
a) Yes
b) No
Thank you for taking the time to complete this survey.
Your input is extremely important and greatly appreciated.
Survey adapted from Schelin & Garson (2004) Humanizing Information Technology: Advice from Experts

223
APPENDIX M
INFORMED CONSENT FOR FACULTY AND IT LEADER INTERVIEWS
Georgia State University
Department of Middle Secondary Education and Instructional Technology
Kennesaw State University
Enterprise Systems and Services
Informed Consent
Title: Critical Success Factors of Technological Innovation and Diffusion in Higher
Education
Principal Investigator: Dr. Stephen W. Harmon
Georgia State University
P.O. Box 3978
Atlanta, GA 30302-3978
Phone: (404) 413-8064
Email: [email protected]
Student Principal Investigator: T. Wayne Dennison
Kennesaw State University
1000 Chastain Road
Kennesaw, GA 30144-5591
Phone: (770) 499-3151
Email: [email protected]
I. Purpose:
The purpose of this study is to explore and compare faculty and IT leaders‟
perceptions regarding innovation and diffusion of technology. You have been
selected for this study as either a faculty member or information technology (IT)
leader based on your affiliation with the Digital Innovation Group and/or State
System of Higher Education CIO Advisory Council.
Please note the following:
A total number of 4-8 participants will be recruited for this portion of the
research.
The interview should approximately 1 hour to complete.
The interview will be audio recorded. The audio recordings will be destroyed
on December 31, 2014.
You must be 18+ years of age to take part in this study.

224
Your participation is completely voluntary and anonymous.
There are no known risks to participation in this study.
This study maintains complete confidentiality in compliance with IRB
requirements.
Select faculty members and IT leaders are invited to participate in the
interview process and they are over 18 years of age.
II. Procedures:
If you decide to participate, you will be asked to take part in a 60 minute
interview session, which will be audio recorded, to gain a better understanding
of your perceptions regarding critical success factors for technological
innovation and diffusion in higher education. The transcribed text of this
interview will be sent to you via e-mail within one week following the
interview. You will be allowed one week from the date the e-mail is sent to
review the transcription and submit any corrections; otherwise, the remarks will
be included in this study as originally transcribed.
III. Risks:
In this study, you will not have any more risks than you would in a normal day of
life.
IV. Benefits:
Participation in this study may not benefit you personally. Overall, we hope to gain
information that may help support the process of technological innovation and
diffusion. The results of this study may also be used to better understand
technological innovation and diffusion from the points of view of both faculty and
IT leaders and to provide insight to the critical success factors that support these
processes.
V. Voluntary Participation and Withdrawal:
Participation in research is voluntary. You do not have to be in this study. If you
decide to be in the study and change your mind, you have the right to drop out
at any time. You may skip questions or stop participating at any time.
VI. Confidentiality:
We will keep your records private to the extent allowed by law. Only Dr. Stephen
Harmon, principal researcher, and Wayne Dennison, student researcher, will have
access to the information you provide. Information may also be shared with those
who make sure the study is done correctly (GSU Institutional Review Board, the

225
Office for Human Research Protection (OHRP), and KSU Institutional Review
Board). The digital recordings from this interview will be stored electronically on
a firewall-protected computer until December 31, 2014, and then destroyed. Paper
records from this interview session will be stored in a locked file cabinet and the
key maintained of student researcher‟s key ring until December 31, 2014, and
then destroyed. Your name and other facts that might point to you will not appear
when we present this study or publish its results. The findings will be summarized
and reported in group form and you will not be identified personally.
VII. Contact Persons:
Contact Dr. Stephen Harmon at (404) 413-8064/[email protected] or Wayne
Dennison at (770) 499-3151/[email protected] if you have questions,
concerns, or complaints about this study. You can also call if you think you have been
harmed by the study. Call Susan Vogtner in the Georgia State University Office of
Research Integrity at 404-413-3513 or [email protected] if you want to talk to
someone who is not part of the study team. You can talk about questions, concerns,
offer input, obtain information, or suggestions about the study. You can also call
Susan Vogtner if you have questions or concerns about your rights in this study.
Research at Kennesaw State University that involves human participants is carried
out under the oversight of an Institutional Review Board. Questions or problems
regarding these activities should be addressed to the Institutional Review Board,
Kennesaw State University, 1000 Chastain Road, #0112 Kennesaw, GA, 30144-
5591, (678) 797-2268.
VIII. Copy of Consent Form to Subject:
We will give you a copy of this consent form to keep.
If you are willing to volunteer for this research and be audio recorded, please sign
below.
_________________________________________ _________________
Participant Date
_________________________________________ _________________
Principal Investigator or Researcher Obtaining Consent Date

226
APPENDIX N
PROTOCOL FOR FACULTY AND IT LEADER INTERVIEWS
I. Contact interview participants and confirm willingness to participate in interview
process.
II. Schedule interview time and location.
III. Send interview participants electronic copy of informed consent form.
IV. Interview steps
a. Welcome and thank the interview participant
i. Describe the purpose of the study
ii. Explain the interview process
1. Length will be approximately 1 hour
2. Interview will be recorded with their permission
iii. Remind the participant that all data will be help confidential
iv. Inform the participant that notes of the interview will be provided
for their review
b. Collect signed informed consent form
c. Conduct the interview
i. Start recording
ii. Use questions on Peer Expert Interview Tool as a guide for the
interview while following participants‟ responses and concerns
iii. Take detailed notes
d. Thank participant for their time and help with the study
V. Post-Interview
a. Send a thank you note to the participants
b. Transcribe interview
c. Send participant a transcription of interview via e-mail and allowing one
week for corrections to be submitted; otherwise, the original transcription
will be used for study purposes
d. Review corrections submitted by participant and make any requested
changes to the transcription

227
APPENDIX O
FACULTY AND IT LEADER INTERVIEW TOOL
Critical Success Factors for Technological Innovation,
Adoption, and Diffusion in Higher Education
This study explores faculty members‟ and IT leaders‟ perceptions of technological
innovation and diffusion at their institution as compared to information collected from a
statewide peer expert group. The questions below will be used to guide the discussion;
however, the interview will be flexible and will follow the responses and concerns of the
participants.
Interviewer: ______________________________________________________
Interviewee: ______________________________________________________
Setting: __________________________________________________________
Date: ____________________________________________________________
Time: ____________________________________________________________
Questions:
The faculty and IT leaders completed the survey for this study identified the following as
the top five critical success factors for technological innovation and diffusion in higher
education.
Faculty Leader Top Critical Success Factors:
-------------------------------------------------------------
1. Enhances Teaching and Learning
2. Quality, Reliability, and Flexibility of Technology
3. Ease of Use
4. Availability of Skilled Technical Support
5. Availability of Resources and Financial Support
IT Leader Top Critical Success Factors:
-------------------------------------------------------------
1. Availability of Resources and Financial Support
2. Availability of Skilled Technical Support
3. Stakeholder Involvement
4. Enhances Teaching and Learning
5. Quality, Reliability, and Flexibility of Technology

228
1. Do the responses from your affiliation group accurately represent your thoughts
regarding this topic? If not, why?
2. The faculty members who participated in the survey identified “Enhances
Teaching and Learning” as the top critical success factor for technological
innovation and diffusion in higher education. Do you have any observations about
this?
3. The IT leaders who participated in the survey identified “Availability of
Resources and Financial Support” as the top critical success factor for
technological innovation and diffusion in higher education. Do you have any
observations about this?
4. Are you surprised that the faculty and IT leaders selected 4 of the same CSFs out
of the top 5 when identifying CSFs for technological innovation and adoption?
Why or why not?
5. 50.31% of the faculty members who participated in the survey identified that most
innovative ideas at your institution come from faculty. The second highest group
reported was technical departments with 18.63%. Are you surprised by this? Why
or why not?
6. In contrast, 61.90% of the IT leaders who participated in the survey identified that
most innovative ideas at your institution come from technology departments.
19.05% reported that they come from management and another 19.05% reported
that they come from faculty. Are you surprised by this? Why or why not?
7. Nearly 40% of the faculty members who participated in the survey reported that
their peers only share information occasionally regarding technological
innovation. Another 30% reported that their peers rarely share information
regarding technological innovation. Are you surprised by this? Why or why not?
8. 52.38% of the IT leaders who participated in the survey reported that their peers
only share information occasionally regarding technological innovation. An
additional 42.86% reported that their peers frequently share information
regarding technological innovation. Are you surprised by this? Why or why not?
9. More than 40% of the faculty members who participated in the survey feel that
your institution only shares information between hierarchical levels occasionally
regarding technological innovation. Just over 30% reported that this information
is frequently shared. By comparison, IT leaders who participated in the survey
reported nearly 50% to 50% that your institution either frequently or
occasionally shares information regarding technological innovation between
hierarchical levels. Do you have any thoughts or observations regarding this
information?
10. Two-thirds of the faculty members and IT leaders who participated in the survey

229
reported that your institution has formalized rules and procedures that guide the
use of instructional technology, while the other one-third reported that is does not.
Why do you think there might be confusion on this point?
11. 36.65% of faculty members and 47.62% of the IT leaders who participated in the
survey reported that your institution frequently includes various stakeholders
when deploying new instructional technology. Another 31.68% of the faculty and
33.33% of the IT leaders reported that stakeholders are occasionally included. Do
you have any observations about this information?
12. 39.13% of the faculty members who participated in the survey reported that your
institution occasionally rewards technological innovation in tangible ways, while
22.36% of the faculty reported that it is rarely rewarded. In comparison, 61.90%
of the IT leaders who participated in the survey reported that your institution
occasionally rewards technological innovation in tangible ways, while 28.57%
reported that it is rarely rewarded. Do you have any observations about this
information?
13. Do you have any other thoughts to share on this topic?

230
APPENDIX P
SRSU FACULTY #1 TRANSCRIBED INTERVIEW
Researcher: Wayne Dennison
Participant: SRSU Faculty #1
Date of Interview: May 29, 2013
Place of Interview: Interviewee‟s Office
Length of Interview: 48 minutes 54 seconds
W: When responding to the survey, the faculty ranked the following items as 1
the top five critical success factors for technological innovation: 1) Enhances 2
Teaching and Learning; 2) Quality, Reliability, and Flexibility of 3
Technology; 3) Ease of Use; 4) Availability of Skilled Technical Support; and 4
5) Availability of Resources and Financial Support. As a member of the 5
faculty affiliation group, do these responses accurately represent your 6
thoughts? Why or why not? 7
F: I think all of these five items contribute to the success of technological 8
innovation. I am not sure that “Ease of Use” is something that our university 9
system is doing well. I think that in terms of individual products, I‟m not sure that 10
the products we are using are the best products. Yes, we believe in “Ease of Use,” 11
but I‟m not sure we‟re doing that correctly. I don‟t think that the decision making 12
process on what‟s useful to the people in the university system is done properly. 13
Looking at it from a faculty member‟s point of view, I don‟t like any of the 14
learning management systems that we have used. I don‟t think that we as a 15
university system do a good job deciding on products. I don‟t think we evaluate 16
them correctly and regardless of what kind of input we provide, I think we still 17
fall short on getting something that will make the majority of the people happy. 18
To me, “Ease of Use” is a concern. We you look at our current and previous 19
learning management systems, this is concerning. We have a lot of things that we 20
need to look at, especially from the decision-making process point of view. 21
W: When responding to the survey, the IT leaders ranked the following top 22
five critical success factors: 1) Availability of Resources and Financial 23
Support; 2) Availability of Skilled Technical Support; 3) Stakeholder 24
Involvement; 4) Enhances Teaching and Learning; and 5) Quality, 25
Reliability, and Flexibility of Technology. Do you have any observations 26
about these rankings from the IT leaders? 27

231
F: If you look at the item ranked #2, “Availability of Skilled Technical Support,” I 28
think that says a lot. If you look at the IT departments on campus when they are 29
handling a major initiative, such as the D2L implementation, they have to deal 30
with the university system and they have to deal with the stakeholders. In my 31
opinion, I don‟t mind the IT professionals on campus making decisions that will 32
impact me because they have my best interests in mind as a KSU faculty member. 33
The university system looks at this from a different point of view. They look at it 34
based on what‟s good at the university system, but at the individual universities, 35
it‟s an important issue because it may or may not meet our individual needs. I 36
think #2 is perfectly placed. For me, trying to help my IT leader, I would say that 37
support is the second most important thing. If you don‟t have the money or the 38
resources, you don‟t worry about support. Given that we have the resources we 39
need (i.e. money, technology, hardware, software, etc.), support becomes an 40
important thing, especially if the support comes from the university system. 41
W: When comparing the top five critical success factors for technological 42
innovation listed by the faculty to those listed by the IT leaders, were you 43
surprised that out of the total number of factors ranked 4 out of the 5 are the 44
same even though they are ranked differently. 45
F: I‟m not surprised at all. They make sense. I have been in the staff shoes and 46
I‟m now a faculty member. I think that this shows that we really are 47
communicating. We have the same needs, so somebody just needs to facilitate the 48
process. IT wants to support the faculty and we want that support. As long as we 49
agree, our lives will be much easier. To me, the fact that you have the IT leaders 50
and the faculty agree on so many of the items, helps to validate your survey. The 51
fact that people actually agree and that we don‟t have too many differences, 52
should make our processes more efficient. 53
W: When asked where the majority of the innovative ideas originate on 54
campus, 50.31% of the faculty members who participated in the survey said 55
they come from faculty. 18.63% thought they come from the technical 56
departments. Do you have any observations to share regarding this 57
information? 58
F: I am not surprised. Having been a member of both groups at one time, I would 59
have expected this. The observation that I would like to add is that I wish it were 60
the other way around. Meaning it would be good if our IT staff would actually 61
come up with these ideas and become proactive instead of reactive to what the 62
faculty needs. The reason I say this is if our IT people are able to decide or at least 63
explore what is good for the faculty and try to sell it, that would make it easier to 64
take something to the upper levels. I think that when a faculty member goes to a 65
conference and brings back the idea that they found something they have to have, 66
it‟s counterproductive. It‟s counterproductive because it costs the department 67

232
money, costs the university money, and imposes something new on the support 68
staff who already have their plates full. It has selfish reasons that I don‟t agree 69
with. But, if our IT staff were to come up with these ideas, be innovative and most 70
importantly, not be afraid to share these ideas, it could help enhance the teaching 71
for our professors and the learning for our students. With this collaboration, we 72
could take it to the upper level to request the money and resources needed to 73
support the technology. As a faculty member, I think the IT people are the most 74
appropriate people to generate the innovative ideas and take them to the faculty. 75
W: When reviewing the responses from the IT leaders, more than 61% 76
reported that most of the innovative ideas on campus come from the 77
technology departments. 78
F: That is interesting and I‟m very glad to hear that IT leaders believe that they 79
have the innovative ideas. To me, if you have the ideas, why don‟t you sell it? 80
Why don‟t you tell the faculty that we can help you with this? Did they provide 81
any specific examples of ideas that came from IT leaders? 82
W: No, examples were requested as part of the response for this question. 83
F: I would like to see examples because to me it would hopefully help minimize 84
the resistance. 85
W: When responding to the question of how often they see information 86
regarding technological innovations being shared among their peers, nearly 87
40% of the faculty members reported that their peers only share information 88
occasionally and another 30% reported that their peers rarely share 89
information. Are you surprised by this information? 90
F: Yes, I am surprised about this response. I think there is more collegiality on our 91
campus. I don‟t have any issue getting technical help from my colleagues. I brag 92
about our university any time I go to a conference. I‟ve never been denied 93
anything that I need. Any time I need something, people make it happen. People 94
want to help you, not only you, but the department. I am very surprised because I 95
think this is very low in my own measures. My guess would be that at least 80% 96
of the faculty share information regularly. 97
W: Do you think there might be a difference between the different 98
departments on campus? Is it possible that your department is very good at 99
sharing information regarding innovation, but other departments may not be 100
so good at it? 101
F: I‟m not sure. I do know that you have several faculty around campus that are 102
not in touch. I think this is a function of us getting bigger. We don‟t interact with 103
each other as much as we used to. That may just be the case of a big university. 104
W: When asking the IT leaders about information regarding technological 105
innovation being shared among their peers, 52.38% reported that their peers 106
only share information occasionally, 42.86% reported that their peers 107
233
frequently share information regarding technological innovation. Do you 108
have any thoughts regarding these data? 109
F: That‟s really good to know because they are the ones that use it the most. I‟m 110
not surprised by this. Having worked in a technical department at one time, I 111
believe that the technical people don‟t tend to compete as much as they tend to 112
learn from one another. I know that our IT groups on campus regularly share 113
information and work together on big projects. I think that these numbers attest to 114
the fact that IT people know their mission better than the faculty do. 115
W: In terms of how often information regarding technological innovation is 116
shared between hierarchical levels on campus, more than 40% of the faculty 117
members who participated in the survey reported that it is occasionally 118
shared and just over 30% reported that this information is frequently 119
shared. By comparison, IT leaders who participated in the survey reported 120
nearly 50% to 50% that information regarding technological innovations is 121
frequently or occasionally shared between hierarchical levels on campus. Do 122
you have any thoughts or observations regarding this information? 123
F: One thing that I tend to harp on is communication. I‟m not sure we do a good 124
job at the communication process. I think we have gotten better at it as a 125
university. That‟s probably why faculty don‟t complain as much or as loud as they 126
used to because there is more communication. I‟m not sure if the information has 127
to do with IT projects or information in general. Regarding information in 128
general, we are as guilty as a university as a lot of organizations. There is not 129
enough communication that takes place. I think our president does a good job at 130
communicating updates, the state of the university, meeting with different 131
colleges, and the town hall meetings with the staff. I‟m not sure everyone else 132
does such a good job. Our dean is getting better at communicating information. 133
She listens to our suggestions. She sends monthly memos and sends out 134
spreadsheets and other financial information that helps keep us informed. I feel 135
that we‟re getting better as a university. For some reason we tend to forget that if 136
I‟m transparent, it will minimize the hallway conversations and the rumors and it 137
will be easier in the long run. Some people say they cannot invest the time needed 138
because they are doing something else. I think that getting people involved and 139
communicating whatever is needed, whether it‟s related to an IT project or 140
something else, people need to know what‟s going on. I‟m not sure if the lower 141
percentage reported by the faculty is related to the department chairs not 142
communicating as well as they should, but that‟s a possibility. They need to be 143
transparent so the faculty don‟t have to hear things from their colleagues. 144
W: Approximately, two-thirds of the faculty members and IT leaders who 145
participated in the survey reported that your institution has formalized rules 146
and procedures that guide the use of instructional technology, while the other 147

234
one-third from each group reported that is does not. Why do you think there 148
might be confusion on this point? 149
F: Communication. I think a lot of people don‟t know where to find the 150
information. It‟s either because they don‟t read the e-mail or there wasn‟t an e-151
mail to say where to find the information. I‟ll give you an example. Someone sent 152
me an e-mail asking me for a document that had to do with our college. That 153
document had been shared three or four times by e-mail so I was surprised that 154
she sent me an e-mail asking for a copy of a faculty performance document. I just 155
searched my e-mail and found a copy of the document. Not that I minded helping 156
her, but this is just an example of where the faculty member was not paying 157
attention to her particular e-mail until she needed it. At the same time though, our 158
people have to communicate to say if you need a particular document is right here 159
so people will know where to find it. Any time you have a document that is really 160
important to the university, the department, the college, or whoever, it needs to be 161
advertised. Another thing that we don‟t do is a consistent reminder. What I mean 162
by consistent is if you have a document that is important to the college about 163
faculty performance or faculty evaluations, it needs to be communicated that if 164
you need this particular document, it is right here. When staff are evaluated they 165
know where to get the document that will be used for evaluation. When faculty 166
are evaluated, they only remember when they get the e-mail in February. Then 167
they scramble to determine what documents they need. The department chairs 168
could communicate these are the documents where they can find them on the 169
department website. These reminders will help ensure we have everything in 170
policy. 171
W: Roughly 36% of faculty members and 47% of the IT leaders who 172
participated in the survey reported that your institution frequently includes 173
various stakeholders when deploying new instructional technology. Another 174
31% of the faculty and 33% of the IT leaders reported that stakeholders are 175
occasionally included. Do you have any observations about this information? 176
F: I am not surprised by those results because the faculty in general would think 177
that we‟re not involved. In some instances, the faculty had the right to say that we 178
were not involved, but that was several years ago. Again, a good indicator is the 179
minimum amount of complaints about D2L. You have people asking questions, 180
but there was no major pushback from faculty saying they didn‟t want it. If you 181
had asked this five years ago, I think it would have been much lower. Even as low 182
as the numbers you had reported, I think it is getting better. I am not surprised by 183
this, again because faculty think they have no say so in anything whatsoever. 184
That‟s the mentality for some faculty, but I don‟t think that‟s true for most 185
faculty. 186
235
W: Approximately 39% of the faculty members who participated in the 187
survey reported that your institution occasionally rewards technological 188
innovation in tangible ways and another 22% of the faculty reported that it is 189
rarely rewarded. In comparison, about 62% of the IT leaders who 190
participated in the survey reported that your institution occasionally rewards 191
technological innovation in tangible ways, while almost 30% reported that it 192
is rarely rewarded. Do you have any observations about this information? 193
F: I‟m not surprised by these numbers. I definitely think we could do better, but at 194
the same time, we need to find guidelines. For example, let‟s say I‟m going to use 195
Prezi for my classroom presentations. To me, I don‟t think of that being an 196
innovation. If a faculty member is to be awarded, there needs to be a process for 197
them to be evaluated. I think the university in general does not do a great job of 198
celebrating success. There is a lot of success to be celebrated at the different 199
levels. In my opinion, we should consider units or departments, not just individual 200
faculty members. At the beginning of the school year, we celebrate ten or so 201
employees. To me, when you have 3,000 employees and you only celebrate 10 of 202
them, that‟s not very much. You have to make it a bigger thing. You need to 203
recognize the faculty members that do a good job. If you could provide resources 204
for each of the academic units to recognize two or three individuals each year, 205
that would provide incentives. I think that when you recognize departments that 206
will help create a culture of celebration around the university. I agree with these 207
numbers, they are high, but I agree with them. 208
W: Based on the data I collected, that’s all the questions I have. Do you have 209
any other thoughts or observations regarding this topic you would like to 210
share? 211
F: I would just like to emphasize the importance of communication. I‟m glad that 212
this study looked at things other than just technology. It‟s not just about IT 213
projects, it‟s about sharing information at the university as a whole. I really like 214
the fact that when you‟re talking about success and innovation, whether it‟s 215
innovation in teaching, innovation in technology, whatever innovation and 216
creating a product that will help enrollment or registration. I think that all of these 217
things are really important and it will be good to have this information shared 218
with the executive level once you‟re finished. 219

236
APPENDIX Q
SRSU FACULTY #2 TRANSCRIBED INTERVIEW
Researcher: Wayne Dennison
Participant: SRSU Faculty #2
Date of Interview: June 6, 2013
Place of Interview: Interviewee‟s Office
Length of Interview: 35 minutes 45 seconds
W: When responding to the survey, the faculty ranked the following items as 1
the top five critical success factors for technological innovation: 1) Enhances 2
Teaching and Learning; 2) Quality, Reliability, and Flexibility of 3
Technology; 3) Ease of Use; 4) Availability of Skilled Technical Support; and 4
5) Availability of Resources and Financial Support. As a member of the 5
faculty affiliation group, do these responses accurately represent your 6
thoughts? Why or why not? 7
F: I think they very much mirror my responses. Also, some of the research I have 8
found is ease of use and availability. I think faculty members are rather hesitant 9
and they need to see successful models before they will jump into anything. That 10
plays into the fact that they don‟t want to be the guinea pig. When you use 11
technology it often doesn‟t work. That‟s part of the credibility; they don‟t want to 12
lose face. 13
W: Were you surprised that “Enhances Teaching and Learning” was the 14
main critical success factor according to the faculty respondents? 15
F: No, I would hope that every faculty member would be thinking in those terms. 16
Because the other items are more logistical in nature and how you feel about the 17
technology. For example, the question as to whether or not we should move to e-18
books. I tell my class that I don‟t really care where they get a book; I just need 19
them to get one. Whatever is easier for the student propels the mission further 20
down the road. 21
W: When responding to the survey, the IT leaders ranked the following top 22
five critical success factors: 1) Availability of Resources and Financial 23
Support; 2) Availability of Skilled Technical Support; 3) Stakeholder 24
Involvement; 4) Enhances Teaching and Learning; and 5) Quality, 25
Reliability, and Flexibility of Technology. Do you have any observations 26
about these rankings from the IT leaders? 27

237
F: I‟m not surprised that “Availability of Resources and Financial Support” was 28
the top item for IT leaders. I think for most decision makers anywhere, even 29
faculty, consider cost an important factor. When I‟m looking to implement 30
something, I think is it cheaper for the student? So cost is a driving factor in 31
almost any decision. 32
W: When comparing the top five critical success factors for technological 33
innovation listed by the faculty to those listed by the IT leaders, were you 34
surprised that out of the total number of factors ranked 4 out of the 5 are the 35
same even though they are ranked differently. Faculty had “Ease of Use” in 36
their top five and IT leaders did not. IT leaders had “Stakeholder 37
Involvement” in their top five and faculty did not. 38
F: I think that the logistics of rolling something out are similar. For example, how 39
much does it cost, how long will it take, what are the support mechanisms, does it 40
impact something else, etc. The integration piece is important. You have to make 41
sure it works and meshes with other things. IT leaders are concerned about 42
uptime. They are concerned about making it happen. I look at those as macro and 43
micro focused. The IT leader is looking at a bigger picture where faculty are 44
looking mainly at their program or classroom specifically. So, what are the things 45
that are impacting their decision making? I am surprised though that IT leaders 46
had instructional effectiveness lower on their list. I am glad that it is on the list. If 47
this was not an institution of higher education, that might be appropriate. But I 48
think when you implement technology in any situation, you have to consider the 49
mission of the organization. Whether you‟re in a corporate environment or not, 50
you have to consider if it is going to get you to the main goal instead of thinking 51
about cost, rollout, and things like that. We should look at how it will impact our 52
overall mission. Since our mission is teaching and learning, I would hope that that 53
would be a primary consideration. 54
W: When asked where the majority of the innovative ideas originate on 55
campus, 50.31% of the faculty members who participated in the survey said 56
they come from faculty. 18.63% thought they come from the technical 57
departments. Do you have any observations to share regarding this 58
information? 59
F: I think it is which camp you are in. You would have more of an awareness 60
based on the particular lens you are looking through. I think, and this may be 61
specific to our institution, that because we‟ve grown so fast, it is hard to keep up. 62
Instead of being proactive and innovative, we‟re more reactive. Now, we‟re all 63
wrestling with mobile devices. If we were a smaller school and we were not 64
trying to solve our growing pains, maybe we would have been thinking ten years 65
ago that handhelds and mobiles would be the wave of the future. Then again, 66
they‟ve only been out for ten years or so and in institution time, that‟s not very 67

238
long. In a bigger sense, I think that faculty perceive themselves as more 68
innovative where an IT professional might be more of an institution person. That 69
is, they focus on making the system run. The faculty members are much more 70
autonomous. They are given a lot more latitude, so that may help describe why 71
there is a perception of innovation. I‟m not sure that‟s actually true though. In my 72
own experience, I would say that it‟s about 50/50. Sometimes really great ideas 73
come from IT. For instance, the ability to use your copy card all across campus. 74
That has made life so much easier because you can access the copiers in any 75
building at any time. 76
W: When reviewing the responses from the IT leaders, more than 61% 77
reported that most of the innovative ideas on campus come from the 78
technology departments. 19% of the IT leaders attributed the majority of the 79
innovative ideas on campus to faculty and another 19% attributed them to 80
management. Do you have any thoughts about this information? 81
F: I‟m not surprised by this, but I don‟t think it is accurate. I think that people are 82
myopic in general. For instance, when we first began talking today, I wanted to 83
tell you all about our program because that is primarily what I‟m focused on and 84
I‟m not really concerned about what‟s happening in other departments. Because 85
people are myopic and very proud of our accomplishments, we have to tout them. 86
That may help explain why there is a skew. What may be interesting is to talk to 87
someone who may have been involved in both groups. For instance, an IT 88
professional who also teaches. That way you can get both perspectives. I don‟t 89
think that the faculty and IT groups on campus are as progressive as we could be. 90
There are so many things that we could be doing, but again we are serving a 91
population of almost 30,000 people. That makes it very hard to make day-to-day 92
operations run. But, if you could dedicate resources to a forward looking team or 93
something like that, they could scout out what‟s on the horizon and how to 94
prepare for it. It‟s very difficult to try to retrofit something, especially when you 95
have multiple systems. I don‟t think that faculty have that perspective at all. I feel 96
that I do because I come from both sides of the house. All that most faculty care 97
about is their little piece of the pie. So I guess it boils down to the micro and 98
macro perspectives at play. I also think that faculty are sort of turf oriented and 99
think that we are the only ones with ideas. 100
W: When responding to the question of how often they see information 101
regarding technological innovations being shared among their peers, nearly 102
40% of the faculty members reported that their peers only share information 103
occasionally and another 30% reported that their peers rarely share 104
information. Do you have any thoughts or observations about this 105
information? 106

239
F: I think that information is shared, but I don‟t know that it is systematically 107
shared. It depends upon what you‟re listening for. I think that faculty members are 108
predominantly interested in their own content or subject. Therefore, they‟re not 109
listening for other information. Again, I play in both worlds, but my day-to-day 110
business is technology so I‟m keenly listening for what other people on campus 111
are doing with technology. But, if you ask a regular faculty member, they would 112
probably say that they really don‟t hear a lot about technological innovation 113
efforts. It may or may not be shared but it‟s the perception. They are not actually 114
hearing about what‟s out there. Occasionally, I will throw out a tech tip of the day 115
to my department. Like, here‟s something you can do with D2L or here‟s a way to 116
track your students or here‟s a nice gadget for your phone. It‟s amazing when they 117
realize how beneficial it is. But, maybe only two or three people pick up on it. I 118
don‟t know if everyone read it or even cared about it. I guess it depends upon 119
what is on your radar. 120
W: In contrast, when asking the IT leaders about information regarding 121
technological innovation being shared among their peers, 52.38% reported 122
that their peers only share information occasionally, 42.86% reported that 123
their peers frequently share information regarding technological innovation. 124
Do you have any thoughts regarding these data? 125
F: But, who do they share it with? When one IT group is rolling something out 126
and they have to talk to another group because the puzzle pieces have to fit 127
together, it is important for them to collaborate. Overall, and I will say that I have 128
been at this institution for over 18 years, the IT department right now is in the best 129
shape synergy wise than it has ever been. The IT people do know what the people 130
in other departments are doing. For a long time we were in silos. Now, everyone 131
knows that they can go talk to so-in-so because they know what‟s going on. So 132
the information does transfer back and forth, which is maybe a bit more accurate. 133
But, I don‟t know is it so much about information or is it innovation? An example 134
is when we have the ITAC meetings, I try to push something new. A lot of it was 135
here‟s what we are doing today instead of just a regular report. I tried to show 136
people here‟s what is happening now. How do you get that information when 137
things change so fast? So, is it sharing information or is it sharing innovation? 138
That is a good question. 139
W: In terms of how often information regarding technological innovation is 140
shared between hierarchical levels on campus, more than 40% of the faculty 141
members who participated in the survey reported that it is occasionally 142
shared and just over 30% reported that this information is frequently 143
shared. By comparison, IT leaders who participated in the survey reported 144
nearly 50% to 50% that information regarding technological innovations is 145

240
frequently or occasionally shared between hierarchical levels on campus. Do 146
you have any thoughts or observations regarding this information? 147
F: I don‟t know because I don‟t where I fall in that vertical line. So I don‟t know 148
how information is flowing up or down. It is interesting that I have first line 149
technical support people that are saying or mirroring the same thing that their 150
bosses are saying. Formally, their boss may say we are rolling out this initiative 151
and they have already told me to be prepared because this is coming. I think that 152
is vital. In my opinion, the more transparency you have, the better the operation is 153
going to flow. But, I don‟t really have a way to gauge if that is accurate or not. 154
From my own experience, I have seen in the past there has been more of a silo 155
mentality. 156
W: Approximately, two-thirds of the faculty members and IT leaders who 157
participated in the survey reported that your institution has formalized rules 158
and procedures that guide the use of instructional technology, while the other 159
one-third from each group reported that is does not. Why do you think there 160
might be confusion on this point? 161
F: I think it is the definition of instructional technology. When you say 162
instructional technology my first thought is the use of classroom technology 163
integration. We have lots of rules and procedures regarding what you‟re allowed 164
to do and what you‟re not allowed to do. That may be where the numbers are so 165
high. We have plenty of rules about what you can and can‟t do with technology – 166
management rules of technology. I would not consider these rules for instructional 167
technology. I would be in that one-third. I don‟t think we have rules and 168
procedures governing instructional technology. We rolled out Smartboards to 169
model a K-12 environment in most of our classrooms, yet they are rarely used. If 170
you talk to any faculty member, they are using them as a whiteboard. So, there‟s 171
this disconnect that we went so far as to get the technology, but lost the next step 172
which is to get the support and ultimately training. I think that came out in this 173
study‟s top critical success factors. Is there someone there to support you in your 174
use of the technology? I also think that faculty are somewhat reluctant. I think that 175
it is something they are not comfortable with so that may help explain it. I don‟t 176
think that we have rules governing the use of instructional technology, so I‟m 177
surprised that these numbers are so high. I think it would be fantastic if that were 178
the case. 179
W: Roughly 36% of faculty members and 47% of the IT leaders who 180
participated in the survey reported that your institution frequently includes 181
various stakeholders when deploying new instructional technology. Another 182
31% of the faculty and 33% of the IT leaders reported that stakeholders are 183
occasionally included. Do you have any observations about this information? 184

241
F: My initial thought is again about the definition of instructional technology. 185
When I think about instructional technology on this campus, it‟s predominantly 186
the teacher projection station. There‟s a computer, a document camera, a 187
projector, and some audio capabilities. In that case, I would say there is very little 188
consulting with the stakeholders because it is just sort of de facto. People get 189
annoyed because we are so good at that. When they walk into a classroom and it 190
is not there or it doesn‟t work, it‟s unusual. Faculty are spoiled. That‟s good, but 191
what is the next step? The only thing I can think of is when we‟re rolling out 192
clicker response systems, that‟s usually driven by the stakeholders. One 193
department or one college says we want to do this or we‟re rolling this out. In this 194
case, the stakeholder is really driving the initiative and the IT people are 195
facilitating the initiative. So my dilemma is what we consider instructional 196
technology. Is a projection system instructional technology? You can argue one 197
way or the other, but most people are using it as a passive whiteboard. It does 198
allow you a lot of flexibility because you can get on the web or play video clips, 199
but how much are we teaching on mobile devices? The next question is what is 200
the next thing coming down the line? For instance, hybrid and online learning 201
seems to be a big thing right now, but how many people are doing it well? How 202
many faculty are just reproducing what they are doing in their regular classroom 203
in an online format? Overall, I think we are very responsive to stakeholders. 204
However, my question would still be what is the definition of instructional 205
technology? Because I haven‟t seen a lot of innovation in that area unless you‟re 206
using projection systems as a standard – then we‟ve exceeded the standard. 207
W: Approximately 39% of the faculty members who participated in the 208
survey reported that your institution occasionally rewards technological 209
innovation in tangible ways and another 22% of the faculty reported that it is 210
rarely rewarded. In comparison, about 62% of the IT leaders who 211
participated in the survey reported that your institution occasionally rewards 212
technological innovation in tangible ways, while almost 30% reported that it 213
is rarely rewarded. Do you have any observations about this information? 214
F: My college may be an anomaly. In our college, we have rewarded efforts to put 215
courses online. Faculty are paid a stipend to develop the online course in addition 216
to the funding to actually teach the course. Other than that, I guess the only other 217
incentive I‟ve seen is when working on a particular project, you get to use an iPad 218
or something along those lines. I would tend to agree that the reward system in 219
general is not systematic. It‟s spotty at best. It‟s hit or miss based on whatever 220
initiative and whatever vision the dean of that particular college has. That‟s 221
another problem because the deans run each college and some of their visions are 222
very progressive and some are not. The good news is that it is stated in our 223
accreditation that we have to be implementing technology. My college is fairly 224
242
progressive but how do we get the rest of the faculty onboard with that? I 225
remember a long time ago when our vice president said he wanted to get rid of 226
overhead projectors. He said that he wanted to put them out on the lawn and burn 227
them. That was a directive on how to push everything forward. It‟s been effective 228
because we don‟t really have overhead projectors anymore. They‟re actually hard 229
to find when you need one. I have yet to see our institution push an instructional 230
technology agenda. We push a technology agenda but not an instructional 231
technology agenda. Most of it is workflow management, resource management, or 232
how we are scanning documents. Most of them are logistical technical solutions 233
to some sort of problem. For example, having money on our ID cards. That‟s 234
something cool to have, but does it impact instruction? Is the CIO of a university 235
or an organization instructional focused or logistical focused? I think that if I was 236
in that role, I would probably be logistically focused. If someone‟s e-mail is not 237
working or the phones are not working, it would be a problem. 238
W: Based on the data I collected, that’s all the questions I have. Do you have 239
any other thoughts or observations regarding this topic you would like to 240
share? 241
F: I also researched the faculty at our school so my question would be is it 242
applicable to a bigger field? I think that if you asked these questions at any other 243
university, you would probably get the same sort of dichotomy between faculty 244
and IT professionals. Faculty think they are everything in the world and the IT 245
people think you can run it without them. Maybe it is systemic in university 246
culture that there‟s a lack of cohesion. If this were a business, we would have 247
meetings every Monday morning saying this is what we‟re working on and here‟s 248
how we‟re trying to get to this goal. Everyone has individual goals, which makes 249
it fantastic, but it makes it very hard to manage. I think that technology is low on 250
the pecking order for a faculty member because their major concern is tenure and 251
promotion. Also, as we move to a more research intensive institution, they are 252
also concerned about their individual projects. I think it is great that the university 253
allows that, but it does cause conflict because why are my interests more 254
important than the bigger picture? I don‟t know how that‟s going to play out in 255
the future. I think the bigger we get, the worse it is going to get. I know people at 256
other larger institutions and we never have the opportunity to see each other or 257
collaborate together. I wish that we did a better job. If faculty are saying that 258
information is not really passed around, it‟s probably because there aren‟t a lot of 259
forums for exchange of ideas. We could do something virtually or set up a 260
learning community for instructional technology.261

243
APPENDIX R
SRSU IT LEADER #1 TRANSCRIBED INTERVIEW
Researcher: Wayne Dennison
Participant: SRSU IT Leader #1
Date of Interview: May 30, 2013
Place of Interview: Interviewee‟s Office
Length of Interview: 44 minutes 25 seconds
W: When responding to the survey, the faculty ranked the following items as 1
the top five critical success factors for technological innovation: 1) Enhances 2
Teaching and Learning; 2) Quality, Reliability, and Flexibility of 3
Technology; 3) Ease of Use; 4) Availability of Skilled Technical Support; and 4
5) Availability of Resources and Financial Support. 5
L: Did they rank them all or just the top five? 6
W: Respondents were asked to rank all the critical success factors on a scale 7
of 1 to 5, with one being the lowest and five being the highest in relation to 8
the median critical success factor. 9
L: With only one top factor? 10
W: Yes, they ranked the items in terms of their criticality and there was a 11
clear top ranking identified. In comparison, the IT leaders identified the 12
following top five critical success factors: 1) Availability of Resources and 13
Financial Support; 2) Availability of Skilled Technical Support; 3) 14
Stakeholder Involvement; 4) Enhances Teaching and Learning; and 5) 15
Quality, Reliability, and Flexibility of Technology. Looking at these top five 16
factors for the IT group and coming from your perspective of an IT leader, 17
what are your thoughts? 18
L: I‟m not surprised by the responses of either group. To me, the glaring 19
observation that they are not focused on the customer. I‟m talking about the hard 20
worker in the classroom. You have to be in there and doing that kind of stuff to 21
understand that all the kinds of things they are talking about is interesting. It‟s all 22
technical stuff, keeping the lights on and that sort of thing. The people who are 23
successful in this business are able to transition and build their discussion around 24
technology primarily to support the customers, which are the faculty and students. 25
Those statements don‟t indicate that to me. It‟s simply a technical matter. 26
Reliability, patch management, and all the other technical things. I guess I would 27
be more encouraged if there had been anything high on the scale that indicated it 28

244
was all about supporting innovation for the teacher. I‟ve never had a bad idea 29
brought to me by a faculty member. The primary job of IT is to support the people 30
in the trenches. That‟s where the fight‟s being fought. If we lose sight of that, then 31
I don‟t think we‟re doing the job as well as we can. It‟s the difference between 32
operational and tactical levels. IT people tend to work at the tactical level. I‟ve 33
heard few conversations where they actually sit down with IT people and try to 34
understand it from the perspective of the customer. I think that is a shortcoming of 35
the industry, but I believe in evolution. Over time, it is going to fully integrate. 36
We‟re still thinking like it is an enabler versus an integral part of the solution. The 37
enabler statement is back in the days when we thought the customer was 38
uninformed. It was the mainframe days when I started off in this business, you 39
never let a user in the mainframe room. I think my reaction to that is it doesn‟t 40
reflect a clear statement that places supporting the customer as the primary 41
purpose. The technicians will tell you that it is implied, but to the contrary, to be 42
successful in IT management, you have to be able to understand and translate the 43
mission. Also being a faculty member gives me an appreciation for what it is like 44
in the classroom actually using the technology. If we had the ability to have some 45
of our better IT people shadow a faculty member, they could sit in the classes and 46
watch and see how the technology is used to gain a better understanding of what 47
the faculty need. I bet very few of them know how it is really used. They have 48
been at the receiving end, but they have never been in the classroom to see how 49
the faculty makes it all work. I think this is an area where we could really improve 50
support. Faculty look at everything from a different angle. It‟s similar to the way 51
university CIO‟s and business officers look at things. An IT guy, it‟s my 52
perspective that the CIOs and the chief business officers are moving at a much 53
different pace. The business officers are moving at a much slower pace because of 54
the accounting functions they have to deal with. IT is moving at light speed, 55
which is driven by the constant changes we have to deal with. They are out of 56
balance with each other. Business officers believe that the IT people are always 57
promising things and never deliver. I was told one time when I was talking to a 58
comptroller while doing my study when he said let me tell you about “you guys,” 59
referring to the IT guys. He said “You come in here with this whiz bang piece of 60
equipment, drop it on my desk, and you disappear. It works great, but it doesn‟t 61
do what I need it to do.” That‟s where the frustration from the customer comes 62
from. There has to be more interaction because two sides to this. The faculty 63
member does not understand how difficult and complex IT is. The day of the 64
generalist is over. IT staff have to have very unique skills today. It‟s my belief 65
that the faculty appreciate this any more than the IT people appreciate what the 66
faculty have to do. It‟s all about how you plan and how you use the technology. If 67
the IT people could teach a course and go about how to set up a course using 68

245
technology to its maximum advantage. Once, when I was teaching a class on 69
Organization Presentation Methods, I brought the leader of the presentation 70
technology IT group in to talk to the class. To this day, I still don‟t know what he 71
was talking about. All the students in the class were undergraduate 72
Communication majors with no IT experience. He completely lost them by using 73
technical language that no one could understand. He was asked to talk about how 74
to use the cool new technologies to enhance their presentations and to get by the 75
death by PowerPoint problem. If our directors and their assistant and associate 76
directors were required to teach a class, even if it was just a special lecture for one 77
night, I guarantee they would have a different perspective on how to support the 78
customer. Right now, if they don‟t do that, they are guessing. All the customers 79
want to know is that the technology is going to work. They have to understand 80
what it takes to make it work. 81
W: One of the questions on the survey asked where the majority of the 82
innovative ideas originate on campus, 50.31% of the faculty members who 83
participated in the survey said they come from faculty. 18.63% thought they 84
come from the technical departments. In contrast, 61.90% of the IT leaders 85
who participated in the survey said that most innovative ideas on campus 86
come from the technology departments. An additional 19.05% reported that 87
they come from management and another 19.05% reported that they come 88
from faculty. Do you have any observations or thoughts about this 89
information? 90
L: This is a case where I think they are both right because they are talking about 91
two different things. Faculty are talking about how to use the technology to be a 92
better teacher and from the perspective of meeting the expectations of the 93
students. The IT people are looking at it from a different angle. One of the things I 94
include in my lectures to students is that next to the medical profession, IT the 95
fastest moving industry where you constantly have to keep up. Within six months, 96
if you don‟t keep up with it, you are irrelevant. From the IT side, it is a fulltime 97
exercise to keep up with all of the innovations that come through here. From the 98
faculty side, except for those rare occasions like in the Information Systems 99
Department, don‟t understand how difficult it is to keep up. As a general rule, I 100
think both groups are right when they say the innovative ideas come from their 101
own group because they see it through their particular lens. I would have 102
predicted that. The question about IT innovations is how can they best be used? 103
We rarely ask that around here, we just hand it off. I think that the responses are 104
both absolutely predictable and symptomatic of the larger problem, that there‟s 105
not a full appreciative integration between the two groups. 106
W: When responding to the question of how often they see information 107
regarding technological innovations being shared among their peers, nearly 108

246
40% of the faculty members reported that their peers only share information 109
occasionally and another 30% reported that their peers rarely share 110
information. By comparison, over 50% of the IT leaders who participated in 111
the survey reported that their peers only share information occasionally 112
regarding technological innovation, but nearly 43% reported that their peers 113
frequently share information regarding technological innovation. Do you 114
have any comments regarding these data? 115
L: A theoretical answer to this one relates to a research paper done years ago by 116
Pamela Hinds. She did a study about the way technicians and others 117
communicate. It is called “Communication Across Boundaries.” I use this article 118
when I talk to students, especially in the Information Systems area. I tell them that 119
they need to understand that IT people communicate differently than managers 120
and faculty members. IT people communicate horizontally. Administrators and 121
others communicate vertically. This is because administrators and others tend to 122
follow the organization chart. IT people are not worried about that. They are 123
interested in solving a technical problem. They will call a friend at another 124
university or organization to get a resolution. This is often what causes faculty 125
and IT to be at odds with each other. When we don‟t understand each other, it‟s 126
because we‟re communicating differently. One of the things that I‟ve read that 127
chief executive officers worry about is giving away the farm when they are trying 128
to solve a particular technical problem. I think a fundamental thing driving this 129
particular question is that faculty and IT people are coming from two different 130
worlds. If you can understand that, you can do a better job of understanding what 131
the customer wants and you do a better job at understanding what the technicians 132
are trying to do. I agree that IT leaders are more likely to share information 133
among peers than faculty because in the IT world, that‟s the way to get you job 134
done. I absolutely agree with what was reported from both groups, because I think 135
they are both accurate. In general terms, I would say that IT people are going to 136
beat faculty in terms of sharing information among their peers. It‟s just the nature 137
of the business. IT has a much better system, in terms of trade journals and those 138
sorts of things, to keep up with things. I think we have much better sources of 139
information than they have on the faculty side. For faculty, they have research 140
journals and things like that, but by the time something gets published in that 141
medium, it is often old news. In the IT business, things are moving so fast, you 142
have to share information continuously. The people who are successful are those 143
that are out looking for that information. IT people like to share information 144
because it‟s fun. You keep IT people by keeping them challenged with new toys. 145
This keeps them excited and they are willing to share that information. A good 146
thing about attending EDUCAUSE and other related conferences is so much good 147
information sharing occurs. EDUCAUSE focuses on IT in higher education and 148

247
even though most of the attendees are from the technical side, faculty members 149
also show up and give extraordinary presentations. Even in this environment, you 150
can see that there is a disconnect. One observation is I think information sharing 151
may even be higher on the IT side than they report, because it happens so often, 152
they don‟t even realize it is going on. It is integrated into their business and they 153
may be thinking in more formal ways. 154
W: When asked about the inclusion of stakeholders when deploying new 155
instructional technology, roughly 36% of the faculty members and 47% of 156
the IT leaders who participated in the survey reported that your institution 157
frequently does a good job at this. Another 31% of the faculty and 33% of 158
the IT leaders reported that stakeholders are only occasionally included 159
when deploying new instructional technology. Do you have any observations 160
about this information? 161
L: How do you define stakeholders? 162
W: Stakeholders would include those individuals that have some involvement 163
in the deployment or use of the technology. 164
L: I would agree that as a university, we are doing a fairly good job at including 165
stakeholders, but we can always do better. From my standpoint, I think we do 166
very well here because we have standards in place and know where to go when 167
there‟s a problem. That way they can focus on what they need to do. We include 168
stakeholders in meetings and we have good processes in place. I think including 169
stakeholders is part of our institutional culture. It‟s rare that I have to ask if the 170
stakeholder was involved if the process. There have been instances where we 171
haven‟t done as well in this area as we should be, but overall, I think we do a 172
good job in this area. This is because of the culture that‟s been cultivated on 173
campus. In the development area, you never understand what the customer wants. 174
They tell you what they want and they think they know what they want, but their 175
focus matures as they get closer. Then they start asking the question “can it do 176
this?.” That‟s where IT makes money by making it happen rather than just 177
dropping it on their desk and walking away. 178
W: Approximately 39% of the faculty members who participated in the 179
survey reported that your institution occasionally rewards technological 180
innovation in tangible ways and another 22% of the faculty reported that it is 181
rarely rewarded. In comparison, about 62% of the IT leaders who 182
participated in the survey reported that your institution occasionally rewards 183
technological innovation in tangible ways, while almost 30% reported that it 184
is rarely rewarded. Do you have any observations about this information? 185
L: I would have never guessed numbers that high. I would have guessed that the 186
numbers were lower. There are good practical reasons for this. As a state 187
organization, bonuses are not allowed because they are considered a gratuity. But, 188

248
when someone has an innovative idea, you ought to give them a bonus check. 189
Why, because it makes the family feel real good about dad or mom. That‟s the 190
real importance. We don‟t have the ability to do that other than the traditional 191
handshake that we give around here. I think the numbers reported by the faculty 192
and IT groups give us more credit than we actually deserve in this particular area. 193
I think because we don‟t have a reward or incentive structure in place that there 194
are probably many innovations that are occurring that are not being recognized. 195
They are considered part of the job. We should say “well done” from time to time. 196
I think we do as well as we can, but I think we can do much more. Based on 197
where we are today, I would have only given us 10% for faculty and IT. 198
W: Based on this study, do you have any other thoughts or observations 199
regarding you would like to share? 200
L: No, but I would be interested in seeing the difference between faculty and IT 201
when you complete the study.202

249
APPENDIX S
SRSU IT LEADER #2 TRANSCRIBED INTERVIEW
Researcher: Wayne Dennison
Participant: SRSU IT Leader #2
Date of Interview: May 30, 2013
Place of Interview: IT Training Lab
Length of Interview: 19 minutes 24 seconds
W: When responding to the survey, the IT leaders at SRSU chose the 1
following five items as the top critical success factors for technological 2
innovation: 1) Availability of Resources and Financial Support; 2) 3
Availability of Skilled Technical Support; 3) Stakeholder Involvement; 4) 4
Enhances Teaching and Learning; and 5) Quality, Reliability, and Flexibility 5
of Technology. Do these responses accurately represent your thoughts 6
regarding this topic? Why or why not? 7
L: Actually, I think that is probably about the same order that I ranked them 8
because we can‟t do very much without resources. The next thing is skilled 9
technical support as I have had difficulty with the last couple of hires. It‟s difficult 10
to find personnel who can actually meet the requirements of the position. They 11
often have the correct information in their resumes and cover letters, but once you 12
actually talk with them, they don‟t have the actual skills that you need in the 13
position. In my opinion, the top two items are definitely the top most important 14
items. The only area that I would question is “Stakeholder Involvement” because 15
if we don‟t have stakeholder buy-in, then we don‟t get the resources. 16
W: The faculty members who participated in the survey identified 17
“Enhances Teaching and Learning” as the top critical success factor for 18
technological innovation and diffusion in higher education. Do you have any 19
observations about this? 20
L: I‟m a little surprised by this. I would have expected resources to be a top 21
concern and enhanced teaching to be below that. We must have the resources in 22
order for training to occur. But, I do see in my position that faculty are beginning 23
to have a lot of apprehension about so many different technologies coming 24
through for them to learn. 25
W: When comparing the top five success factors listed by the faculty to those 26
listed by the IT leaders, 4 out of the 5 are the same even though they are 27
ranked differently. The highest ranked item for IT leaders, “Availability of 28

250
Resources and Financial Support,” was ranked 5th
by faculty. “Availability 29
of Skilled Technical Support,” which was ranked 2nd
by IT leaders, was 30
ranked 4th
by faculty. “Enhances Teaching and Learning,” which was ranked 31
4th
by IT leaders, was ranked 1st by faculty. “Quality, Reliability, and 32
Flexibility of Technology” was ranked 5th
by the IT leaders and 2nd
by 33
faculty. The faculty ranked “Ease of Use” in their top five critical success 34
factors for technological innovation, but this item did not make the IT leader 35
group top five. In contrast, the IT leaders ranked “Stakeholder Involvement” 36
in their top five critical success factors and faculty did not. Are you surprised 37
that top rankings for each group were so similar or would you have expected 38
that? 39
L: I‟m a little surprised. I do expect “Ease of Use” to be a primary concern for 40
faculty and I can see why that might not seem as important for the technical side. 41
I would have expected faculty to see things more differently than the IT side. It‟s 42
actually a positive thing to see that they are so aligned. 43
W: When asked where the majority of the innovative ideas originate on 44
campus, 50.31% of the faculty members who participated in the survey said 45
they come from faculty. 18.63% thought they come from the technical 46
departments. In contrast, 61.90% of the IT leaders who participated in the 47
survey said that most innovative ideas on campus come from the technology 48
departments. An additional 19.05% reported that they come from 49
management and another 19.05% reported that they come from faculty. Do 50
you have any observations or thoughts about this information? 51
L: I would agree with this information. From being in the training area, I see the 52
innovative ideas coming from both areas. I would definitely say that these results 53
are probably a good representation of what‟s going on in terms of innovation on 54
campus. From the technical side, we see just as much information coming from 55
the faculty as we do from our own research. Innovation is an equal partnership. 56
W: When responding to the question of how often they see information 57
regarding technological innovations being shared among their peers, nearly 58
40% of the faculty members reported that their peers only share information 59
occasionally and another 30% reported that their peers rarely share 60
information. Are you surprised by this information? 61
L: No, I think time is a factor. 62
W: By comparison, 52.38% of the IT leaders who participated in the survey 63
reported that their peers only share information occasionally regarding 64
technological innovation, but 42.86% reported that their peers frequently 65
share information regarding technological innovation. Do you have any 66
comments regarding these data? 67
251
L: I would agree with that as well. Typically, in IT we do not want duplication of 68
effort. I think this helps encourage sharing of information with each other and 69
between areas. 70
W: In terms of how often information regarding technological innovation is 71
shared between hierarchical levels on campus, more than 40% of the faculty 72
members who participated in the survey reported that it is occasionally 73
shared and just over 30% reported that this information is frequently 74
shared. By comparison, IT leaders who participated in the survey reported 75
nearly 50% to 50% that information regarding technological innovations is 76
frequently or occasionally shared between hierarchical levels on campus. Do 77
you have any thoughts or observations regarding this information? 78
L: I see this information as valid. You need this type of information sharing for 79
funding to happen. 80
W: Approximately, two-thirds of the faculty members and IT leaders who 81
participated in the survey reported that your institution has formalized rules 82
and procedures that guide the use of instructional technology, while the other 83
one-third from each group reported that is does not. Why do you think there 84
might be confusion on this point? 85
L: There is definitely confusion regarding this point on our campus. We have so 86
many different entities doing different things on campus that faculty as well as IT 87
personnel don‟t always know where to go for particular resources. We have the 88
Distance Learning Center, we have the Center for Excellence in Teaching and 89
Learning, we have the Outreach group, etc. so I think this causes confusion 90
regarding who handles what. 91
W: Roughly 36% of faculty members and 47% of the IT leaders who 92
participated in the survey reported that your institution frequently includes 93
various stakeholders when deploying new instructional technology. Another 94
31% of the faculty and 33% of the IT leaders reported that stakeholders are 95
occasionally included. Do you have any observations about this information? 96
L: I would agree. I think our campus does a fairly good job at including 97
stakeholders when deploying new instructional technologies. 98
W: Approximately 39% of the faculty members who participated in the 99
survey reported that your institution occasionally rewards technological 100
innovation in tangible ways and another 22% of the faculty reported that it is 101
rarely rewarded. In comparison, about 62% of the IT leaders who 102
participated in the survey reported that your institution occasionally rewards 103
technological innovation in tangible ways, while almost 30% reported that it 104
is rarely rewarded. Do you have any observations about this information? 105
L: I‟m not surprised by this information. We have several departments on campus 106
that provide incentives for learning and using new technologies. For example, the 107

252
Quality Matters program to help faculty put their courses online. As far as other 108
things like this that might be going on, I‟m not aware of any. Also, I think the 109
climate that we have right now on campus also contributes to that. 110
W: Based on the data I collected, that’s all the questions I have. Do you have 111
any other thoughts or observations regarding this topic you would like to 112
share? 113
L: No, but I am very interested in finding out if there‟s some type of happy 114
medium in terms of making both faculty and IT personnel aware the resources 115
that are available. I think that at our university, the way that the IT division is 116
structured there is confusion on which group handles what. Luckily, we have the 117
service desk that serves as a central hub for distributing the IT requests to the 118
right area.119