Embed Size (px)
Citation preview

CROATIA OSIGURANJE d.d. Miramarska 22, Zagreb
INDEPENDENT AUDITOR’S REPORT AND CONSOLIDATED FINANCIAL STATEMENTS FOR THE YEAR ENDED 31 DECEMBER 2011

CROATIA OSIGURANJE d.d. Miramarska 22, Zagreb
C O N T E N T S
Page RESPONSIBILITY FOR THE CONSOLIDATED FINANCIAL STATEMENTS 1
INDEPENDENT AUDITOR'S REPORT 2 – 3
CONSOLIDATED FINANCIAL STATEMENTS Consolidated statement of income / Consolidated statement of comprehensive income for the year ended 31 December 2011 4 - 7 Consolidated balance sheet / Consolidated statement of financial position as at 31 December 2011 8 - 11 Consolidated statement of changes in equity for the year ended 31 December 2011 12
Consolidated statements of cash flows for 2011 – indirect method 13 - 14
NOTES TO THE CONSOLIDATED FINANCIAL STATEMENTS 15 – 71 FINANCIAL STATEMENTS ACCORDING TO REGULATION ON THE STRUCTURE AND CONTENT OF F.ST. 72 – 82
ADJUSTMENT OF FINANCIAL STATEMENTS 83 - 85

1
RESPONSIBILITY FOR THE CONSOLIDATED FINANCIAL STATEMENTS
Management Board of the Croatia osiguranje d.d., Zagreb, (''the Company'') is responsible for ensuring that the consolidated financial statements of the Company for the year 2011 are prepared in accordance with the Accounting Law (National gazette No 109/07) and the International Financial Reporting Standards (National gazette No 136/09, 8/10, 18/10, 27/10, 65/10, 120/10, 58/11, 140/11) issued by the Committee for Financial Reporting Standards, nominated by Government of the Republic of Croatia, to give a true and fair view of the consolidated financial position, the consolidated results of operations, the consolidated changes in equity and the consolidated cash flows of the Company for that period.
After making enquiries, the Board has a reasonable expectation that the Company has adequate resources to continue in operational existence for the foreseeable future. Accordingly, the Board has adopted the going concern basis in preparing the consolidated financial statements of the Company.
In preparing those consolidated financial statements, the responsibilities of the Board include ensuring that:
• suitable accounting policies are selected and then applied consistently; • judgments and estimates are reasonable and prudent; • applicable financial reporting standards are followed, subject to any material
departures disclosed and explained in the consolidated financial statements; and • the consolidated financial statements are prepared on the going concern basis unless
such assumption is not appropriate. The Board is responsible for keeping proper accounting records, which disclose with reasonable accuracy at any time the consolidated financial position and the consolidated results of operations of the Group and their compliance with the Accounting Law (National gazette No 109/07) and the International Financial Reporting Standards (National gazette No 136/09, 8/10, 18/10, 27/10, 65/10, 120/10, 58/11, 140/11) issued by the Committee for Financial Reporting Standards. The Board is also responsible for safeguarding the assets of the Company and hence for taking reasonable steps for the prevention and detection of fraud and other irregularities.
Signed on behalf of the Board:
Silvana Ivančić Zdravko Zrinušić
Member of the Management Board President of the Management Board
CROATIA OSIGURANJE d.d.
Miramarska 22
10 000 Zagreb
The Republic of Croatia
29 March 2012

2
INDEPENDENT AUDITOR’S REPORT
To the shareholders of the company CROATIA osiguranje d.d., Zagreb
1. We have audited the accompanying annual consolidated financial statements of the company Croatia osiguranje d.d., Zagreb, Miramarska 22 ("the Company") for the year ended 31 December 2011, which comprise of the consolidated Balance sheet/ consolidated Statement of Financial Position as of that date; the consolidated Statement of Income / consolidated Statement of Comprehensive Income; the consolidated Statement of Changes in Equity; the consolidated Cash Flows Statement for the year then ended; and the accompanying Notes to the consolidated Financial Statements which concisely set out the principal accounting policies and other disclosures.
Responsibility of the Company’s management 2. The preparation and a fair presentation of the enclosed consolidated Financial Statements according to the International Financial Reporting Standards effective in the Republic of Croatia and also those internal controls which are determined by the Company's management as necessary to enable preparation of the consolidated financial statements free from material misstatements whether due to fraud or error are the responsibility of the Company's management.
Responsibility of Auditor
3. Our responsibility is to express an opinion on the enclosed consolidated Financial Statements based on the audit performed. We conducted our audit in accordance with International Standards on Auditing. Those standards require that we comply with ethical requirements and plan and perform the audit to obtain reasonable assurance that the consolidated financial statements are free from material misstatements.
An audit includes performing of procedures to obtain audit evidence supporting the amounts and disclosures in the consolidated Financial Statements. The procedures selected depend on the auditor’s judgment, including the assessment of the risks of material misstatements in the consolidated Financial Statements, whether due to fraud or error. In making those risk assessments, the auditor considers internal controls relevant to the entity’s preparation and fair presentation of the consolidated Financial Statements in order to design audit procedures that are appropriate in the circumstances, but not for the purpose of expressing an opinion on the effectiveness of the entity’s internal controls. An audit also includes evaluating the appropriateness of accounting policies used and the reasonableness of accounting estimates made by Company’s management, as well as evaluating the overall presentation of the consolidated Financial Statements.
We believe that auditing proof and evidence being collected by us are sufficient and suitable as the basis for our opinion.

3
Opinion 4. In our opinion, the enclosed consolidated Financial Statements, in all material respects, truly and fairly present the consolidated financial position of the Company CROATIA osiguranje d.d. as of 31 December 2011 and the consolidated results of operations and the consolidated cash flows of the Company for the year 2011 in accordance with International Financial Reporting Standards effective in the Republic of Croatia.
Emphasis of matter 5. Due to economic crisis which will inflow to financial position of majority of economic entities and the expected decrease of share from investments, the Parent company the additional attention has to direct to the structure improvement of investments of assets, strengthening of the loan risk management and to the additional instruments with a goal of assurance of collection of receivables and investments.
Other legal and regulatory requirements 6. The preparation of the annual consolidated financial statements of the Company for the year ended 31 December 2011 in prescribed on the basis of Regulation on the structure and content of the annual financial statements of insurance and reinsurance companies (National gazette No 132/10) which is on the basis of Insurance law and the Law on accountancy brought by Croatian agency for the supervision of financial services, and is answerable for the information on adjustment with annual financial statements of the Company in accordance with International financial reporting standards shown on pages 4 to 71 which are the subject of our opinion as set out in section Opinion, above. Financial statements of the Company according to Regulation on the structure and content of the annual financial statements of insurance and reinsurance companies and the adjustments are shown on pages 72 to 85.

CROATIA OSIGURANJE d.d., Zagreb Consolidated statement of income / Consolidated statement of comprehensive income for the year 2011
4
2011 2010
POSITION Note Life General Total Life General Total
HRK HRK HRK HRK HRK HRK
EARNED PREMIUMS (INCOME) 5.1.
Earned gross premiums
387,803,438 2,783,761,145 3,171,564,583
385,704,710 2,859,565,617 3,245,270,327
Reinsurance premiums
(319,731) (328,188,740) (328,508,471)
(6,859) (352,894,530) (352,901,389)
Coinsurance premiums
0 (3,744,946) (3,744,946)
0 (5,383,364) (5,383,364)
Change in gross unearned premium provision
73,219 6,876,012 6,949,231
112,708 74,099,692 74,212,400
Change in unearned premium provision, reinsurance portion
138 (4,609,200) (4,609,062)
0 4,342,854 4,342,854
Change in unearned premium provision, coinsurance portion
0 0 0
0 1,073,932 1,073,932
Total earned premiums (income)
387,557,064 2,454,094,271 2,841,651,335
385,810,559 2,580,804,201 2,966,614,760
INVESTMENT INCOME 5.2.
Income from property investments (land and buildings) 5.2./i/ 4,566 35,042,166 35,046,732
4,474 (20,742,588) (20,738,114)
Interest income 5.2./ii/ 108,735,174 160,644,749 269,379,923
120,256,973 173,218,528 293,475,501
Decrease in value of investments 5.2./iii/ (12,043,534) (58,043,082) (70,086,616)
(16,717,358) (20,330,656) (37,048,014) Unrealized gains / losses from investments at fair value through profit and loss account
(2,595,080) 877,154 (1,717,926)
3,172,402 6,581,962 9,754,364
Gains / losses from sale of financial investments 5.2./iv/ 1,294,343 (14,765,749) (13,471,406)
(10,283,995) (31,520,242) (41,804,237)
Net foreign exchange gains 5.2./v/ 19,753,250 16,947,707 36,700,957
11,058,585 12,329,780 23,388,365
Other investment income/expenses 5.2./vi/ (286,202) (16,644,368) (16,930,570)
(8,898,803) (45,179,597) (54,078,400)
Total investment income
114,862,517 124,058,577 238,921,094
98,592,278 74,357,187 172,949,465
OTHER INCOME 5.3.
Income from fees and commissions 5.3./i/ 69,101 44,660,305 44,729,406
90,042 45,903,228 45,993,270
Other insurance-technical income, net from reinsurance 5.3/ii/ 108,336 20,825,011 20,933,347
728,107 39,647,332 40,375,439
Other income 5.3/iii/ 1,361,321 213,761,067 215,122,388
1,832,993 244,744,866 246,577,859
Total other income
1,538,758 279,246,383 280,785,141
2,651,142 330,295,426 332,946,568

CROATIA OSIGURANJE d.d., Zagreb Consolidated statement of income / Consolidated statement of comprehensive income for the year 2011
5
2011 2010
POSITION Note Life General Total Life General Total
HRK HRK HRK
HRK HRK HRK
INSURED EVENT EXPENSES,NET 6.1.
Liquidated claims 6.1. (329,935,998) (1,470,065,857) (1,800,001,855)
(230,501,346) (1,578,904,031) (1,809,405,377)
Change in claim provision 6.1. 6,167,438 66,370,388 72,537,826
572,342 29,198,177 29,770,519
Total insured event expenses, net
(323,768,560) (1,403,695,469) (1,727,464,029)
(229,929,004) (1,549,705,854) (1,779,634,858)
CHANGE IN OTHER TECHNICAL PROVISION, NET FROM REINSURANCE 6.2.
Change in mathematical insurance provision 6.2. (64,996,943) 0 (64,996,943)
(136,507,486) 0 (136,507,486)
Change in other technical provision, net from reinsurance 6.2. 0 (10,670,000) (10,670,000)
0 (13,847,225) (13,847,225) Total change in other technical provision, net from reinsurance
(64,996,943) (10,670,000) (75,666,943)
(136,507,486) (13,847,225) (150,354,711)
CHANGES IN SPECIAL LIFE INSURANCE PROVISION WHEN
POLICYHOLDER BEARS INVESTMENT RISK, NET FROM
REINSURANCE 6.3. Changes in life insurance technical provision when policyholders bears the risk 6.3. 4,700,768 0 4,700,768
1,918,336 0 1,918,336
Total changes in life insurance technical provision when policyholders bears the risk
4,700,768 0 4,700,768
1,918,336 0 1,918,336
COSTS FOR PREMIUM RETURN (BONUSES AND DISCOUNTS), NET FROM REINSUARNCE
Dependent from the result (bonuses)
0 (104,981) (104,981)
0 (390,424) (390,424)
Independent from the result (discounts)
0 (361,232) (361,232)
0 4,004,526 4,004,526 Total costs for premium returns (bonuses and discounts), net from reinsurance
0 (466,213) (466,213)
0 3,614,102 3,614,102
BUSINESS EXPENSES (OPERATING COSTS), NET 6.4.
Acquisition costs 6.4./i/ (35,290,163) (296,237,384) (331,527,547)
(40,406,269) (303,952,105) (344,358,374)
Management costs (administrative costs) 6.4./ii/ (73,593,614) (744,180,013) (817,773,627)
(73,474,404) (718,525,098) (791,999,502)
Total business expenses (operating costs), net (108,883,777) (1,040,417,397) (1,149,301,174) (113,880,673) (1,022,477,203) (1,136,357,876)

CROATIA OSIGURANJE d.d., Zagreb Consolidated statement of income / Consolidated statement of comprehensive income for the year 2011
6
2011 2010
POSITION Note Life General Total Life General Total
HRK HRK HRK
HRK HRK HRK
OTHER COSTS Other technical costs, net from reinsurance 6.6. (190,956) (84,668,049) (84,859,005)
(305,749) (82,178,583) (82,484,332)
Other costs, including value adjustments 6.7. (1,142,463) (168,881,499) (170,023,962)
(60,845) (210,100,988) (210,161,833)
Total other costs
(1,333,419) (253,549,548) (254,882,967)
(366,594) (292,279,571) (292,646,165)
PROFIT BEFORE TAXATION
9,676,408 148,600,604 158,277,012
8,288,558 110,761,063 119,049,621
Corporate income tax 7. (2,551,474) (46,033,081) (48,584,555)
(1,051,195) (29,699,442) (30,750,637)
PROFIT FOR THE CURRENT YEAR
7,124,934 102,567,523 109,692,457
7,237,363 81,061,621 88,298,984
Distribution of profit for the accounting period
To the company's shareholders
6,785,476 100,261,628 107,047,104
6,607,738 78,342,027 84,949,765
Minority interests
339,458 2,305,895 2,645,353
629,625 2,719,594 3,349,219

CROATIA OSIGURANJE d.d., Zagreb Consolidated statement of income / Consolidated statement of comprehensive income for the year 2011
7
2011 2010
POSITION Note Life General Total Life General Total
HRK HRK HRK
HRK HRK HRK
Gains/losses from revaluation of financial assets available for sale
(24,407,721) (41,830,581) (66,238,302)
16,309,458 62,123,524 78,432,982
Gains/losses from revaluation of operational land and buildings
0 2,394,773 2,394,773
0 2,112,091 2,112,091
Gains/losses arisen from recalculation of financial statements of doing foreign operations
64,842 64,842
0 148,199 148,199
Other comprehensive income
(24,407,721) (39,370,966) (63,778,687)
16,309,458 64,383,814 80,693,272
Profit for the current year
7,124,934 102,567,523 109,692,457
7,237,363 81,061,621 88,298,984
Total comprehensive income
(17,282,787) 63,196,557 45,913,770
23,546,821 145,445,435 168,992,256
Distribution of profit for the accounting period:
To the company's shareholder
Minority interests
(17,622,245) 54,587,152 36,964,907
22,917,196 141,927,305 164,844,501
339,458 8,609,405 8,948,863
629,625 3,518,130 4,147,755
The notes set out on pages I to V form an integral part of these consolidated financial statements.
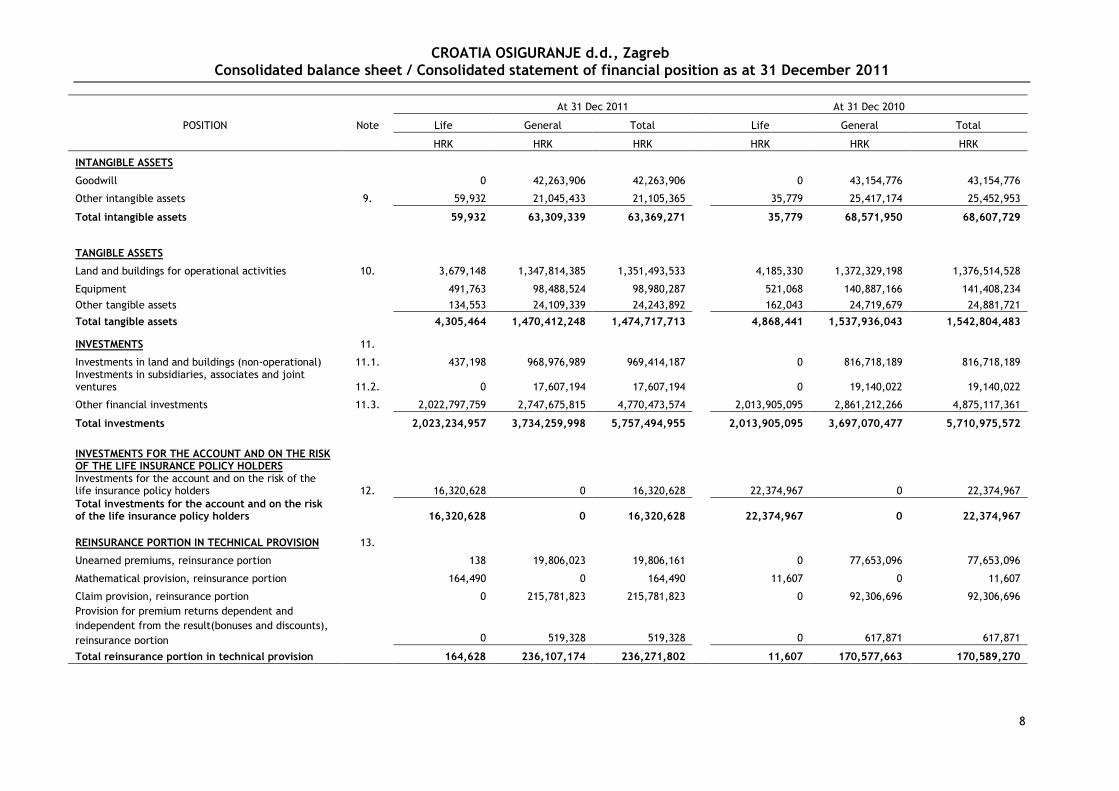
CROATIA OSIGURANJE d.d., Zagreb Consolidated balance sheet / Consolidated statement of financial position as at 31 December 2011
8
At 31 Dec 2011 At 31 Dec 2010
POSITION Note Life General Total Life General Total
HRK HRK HRK HRK HRK HRK
INTANGIBLE ASSETS Goodwill
0 42,263,906 42,263,906 0 43,154,776 43,154,776
Other intangible assets 9. 59,932 21,045,433 21,105,365 35,779 25,417,174 25,452,953
Total intangible assets
59,932 63,309,339 63,369,271 35,779 68,571,950 68,607,729
TANGIBLE ASSETS
Land and buildings for operational activities 10. 3,679,148 1,347,814,385 1,351,493,533 4,185,330 1,372,329,198 1,376,514,528
Equipment
491,763 98,488,524 98,980,287 521,068 140,887,166 141,408,234
Other tangible assets
134,553 24,109,339 24,243,892 162,043 24,719,679 24,881,721
Total tangible assets
4,305,464 1,470,412,248 1,474,717,713 4,868,441 1,537,936,043 1,542,804,483
INVESTMENTS 11. Investments in land and buildings (non-operational) 11.1. 437,198 968,976,989 969,414,187 0 816,718,189 816,718,189
Investments in subsidiaries, associates and joint ventures 11.2. 0 17,607,194 17,607,194 0 19,140,022 19,140,022
Other financial investments 11.3. 2,022,797,759 2,747,675,815 4,770,473,574 2,013,905,095 2,861,212,266 4,875,117,361
Total investments
2,023,234,957 3,734,259,998 5,757,494,955 2,013,905,095 3,697,070,477 5,710,975,572
INVESTMENTS FOR THE ACCOUNT AND ON THE RISK OF THE LIFE INSURANCE POLICY HOLDERS
Investments for the account and on the risk of the life insurance policy holders 12. 16,320,628 0 16,320,628 22,374,967 0 22,374,967 Total investments for the account and on the risk of the life insurance policy holders
16,320,628 0 16,320,628 22,374,967 0 22,374,967
REINSURANCE PORTION IN TECHNICAL PROVISION 13. Unearned premiums, reinsurance portion
138 19,806,023 19,806,161 0 77,653,096 77,653,096
Mathematical provision, reinsurance portion
164,490 0 164,490 11,607 0 11,607
Claim provision, reinsurance portion
0 215,781,823 215,781,823 0 92,306,696 92,306,696 Provision for premium returns dependent and independent from the result(bonuses and discounts), reinsurance portion 0 519,328 519,328 0 617,871 617,871
Total reinsurance portion in technical provision
164,628 236,107,174 236,271,802 11,607 170,577,663 170,589,270

CROATIA OSIGURANJE d.d., Zagreb Consolidated balance sheet / Consolidated statement of financial position as at 31 December 2011
9
At 31 Dec 2011 At 31 Dec 2010
POSITION
Life General Total Life General Total
HRK HRK HRK HRK HRK HRK
DEFFERED AND CURRENT TAX ASSETS 14.
Deferred and current tax assets
2,451,330 3,588,575 6,039,905
3,365,941 8,089,287 11,455,228
Total deferred and current tax assets
2,451,330 3,588,575 6,039,905
3,365,941 8,089,287 11,455,228
RECEIVABLES 15.
Receivables from direct insurance activities 15.1. 162,077 681,383,908 681,545,985
41,306,800 689,902,212 731,209,012 Receivables from coinsurance and reinsurance activities 15.2. 0 61,234,875 61,234,875
0 29,146,633 29,146,633
Total other receivables 15.3. 10,130,650 272,984,041 283,114,691
6,273,128 339,314,011 345,587,139
Total receivables
10,292,727 1,015,602,824 1,025,895,551
47,579,928 1,058,362,856 1,105,942,784
OTHER ASSETS 16.
Cash on account and in hand 16.1. 6,052,921 75,750,040 81,802,961
7,387,138 58,049,719 65,436,857
Other 16.2. 83,125,165 225,775,479 308,900,644
70,093,522 168,398,307 238,491,829
Total other assets
89,178,086 301,525,519 390,703,605
77,480,660 226,448,026 303,928,686
PREPAYMENTS AND ACCRUED INCOME (UNDUE)
Prepayments and accrued income (undue) 17. 22,259,902 59,037,497 81,297,399
18,055,826 49,340,792 67,396,618
Total prepayments and accrued income (undue)
22,259,902 59,037,497 81,297,399
18,055,826 49,340,792 67,396,618
TOTAL ASSETS 2,168,267,654 6,883,843,174 9,052,110,828
2,187,678,244 6,816,397,094 9,004,075,338
OFF-BALANCE SHEET RECORDS 0 734,133,072 734,133,072
0 704,570,820 704,570,820

CROATIA OSIGURANJE d.d., Zagreb Consolidated balance sheet / Consolidated statement of financial position as at 31 December 2011
10
At 31 Dec 2011 At 31 Dec 2010
POSITION
Life General Total Life General Total
HRK HRK HRK HRK HRK HRK
CAPITAL AND RESERVES 18.
Subscribed capital 18.1. 44,288,720 398,598,480 442,887,200
44,288,720 398,598,480 442,887,200
Revaluation reserves 18.2. (15,718,730) 512,712,439 496,993,709
8,753,985 552,018,410 560,772,395
Reserves 18.3. 78,314,936 378,151,843 456,466,779
77,013,268 366,917,393 443,930,661
Carried forward (retained) profit or loss 18.4. 7,517,827 448,141,312 455,659,139
5,033,861 397,721,058 402,754,919
Profit for the current year 18.5. 6,785,475 100,261,629 107,047,104
6,607,738 78,342,027 84,949,765
Total capital and reserves
121,188,228 1,837,865,703 1,959,053,931
141,697,572 1,793,597,368 1,935,294,940
MINORITY INTEREST Minority interest
7,791,231 67,654,463 75,445,694
9,606,916 58,991,088 68,598,004
7,791,231 67,654,463 75,445,694
9,606,916 58,991,088 68,598,004
TECHNICAL RESERVES 19. Unearned gross premiums
3,929,192 1,114,848,550 1,118,777,742
3,986,675 1,173,196,945 1,177,183,620
Gross mathematical insurance provision
1,945,987,781 0 1,945,987,781
1,877,152,130 0 1,877,152,130
Gross claim provision
36,769,501 3,133,643,783 3,170,413,284
42,921,772 3,074,104,217 3,117,025,989 Provision for premium returns dependent and independent from the result(bonuses and discounts), gross amount
0 5,812,976 5,812,976
0 5,977,339 5,977,339
Other gross insurance-technical provision
0 66,427,000 66,427,000
0 55,757,000 55,757,000
Total technical provision
1,986,686,474 4,320,732,309 6,307,418,783
1,924,060,577 4,309,035,501 6,233,096,078 TECHNICAL LIFE INSURANCE PROVISION WHEN THE INSURER BEARS THE RISK
Technical life insurance provision when the insurer bears the risk 20. 16,320,627 0 16,320,627
22,374,967 0 22,374,967
Total technical life insurance provision when the insurer bears the risk
16,320,627 0 16,320,627
22,374,967 0 22,374,967
OTHER RESERVES Other reserves 21. 2,557,348 87,913,892 90,471,240
2,647,001 85,216,786 87,863,787
Total other reserves
2,557,348 87,913,892 90,471,240
2,647,001 85,216,786 87,863,787
DEFERRED AND CURRENT TAX LIABILITIES Deferred and current tax liabilities 22. 55,052 134,844,757 134,899,809
0 129,438,670 129,438,670
Total deferred and current tax liabilities
55,052 134,844,757 134,899,809
0 129,438,670 129,438,670

CROATIA OSIGURANJE d.d., Zagreb Consolidated balance sheet / Consolidated statement of financial position as at 31 December 2011
11
At 31 Dec 2011 At 31 Dec 2010
POSITION
Life General Total Life General Total
HRK HRK HRK HRK HRK HRK
FINANCIAL LIABILITIES 23.
Financial liabilities
100,067 88,400,064 88,500,131
144,963 161,061,631 161,206,594
Total financial liabilities
100,067 88,400,064 88,500,131
144,963 161,061,631 161,206,594
OTHER LIABILITIES 24.
Liabilities from direct insurance activities
2,025,459 110,716,980 112,742,439
974,033 109,025,151 109,999,184 Liabilities from coinsurance and reinsurance activities
1,693 67,958,283 67,959,976
1,665 38,334,150 38,335,815
Other liabilities
31,363,056 126,378,871 157,741,927
44,038,033 111,096,931 155,134,964
Total other liabilities
33,390,208 305,054,134 338,444,342
45,013,731 258,456,232 303,469,963
ACCRUED EXPENSES AND DEFERRED INCOME
Accrued expenses and deferred income 25. 178,417 41,377,854 41,556,271
42,132,517 20,599,818 62,732,335
Total accrued expenses and deferred income
178,417 41,377,854 41,556,271
42,132,517 20,599,818 62,732,335
TOTAL CAPITAL AND LIABILITIES
2,168,267,652 6,883,843,176 9,052,110,828
2,187,678,244 6,816,397,094 9,004,075,338
OFF-BALANCE SHEET RECORDS 26. 0 734,133,072 734,133,072
0 704,570,820 704,570,820
The notes set out on pages I to V form an integral part of these consolidated financial statements.

CROATIA OSIGURANJE d.d., Zagreb Consolidated statement of changes in equity in 2011
12
The notes set out on pages I to V form an integral part of these consolidated financial statements.
Description
Distributable to the parent company owners Distributable to
uncontrolled interest
Total capital and reserve Paid-in capital
Revaluation reserve
Reserves (legal,
statutory, others)
Retained earnings
Profit of the current
year
Total capital and reserve
Balance at 31 December 2009 442,887,200 492,570,679 423,894,650 274,246,101 152,504,002 1,786,102,634 62,855,107 1,848,957,741
Change in accounting policy 0 0 0 906,944 0 906,944 1,746,368 2,653,312
Correction of previous period errors 0 (7,526,061) (6,134,196) 0 (13,660,257) 835,504 (12,824,753)
Balance at 1 January 2010 (corrected) 442,887,200 485,044,618 423,894,652 269,018,849 152,504,002 1,773,349,321 65,436,979 1,838,786,300
Payment of share in profit /dividends 0 0 (2,898,883) (2,898,883) (986,729) (3,885,612)
Other transactions with owners 0 0 20,036,009 129,569,110 (149,605,119) 0 0 0
Unrealized gains from tangible assets 0 (3,244,589) 0 5,356,680 0 2,112,091 0 2,112,091
Unrealized gains / losses from assets available for sale 0 (7,746,521) 0 0 0 (7,746,521) 245,624 (7,500,897)
Realized gains / losses from assets available for sale 0 85,933,879 0 0 0 85,933,879 0 85,933,879
Other non-ownership changes in capital 0 785,008 (1,189,720) 0 (404,712) 552,911 148,199
Profit for the current period 0 0 0 0 84,949,765 84,949,765 3,349,219 88,298,984
Balance at 31 December 2010 442,887,200 560,772,395 443,930,661 402,754,919 84,949,765 1,935,294,940 68,598,004 2,003,892,944
Correction of previous period errors 0 74,365 0 (39,843) 0 34,523 0 34,523
Balance at 1 January 2011 (corrected) 442,887,200 560,846,760 443,930,661 402,715,076 84,949,765 1,935,329,462 68,598,004 2,003,927,466
Payment of share in profit /dividends 0 0 0 0 (28,663,820) (28,663,820) (2,101,173) (30,764,993)
Other transactions with owners 0 0 12,536,118 43,749,827 (56,285,945) 0 0 0
Unrealized gains from tangible assets 0 2,320,408 0 6,835,588 0 9,155,996 8,144,811 17,300,807
Unrealized gains / losses from assets available for sale 0 (48,173,323) 0 0 0 (48,173,323) (1,494,807) (49,668,130)
Realized gains / losses from assets available for sale 0 (18,064,979) 0 0 0 (18,064,979) 0 (18,064,979)
Other non-ownership changes in capital 0 64,843 0 2,358,648 0 2,423,491 (346,494) 2,076,997
Profit for the current period 0 0 0 0 107,047,104 107,047,104 2,645,353 109,692,457
Balance at 31 December 2011 442,887,200 496,993,709 456,466,779 455,659,139 107,047,104 1,959,053,931 75,445,694 2,034,499,625

CROATIA OSIGURANJE d.d., Zagreb Consolidated statement of cash flows for 2011 – indirect method
13
POSITION 2011 2010
HRK HRK
Cash flows from operating activities
Profit/loss before taxation 158,277,012
119,049,621
Depreciation of property and equipment 78,610,696
92,593,942
Depreciation of intangible assets 6,452,213
5,466,381
Impairments and gains/losses from adjustment to fair value 56,114,022
83,072,151
Interest costs 482
0
Interest income (229,499,066)
7,100,560
losses from sale of tangible assets (including land and buildings) 0
(16,754)
Share in the result of associated companies (34,558,009)
0
Gains/Losses from sale of tangible assets 10,899,507
0
Other adjustments (118,291,400)
(23,201,194)
Cash flows before changes in operating assets and liabilities (71,994,543)
284,064,707
Decrease in investments available for sale 180,407,596
50,800,526
Increase in investments at fair value through P&L Account (126,638,762)
(117,423,599)
Decrease in deposits, loans and receivables 239,387,663 15,148,840
Decrease / increase in investments for the account and on the risk of the life insurance policy holders 6,054,340 (47,302)
Increase in reinsurance portion in technical reserves (65,682,532)
(19,556,515)
Decrease / increase in tax assets 5,415,323
(5,298,967)
Decrease in receivables 271,894,249
204,840,393
Decrease in other assets 0
3,274,980
Increase in prepayments and accrued income (13,900,781)
(19,580,536)
Increase in technical provision 74,322,706
52,266,070 Decrease / increase in life insurance technical provision in the case when insurer bears investment risk (6,054,340)
47,302
Increase / decrease in tax liabilities 5,461,139
(15,770,859)
Decrease in financial liabilities (72,706,459)
(71,162,828)
Increase / decrease in other liabilities 37,581,832
(50,142,167)
Decrease in accrued expenses and deferred income (21,176,070)
(44,550,308)
Increase / decrease in operating assets and liabilities 514,365,904
(17,154,970)
Paid corporate income tax (45,860,486)
(54,337,240)
Net cash flows from operating activities 396,510,875
212,572,497
Cash flows from investment activities
Receipts from sale of tangible assets 19,955,263
9,222,035
Expenditures for acquisition of tangible assets (34,193,150)
(69,267,621)
Receipts for acquisition of intangible assets 0
237,804
Expenditures for acquisition of intangible assets (2,027,176)
(8,903,911)
Receipts from sale of non-operational land and buildings 0
433,119
Expenditures for acquisition of non-operational land and buildings (81,376,244)
(11,820,494)
Decrease/increase in investments in subsidiaries, associates and joint ventures 40,116,167
13,688,777
Receipts from investments held to maturity 109,012,553
80,271,090
Expenditures for investments held to maturity (299,092,603)
(188,366,596)
Receipts from sale of securities and shares 1,314,422
0
Expenditures for investments in securities and shares (1,288,898)
(8,086,626)
Receipts from dividends and shares in profit 2,787,773
1,982,736
Receipts on the basis of repayments of given short term and long term loans 323,751,179
6,271,979
Expenditures for the given short term and long term loans (320,824,217)
(3,939,423)
Net cash flows from investment activities (241,864,931)
(178,277,131)

CROATIA OSIGURANJE d.d., Zagreb Consolidated statement of cash flows for 2011 – indirect method
14
POSITION 2011 2010
HRK HRK
Cash flows from financial activities
Receipts from received short term and long term loans 31,596 203,347
Expenditures for the repayment of received short term and long term loans (1,026,315) (96,843,597)
Expenditures for payments of shares in profit (dividends) (33,844,798) (2,898,883)
Net cash flows from financial activities (34,839,517) (99,539,133)
NET CASH FLOWS 119,806,427 (65,243,767)
CASH EFFECTS FROM CHANGES IN FOREIGN EXCHANGE RATES (33,031,508) 812,500
NET DECREASE IN CASH AND CASH EQUIVALENTS 86,774,919 (64,431,267)
Cash and cash equivalents at the beginning of the period 303,928,686 368,359,953
Cash and cash equivalents at the end of the period 390,703,605 303,928,686
NET DECREASE IN CASH AND CASH EQUIVALENTS 86,774,919 (64,431,267)
The notes set out on pages I to V form an integral part of these consolidated financial statements.

CROATIA OSIGURANJE d.d., Zagreb Notes to the consolidated financial statements
for the year ended 31 December 2011
15
l GENERAL 1.1. Legal framework, activity and employees Croatia osiguranje d.d., Zagreb, Miramarska 22 (hereinafter: „Company“) is the Parent company of the Group Croatia osiguranje and is registered at the Commercial court register in Zagreb under subject registration number: 080051022 and personal identification number 26187994862. The Group's principal activity is life and general insurances. The Group CROATIA OSIGURANJE includes the Parent company and subsidiaries as follows: Subsidiary Activity State
Croatia Lloyd d.d., Zagreb Reinsurance Croatia
- Croatia mirovni dom d.o.o., Zagreb Construction Croatia
- Plančić d.o.o., Vrbanj Viticulture Croatia
Croatia Leasing d.o.o., Zagreb Leasing Croatia
Croatia-Tehnički pregledi d.o.o., Zagreb MOT tests Croatia
- STP Pitomača, Pitomača MOT tests Croatia
Herz d.d., Požega MOT tests Croatia
Croatia osiguranje mirovinsko društvo d.o.o., Zagreb Pension fund amangement Croatia
Croatia zdravstveno osiguranje d.d., Zagreb Insurance Croatia
- Poliklinika Ars Medica, Pula Health Services Croatia
- Poliklinika Croatia zdravstveno osiguranje, Zagreb Health Services Croatia
PBZ Croatia osiguranje d.d., Zagreb Pension fund amangement Croatia
Slavonijatrans-Tehnički pregledi d.o.o., Sl. Brod MOT tests Croatia
Croatia Sigurimi sh.a., Prishtinë Insurance Kosovë
Milenijum osiguranje a.d., Beograd Insurance Serbia
Croatia osiguranje d.d., Ljubuški Insurance Bosnia and Herzegovina
- Crotehna d.o.o., Ljubuški MOT tests Bosnia and Herzegovina
- Croatia remont d.d., Čapljina MOT tests Bosnia and Herzegovina
- Croauto d.o.o., Mostar MOT tests Bosnia and Herzegovina
- Croatia Vitez d.o.o., Vitez MOT tests Bosnia and Herzegovina
- Hotel Hum d.o.o. , Ljubuški Hotel and catering services Bosnia and Herzegovina
- Ponte d.o.o., Mostar Insurance repersentation Bosnia and Herzegovina
Croatia osiguranje a.d., društvo za
osiguranje života, Skopje Insurance Macedonia
Croatia osiguranje a.d. društvo za
osiguranje neživota, Skopje Insurance Macedonia
As at 31 December 2011 the Group employed 3,795 employees (At 31 December 2010: 3,827 employees).
Professional qualification 31 Dec 2011 31 Dec 2010
Doctor, Master degree 86 51
University degree 1,168 1,136
Higher education 565 506
High school degree 1,888 2,028
Primary school 88 106
Total 3,795 3,827

CROATIA OSIGURANJE d.d., Zagreb Notes to the consolidated financial statements
for the year ended 31 December 2011
16
1.2. Stock capital
The stock capital of the Company amounts to HRK 442,887,200.00, and is divided into 316,348 shares with the individual nominal value of HRK 1,400.00. All shares are initial public offering shares and are marked as follows:
• 307,598 shares are ordinary shares marked as CROS-R-A • 8,750 shares are preferred shares marked as CROS-P-A.
Each share, ordinary and preferred, relate to 1 (one) vote at the General Assembly. All shares are entirely paid, issued in non-material form, are free for transfer and are recorded in depository of the Central Depository and Clearing Company d.d.
Since 2004, Company's shares are quoted in first quotation of the Zagreb Stock exchange d.d., and from then started trading with the Company's shares as the first stock company in the Republic of Croatia in majority State ownership.
1.3. Company Bodies The governing bodies of the Company are General Assembly, Supervisory Board and Management Board.
Supervisory Board to 10 February 2011 Ivan Šuker President of the Supervisory Board Prof.D.Sc. Andrija Hebrang Vice president of the Supervisory Board Miroslav Hrašćanec Member of the Supervisory Board Miljenko Boban Member of the Supervisory Board D.Sc. Gzim Redžepi Member of the Supervisory Board M. Sc. Stjepan Kožić
Member of the Supervisory Board
Supervisory Board from 10 February 2011 Nikola Mijatović President of the Supervisory Board Nataša Duspara Vice president of the Supervisory Board Josip Zaher Member of the Supervisory Board Ante Obuljen Member of the Supervisory Board Dr. Gzim Redžepi Member of the Supervisory Board Miroslav Hrašćanec
Member of the Supervisory Board
Management Board
Zdravko Zrinušić President of the Management Board Silvana Ivančić Member of the Management Board
The amount of compensation to members of the Management and the Supervisory Board of the Company is stated in Note 27 to the financial statements.

CROATIA OSIGURANJE d.d., Zagreb Notes to the consolidated financial statements
for the year ended 31 December 2011
17
II BASIS FOR PREPARATION OF THE FINANCIAL STATEMENTS 2.1. Statement of adjustment and basis of presentation
Consolidated financial statements of the Company for 2011 are prepared in accordance with the Accounting Law (National gazette 109/07) and the International Financial Reporting Standards (‘’IFRS’’) (National gazette No 136/09, 8/10, 18/10, 27/10, 65/10, 120/10, 58/11, 140/11) issued by the Committee for Financial Reporting Standards nominated by Government of the Republic of Croatia, and in accordance with the Regulation on the structure and content of the financial statements for insurance and reinsurance companies (National gazette No 132/10).
Consolidated financial statements have been prepared by the application of basic accounting presumption of the business event inception upon which the effects of operations are recognized when arisen and are shown in the consolidated financial statements for the period to which they relate and with the basic accounting assumption that going concern concept is applied.
2.2. Basis of consolidation
The consolidated financial statements incorporate the financial statements of the Company and the financial statements of enterprises controlled by the Company (its subsidiaries). Control is achieved where the Company has the power to govern the financial and operating policies of an investee enterprise so as to obtain benefits from its activities.
All significant intercompany transactions and balances between Group’s enterprises are eliminated on consolidation.
2.3. Key estimates and uncertainty of estimates
Certain estimates are used during preparation of the consolidated financial statements which have inflow to the statement of property and liabilities of the Group, income and expenses of the Group and the disclosure of potential liabilities of the Group.
Future events and their inflows could not be predicted with certainty and, following to this, the real results may differ from the estimated. Estimates utilized during preparation of the consolidated financial statements are subject to changes by the occurrence of new events, by gathering of additional experience, obtaining of additional information and comprehensions and by a change of environment in which the Group operates.
Key estimates used by the application of accounting policies during preparation of the consolidated financial statements relate to depreciation count of long-term intangible and tangible property, value decrease of property, value provision of receivables and provisions and the disclosure of potential liabilities.
2.4. Reporting currency
The consolidated financial statements of the Company are prepared in Croatian kuna as a measuring and reporting currency of the Company. The exchange rate applied at 31 December 2011 was EUR 1 = HRK 7.530420 (At 31 December 2010: EUR 1 = HRK 7.385173).

CROATIA OSIGURANJE d.d., Zagreb Notes to the consolidated financial statements
for the year ended 31 December 2011
18
III SUMMARY OF ACCOUNTING POLICIES
Summary of accounting policies applied for preparation of the consolidated financial statements is set below. Policies are consistently applied to all the years presented, unless otherwise indicated.
3.1. Operating segments
Operating segments are reported in a manner consistent with the internal reporting provided to the chief operating decision-maker. The chief operating decision-maker, who is responsible for allocating resources and assessing performance of the operating segments, has been identified as the Management Board that makes strategic decisions. As at 31 December 2011 Management Board consist: Zdravko Zrinušić – president, and Silvana Ivančić – member. 3.2. Foreign currency
Transactions in foreign currencies are translated into HRK (Croatian Kuna) at the exchange rate ruling at the date of the transaction. Croatian Kuna is the currency of the Company and therefore consolidated financial statements are presented in that currency.
Monetary assets and liabilities denominated in foreign currencies at the balance sheet date are translated to HRK at the foreign exchange rate ruling at that date. All differences are taken to the income statement with the exception of all monetary items that provide an effective hedge for a net investment in a foreign operation. These are recognised in other comprehensive income until the disposal of the net investment, at which time they are recognised in the statement of comprehensive income. Tax charges and credits attributable to exchange differences on those monetary items are also recorded in equity.
Non-monetary items carried at fair value that are denominated in foreign currencies are retranslated at the rates prevailing at the date when the fair value was determined. Non-monetary items that are measured in terms of historical cost in a foreign currency are translated using the exchange rates as at the dates of the initial transactions.
Foreign exchange differences arising from translation of net assets at the initial start rate and the results of international activities at the real exchange rate are recognized in other comprehensive profit and accumulated in the foreign exchange reserves. 3.3. Written gross premiums
/i/ Written gross premiums represent main operating income and consist written general and life insurance premiums.
/ii/ Written gross general insurance premiums include all premium amounts, agreed (written) in current accounting period, on the period of most one year, irrespective if those amount relate in full or partially on the afterward accounting period.
/iii/ Written gross life insurance premiums include all premium amounts collected by the end of the accounting period.

CROATIA OSIGURANJE d.d., Zagreb Notes to the consolidated financial statements
for the year ended 31 December 2011
19
3.4. Investment income and expenses
/i/ Investment income includes income realized from the participating interests (dividends, profit shares, book entries - value increase), income from investments in land and buildings, income from interest, unrealized gains from investments at fair value through the profit and loss account, gains from sale of investment (realization), net foreign exchange gains and other income from investments.
Income from investments in land and buildings consists of income from increase in value of land and buildings, income from sale of land and buildings, rental income and other income related to investments in land and buildings. Income from rent of land and buildings and other operative leases is recognized in the income statement by the linear method during the whole period of lease.
Interest income is recognized in the income statement when accrued, taking into consideration the effective return on adequate assets. Interest on monetary assets at fair value through the profit and loss is calculated at the voucher interest rate and is presented within interest income. Income from dividends is recognized in the income statement at the date when dividends are voted. The accounting policy related to the recognition of financial income is described in Note 3.9 “Financial assets”.
/ii/ Investment costs include interest expenses, expenses for adjustment (decrease) of investment value, losses from sale of investments (realization), net foreign exchange losses and other investment expenses. 3.5. Insured events costs
Insured events costs include all liquidated claim amounts in the accounting period, regardless in which period the claims occurred, less reinsurance portion in claims, collected recourse claims, sold and saved parts, increased by claim reserves at the end of the accounting period and decreased by claim reserves at the beginning of the accounting period.
Gross liquidated claim amounts, except net liquidated claims, including expenses related to the claim liquidation (evaluations, lawyer services and similar), repurchases and expenses under recourse claims, and decreased for collected recourse claims, and sold and saved parts. 3.6. Operating costs
Operating expenditures include costs of acquisition of insurance policies and management costs. Acquisition costs include all direct costs resulting from the conclusion of insurance contracts such as costs of agents, commissions and promotion.
Commission costs are recognized as they arise pursuant to the principle of the accounting period. Management costs include expenses resulting from the collection of insurance premiums, portfolio management, expenses for employees and other tangible and intangible costs.

CROATIA OSIGURANJE d.d., Zagreb Notes to the consolidated financial statements
for the year ended 31 December 2011
20
3.7. Intangible and tangible assets and property investments
Long-term intangible and tangible assets are initially reported under the acquisition costs that include the purchase price, including import fees and non-refundable taxes after deduction of commercial discounts and rebates as well as all other costs that can be directly attributed to the setting of assets in the place and working condition for the intended use.
Long-term intangible and tangible assets are recognized if it is likely that future economic benefits that can be attributed to the assets will inflow to the Group, if the costs can be reliably determined, and if individual purchase value of the assets doesn't exceed HRK 3,500.
After the initial recognition the assets are stated at cost reduced by the accumulated depreciation and accumulated impairment losses.
After the initial recognition land and buildings are stated at revaluated amount consisting of its fair value at the date of revaluation reduced by subsequently accumulated depreciation and accumulated impairment losses. The increase in the value of assets due to the revaluation is credited directly to the capital as revaluation reserve. The revaluation is performed regularly in a way that the carrying amount does not differ significantly from the one that would come out by determination of fair value at the balance sheet date.
Costs of current maintenance and repairs, replacement and investment maintenance in a small scope are recognized as the expenditures of the period in which they occur. In situations where it is clear that the costs resulted in the increase of future expected economic benefits that should be realized through the use of assets, above their originally assessed capabilities, they are capitalized i.e. they are included in the carrying value of that asset. Gains and losses from disposal or sale of assets are stated in the income statement in the period in which they occur.
Depreciation of assets begins when the assets are ready for use i.e. when they are in the place and in a condition necessary for use. Depreciation of assets ends upon its classification as assets available for sale. Depreciation is calculated by deducting purchase value of each individual asset, except land and long-term tangible and intangible assets under construction, on a straight-line basis over the estimated useful life of the assets by the following rates:
Description Depreciation rate
(from – to %)
Concessions, patents, licences, software, etc. 25
Other intangible assets 25
Buildings 2.5
Furniture and equipment 10 – 25
Computer equipment 33.33
Transport vehicles 20

CROATIA OSIGURANJE d.d., Zagreb Notes to the consolidated financial statements
for the year ended 31 December 2011
21
Investments in non-operational properties (land, buildings) owned by the Group or under financial lease are kept in order for the Group to gain income from the lease or/and due to increase of market value of the assets, and they are stated at fair value through profit and loss account or at acquisition cost.
3.8. Investments in associated companies
Associated companies are companies in which the Company has a significant influence but not a control over adoption and execution of financial and business policies.
Investments in associated companies are set out by the cost method. 3.9. Financial assets
/i/ Financial assets at fair value through profit and loss account
Financial instruments included in this portfolio are financial instruments kept for trade, and they were bought for the purpose of gaining profit from the short-term price fluctuations or broker’s commission or the securities are included in the portfolio in which there is a pattern for the realization of short-term profit.
In consistence with the investment policy of the Group each financial instrument may be classified as assets set out at fair value through the profit and loss account, with the exception of investments in equity instruments that do not have a listed price on an active market and whose fair value cannot be reliably measured.
These instruments are initially set out under procurement costs, and later on they are measured again at fair value that is based on listed purchase prices on active market.
All related realized and unrealized profits and losses are included in investment income / costs. Earned interest that accrued while these instruments were kept is set out as interest income.
All purchases and sales of instruments being kept for trade are recognized at the date the trade was made, and that is the date when the Group undertakes to buy or sell assets.
Transactions not being recognized at the date the trade was made are accounted as financial derivatives. /ii/ Loans and receivables
Loans and receivables are non-derivative financial assets with fixed or determinable payments not listed on active market. Loans and receivables arise when the Group grants financial means without the intention of trading with these receivables, and they include loans to the insured and deposits at banks.
Granted loans and receivables created by the Group are recognized at the moment of transfer of means on the part of the Group.
Loans and receivables are set out reduced by provisions for impairment losses. Provisions for the impairment losses are determined if there is an objective evidence that the Group will not be able to collect all receivables upon maturity date. Provisions for identified losses are estimated on the basis of the loan capacity and business results of debtor, taking into consideration the value of the collateral.

CROATIA OSIGURANJE d.d., Zagreb Notes to the consolidated financial statements
for the year ended 31 December 2011
22
The loan is written off at the moment of understanding that it is not possible to collect the loan anymore and that all legal possibilities for collection are exhausted and that the amount of total loss is determined. If the amount of the value decrease is subsequently diminished and the diminution is objectively related to an event that occurred after the value decrease, then the value decrease or provisions are diminished through the profit and loss account.
In an event of default payment the Group charges debtors for default interest that is computed on the accounting basis and set out as income from interest.
/iii/ Financial assets available for sale
Financial assets available for sale are those non-derivative financial assets that are defined as available for sale or those not classified either as assets at fair value through the profit and loss account or as loans and receivables.
Financial instruments included in the assets available for sale consist of debt and equity securities. These instruments are initially recognized according to the investment expenses, and after the initial recognition they are set out at fair value based on listed prices and amounts derived from the models of cash flows. In cases when listed market prices are not available, fair value of debt securities is estimated by applying current value of future financial flows, and fair value of unlisted equity instruments is estimated by applying a correspondent ratio of price and earnings or price and cash flow cleared in a way that it reflects specific circumstances connected with the issuer.
Profit and loss arising from change in fair value of financial assets available for sale are recognized directly in the capital as revaluation provision, and are set out in the report on changes in capital up to the moment of sale when cumulative profits and losses previously recognized in the capital are included in the profit and loss account of the period.
The interest earned in the period of possession of securities available for sale is calculated daily and set out as income from interest.
Foreign exchange rate differences under equity instruments in foreign means of payment classified as available for sale are set out in the capital, together with the profits and losses from change in fair value up to the moment of sale of instrument. Foreign exchange rate differences under debt instruments in foreign means of payment classified as available for sale are set out in the profit and loss account.
Dividends under securities classified as available for sale are booked when notified.
/iv/ Investments held to maturity
Investments held to maturity are non-derivative financial assets with fixed payment amounts or payments that can be determined, and with fixed maturity dates, which the Group intends and is able to keep till maturity. Treasury bills and debt securities are included in them, too. Investments held to maturity are set out at amortized costs by applying the method of effective interest rate decreased by a potential impairment loss.

CROATIA OSIGURANJE d.d., Zagreb Notes to the consolidated financial statements
for the year ended 31 December 2011
23
The Group checks regularly if there are objective evidences pointing to an impairment of investments held to maturity. The value of a financial means is diminished if its book amount exceeds the estimated recoverable amount that equals the current value of expected future cash flows discounted by the application of the original effective interest rate for that instrument. The amount of impairment loss of certain means, set out at amortized costs, is calculated as a difference between the book value of that means and the current value of expected future cash flows discounted by the application of the original effective interest rate for that instrument. When it is established that a decrease in means arose, the Group recognizes impairment loss by debiting profit and loss account. 3.10. Receivables
/i/ Receivables from insurance activities include receivables from the insured under the general and life insurance premium.
Receivables under the general insurance premium include receivables for written but non-invoiced premium as well as receivables for invoiced but uncollected premium.
The recognition of the insurance premium is described in Note 3.3. - "Gross written premiums".
/ii/ Receivables for invoiced but uncollected premium are reported at nominal value, and for doubtful and uncollectable claims impairment is determined. The value adjustment as a decrease in receivables for premium is set out for all uncollected receivables whose maturity period expired 180 days earlier. The impairment can be decreased by those receivables under which a liability for the claim indemnification to the debtor (claim provision) was established.
/iii/ Receivables under the right to recourse are recognized for all recourse cases from out-of-court procedure resulting from receivables from the other insurance company and recourses for which a financial settlement was reached. The value adjustment of recourse receivables is defined for all receivables not collected within the period of 180 days. The established value adjustment may be decreased for those recourse receivables upon which collection is certain.
/iv/ Other receivables refer to the receivables for interest on loans and deposits, prepayment receivables, receivables for received payment instruments and the like. 3.11. Impairment losses
At each balance sheet date the Group checks the book values of its assets in order to establish whether there are any indications of the occurrence of losses due to impairment in the value of assets. If such indications are present, the recoverable amount of assets is estimated so that a possible loss due to impairment might be established. If the recoverable amount of some assets is estimated at a value that is lower than the book value, then the book value of these assets is reduced to the recoverable amount. 3.12. Cash and cash equivalents and short-term deposits
For the cash flow reporting purposes, cash cash equivalents flow include implicitly cash at bank and in hand as well as received cheques and bills of exchange. Deposits with the maturity period under one year imply short-term deposits. Cash equivalents and deposits are set out at cost price, and those set out in foreign currencies are converted at the medium exchange rate of the Croatian National Bank at the end of the year.

CROATIA OSIGURANJE d.d., Zagreb Notes to the consolidated financial statements
for the year ended 31 December 2011
24
3.13. Corporate income tax
Corporate income tax consists of current and deferred tax. Current tax represents the expected tax liability calculated on the profit for the year and adjusted by the amounts not included in the tax basis or tax non-deductible expenditures, using tax rates that were in force on the report date.
Deferred taxes are recognized by the balance method, reflecting temporary differences between the book value of assets and liabilities for want of financial reports and amounts used for tax calculation. Deferred tax is not recognized in case of investments in subsidiaries if it is not to be refunded in the foreseeable future. Deferred tax is calculated by applying tax rates that are expected to be applied to temporary differences when they are refunded or settled on the basis of the regulations that were in force or were essentially valid at the balance sheet date. Deferred tax assets are recognized up to the amount for which the future taxable profit will probably be sufficient for the use of temporary differences. Deferred tax assets are examined at each reporting date and they are diminished if the realization of the related tax benefit is not likely any more. Deferred tax assets and liabilities are not discounted and they are set out as long-term assets and/or long-term liabilities. 3.14. Capital and reserves
In its business ledgers the Group reports the capital divided into: subscribed capital, revaluation reserves, statutory reserves, legal reserves, other reserves, retained earnings and profit for the year.
/i/ Subscribed capital represents an inseparable share capital of the Parent company paid in full.
/ii/ The effect of an increase/decrease in the value of investments classified as investments available for sale and real estate used for insurance activities, as a result of adjustment to the estimated market value is presented by the Group in the balance sheet as the revaluation reserve. During the period, the revaluation reserves are increased / decreased due to the value adjustment to the recoverable market value.
/iii/ Allocations for statutory reserves, legal reserves, other reserves and retained earnings were determined by the decisions of the General Assembly of the Company and subsidiary companies.
/iv/ Current financial year profit is reported with the balance as of 31 December and transferred into the next financial year. The use, i.e., the distribution of profit is determined by the decision of the General Assembly of the Company.

CROATIA OSIGURANJE d.d., Zagreb Notes to the consolidated financial statements
for the year ended 31 December 2011
25
3.15. Technical provisions
Technical provisions set out in the financial statements refer to the unearned premiums, life insurance mathematical provisions, provisions for claims, provisions for premium returns dependent and independent of the result (bonuses, rebates), and other insurance-technical provisions, and they are formed pursuant to law regulations. All technical provisions were rated favourably by the appointed certified actuary of the Company.
/i/ Unearned premiums
The Group accounts unearned premiums for those insurance classes where the insurance cover is continued after the end of the accounting period since the insurance year and the accounting year do not overlap. The basis for the calculation of gross general insurance unearned premiums is written (policy) premium in the accounting period, while the basis for the calculation of gross unearned premium of supplementary insurance with life insurance is collected premium in the accounting period.
Unearned premiums are calculated according to the pro rata temporis method, except for the types of loan insurance where the decrease of insurance cover during the validity period of a contract is taken into consideration.
/ii/ Mathematical life insurance provision
Mathematical life insurance provision is accounted individually under each insurance contract, by net prospective method.
/iii/ Claims provisions
Claims provisions include provisions for reported losses, provisions for incurred but not reported losses, provisions for costs of claims handling and the reinsurance portion in them. Provisions for reported losses are determined through an individual assessment. Actuarial methods are applied in determining provisions for claims handling costs and for incurred but not reported losses.
The reinsurance portion in provisions is determined in accordance with the reinsurance contracts.
/iv/ Provisions for premium returns, dependent and independent of the result (bonuses and discounts)
Reserves for bonuses and discounts are formed in the amount of the payment for which policyholders are entitled to based on their right to: participate in the profit from their insurance, or other rights under the contract; future partial reduction in premiums, return of part of premium for the unused insurance period due to early insurance termination.
/v/ Other insurance-technical provisions
The Group forms the other insurance technical provision for anticipated future obligations and risks of large losses resulting from manufacturers’ liability for pharmaceutical products and the risk of earthquakes. The Group has also established a provision for unexpired risks arising from credit insurances where it is expected that damage which would probably occur after the financial year, for contracts concluded before that date, would exceed unearned premium.

CROATIA OSIGURANJE d.d., Zagreb Notes to the consolidated financial statements
for the year ended 31 December 2011
26
3.16. Technical life insurance provisions when the insurer
bears the investment risk
Since the Group concludes life insurance policy for which the insurer bears the investment risk, a corresponding special provision was made under each insurance contract. 3.17. Other liabilities
/i/ Liabilities resulted from direct insurance activities refer to the liabilities under claims. /ii/ Liabilities resulted from reinsurance activities refer to the liabilities under stipulated sums for claims under reinsurance and liabilities under the reinsurance premium. /iii/ Other liabilities refer to domestic trade payables, prepayment liabilities, liabilities for commissions and other.
3.18. Employees' salaries
Salaries, taxes and contributions from salaries and on salaries are accounted as expenses of the period to which the employee's work relates.
3.19. Provisions
Provisions are recognized if and only if the Group has a current liability as a result of a past event and if the liability settlement is likely to require the outflow of resources with economic benefits and if the amount of liability can be determined with a reliable estimate. Provisions are examined at each balance sheet date and adjusted according to the newest best estimates.
Provisions are determined for costs of legal proceedings and expenses for employee rewards for their long-time work as well as for the retirement (regular jubilee awards and severance payments).
Provisions for costs of employee rewards for their long-time work as well as for the retirement (regular jubilee awards and severance payments) were determined as a current value of future money outflows using a discount rate equaling the interest rate on state bonds.
3.20. Contingent liabilities and assets
Contingent liabilities are not recognized in the consolidated financial statements, but are only set out in notes to the financial statements.
Contingent assets are not recognized in the consolidated financial statements, but are recognized at that moment when an inflow of economic benefits becomes probable.
3.21. Events after the Balance sheet date
Events after the balance sheet date providing additional information on the position of the Group at the balance sheet date (events resulting in adjustments) are recognized in the consolidated financial statements. Those events that do not bring about the adjustments are presented in notes to the consolidated financial statements if they are substantially significant.
3.22. Earnings per share
Earnings per share are accounted as profit of the period decreased by dividends of preferred shares divided by the weighted average of common shares decreased by own shares.

CROATIA OSIGURANJE d.d., Zagreb Notes to the consolidated financial statements
for the year ended 31 December 2011
27
3.23. Classification of contracts
Contracts by which the Group undertakes a significant insurance risk of the other party (policyholder) accepting to indemnify the policyholder or the other insurance beneficiary for a loss if a particular indefinite future event (insured event) occurs that has a negative impact on the policyholder or the other insurance beneficiary are classified as insurance contracts. Insurance risk differs from financial risk. Financial risk is the risk of a possible future change of one or several definite interest rates, price of securities, price of goods, exchange rates, price or rate indexes, loan rating or loan indexes or other variables provided that in case of a non-financial variable that variable is not specific for any of the contracting parties. Insurance contracts can also transfer the financial risk to some extent. Contracts in which the transfer of insurance risk from the policyholder to the Group is not significant are classified as investment contracts.
3.24. Concentration of insurance risk
The key aspect of the insurance risk to which the Group is exposed is the level of insurance risk concentration that defines the level up to which a certain event or a series of events may influence the liabilities of the Group. Such concentration may arise from a single insurance contract of from a fairly great number of contracts. A very important aspect of the insurance risk concentration is that it may arise from the accumulation of risks through various classes of insurance. The risk concentration may arise from rare events with considerable consequences such as natural disasters, in situations when the Group is exposed to unexpected changes in trends, for example, unexpected change in human mortality or in the conduct of the insured; or when significant judicial or regulatory risks may cause big individual losses or have a significant impact on a large number of contracts. Risks underwritten by the Group are primarily located in the Republic of Croatia. The Management Board believes that in general insurance activities the Group is not notably exposed to any group of the insurers according to social, professional, generational or similar criteria. The greatest probability of considerable losses emerges from disastrous events, such as floods, storms or losses in consequence of an earthquake. Techniques and presumptions used by the Group for the calculation of these risks include: - Survey of geographical accumulations; - Evaluation of the biggest possible loss; - Reinsurance of excess of loss.
3.25. Insurance risk management
The Group is exposed to the actuarial risk and the sales risk resulting from a wide offer of life and general insurance products: participating traditional life products, policies linked to stakes and all classes of general insurance. The insurance risk refers to the uncertainty of insurance activities. The most significant components of insurance risk are the premium risk and the provision risk. They refer to the adequateness of premium tariffs and the adequateness of provisions in relation to the liabilities under insurance and capital stock.
The premium risk is present at the moment of issuance of policy before the insured event occurs. There is a risk that costs and losses that would come about might be higher than received premiums. The provisions risk represents a risk that the absolute level of technical provisions is wrongly assessed or that actual losses will vary around statistical medium value.
General sales risk includes also the disaster risk that arises from extraordinary events that are not covered by the premium risk or provision risk in sufficient degree.

CROATIA OSIGURANJE d.d., Zagreb Notes to the consolidated financial statements
for the year ended 31 December 2011
28
Life insurance sales risk includes biometrical risk (that includes mortality, longevity, ailment risk and disability) and the risk of withdrawal. The risk of withdrawal represents a higher or lower rate of withdrawing from policies, breaks, changes in capitalization (suspension of premium payment) and repurchase.
The Group manages the insurance risk through the limits of sale, procedure for the approval of transactions that include new products or surpass certain limits, tariffing, design of products and reinsurance management. Sales strategy pursues diversity that would ensure a balanced portfolio and is based on a large portfolio of similar risks over several years, which decreases the variability of results. As a rule all general insurance contracts are on an annual basis and the underwriters have a right to refuse the renewal of contract or change the terms and conditions of contract at renewal. The Group reinsures a part of a risk it underwrites in order to control the exposure to losses and protect the capital stock. The Group purchases a combination or proportional and disproportional reinsurance contracts in order to diminish the net exposure to a particular risk depending on the insurance class.
3.26. Basic presumptions with the greatest impact on recognized assets, liabilities, income and expenditures from insurance operations
/i/ General insurance
At the balance sheet date provisions are made for the assessed final expenses for the settlement of all incurred losses arising from events that occurred up to that date, whether they were reported or not, together with appropriate claims handling fees, reduced by amounts already paid. The liability for reported but not paid losses is estimated separately for each particular loss with regard to the circumstances, available information from the assessor and historical evidences of the amounts of similar claims. Particular losses are regularly examined and provisions are regularly updated with new information.
The assessment of provisions for incurred but not reported (IBNR) losses is generally subject to a higher level of uncertainty than the provisions for reported losses. The IBNR provision is assessed by actuaries of the Group applying statistical and actuarial methods. The method used depends on the year of the accident under consideration, the type of insurance and the historical development of the observed damage. To the extent to which these methods use historical loss development it is assumed that the historical pattern of loss development will repeat itself in the future as well. There are reasons why this might not be the case, which are taken into consideration to the extent to which they can be established and in a way that the methods of estimate are modified.
Such reasons include:
- economic, political and social trends (causing a different
- level of inflation in relation to the expected one);
- changes in the combination of types of insurance contracts that are underwritten;
- random variations, including the influence of major losses.
The IBNR provisions are initially assessed in gross amount and a special calculation is made in order to assess the reinsurance portion.
The assumptions that have the major influence on the measurement of the amount of provisions for the general insurance are as follows:

CROATIA OSIGURANJE d.d., Zagreb Notes to the consolidated financial statements
for the year ended 31 December 2011
29
- Residual factor of loss development
For the backlog of claims the level of provisions depends to a large extent on the assessment of loss development from the last year of development for which there are historical data up to the final development. The residual factors of loss development are assessed reasonably applying mathematical methods of curves that project the observed factors or are based on actuarial assessment.
- Discounting
Apart from reserves for liability claim insurance that are paid in annuities, general reserves are not discounted.
/ii/ Life insurance
Mathematical provisions are calculated by net prospective method using rational actuarial assumptions. The guaranteed technical interest rate in insurance policies ranges from 2.75 - 6% depending on the price list.
The insurers or insurance beneficiaries in case of survival or death are entitled to a share in the Group’s profit realized through the management of life insurance funds. The right to a share is calculated annually earliest after the expiry of the first, respectively second insurance year depending of the price list. The value of the profit share is determined by the Management Board.
3.27. Main sources of uncertainty related to assessments /i/ Loans and receivables impairment losses
The need for impairment of assets under the amortized costs is evaluated as described in Note 3.9./ii/. The impairment for particular exposures in total losses from the value decrease is based on the best estimate on the part of the managers regarding the current value of expected future money receipts. When evaluating these money receipts, the Management evaluate the financial position of a debtor and net sales value of the collateral. Any assets that suffered impairment are assessed separately and the function of loan risk independently approves the recovery strategy as well as the assessment of realizable cash flows. /ii/ Determination of fair value
For the financial instruments that are rarely traded with and that have a non-transparent price, a fair value is less objective and requires a different level of assessment depending on solvency, concentration, uncertainty of market factors, price assumptions and other risks affecting a particular instrument. /iii/ Uncertainty of estimates related to establishing provisions
The most significant estimates related to the consolidated financial statements of the Group refer to establishing provisions. The Group has a conservative approach to forming provisions and it applies regulations of the Croatian Financial Services Supervisory Agency. The Group employs certified actuaries. The Management Board regards the present level of technical provisions as sufficient. /iv/ Uncertainty of estimates related to legal proceedings
A considerable source of the uncertainty of estimates arises out of judicial proceedings. The Management Board believes that the existing level of provisions is sufficient.
CROATIA OSIGURANJE d.d., Zagreb Notes to the consolidated financial statements
for the year ended 31 December 2011
30
/v/ Corporate income tax
The Group establishes tax liability in accordance with tax regulations of the Republic of Croatia. Tax reports are subject to control on the part of the tax authorities who have the right to subsequently inspect the taxpayer’s books of accounts. /vi/ Regulatory requirements
The Croatian Financial Services Supervisory Agency is authorized to perform regulatory inspections of business operations of the Group and to require changes in the book value of assets and liabilities in accordance with relevant regulations. /vii/ Mutual liabilities
The Group has liability towards the Croatian Insurance Bureau with regard to the Group's portion in the motor TPL losses caused by unknown or uninsured vehicles. Besides, the Group like the other participants on the Croatian motor TPL insurance market, is liable for a part of unsettled motor TPL claims in case of bankruptcy of any of the insurance companies under the Insurance Act.
3.28. Key accounting estimates in the application of the Group’s accounting policies
/i/ Classification of financial assets and liabilities
The accounting policies of the Group make possible a classification of assets and liabilities at the beginning, under certain circumstances, in different accounting categories. When classifying financial assets and liabilities as those “intended for trade”, the Group establishes that they meet the definition of assets and liabilities as set out in Note 3.9. /ii/ Classification of products
For the accounting policy on the classification of contracts as insurance contracts or investment contracts see Note 3.23. /iii/ Classification of properties
The Group classifies all non-operational properties, kept for renting as investments properties. /iv/ Estimated useful life of tangible and intangible assets
The depreciation rates are initially set on the basis of the optimum evaluation of the useful life of these assets. The Group’s Management Board believes that the applied depreciation rates reflect useful life of tangible and intangible assets. 3.29. Financial risk management
The basic goal of the Group while managing financial and insurance risks is to keep the capital level adequate to the scope and insurance classes it transacts and also with reference to the risks to which it is exposed. The Management Board recognizes the significance of existence of an efficacious and effective system of risk management. The Group is currently at the stage of introducing centralized system of risk management.

CROATIA OSIGURANJE d.d., Zagreb Notes to the consolidated financial statements
for the year ended 31 December 2011
31
Legal bodies control the solvency of the Group in order to ensure the cover for the liabilities deriving from possible economic changes or natural disasters. The Group actively manages the assets using the approach that creates a balance among the quality, diversification, coordination of assets and liabilities, solvency and return on investments. The Management examine and approve target portfolios on a periodical basis, determine investment directives and limits and supervise the process of managing assets and liabilities. Due attention is also paid to the compliance with the regulations defined by the Insurance Act.
,In the transactions of financial instruments the Group undertakes financial risks. These risks include market risk, loan risk and solvency risk. Each of these risks is described further in the text, together with the summary of the ways the Group manages that risk. Market risk
Market risk is the risk of fluctuation of fair value of the future cash flows under financial instruments due to changes in market prices.
The market risk includes three types or risk: currency risk, interest risk and other price risks.
a) Currency risk - fluctuation risk of fair value or cash flows under financial instruments due to changes in the exchange rates of foreign currencies. The Group is exposed to the risk of change in the exchange rate through the transactions in foreign currencies. This is the risk that the value of a financial instrument might change due to the changes in the exchange rates of foreign currencies.
The Group is exposed to the currency risk through loan, deposit and investment activities, as well as through the premium income, calculation of related technical provisions and claims payment under the insurance policies with foreign currency clause. The company manages the currency risk in a way that it endeavours to diminish the difference between assets and liabilities denominated in foreign currency or with foreign currency clause. Investments for covering mathematical provision are for the most part denominated in Euros, since most mathematical provision is also denominated in Euros.
b) Interest risk - fluctuation risk of fair value or cash flows under financial
instruments due to changes in the market interest rates. The exposure of the Group to the market risk of changes in interest rates is concentrated in the investment portfolio. The Group's business is subject to the risk of a change in interest rates in the sense that the interest-bearing assets and liabilities mature or the interest is changed in various periods or in various amounts. The Group is also exposed to the risk of changes in the future cash flows deriving from the changes in the market interest rates. However, this risk is limited since most interest-bearing assets of the Group at the balance sheet date bear fixed interest rates. Changes in interest rates do not affect the level of provision from the general insurance business, except for the annuity payments for the liability claims which are not significant at the balance sheet date. The rate used in the calculation of the mathematical provision reflects to a certain extent the expected trends in the interest returns over a longer period of time. The Group monitors this exposure through occasional inspections of the position of its assets and liabilities. A general goal is to limit net changes in the value of assets and liabilities arising from changes in interest rates.
CROATIA OSIGURANJE d.d., Zagreb Notes to the consolidated financial statements
for the year ended 31 December 2011
32
The Group endeavours to adjust future receipts from these assets to the liabilities from insurance through the purchases of state bonds. However, considering a relatively short period of life of such bonds and a longer period of life of liabilities under life insurance and the incapability of the Group to buy the interest “swap” in Croatia, the Group is exposed to the interest rate risk.
c) Other price risks - fluctuation risk of fair value or cash flows under financial instruments due to changes in market prices (not arising from the interest or currency risk) whether it is a matter of the changes caused by factors typical of a particular financial instrument or its issuer or other factors affecting all similar financial instruments being traded on the market. The portfolio of marketable equity securities that is presented at its fair value in the balance sheet makes the Group subject to the price risk. The price risk is the risk that the value of a financial instrument might change as a result of changes in market prices, no matter whether the changes emerged as a result of factors specific for a certain paper or its issuer or factors affecting all instruments being traded on the market. The goal of the Group is to earn competitive returns in a way that it invests in a diversified portfolio of securities. The characteristics of the portfolio are regularly analyzed. The portfolio of the Group contains securities of various issuers, and the concentration of any single firm or company is limited through the parameters defined by senior management as well as through legal requirements.
Credit risk
Credit risk is the risk that one agreement party of the financial instrument might cause losses for the other party due to non-fulfilment of obligations.
The portfolio of the Group that includes securities with fixed returns, mortgage loans, and to lower extent short-term and other investments is subject to the loan risk. This risk is defined as a potential decline in market value as a result of unfavourable changes in the capability of a debtor to pay off a debt. The Management determined the loan policy and they continually monitor the exposure to the loan risk. Evaluations of loan capacity are made for all insurers and the collateral is gathered before payments are made under granted loans or their prolongation. The collateral is in conformity with the valid Insurance Act. At the balance sheet date the Group had a significant concentration of receivables from the Republic of Croatia in bonds and treasury bills.
Liquidity risk
Liquidity risk is the risk that a sudden and unexpected increase in withdrawal of liabilities might require from the Group disposing of the assets in a short-term at low price.
The liquidity risk arises as a result of financial activities of the Group and management of positions. This risk includes the risk of incapability to finance assets within the appropriate time and interest as well as the risk of incapability to dispose of assets at reasonable price and within the appropriate time period. The Group has a portfolio of liquid assets as a part of liquidity risk management strategy, by which it ensures continued business operations and meets legal requirements.

CROATIA OSIGURANJE d.d., Zagreb Notes to the consolidated financial statements
for the year ended 31 December 2011
33
The position of the Group’s liquidity is good and all legal requirements for the payment of claims in the course of the year were met. Strategic risk During 2011, the Group realized income from investments in the amount of HRK 443,908,509 in relation to 2010 when the Company realized total income amounted to HRK 348,991,432. The most significant income increase was recorded from property investments for the amount of HRK 62,871,742 and other income from investments in the amount of HRK 53,086,909 mostly due to income from collected loans, value decreased in previous years as well as income from rent of MOT test stations. Income from subsidiaries, associated companies and joint ventures and the interest income are kept approximately at the same level.
2011 Increase/ 2010
Description Total Decrease Total
HRK % HRK
Income from investments in land and buildings 62,871,742 413.46% 12,244,604
Interest income 269,393,462 (8.36%) 293,968,361 Unrealized gains from investments at fair value through profit and loss account 11,386,939 7.51% 10,591,979
Gains from sale / realization of financial investments 10,468,500 (3.48%) 10,845,506
Net foreign exchange gains 36,700,956 56.92% 23,388,366
Other investment income 53,086,909 (2,047,383)
Total 443,908,509 27.20 348,991,432
As the most important income from investments the Group realizes from investments in properties and investments in deposits and loans (interest income), it is expected that in the conditions of decrease of active banking interest rates, business banks will make additional pressure to the decrease of passive and due to the leading role of business banks, the Group will lose on both sides, through a lower interest realized on deposits and through a lower interest which will realize on loans. Also, due to finalization of process of longtime value increase of immovables and shares, we believe that in the future accounting period due to changed market conditions the Group will more heavily realize income from investments which were recorded in history. Thus, the Group is in the procedure of changing strategy of investments and finding out the mode that through increased activities on the insurance market in the region to strengthen its influence, volume of activities and profitability of operations. Beside the influence in region, it is indispensable to the Group to increase the portions at domestic insurance market. Creating a profitable growth, the Group, through the new products will change the policy of investments by introduction of pro-active approach to potential clients.

CROATIA OSIGURANJE d.d., Zagreb Notes to the consolidated financial statements
for the year ended 31 December 2011
34
3.30. Consolidation Subsidiaries: At 31 December 2011 At 31 December 2010
The Group
Ownership
portion
(in %)
Portion in
voting
rights (in %)
Ownership
portion
(in %)
Portion in
voting
rights (in %)
Consolidated subsidiaries in the Republic of Croatia:
Croatia Lloyd d.d., Zagreb 94.64 94.64 94.64 94.64
- Croatia mirovni dom d.o.o., Zagreb 100.00 100.00 100.00 100.00
- Plančić d.o.o., Vrbanj 51.00 51.00 51.00 51.00
Croatia Leasing d.o.o., Zagreb 100.00 100.00 100.00 100.00
Croatia-Tehnički pregledi d.o.o., Zagreb 100.00 100.00 100.00 100.00
- STP Pitomača, Pitomača 100.00 100.00 100.00 100.00
Slavonijatrans-Tehnički pregledi d.o.o., Sl. Brod 76.00 76.00 76.00 76.00
Herz d.d., Požega 100.00 100.00 100.00 100.00
Croatia osiguranje mirovinsko društvo d.o.o., Zagreb 100.00 100.00 100.00 100.00
Croatia zdravstveno osiguranje d.d., Zagreb 100.00 100.00 100.00 100.00
- Poliklinika Ars Medica, Pula 74.00 74.00 74.00 74.00
- Poliklinika Croatia zdravstveno osiguranje,
Zagreb 100.00 100.00 100.00 100.00
PBZ Croatia osiguranje d.d., Zagreb 50.00 50.00 50.00 50.00
Consolidated subsidiaries abroad:
Milenijum osiguranje a.d., Belgrade 99.78 99.78 99.78 99.78
Croatia Sigurimi sh.a., Prishtinë 100.00 100.00 100.00 100.00
Croatia osiguranje d.d., Ljubuški 52.05 52.05 52.05 52.05
- Crotehna d.o.o., Ljubuški 100.00 100.00 100.00 100.00
- Croatia remont d.d., Čapljina 69.79 69.79 69.79 69.79
- Croauto d.o.o., Mostar 66.80 66.80 66.80 66.80
- Croatia Vitez d.o.o., Vitez 90.00 90.00 90.00 90.00
Hotel Hum d.o.o. , Ljubuški 80.00 80.00 80.00 80.00
- Ponte d.o.o., Mostar 100.00 100.00 0 0
Croatia osiguranje d.d., društvo za osiguranje neživota,
Skopje 100.00 100.00 100.00 100.00
Croatia osiguranje d.d., društvo za osiguranje života,
Skopje 92.5 92.50 92.5 92.50

CROATIA OSIGURANJE d.d., Zagreb Notes to the consolidated financial statements
for the year ended 31 December 2011
35
NOTES TO THE STATEMENT OF COMPREHENSIVE INCOME
5. TOTAL INCOME
2011 2010
Description Life General Total Life General Total
HRK HRK HRK HRK HRK HRK
Earned premiums 387,557,064 2,454,094,271 2,841,651,335 385,810,559 2,580,804,201 2,966,614,760
Investment income 114,862,517 124,058,577 238,921,094 98,592,278 74,357,187 172,949,465 Income from fees and commissions 69,101 44,660,305 44,729,406 90,042 45,903,228 45,993,270 Other insurance-technical income, net from reinsurance 108,336 20,825,011 20,933,347 728,107 39,647,332 40,375,439
Other income 1,361,321 213,761,067 215,122,388 1,832,993 244,744,866 246,577,859
TOTAL 503,958,339 2,857,399,231 3,361,357,570 487,053,979 2,985,456,814 3,472,510,793
Review of total Group's income by segments:
Description
2011
2010
HRK
HRK
Income from insurance activities
3,181,168,365
3,278,008,362
Income from financial and operating lease
34,076,995
67,966,195
Income from pension fund management
34,918,686
32,021,614
Income from MOT tests
81,749,216
67,872,024
Income from other activities
29,444,308
26,642,598
Total
3,361,357,570 3,472,510,793
5.1. Earned premiums
2011 2010
Description Life General Total Life General Total
HRK HRK HRK HRK HRK HRK
Written gross premium
Insurance premium – gross 387,803,438 2,851,750,030 3,239,553,468 385,704,710 2,911,414,493 3,297,119,203
Coinsurance premium 0 1,024,374 1,024,374 0 556,583 556,583 Impairment and collected written-off premium 0 (69,013,259) (69,013,259) 0 (52,405,459) (52,405,459)
Total 387,803,438 2,783,761,145 3,171,564,583 385,704,710 2,859,565,617 3,245,270,327
Outward reinsurance Reinsurance premium abroad (319,731) (328,188,741) (328,508,472) (6,859) (352,894,530) (352,901,389)
Total (319,731) (328,188,741) (328,508,472) (6,859) (352,894,530) (352,901,389)
Outward coinsurance Outward coinsurance 0 (3,744,946) (3,744,946) 0 (5,383,364) (5,383,364)
Total 0 (3,744,946) (3,744,946) 0 (5,383,364) (5,383,364) Changes in unearned premium reserves
Unearned premium gross provision 73,219 6,876,013 6,949,232 112,708 74,099,692 74,212,400 Unearned premium provision, reinsurance portion 138 (4,609,200) (4,609,062) 0 4,342,854 4,342,854 Unearned premium provision, coinsurance portion 0 0 0 0 1,073,932 1,073,932
Total 73,357 2,266,813 2,340,170 112,708 79,516,478 79,629,186
TOTAL 387,557,064 2,454,094,271 2,841,651,335 385,810,559 2,580,804,201 2,966,614,760

CROATIA OSIGURANJE d.d., Zagreb Notes to the consolidated financial statements
for the year ended 31 December 2011
36
5.2. Net investment income
2011 2010
Description Life General Total Life General Total
HRK HRK HRK HRK HRK HRK Income from investments in land and buildings 4,566 35,042,166 35,046,732 4,474 (20,742,588) (20,738,114)
Interest income 108,735,174 160,644,749 269,379,923 120,256,973 173,218,528 293,475,501
Value impairment of investments (12,043,534) (58,043,082) (70,086,616) (16,717,358) (20,330,656) (37,048,014) Unrealized gains / losses from investments at fair value through profit and loss account (2,595,080) 877,154 (1,717,926) 3,172,402 6,581,962 9,754,364 Gains / losses from sale (realization) of financial investments 1,294,343 (14,765,749) (13,471,406) (10,283,995) (31,520,242) (41,804,237)
Net foreign exchange gains 19,753,250 16,947,707 36,700,957 11,058,585 12,329,780 23,388,365
Other investment income/costs (286,202) (16,644,368) (16,930,570) (8,898,803) (45,179,597) (54,078,399)
TOTAL 114,862,517 124,058,577 238,921,094 98,592,278 74,357,187 172,949,466
/i/ Income/expenses from investments in land and buildings
2011 2010
Description Life General Total Life General Total
HRK HRK HRK HRK HRK HRK
Income/expenses from value increase/decrease 0 27,926,772 27,926,772 0 (27,845,648) (27,845,648)
Rental income 4,566 7,096,002 7,100,568 4,474 6,669,941 6,674,415
Income from sale 0 19,392 19,392 0 433,119 433,119
TOTAL 4,566 35,042,166 35,046,732 4,474 (20,742,588) (20,738,114)
/ii/ Interest income
2011 2010
Description Life General Total Life General Total
HRK HRK HRK HRK HRK HRK Interest on investments held to maturity 75,841,840 43,983,876 119,825,716 86,410,188 50,400,040 136,810,228 Interest on Investments at fair value through P&L account 4,143,590 4,624,383 8,767,973 63,881 276,692 340,573
Interest on given deposits 24,022,340 51,413,889 75,436,229 28,719,013 53,324,822 82,043,835 Interest on given loans and other placements 4,739,591 60,623,953 65,363,544 5,079,942 69,693,782 74,773,724
Others (12,187) (1,352) (13,539) (16,051) (476,808) (492,859)
TOTAL 108,735,174 160,644,749 269,379,923 120,256,973 173,218,528 293,475,501
/iii/ Impairment of investments
2011 2010
Description Life General Total Life General Total
HRK HRK HRK HRK HRK HRK Investment available for sale (12,043,534) (30,669,460) (42,712,994) (16,717,358) (20,330,656) (37,048,014)
Deposits 0 (25,890,421) (25,890,421) 0 0 0
Others 0 (1,483,201) (1,483,201) 0 0 0
TOTAL (12,043,534) (58,043,082) (70,086,616) (16,717,358) (20,330,656) (37,048,014)

CROATIA OSIGURANJE d.d., Zagreb Notes to the consolidated financial statements
for the year ended 31 December 2011
37
/iv/ Net gains/losses from sale (realization) of financial investments
2011 2010
Description Life General Total Life General Total
HRK HRK HRK HRK HRK HRK
Investment available for sale (2,546,242) (21,220,316) (23,766,558) (13,649,803) (37,159,082) (50,808,885) Investments at fair value through P&L account 3,052,031 4,812,086 7,864,117 3,187,829 5,516,247 8,704,076
Investments held to maturity 0 1,698,556 1,698,556 (4,038) 0 (4,038)
Other investments 788,554 (56,075) 732,479 182,017 122,593 304,610
TOTAL 1,294,343 (14,765,749) (13,471,406) (10,283,995) (31,520,242) (41,804,237)
/v/ Net foreign exchange gains
2011 2010
Description Life General Total Life General Total
HRK HRK HRK HRK HRK HRK
Investment held to maturity 17,949,160 7,971,233 25,920,393 10,810,815 4,910,118 15,720,933
Investment available for sale 0 2,109,351 2,109,351 0 4,798,547 4,798,547
Investments at fair value through P&L account 1,437,561 1,094,916 2,532,477 254,018 42,817 296,835
Deposits 211,711 (444,158) (232,447) 8,534 520,306 528,840
Loans 219,728 3,796,545 4,016,273 3,429 2,057,600 2,061,029
Foreign currency accounts 0 1,413,193 1,413,193 (18,271) 926,958 908,687
Other (64,910) 1,006,627 941,717 60 (926,566) (926,506)
TOTAL 19,753,250 16,947,707 36,700,957 11,058,585 12,329,780 23,388,365
/vi/ Other investment income/expenses
2011 2010
Description Life General Total Life General Total
HRK HRK HRK HRK HRK HRK
Dividend income 0 799,423 799,423 1,483,480 3,269,500 4,752,980
Collected impaired and write-off receivables 142,720 42,997,609 43,140,329 0 6,165,940 6,165,940
Decrease in value of given loans 0 (55,375,156) (55,375,156) (1,662,266) (28,291,289) (29,953,555) Value impairment of receivables for interest 0 (7,885,875) (7,885,875) 0 (10,595,694) (10,595,694)
Payment – traffic costs (488,589) (3,236,004) (3,724,593) (442,905) (3,524,954) (3,967,859)
Other income / costs 59,667 6,055,635 6,115,302 (8,277,112) (12,203,100) (20,480,212)
TOTAL (286,202) (16,644,368) (16,930,570) (8,898,803) (45,179,597) (54,078,400)
5.3. Other income
2011 2010
Description Life General Total Life General Total
HRK HRK HRK HRK HRK HRK
Income from fees and commissions 69,101 44,660,305 44,729,406 90,042 45,903,228 45,993,270
Other insurance-technical income, net from reinsurance 108,336 20,825,011 20,933,347 728,107 39,647,332 40,375,439
Other income 1,361,321 213,761,067 215,122,388 1,832,993 244,744,866 246,577,859
Total other income 1,538,758 279,246,383 280,785,141 2,651,142 330,295,426 332,946,568

CROATIA OSIGURANJE d.d., Zagreb Notes to the consolidated financial statements
for the year ended 31 December 2011
38
/i/ Income from fees and commissions Income from fees and commissions in the amount of HRK 44,729,406 (2010: in the amount of HRK 45,993,270) relate to commissions from reinsurance companies according to reinsurance agreements.
/ii/ Other insurance-technical income, net from reinsurance
2011 2010
Description Life General Total Life General Total
HRK HRK HRK HRK HRK HRK
Income from Guarantee fund 0 9,099,099 9,099,099 0 25,683,496 25,683,496
Income from international claims 0 5,177,374 5,177,374 0 3,354,637 3,354,637
Income from interest on premium 71,951 3,244,857 3,316,808 0 0 0
Income from border insurance fees 0 437,210 437,210 0 550,111 550,111
Income from recourse receivables 0 (6,505,939) (6,505,939) 0 (5,077,527) (5,077,527)
Other income 36,385 9,372,410 9,408,795 728,107 15,136,615 15,864,722
TOTAL 108,336 20,825,011 20,933,347 728,107 39,647,332 40,375,439
/iii/ Other income
2011 2010
Description Life General Total Life General Total
HRK HRK HRK HRK HRK HRK
Income from insurance activities 1,361,321 33,571,861 34,933,182 1,832,993 50,242,435 52,075,428
Income from non-insurance activities 0 180,189,206 180,189,206 0 194,502,431 194,502,431
TOTAL 1,361,321 213,761,067 215,122,388 1,832,993 244,744,866 246,577,859
Income from insurance activities
2011 2010
Description Life General Total Life General Total
HRK HRK HRK HRK HRK HRK
Income from reversal of long-term provisions 1,150,000 9,806,276 10,956,276 861,390 4,510,982 5,372,372
Income from service assessments 0 9,750,538 9,750,538 2,800 11,672,122 11,674,922
Income from collected insurance claims 1,600 2,853,988 2,855,588 0 2,963,296 2,963,296
Collected write-off receivables 0 1,529,742 1,529,742 0 5,289,371 5,289,371
Income from sale of tangible assets 6,073 1,472,109 1,478,182 0 77,585 77,585
Income from previous years 0 1,089,758 1,089,758 0 0 0
Income from subventions and refunds 0 25,728 25,728 0 271,023 271,023
Income from MOT test stations 0 0 0 0 13,436,801 13,436,801
Other income 203,648 7,043,722 7,247,370 968,803 12,021,255 12,990,058
Total 1,361,321 33,571,861 34,933,182 1,832,993 50,242,435 52,075,428

CROATIA OSIGURANJE d.d., Zagreb Notes to the consolidated financial statements
for the year ended 31 December 2011
39
Income from non-insurance activities
Description
2011
2010
HRK
HRK
Income from financial and operating lease
34,076,995
67,966,195
Income from pension fund management
34,918,686
32,021,614
Income from MOT tests
81,749,216
67,872,024
Income from other activities
29,444,309
26,642,598
TOTAL
180,189,206
194,502,431
6. TOTAL EXPENSES
2011 2010
Description Life General Total Life General Total
HRK HRK HRK HRK HRK HRK
Insured event costs, net 323,768,560 1,403,695,469 1,727,464,029 229,929,004 1,549,705,854 1,779,634,858 Change in other technical provisions, net of reinsurance 64,996,943 10,670,000 75,666,943 136,507,486 13,847,225 150,354,711 Change in life insurance technical provisions when insurer bears risk (4,700,768) 0 (4,700,768) (1,918,336) 0 (1,918,336) Cost for premium returns (bonuses and discounts), net from reinsurance 0 466,213 466,213 0 (3,614,102) (3,614,102)
Net operating expenses 108,883,777 1,040,417,397 1,149,301,174 113,880,673 1,022,477,203 1,136,357,876 Other technical expenses, net of reinsurance 190,956 84,668,049 84,859,005 305,749 82,178,583 82,484,332
Other expenses, including value adjustments 1,142,463 168,881,499 170,023,962 60,845 210,100,988 210,161,833
TOTAL 494,281,931 2,708,798,627 3,203,080,558 478,765,421 2,874,695,751 3,353,461,172
6.1. Net costs for insured events
2011 2010
Description Life General Total Life General Total
HRK HRK HRK HRK HRK HRK
Liquidated claims
Gross amount 329,935,998 1,614,599,709 1,944,535,707 230,501,346 1,695,479,590 1,925,980,936
Coinsurance portion 0 (40,489) (40,489) 0 491,247 491,247
Reinsurance portion 0 (144,493,364) (144,493,364) 0 (117,066,806) (117,066,806)
Total 329,935,998 1,470,065,857 1,800,001,855 230,501,346 1,578,904,031 1,809,405,377
Change in claims provision
Gross amount (6,163,009) 56,641,838 50,478,829 (572,342) (29,198,177) (29,770,519)
Reinsurance portion (4,429) (123,012,226) (123,016,655) 0 0 0
Total (6,167,438) (66,370,388) (72,537,826) (572,342) (29,198,177) (29,770,519)
TOTAL 323,768,560 1,403,695,469 1,727,464,029 229,929,004 1,549,705,854 1,779,634,858

CROATIA OSIGURANJE d.d., Zagreb Notes to the consolidated financial statements
for the year ended 31 December 2011
40
6.2. Change in other technical provisions, net from reinsurance
2011 2010
Description Life General Total Life General Total
HRK HRK HRK HRK HRK HRK
Change in mathematical insurance provisions Gross amount 65,149,825 0 65,149,825 136,505,904 0 136,505,904
Reinsurance portion (152,882) 0 (152,882) 1,582 0 1,582
Total 64,996,943 0 64,996,943 136,507,486 0 136,507,486 Change in other technical provisions, net from reinsurance
Gross amount 0 10,670,000 10,670,000 0 13,847,225 13,847,225
Total 0 10,670,000 10,670,000 0 13,847,225 13,847,225
TOTAL 64,996,943 10,670,000 75,666,943 136,507,486 13,847,225 150,354,711
6.3. Change in life insurance technical provisions when the insurer bears risk
2011 2010
Description Life General Total Life General Total
HRK HRK HRK HRK HRK HRK
Change in life insurance technical provisions when the insurer bears risk (4,700,768) 0 (4,700,768) (1,918,336) 0 (1,918,336)
TOTAL (4,700,768) 0 (4,700,768) (1,918,336) 0 (1,918,336)
6.4. Cost for premium returns (bonuses and discounts), net from reinsurance
2011 2010
Description Life General Total Life General Total
HRK HRK HRK HRK HRK HRK
Changes in reserves for premium returns dependent from the result (bonuses) 0 104,981 104,981 0 390,424 390,424
Changes in reserves for premium returns independent from the result (discounts) 0 361,232 361,232 0 (4,004,526) (4,004,526)
TOTAL 0 466,213 466,213 0 (3,614,102) (3,614,102)

CROATIA OSIGURANJE d.d., Zagreb Notes to the consolidated financial statements
for the year ended 31 December 2011
41
6.5. Net operating expenses
2011 2010
Description Life General Total Life General Total
HRK HRK HRK HRK HRK HRK
Acquisition costs
Commission 25,822,347 176,517,443 202,339,790 27,414,311 152,594,619 180,008,930
Other acquisition costs 9,467,816 123,177,081 132,644,897 12,991,958 149,729,940 162,721,898 Changes in prepaid acquisition costs 0 (3,457,139) (3,457,139) 0 1,627,546 1,627,546
Total 35,290,163 296,237,385 331,527,548 40,406,269 303,952,105 344,358,374 Management expenses (administrative expenses)
Depreciation of tangible assets 1,944,285 54,451,779 56,396,064 2,069,428 55,150,513 57,219,941 Salaries, taxes and contributions from and on salaries 44,308,600 380,279,989 424,588,589 42,779,247 385,889,195 428,668,442
Other management costs 27,340,729 309,448,244 336,788,973 28,625,729 277,485,390 306,111,119
Total 73,593,614 744,180,012 817,773,626 73,474,404 718,525,098 791,999,502
TOTAL 108,883,777 1,040,417,397 1,149,301,174 113,880,673 1,022,477,203 1,136,357,876
/i-1/ Commission
2011 2010
Description Life General Total Life General Total
HRK HRK HRK HRK HRK HRK
Commission expenses under credit cards and POS devices 577,683 15,349,393 15,927,076 633,426 10,594,837 11,228,263
Commission expenses for commissioners 2,186,338 13,606,233 15,792,571 2,535,842 11,946,141 14,481,983
Commission expenses for employees 6,310,635 45,623,154 51,933,789 6,076,349 37,810,321 43,886,670 Commission expenses for banks, agencies and dispatchers 10,060,872 69,682,997 79,743,869 13,730,973 64,696,350 78,427,323
Commission expenses for MOT test stations 0 7,243,202 7,243,202 0 6,156,167 6,156,167
Other commission expenses 6,686,819 25,012,464 31,699,283 4,437,721 21,390,803 25,828,524
TOTAL 25,822,347 176,517,443 202,339,790 27,414,311 152,594,619 180,008,930
/i-2/ Other acquisition costs
2011 2010
Description Life General Total Life General Total
HRK HRK HRK HRK HRK HRK
Promotion costs 7,903,351 59,328,672 67,232,023 11,365,107 100,152,867 111,517,974
Costs for issuance of policy 330,459 4,571,805 4,902,264 108,973 2,726,658 2,835,631
Other direct acquisition costs 1,234,006 59,276,604 60,510,610 1,517,878 46,850,415 48,368,293
TOTAL 9,467,816 123,177,081 132,644,897 12,991,958 149,729,940 162,721,898

CROATIA OSIGURANJE d.d., Zagreb Notes to the consolidated financial statements
for the year ended 31 December 2011
42
/ii-1/ Depreciation
2011 2010
Description Life General Total Life General Total
HRK HRK HRK HRK HRK HRK
Depreciation of intangible assets 25,492 3,692,444 3,717,935 261,869 2,518,018 2,779,887
Depreciation of tangible assets 1,918,793 50,759,335 52,678,129 1,807,559 52,632,495 54,440,054
TOTAL 1,944,285 54,451,779 56,396,064 2,069,428 55,150,513 57,219,941
/ii-2/ Salaries, taxes and contributions from and on salaries
2011 2010
Description Life General Total Life General Total
HRK HRK HRK HRK HRK HRK
Net salaries and wages 25,789,268 220,011,975 245,801,243 24,341,589 214,537,606 238,879,195 Taxes and contributions from salaries 11,691,885 104,813,835 116,505,720 12,172,758 115,615,517 127,788,275
Contributions on salaries 6,827,447 55,454,179 62,281,626 6,264,900 55,736,072 62,000,972
TOTAL 44,308,600 380,279,989 424,588,589 42,779,247 385,889,195 428,668,442
/ii-3/ Other management costs
2011 2010
Description Life General Total Life General Total
HRK HRK HRK HRK HRK HRK
Used material 1,490,930 18,293,916 19,784,846 1,455,900 13,848,477 15,304,377
Energy 1,470,475 15,458,444 16,928,919 1,300,757 13,223,305 14,524,062
Services costs 9,734,470 95,659,767 105,394,237 9,681,856 92,693,429 102,375,285
Promotional representation 178,936 4,347,811 4,526,747 204,779 4,371,372 4,576,151
Long-term cost and risk reserves 0 35,388,362 35,388,362 0 7,839,284 7,839,284 Daily allowances for business trips and travel expenses 476,640 3,902,029 4,378,669 269,913 2,307,582 2,577,495
Commuting costs 1,545,147 12,860,144 14,405,291 1,507,495 12,248,693 13,756,188 Other reimbursement to employees according to Collective agreement 7,886,986 73,585,856 81,472,842 9,063,160 73,362,986 82,426,146
Business fees according to contracts 340,688 5,571,611 5,912,299 291,729 4,437,156 4,728,885
Representation costs 345,386 4,809,456 5,154,842 255,042 3,703,786 3,958,828
Insurance premiums 1,486,082 9,391,096 10,877,178 1,294,218 7,479,681 8,773,899
Contributions and fees 788,434 9,060,081 9,848,515 696,701 12,414,953 13,111,654
Other operating costs 1,596,555 21,119,671 22,716,226 2,604,179 29,554,686 32,158,865
TOTAL 27,340,731 309,448,244 336,788,975 28,625,726 277,485,390 306,111,119

CROATIA OSIGURANJE d.d., Zagreb Notes to the consolidated financial statements
for the year ended 31 December 2011
43
6.6. Other costs
/i/ Other technical insurance costs, net from reinsurance
At 31 Dec 2011 At 31 Dec 2010
Description Life General Total Life General Total
HRK HRK HRK HRK HRK HRK
Cost for preventive activities 0 6,101,039 6,101,039 0 3,271,962 3,271,962
Other technical insurance costs 190,956 78,567,010 78,757,966 305,749 78,906,621 79,212,370
TOTAL 190,956 84,668,049 84,859,005 305,749 82,178,583 82,484,332
/ii/ Other technical insurance costs
At 31 Dec 2011 At 31 Dec 2010
Description Life General Total Life General Total
HRK HRK HRK HRK HRK HRK
Contributions for health insurance from the motor TPL premium 0 48,498,968 48,498,968 0 47,913,182 47,913,182
Contribution for Guarantee fund 0 9,990,620 9,990,620 0 11,205,767 11,205,767
Contribution for fire department 0 7,855,120 7,855,120 0 8,679,498 8,679,498
Contribution for Croatian Insurance Bureau 59,140 3,402,321 3,461,461 0 2,479,072 2,479,072
Contribution for Croatian Financial Services Supervisory Agency 105,526 1,736,505 1,842,031 147,081 1,505,271 1,652,352
Other insurance - technical expenses 26,259 7,447,195 7,473,454 153,004 3,956,332 4,109,336
Subsequently determined expenses 0 0 0 0 752,168 752,168
Other costs 31 5,737,320 5,737,351 5,664 5,687,293 5,692,957
TOTAL 190,956 84,668,049 84,859,005 305,749 82,178,583 82,484,332
6.7. Other costs including value adjustments
At 31 Dec 2011 At 31 Dec 2010
Description Life General Total Life General Total
HRK HRK HRK HRK HRK HRK
Costs of insurance activities 1,142,463 37,098,076 38,240,539 60,845 42,379,871 42,440,716
Costs of non-insurance activities 0 131,783,423 131,783,423 0 167,721,117 167,721,117
TOTAL 1,142,463 168,881,499 170,023,962 60,845 210,100,988 210,161,833

CROATIA OSIGURANJE d.d., Zagreb Notes to the consolidated financial statements
for the year ended 31 December 2011
44
/i/ Costs of non-insurance activities
Description 2011
2010
HRK
HRK
Costs of material, raw material and energy
6,330,244
5,486,769
Services costs
17,196,530
23,727,873
Depreciation
26,987,549
38,589,117
Employees' costs
32,083,116
32,680,663
Purchase value of sold assets
3,968,502
4,516,572
Value adjustment
4,788,877
20,405,397
Provisions
37,164
0
Interest costs
11,182,818
20,014,899
Other costs
29,208,623
22,299,827
TOTAL
131,783,423
167,721,117
7. Corporate income tax
Corporate income tax is calculated in accordance with the legal regulations of the countries in which subsidiaries of the Group operate. 8. Earning per share for the Parent company
Description 2011 2010
HRK HRK
Net profit for the period 78,666,745 43,603,886
Less: dividends on preferred shares (980,000) (980,000)
Net profit for the period from ordinary share 77,686,745 42,623,886
Weighted average of ordinary shares, except own shares 307,598 307,598
Earnings per share 252,56 138,58

CROATIA OSIGURANJE d.d., Zagreb Notes to the consolidated financial statements
for the year ended 31 December 2011
45
NOTES TO THE BALANCE SHEET
9. Intangible assets
Description Founding costs Development
costs Other intangible
assets
Intangible assets under construction Total
HRK HRK HRK HRK HRK
Purchase value
Balance at 1 January 2010 2,223,653 14,296,456 79,493,574 920,558 96,934,241
Correction of opening balance (109,373) 0 (1,007,667) 302,797 (814,243)
Additions 0 236,994 3,732,439 5,799,216 9,768,649
Sale and disposals 0 (15,775) (2,255,451) (651,057) (2,922,283)
Balance at 31 December 2010 2,114,280 14,517,675 79,962,895 6,371,514 102,966,364
Correction of opening balance (2,058,997) 0 2,203,788 3,992 148,783
Additions 0 757,909 5,951,440 (4,825,877) 1,883,472
Sale and disposals 0 0 (3,402,130) (5,409) (3,407,539)
Balance at 31 December 2011 55,283 15,275,584 84,715,993 1,544,220 101,591,080
Impairment
Balance at 1 January 2010 264,528 10,671,011 63,884,885 0 74,820,424
Correction of opening balance (92,706) 0 (1,430,512) 0 (1,523,218)
Depreciation during 2010 61,497 1,308,885 4,424,421 0 5,794,803
Sale and disposals 0 (15,775) (1,562,823) 0 (1,578,598)
Balance at 31 December 2010 233,319 11,964,121 65,315,971 0 77,513,411
Correction of opening balance (178,419) 0 230,346 0 51,927
Depreciation during 2011 0 1,394,125 4,738,377 0 6,132,502
Sale and disposals 0 0 (3,212,125) 0 (3,212,125)
Balance at 31 December 2011 54,900 13,358,246 67,072,569 0 80,485,715
Current value
1 January 2010 1,959,125 3,625,445 15,608,689 920,558 22,113,817
31 December 2010 1,880,961 2,553,554 14,646,924 6,371,514 25,452,953
31 December 2011 383 1,917,338 17,643,424 1,544,220 21,105,365

CROATIA OSIGURANJE d.d., Zagreb Notes to the consolidated financial statements
for the year ended 31 December 2011
46
10. Operational land and buildings
/i/ Immovables
Description Land Buildings Assets under construction Prepayments Total
HRK HRK HRK HRK HRK
PURCASHE VALUE
Balance at 1 January 2010 268,690,230 1,332,031,618 25,677,324 3,972,619 1,630,371,791
Correction of opening balance 21,022 (905,504) 4,717 0 (879,765)
Revaluation 0 1,917,591 0 0 1,917,591
Addition 6,161,971 1,075,545 23,165,400 14,111,826 44,514,742
Transfer from assets under construction 0 20,238,542 (31,144,204) (15,225,181) (26,130,843)
Transfer from/to 0 (15,689) 0 0 (15,689) Transfer from non-operational land and buildings 0 6,766,874 0 0 6,766,874 Transfer to non-operational land and buildings 3,120,542 (7,881,944) 0 0 (4,761,402)
Sale and disposals 0 (1,220) 0 0 (1,220)
Balance at 31 December 2010 277,993,765 1,353,225,813 17,703,237 2,859,264 1,651,782,079
Correction of opening balance 38,666 1,228,350 9,017 99,067 1,375,100
Revaluation 855,606 16,147,438 0 0 17,003,044
Addition 595,356 389,352 14,206,160 280,994 15,471,862
Transfer from assets under construction 0 4,291,208 (4,291,208) 0 0
Transfer from/to (4,066,765) (2,518,210) (8,971,744) (4,157) (15,560,876) Transfer from non-operational land and buildings 389,947 2,098,933 0 0 2,488,880 Transfer to non-operational land and buildings (800,158) (9,444,529) 0 0 (10,244,687)
Sale and disposals (3,904,279) (29,022) 0 0 (3,933,301)
Balance at 31 December 2011 271,102,138 1,365,389,333 18,655,462 3,235,168 1,658,382,101
IMPAIRMENT
Balance at 1 January 2010 12,595,834 230,616,938 0 0 243,212,772
Correction of opening balance (12,595,834) 12,564,800 0 0 (31,034)
Depreciation to the revaluation effect 0 6,682,980 0 0 6,682,980
Depreciation during 2010 0 27,249,312 0 0 27,249,312
Transfer from /to 0 (112,900) 0 0 (112,900) Transfer to non-operational land and buildings 0 (1,732,354) 0 0 (1,732,354)
Disposals 0 (1,222) 0 0 (1,222)
Balance at 31 December 2010 0 275,267,551 0 0 275,267,551
Correction of opening balance 0 155,140 0 0 155,140
Depreciation to the revaluation effect 0 5,787,939 0 0 5,787,939
Depreciation during 2010 0 28,239,368 0 0 28,239,368 Transfer to non-operational land and buildings 0 (2,536,397) 0 0 (2,536,397)
Sale and disposals 0 (25,037) 0 0 (25,037)
Balance at 31 December 2011 0 306,888,568 0 0 306,888,568
CURRENT VALUE
1 January 2010 256,094,396 1,101,414,680 25,677,324 3,972,619 1,387,159,019
31 December 2010 277,993,765 1,077,958,262 17,703,237 2,859,264 1,376,514,528
31 December 2011 271,102,138 1,058,500,763 18,655,462 3,235,168 1,351,493,533

CROATIA OSIGURANJE d.d., Zagreb Notes to the consolidated financial statements
for the year ended 31 December 2011
47
11. Investments
At 31 Dec 2011 At 31 Dec 2010
Description Life General Total Life General Total
HRK HRK HRK HRK HRK HRK
Investment in non- operational land and buildings 437,198 968,976,989 969,414,187 0 816,718,189 816,718,189 Investments in subsidiaries, associates and joint ventures 0 17,607,194 17,607,194 0 19,140,022 19,140,022
Other financial investments 2,022,797,759 2,747,675,815 4,770,473,574 2,013,905,095 2,861,212,266 4,875,117,361
TOTAL 2,023,234,957 3,734,259,998 5,757,494,955 2,013,905,095 3,697,070,477 5,710,975,572
11.1. Investment in non-operational land and buildings
/i/ Investment at acquisition cost
Description Land Buildings Assets under construction Total
HRK HRK HRK HRK
PURCASHE VALUE
Balance at 1 January 2010 25,430,592 129,628,000 5,198,951 160,257,542
Additions 56,959 (3,454,079) (5,071,667) (8,468,787)
Transfer from preparation 0 0 (10,644) (10,644)
Transfer to operational land and buildings (4,608,896) 0 0 (4,608,896)
Sale and disposals 0 (150,471) 0 (150,471)
Balance at 31 December 2010 20,878,656 126,023,450 116,640 147,018,746
Additions 1,672,759 1,573,615 4,191,214 7,437,588
Transfer from preparation 0 4,184,783 (4,184,783) 0
Transfer from operational land and buildings 800,158 10,404,741 0 11,204,899
Sale and disposals 0 (821,233) 0 (821,233)
Balance at 31 December 2011 23,351,573 141,365,356 123,071 164,840,000
IMPAIRMENT
Balance at 1 January 2010 0 13,592,344 0 13,592,344
Depreciation during 2010 0 3,067,251 0 3,067,251
Balance at 31 December 2010 0 16,659,595 0 16,659,595
Depreciation during 2011 0 2,957,643 0 2,957,643
Sale and disposals 0 (268,263) 0 (268,263)
Balance at 31 December 2011 0 19,348,974 0 19,348,974
CURRENT VALUE
1 January 2010 25,430,593 116,035,655 5,198,951 146,665,200
31 December 2010 20,878,656 109,363,855 116,640 130,359,151
31 December 2011 23,351,573 122,016,381 123,071 145,491,025

CROATIA OSIGURANJE d.d., Zagreb Notes to the consolidated financial statements
for the year ended 31 December 2011
48
/ii/ at fair value through P&L account
Description Investments
HRK
Balance at 1 January 2010 653,700,604
Correction of the opening balance (3,835,779)
Transfer to operational land and buildings (2,463,211)
Transfer from operational land and buildings 15,783,020
Increase in fair value recognized in the statement of income 5,137,070
Decrease in fair value debited to the statement of income (32,676,564)
Additions during the year 55,785,202
Non-operational property in preparation 11,801,447
Sold during the year (16,872,752)
Balance at 31 December 2010 686,359,037
Correction of opening balance (20,174)
Transfer to operational land and buildings (6,165,310)
Transfer from operational land and buildings 6,133,378 Increase in fair value recognized in the statement of comprehensive income 56,199,957 Decrease in fair value debited to the statement of comprehensive income (27,837,087)
Non-operational property in preparation 4,238,016
Additions during the year 105,600,229
Sold during the year (584,884)
Balance at 31 December 2011 823,923,162
11.2. Investments in subsidiaries, associates and joint ventures
At 31 Dec 2011 At 31 Dec 2010
Description Life General Total Life General Total
HRK HRK HRK HRK HRK HRK
Shares and stakes in subsidiaries 0 0 0 0 429,012 429,012
Shares and stakes in associates 0 16,294,632 16,294,632 0 17,891,112 17,891,112
Participation in joint ventures 0 1,312,562 1,312,562 0 819,898 819,898
TOTAL 0 17,607,194 17,607,194 0 19,140,022 19,140,022

CROATIA OSIGURANJE d.d., Zagreb Notes to the consolidated financial statements
for the year ended 31 December 2011
49
/i/ Shares and stakes in subsidiaries
/ii/ Shares and stakes in associates
At 31 Dec 2011 At 31 Dec 2010
Ownership Investment Ownership Investment
Description Activity State
value
value
% HRK % HRK
Autoprijevoz d.d., Otočac Transport Croatia 32.78% 2,966,400 32.78% 4,449,600
Brioni d.d., Pula Trade Croatia 25.57% 4,259,700 25.57% 4,259,700
Strmec projekt d.o.o. Purchase and sale of own properties Croatia 49.76% 8,513,332 49.76% 8,513,332
STP Agroservis d.o.o. MOT test station Croatia 37.00% 555,200 37.00% 555,200
Reumal d.o.o. Fojnica Center for medical rehabilitation B&H 0% 0 2.79% 113,280
TOTAL
16,294,632
17,891,112
/iii/ Participation in joint ventures
At 31 Dec 2011 At 31 Dec 2010
Description State Investment Investment
value value
HRK HRK
Nacionalni biro za osiguranje, Skopje Macedonia 1,173,369 680,705
Potraživanja za udružena sredstva H.U.O. Croatia 139,193 139,193
TOTAL 1,312,562 819,898
At 31 Dec 2011 At 31 Dec 2010
Ownership Investment Ownership Investment
Description Activity State
value
value
% HRK % HRK
Zagos d.o.o. in liquidation, Zabok Insurance agency Croatia 0% 0 100% 429,012
TOTAL
0 429,012

CROATIA OSIGURANJE d.d., Zagreb Notes to the consolidated financial statements
for the year ended 31 December 2011
50
11.3. Other financial investments
At 31 Dec 2011 At 31 Dec 2010
Description Life General Total Life General Total
HRK HRK HRK HRK HRK HRK
Investments held to maturity 1,312,794,201 918,652,533 2,231,446,734 1,229,341,654 793,103,148 2,022,444,802
Investments available for sale 60,422,034 198,835,404 259,257,438 115,155,930 324,509,104 439,665,034 Investments at fair value through P&L account 200,501,903 383,929,651 584,431,554 180,044,882 312,855,268 492,900,150
Deposits, loans and receivables 449,079,621 1,246,258,227 1,695,337,848 489,362,629 1,430,744,746 1,920,107,375
TOTAL 2,022,797,759 2,747,675,815 4,770,473,574 2,013,905,095 2,861,212,266 4,875,117,361
/i/ Investments held to maturity
At 31 Dec 2011 At 31 Dec 2010
Description Life General Total Life General Total
HRK HRK HRK HRK HRK HRK Debt and other securities with fixed income
State bonds 1,154,961,020 609,097,711 1,764,058,731 1,061,216,726 540,497,688 1,601,714,414
Corporate bonds 35,790,852 142,516,621 178,307,473 60,463,734 132,116,208 192,579,942
Local government bonds 4,301,384 0 4,301,384 4,717,611 0 4,717,611
Total 1,195,053,256 751,614,332 1,946,667,588 1,126,398,071 672,613,896 1,799,011,967
Treasury bills 94,282,749 161,413,762 255,696,512 63,336,140 100,224,500 163,560,640
Commercial bills 23,458,196 5,624,438 29,082,634 39,607,443 20,264,752 59,872,195
TOTAL 1,312,794,201 918,652,533 2,231,446,734 1,229,341,654 793,103,148 2,022,444,802
/ii/ Investment available for sale
At 31 Dec 2011 At 31 Dec 2010
Description Life General Total Life General Total
HRK HRK HRK HRK HRK HRK
Shares, stakes and other securities with variable income
- listed shares 24,314,237 80,129,730 104,443,967 54,417,013 162,010,790 216,427,803
- non listed shares 0 39,786,690 39,786,690 0 43,900,559 43,900,559
24,314,237 119,916,420 144,230,657 54,417,013 205,911,349 260,328,362
Stakes in investment funds 36,107,797 78,918,984 115,026,781 60,738,917 118,597,755 179,336,672
TOTAL 60,422,034 198,835,404 259,257,438 115,155,930 324,509,104 439,665,034
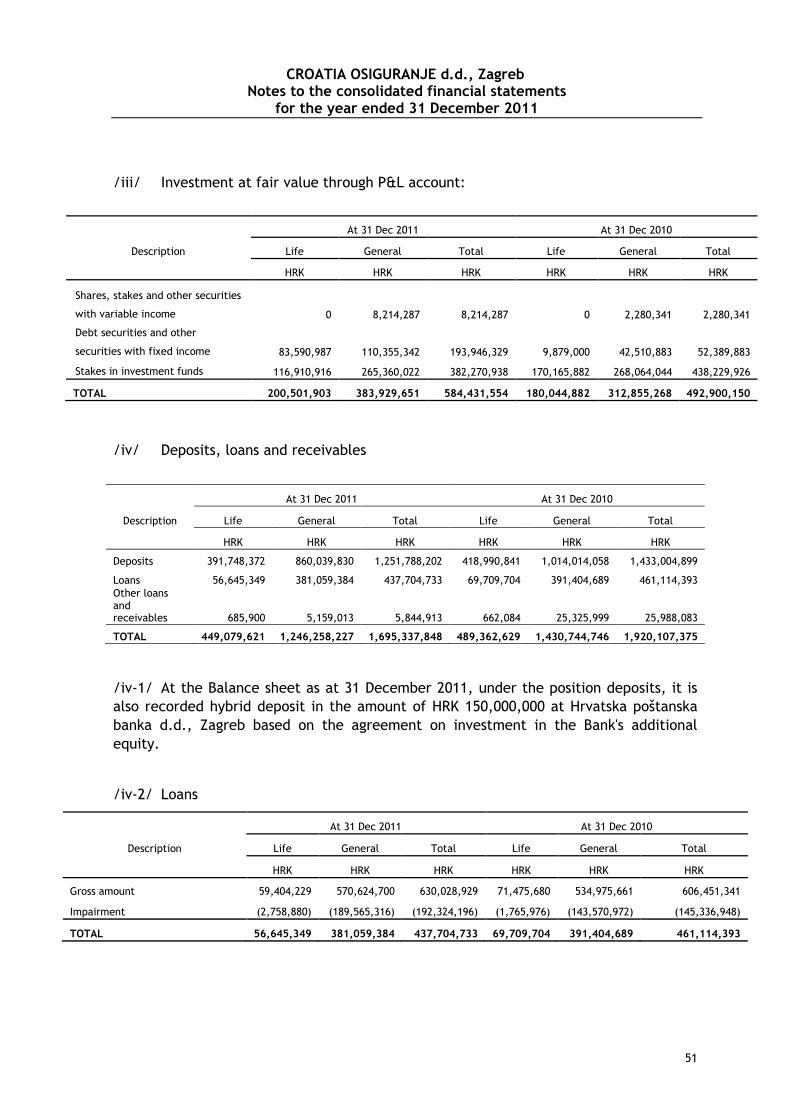
CROATIA OSIGURANJE d.d., Zagreb Notes to the consolidated financial statements
for the year ended 31 December 2011
51
/iii/ Investment at fair value through P&L account:
At 31 Dec 2011 At 31 Dec 2010
Description Life General Total Life General Total
HRK HRK HRK HRK HRK HRK
Shares, stakes and other securities
with variable income 0 8,214,287 8,214,287 0 2,280,341 2,280,341
Debt securities and other
securities with fixed income 83,590,987 110,355,342 193,946,329 9,879,000 42,510,883 52,389,883
Stakes in investment funds 116,910,916 265,360,022 382,270,938 170,165,882 268,064,044 438,229,926
TOTAL 200,501,903 383,929,651 584,431,554 180,044,882 312,855,268 492,900,150
/iv/ Deposits, loans and receivables
At 31 Dec 2011 At 31 Dec 2010
Description Life General Total Life General Total
HRK HRK HRK HRK HRK HRK
Deposits 391,748,372 860,039,830 1,251,788,202 418,990,841 1,014,014,058 1,433,004,899
Loans 56,645,349 381,059,384 437,704,733 69,709,704 391,404,689 461,114,393 Other loans and receivables 685,900 5,159,013 5,844,913 662,084 25,325,999 25,988,083
TOTAL 449,079,621 1,246,258,227 1,695,337,848 489,362,629 1,430,744,746 1,920,107,375
/iv-1/ At the Balance sheet as at 31 December 2011, under the position deposits, it is also recorded hybrid deposit in the amount of HRK 150,000,000 at Hrvatska poštanska banka d.d., Zagreb based on the agreement on investment in the Bank's additional equity.
/iv-2/ Loans
At 31 Dec 2011 At 31 Dec 2010
Description Life General Total Life General Total
HRK HRK HRK HRK HRK HRK
Gross amount 59,404,229 570,624,700 630,028,929 71,475,680 534,975,661 606,451,341
Impairment (2,758,880) (189,565,316) (192,324,196) (1,765,976) (143,570,972) (145,336,948)
TOTAL 56,645,349 381,059,384 437,704,733 69,709,704 391,404,689 461,114,393

CROATIA OSIGURANJE d.d., Zagreb Notes to the consolidated financial statements
for the year ended 31 December 2011
52
Maturities of granted loans are shown as follows:
At 31 Dec 2011 At 31 Dec 2010
Description Life General Total Life General Total
HRK HRK HRK HRK HRK HRK
Up to 1 year 38,332,658 321,632,893 359,965,551 38,758,271 256,311,525 295,069,796
1 – 5 years 9,990,437 53,673,386 63,663,823 22,317,057 129,381,231 151,698,288
Over 5 years 8,322,254 5,753,105 14,075,359 8,634,376 5,711,933 14,346,309
TOTAL 56,645,349 381,059,384 437,704,733 69,709,704 391,404,689 461,114,393
Loan structure according to collaterals is shown as follows:
At 31 Dec 2011 At 31 Dec 2010
Description Life General Total Life General Total
HRK HRK HRK HRK HRK HRK Guarantees from business banks 0 12,421,961 12,421,961 460,708 21,094,448 21,555,156 Life insurance policies with restricted transferability 46,310,556 0 46,310,556 55,647,466 0 55,647,466 Mortgages and property fiduciaries 7,709,840 368,441,985 376,151,825 7,899,297 368,434,719 376,334,016 Other insurance instruments 2,624,953 195,438 2,820,391 5,702,233 1,875,522 7,577,755
TOTAL 56,645,349 381,059,384 437,704,733 69,709,704 391,404,689 461,114,393

CROATIA OSIGURANJE d.d., Zagreb Notes to the consolidated financial statements
for the year ended 31 December 2011
53
11.4. Investment term structure
Review of investment term structure at 31 December 2011:
LIFE GENERAL TOTAL
Up to 1 year 1-3 years 3-5 years 5-10 years
Total Up to 1 year 1-3 years 3-5 years 5-10 years
Total Up to 1 year 1-3 years 3-5 years 5-10 years
Total
Property investment 0 0 0 437,198 437,198 123,071 0 0 968,853,918 968,976,989 123,071 0 0 969,291,116 969,414,187
Investment in subsidiaries and associates
0 0 0 0 0 9,825,893 0 0 7,7810,300 17,607193 9,825,893 0 0 7,7810,300 17,607,194
Bonds 276,945,026 240,741,125 172,927,733 504,439,372 1,195,053,256 276,871,845 344,493,460 74,828,557 174,178,275 870,372,137 553,816,872 585,234,585 247,756,290 678,617,646 2,065,425,393
Treasury bills 1,708,701 0 0 0 1,708,701 48,280,396 0 0 0 48,280,396 49,989,097 0 0 0 49,989,097
Commercial bills 18,709,804 0 0 0 18,709,804 0 0 0 0 0 18,709,804 0 0 0 18,709,804
Other investments 97,322,440 0 0 0 97,322,440 0 0 0 0 0 97,322,440 0 0 0 97,322,440
Investment held to maturity
394,685,971 240,741,125 172,927,733 504,439,372 1,312,794,201 325,152,241 344,493,460 74,828,557 174,178,275 918,652,533 719,838,212 585,234,585 247,756,290 678,617,647 2,231,446,734
Shares 0 24,314,237 0 0 24,314,237 14,051,514 27,575,298 17,189,190 24,430,074 83,246,076 14,051,514 51,889,535 17,189,190 24,430,074 107,560,313
Stakes in funds 6,806,268 23,733,529 5,568,000 0 36,107,797 15,285,633 19,463,498 42,402,866 1,766,987 78,918,984 22,091,901 43,197,027 47,970,866 1,766,987 115,026,781
Stakes in trade companies 0 0 0 0 0 0 36,670,344 0 0 36,670,344 0 36,670,344 0 0 36,670,344
Investments available for sale
6,806,268 48,047,766 5,568,000 0 60,422,034 29,337,147 83,709,140 59,592,056 26,197,061 198,835,404 36,143,415 131,756,906 65,160,056 26,197,061 259,257,438
Bonds 0 0 14,913,997 68,676,990 83,590,987 0 4,867,500 24,503,997 68,457,344 97,828,841 0 4,867,500 39,417,994 137,134,334 181,419,828
Shares 0 0 0 0 0 5,254,204 2,959,701 0 0 8,213,905 5,254,204 2,959,701 0 0 8,213,905
Treasury bills 0 0 0 0
123,620,886 0 0 0 123,620,886 123,620,886 0 0 0 123,620,886
Stakes in funds 116,910,916 0 0 0 116,910,916 153,918,609 0 347,028 0 154,265,637 270,829,525 0 347,028 0 271,176,553
Investment at fair value through P&L account
116,910,916 0 14,913,997 68,676,990 200,501,903 282,793,699 7,827,201 24,851,025 68,457,344 383,929,269 399,704,615 7,827,201 39,765,022 137,134,334 584,431,172
Deposits at banks 223,602,441 148,915,013 11,363,831 7,867,086 391,748,371 588,336,644 271,703,185 0 0 860,039,829 811,939,084 420,618,199 11,363,831 7,867,086 1,251,788,201
Loans 43,040,252 2,815,836 2,467,010 8,322,251 56,645,349 112,525,759 236,651,769 28,026,584 3,855,275 381,059,387 155,566,011 239,467,605 30,493,595 12,177,524 437,704,734
Other loans, receivables 685,901 0 0 0 685,901 4,435,959 723,055 0 0 5,159,014 5,121,860 723,054 0 0 5,844,914
Deposits, loans and receivables
267,328,594 151,730,849 13,830,841 16,189,337 449,079,621 705,298,362 509,078,009 28,026,584 3,855,275 1,246,258,230 972,626,956 660,808,858 41,857,425 20,044,612 1,695,337,851
TOTAL 785,731,749 440,519,740 207,240,571 589,742,897 2,023,234,957 1,352,530,413 945,107,810 187,298,222 1,249,323,553 3,734,259,998 2,138,262,162 1,385,627,550 394,538,793 1,839,066,450 5,757,494,955

CROATIA OSIGURANJE d.d., Zagreb Notes to the consolidated financial statements
for the year ended 31 December 2011
54
Review of investment term structure at 31 December 2010:
LIFE GENERAL TOTAL
Up to 1 year 1-3 years 3-5 years 5-10 years
Total Up to 1 year 1-3 years 3-5 years 5-10 years
Total Up to 1 year 1-3 years 3-5 years 5-10 years
Total
Property investment 0 0 0 0 0 116,639 0 0 816,601,550 816,718,189 116,639 0 0 816,601,550 816,718,189 Investment in subsidiaries and associates 0 0 0 0 0 680,705 0 139,192 18,320,125 19,140,022 680,705 0 139,192 18,320,125 19,140,022
Bonds 42,630,629 284,278,915 350,295,558 449,192,970 1,126,398,072 157,635,415 247,450,059 163,300,440 87,927,470 656,313,384 200,266,044 531,728,974 513,595,998 537,120,440 1,782,711,456
Treasury bills 63,336,140 0 0 0 63,336,140 100,224,500 0 0 0 100,224,500 163,560,640 0 0 0 163,560,640
Commercial bills 39,607,443 0 0 0 39,607,443 20,264,753 0 0 0 20,264,753 59,872,196 0 0 0 59,872,196
Other investments 0 0 0 0 0 185,853 91,191 1,892,948 14,130,520 16,300,512 185,853 91,191 1,892,948 14,130,520 16,300,512 Investment held to maturity 145,574,212 284,278,915 350,295,558 449,192,970 1,229,341,655 278,310,521 247,541,250 165,193,388 102,057,990 793,103,149 423,884,733 531,820,165 515,488,947 551,250,960 2,022,444,804
Shares 0 54,417,013 0 0 54,417,013 25,131,148 35,286,409 106,819,224 276,500 167,513,281 25,131,148 89,703,422 106,819,224 276,500 221,930,294
Stakes in funds 0 18,383,925 42,354,992 0 60,738,917 1,304,770 32,826,765 38,253,409 46,212,812 118,597,756 1,304,770 51,210,690 80,608,401 46,212,812 179,336,673
Stakes in trade companies 0 0 0 0 0 0 0 38,398,067 0 38,398,067 0 0 38,398,067 0 38,398,067 Investments available for sale 0 72,800,938 42,354,992 0 115,155,930 26,435,918 68,113,174 183,470,700 46,489,312 324,509,104 26,435,918 140,914,112 225,825,692 46,489,312 439,665,034
Bonds 0 0 0 9,879,000 9,879,000 0 1,084,593 0 27,022,884 28,107,477 0 1,084,593 0 36,901,884 37,986,477
Shares 0 0 0 0 0 1,195,364 0 0 0 1,195,364 1,195,364 0 0 0 1,195,364
Treasury bills 0 0 0 0 0 15,488,383 0 0 0 15,488,383 15,488,383 0 0 0 15,488,383
Stakes in funds 170,165,882 0 0 0 170,165,882 196,850,220 71,213,824 0 0 268,064,044 367,016,102 71,213,825 0 0 438,229,926 Investment at fair value through P&L account 170,165,882 0 0 9,879,000 180,044,882 213,533,967 72,298,418 0 27,022,884 312,855,268 383,699,849 72,298,417 0 36,901,884 492,900,150
Deposits at banks 357,461,634 58,009,459 3,519,749 0 418,990,842 808,341,125 55,834,450 100,000,000 50,000,000 1,014,175,575 1,165,802,759 113,843,909 103,519,749 50,000,000 1,433,166,417
Loans 49,490,860 1,650,901 18,567,941 0 69,709,702 285,176,285 105,024,131 969,914 234,361 391,404,691 334,667,145 106,675,032 19,537,855 234,361 461,114,393
Other loans, receivables 662,084 0 0 0 662,084 2,642,270 5,326,301 1,334,438 15,861,470 25,164,479 3,304,354 5,326,301 1,334,438 15,861,470 25,826,563 Deposits, loans and receivables 407,614,578 59,660,360 22,087,690 0 489,362,628 1,096,159,680 166,184,882 102,304,352 66,095,831 1,430,744,745 1,503,774,258 225,845,242 124,392,042 66,095,831 1,920,107,373
TOTAL 723,354,672 416,740,213 414,738,240 459,071,970 2,013,905,095 1,615,237,430 554,137,723 451,107,632 1,076,587,692 3,697,070,477 2,338,592,102 970,877,936 865,845,872 1,519,798,192 5,710,975,572

CROATIA OSIGURANJE d.d., Zagreb Notes to the consolidated financial statements
for the year ended 31 December 2011
55
11.5. Investment currency structure Review of investment currency structure at 31 December 2011:
Description
LIFE GENERAL TOTAL
Domestic currency
Foreign currency and curr. clause
(amount in HRK)
Foreign currency and curr. clause (amount in
HRK)
TOTAL (amount in HRK)
Domestic currency Foreign currency and curr. clause (amount in
HRK)
Foreign currency and curr. clause (amount in
HRK)
TOTAL (amount in HRK)
Domestic currency
Foreign currency and curr. clause
(amount in HRK)
Foreign currency and curr. clause (amount in
HRK)
TOTAL (amount in HRK)
HRK EUR OTHER CURRENCIES
HRK HRK EUR OTHER CURRENCIES
HRK HRK EUR OTHER CURRENCIES
HRK
Investments in subsidiaries and associates 0 0 0 0 14,638,872 1,794,953 1,173,369 17,607,194 14,638,872 1,794,953 1,173,369 17,607,194
Property investments 0 0 437,198 437,198 910,209,635 0 58,767,354 968,976,989 910,209,635 0 59,204,552 969,414,187
Bonds 179,059,610 1,015,993,646 0 1,195,053,256 417,222,880 441,988,190 11,161,068 870,372,137 596,282,490 1,457,981,836 11,161,068 2,065,425,393
Treasury bills 92,574,048 0 1,708,701 94,282,749 35,179,258 7,085,703 6,015,434 48,280,395 127,753,306 7,085,704 7,724,135 142,563,145
Commercial bills 11,685,532 11,772,664 0 23,458,196 0 0 0 0 11,685,532 11,772,664 0 23,458,196
Other investments 0 0 0 0 0 0 0 0 0 0 0 0
Investment held to maturity 283,319,190 1,027,766,310 1,708,701 1,312,794,201 452,402,137 449,073,893 17,176,502 918,652,533 735,721,327 1,476,840,204 18,885,203 2,231,446,734
Shares 24,314,237 0 0 24,314,237 81,357,326 83,705 1,805,045 83,246,076 105,671,563 83,705 1,805,045 107,560,313
Stakes in funds 9,242,743 26,865,053 0 36,107,796 61,238,705 17,680,278 0 78,918,983 70,481,448 44,545,331 0 115,026,779
Stakes in trade companies 0 0 0 0 36,670,344 0 0 36,670,344 36,670,344 0 0 36,670,344
Investments available for sale 33,556,980 26,865,053 0 60,422,033 179,266,375 17,763,983 1,805,045 198,835,403 212,823,355 44,629,036 1,805,045 259,257,438
Bonds 14,404,500 69,186,487 0 83,590,987 52,752,500 45,076,341 0 97,828,841 67,157,000 114,262,828 0 181,419,828
Shares 0 0 0 0 8,214,287 0 0 8,214,287 8,214,287 0 0 8,214,287
Treasury bills 0 0 0 0 12,526,501 0 0 12,526,501 12,526,501 0 0 12,526,501
Stakes in funds 104,676,775 12,234,141 0 116,910,916 254,861,231 10,151,763 347,028 265,360,022 359,538,006 22,385,904 347,028 382,270,937
Investment at fair value through P&L account 119,081,275 81,420,628 0 200,501,903 328,354,519 55,228,104 347,028 383,929,651 447,435,793 136,648,732 347,028 584,431,554
Deposits at banks 300,000,000 66,589,633 25,158,739 391,748,372 643,753,112 140,322,368 75,964,350 860,039,830 943,753,112 206,911,901 101,123,089 1,251,788,102
Loans to insured 6,565,373 36,474,879 13,605,097 56,645,349 380,567,222 0 492,163 381,059,385 387,132,595 36,474,879 14,097,259 437,704,733
Other loans and receivables 0 685,901 685,901 629,683 29,909 4,499,422 5,159,014 629,683 29,909 5,185,323 5,844,915
Deposits, loans and receivables 306,565,373 103,064,512 39,449,737 449,079,622 1,024,950,017 140,352,277 80,955,935 1,246,258,229 1,331,515,390 243,416,689 120,405,671 1,695,337,750
TOTAL 742,522,818 1,239,116,503 41,595,636 2,023,234,957 2,909,821,555 664,213,210 160,225,233 3,734,259,998 3,652,344,371 1,903,329,714 201,820,869 5,757,494,955

CROATIA OSIGURANJE d.d., Zagreb Notes to the consolidated financial statements
for the year ended 31 December 2011
56
Review of investment currency structure at 31 December 2010:
Description
LIFE GENERAL TOTAL
Domestic currency
Foreign currency and curr. clause (amount in
HRK)
Foreign currency and curr. clause
(amount in HRK)
TOTAL (amount in
HRK)
Domestic currency
Foreign currency and curr. clause (amount in HRK)
Foreign currency and curr. clause
(amount in HRK)
TOTAL (amount in
HRK)
Domestic currency
Foreign currency and curr. clause (amount in
HRK)
Foreign currency and curr. clause
(amount in HRK) TOTAL
HRK EUR OTHER CURRENCIES
HRK HRK EUR OTHER CURRENCIES
HRK HRK EUR OTHER CURRENCIES
HRK
Investments in subsidiaries and associates 0 0 0 0 18,346,420 0 793,985 19,140,405 18,346,420 0 793,985 19,140,405
Property investments 0 0 0 0 769,881,792 0 46,836,398 816,718,190 769,881,792 0 46,836,398 816,718,190
Bonds 203,647,011 875,197,169 47,553,892 1,126,398,071 224,799,686 430,717,064 796,634 656,313,385 428,446,697 1,305,914,234 48,350,526 1,782,711,456
Treasury bills 63,336,140 0 0 63,336,140 82,949,262 0 17,275,238 100,224,500 146,285,402 0 17,275,238 163,560,640
Commercial bills 22,252,443 17,355,000 0 39,607,443 20,264,753 0 0 20,264,753 42,517,196 17,355,000 0 59,872,196
Other investments 0 0 0 0 0 16,300,511 0 16,300,511 0 16,300,511 0 16,300,511
Investment held to maturity 289,235,594 892,552,169 47,553,892 1,229,341,654 328,013,700 447,017,575 18,071,872 793,103,148 617,249,294 1,339,569,745 65,625,764 2,022,444,802
Shares 54,417,013 0 0 54,417,013 141,900,967 481,166 25,131,148 167,513,281 196,317,980 481,166 25,131,148 221,930,294
Stakes in funds 29,155,440 31,583,477 0 60,738,917 47,141,897 71,080,173 375,685 118,597,756 76,297,337 102,663,651 375,685 179,336,673
Stakes in trade companies 0 0 0 0 38,398,067 0 0 38,398,067 38,398,067 0 0 38,398,067
Investments available for sale 83,572,453 31,583,477 0 115,155,931 227,440,930 71,561,340 25,506,834 324,509,104 311,013,384 103,144,817 25,506,834 439,665,034
Bonds 9,879,000 0 0 9,879,000 28,107,093 0 0 28,107,093 37,986,093 0 0 37,986,093
Shares 0 0 0 0 1,195,366 0 0 1,195,366 1,195,366 0 0 1,195,366
Treasury bills 0 0 0 0 15,488,383 0 0 15,488,383 15,488,383 0 0 15,488,383
Stakes in funds 145,184,178 24,981,704 0 170,165,882 238,570,136 29,493,909 0 268,064,044 383,754,314 54,475,613 0 438,229,927
Investment at fair value through P&L account 155,063,178 24,981,704 0 180,044,882 283,360,977 29,493,909 0 312,854,885 438,424,155 54,475,613 0 492,899,768 Deposits at banks
340,000,000 66,181,589 12,809,253 418,990,842 648,097,260 354,473,388 11,604,928 1,014,175,576 988,097,260 420,654,977 24,414,181 1,433,166,418 Loans to insured
16,001,241 37,705,957 16,002,505 69,709,703 290,881,869 99,862,375 660,444 391,404,688 306,883,110 137,568,332 16,662,949 461,114,391
Other loans and receivables 0 0 662,084 662,084 0 21,160,677 4,003,803 25,164,480 0 21,160,677 4,665,887 25,826,564
Deposits, loans and receivables 356,001,241 103,887,546 29,473,842 489,362,629 938,979,129 475,496,440 16,269,175 1,430,744,744 1,294,980,370 579,383,986 45,743,017 1,920,107,373
TOTAL 883,872,466 1,053,004,896 77,027,734 2,013,905,096 2,566,022,948 1,023,569,264 107,478,264 3,697,070,476 3,449,895,415 2,076,574,161 184,505,998 5,710,975,572

CROATIA OSIGURANJE d.d., Zagreb Notes to the consolidated financial statements
for the year ended 31 December 2011
57
12. Investments for the account and on risk of the life insurance policyholder
Investment for the account and on the risk of the life insurance policyholder in the amount of HRK 16,320,628 (At 31 December 2010: HRK 22,374,967) relate to the products that combine insurance and investment components for policyholders through the investments of premium in investment funds on behalf of and for the account of policyholders.
13. Reinsurance portion in technical provisions
At 31 Dec 2011 At 31 Dec 2010
Description Life General Total Life General Total
HRK HRK HRK HRK HRK HRK
Unearned premiums, reinsurance portion 138 19,806,023 19,806,161 0 77,653,096 77,653,096
Mathematical reserves, reinsurance portion 164,490 0 164,490 11,607 0 11,607
Claim reserve, reinsurance portion 0 215,781,823 215,781,823 0 92,306,696 92,306,696
Provision for premium returns 0 519,328 519,328 0 617,871 617,871
TOTAL 164,628 236,107,174 236,271,802 11,607 170,577,663 170,589,270
14. Deferred and current tax assets
Deferred and current tax assets in the amount of HRK 6,039,905 (At 31 December 2010: HRK 11,455,228) relate to overpaid corporate income tax in the amount of HRK 42,623, and deferred tax assets in the amount of HRK 5,997,282 (At 31 December 2010: overpaid corporate income tax in the amount of HRK 3,919,713, and deferred tax assets in the amount of HRK 7,535,515).
15. Receivables
At 31 Dec 2011 At 31 Dec 2010
Description Life General Total Life General Total
HRK HRK HRK HRK HRK HRK Receivables from direct insurance activities 162,077 681,383,908 681,545,985 41,306,800 689,902,212 731,209,012 Receivables from reinsurance activities 0 61,234,875 61,234,875 0 29,146,633 29,146,633
Other receivables 10,130,650 272,984,041 283,114,691 6,273,128 339,314,011 345,587,139
TOTAL 10,292,727 1,015,602,824 1,025,895,551 47,579,928 1,058,362,856 1,105,942,784
15.1. Receivables from direct insurance activities
At 31 Dec 2011 At 31 Dec 2010
Description Life General Total Life General Total
HRK HRK HRK HRK HRK HRK
Receivables from insurers 118,331 673,981,679 674,100,010 41,239,595 681,607,349 722,846,944
Receivables from insurance agents 43,746 7,402,229 7,445,975 67,205 8,294,863 8,362,068
TOTAL 162,077 681,383,908 681,545,985 41,306,800 689,902,212 731,209,012

CROATIA OSIGURANJE d.d., Zagreb Notes to the consolidated financial statements
for the year ended 31 December 2011
58
/i/ Receivables from insurers
At 31 Dec 2011 At 31 Dec 2010
Description Life General Total Life General Total
HRK HRK HRK HRK HRK HRK
Written non-invoiced premium 0 288,092,253 288,092,253 0 291,876,869 291,876,869
Invoiced uncollected premium 118,331 693,558,866 693,677,197 41,239,595 659,443,407 700,683,002
Gross premium receivables 118,331 981,651,119 981,769,450 41,239,595 951,320,276 992,559,871
Impairment 0 (307,669,440) (307,669,440) 0 (269,712,927) (269,712,927)
Net premium receivables 118,331 673,981,679 674,100,010 41,239,595 681,607,349 722,846,944
/i/ Term structure of insurance premium receivables, as well as the cover of due and uncollected receivables over 180 days, are shown as follows:
Description
At 31 Dec 2011
HRK
Written non-invoiced premium 288,092,253
Invoiced uncollected premium 693,677,197
Total receivables 981,769,450
Undue and due up to 180 days 651,595,394
Due over 180 days 330,174,056
Total by maturity 981,769,450
Due over 180 days 330,174,056
Impairment (307,669,440)
Unadjusted receivables 22,504,616
Cover of due receivables over 180 days
Claim provision for doubtful receivables 22,504,616
Total cover 22,504,616
15.2. Receivables from coinsurance and reinsurance activities
At 31 Dec 2011 At 31 Dec 2010
Description Life General Total Life General Total
HRK HRK HRK HRK HRK HRK
Commission receivables 0 16,570,268 16,570,268 0 8,033,600 8,033,600
Claim receivables 0 44,656,750 44,656,750 0 21,113,033 21,113,033
Receivables for claims in coinsurance 0 7,857 7,857 0 0 0
TOTAL 0 61,234,875 61,234,875 0 29,146,633 29,146,633

CROATIA OSIGURANJE d.d., Zagreb Notes to the consolidated financial statements
for the year ended 31 December 2011
59
15.3. Other receivables
At 31 Dec 2011 At 31 Dec 2010
Description Life General Total Life General Total
HRK HRK HRK HRK HRK HRK Receivables for other insurance activities 0 29,563,633 29,563,633 0 39,441,426 39,441,426 Receivables for returns on investments 3,943,028 13,160,606 17,103,634 1,774,148 15,395,681 17,169,829
Other receivables 6,187,622 230,259,802 236,447,424 4,498,980 284,476,904 288,975,884
TOTAL 10,130,650 272,984,041 283,114,691 6,273,128 339,314,011 345,587,139
/i/ Receivables from other insurance activities
At 31 Dec 2011 At 31 Dec 2010
Description Life General Total Life General Total
HRK HRK HRK HRK HRK HRK
Recourse receivables 0 43,592,661 43,592,661 0 48,285,991 48,285,991
Impairments of recourse receivables 0 (27,609,998) (27,609,998) 0 (23,956,546) (23,956,546)
0 15,982,663 15,982,663 0 24,329,445 24,329,445
Receivables for international claims 0 13,142,825 13,142,825 0 14,970,361 14,970,361
Impairment 0 (520,748) (520,748) 0 (1,300,025) (1,300,025)
0 12,622,077 12,622,077 0 13,670,336 13,670,336
Other receivables 0 958,893 958,893 0 1,441,645 1,441,645
TOTAL 0 29,563,633 29,563,633 0 39,441,426 39,441,426
/ii/ Receivables for investment returns
At 31 Dec 2011 At 31 Dec 2010
Description Life General Total Life General Total
HRK HRK HRK HRK HRK HRK
Receivables for regular loan interest 1,095,866 31,308,521 32,404,387 763,749 24,521,145 25,284,894
Receivables for regular deposit interest 1,999,714 3,876,002 5,875,716 1,006,051 3,519,734 4,525,785
Receivables for default interest 17,782 18,100,070 18,117,852 4,239 19,494,240 19,498,479
Other interest receivables 829,666 1,235,103 2,064,769 109 846,985 847,094
Impairment 0 (41,359,090) (41,359,090) 0 (32,986,423) (32,986,423)
TOTAL 3,943,028 13,160,606 17,103,634 1,774,148 15,395,681 17,169,829

CROATIA OSIGURANJE d.d., Zagreb Notes to the consolidated financial statements
for the year ended 31 December 2011
60
/iii/ Other receivables
At 31 Dec 2011 At 31 Dec 2010
Description Life General Total Life General Total
HRK HRK HRK HRK HRK HRK
Receivables for sold apartments 0 15,350,179 15,350,179 0 17,743,581 17,743,581
Receivables from operating and financial lease 0 3,253,512 3,253,512 0 10,497,749 10,497,749
Prepayment receivables 0 2,565,273 2,565,273 0 3,414,569 3,414,569
Receivables for assets acquired through fiduciaries 0 76,010,374 76,010,374 0 69,546,950 69,546,950
Trade receivables 0 26,161,400 26,161,400 0 13,750,895 13,750,895
Receivables from the State and State institutions 1,459 2,773,489 2,774,948 0 2,760,071 2,760,071
Receivables from card companies 3,797,447 28,086,152 31,883,599 4,250,611 72,703,603 76,954,214
Receivables obtained through cession 0 17,026,131 17,026,131 0 11,552,219 11,552,219
Receivables from court proceedings 0 5,075,981 5,075,981 0 7,038,806 7,038,806
Other receivables 2,388,716 53,957,311 56,346,027 248,369 75,468,461 75,716,830
TOTAL 6,187,622 230,259,802 236,447,424 4,498,980 284,476,904 288,975,884
16. Other assets
At 31 Dec 2011 At 31 Dec 2010
Description Life General Total Life General Total
HRK HRK HRK HRK HRK HRK
Cash at the bank and in hand 6,052,921 75,750,040 81,802,961 7,387,138 58,049,719 65,436,857
Other 83,125,165 225,775,479 308,900,644 70,093,522 168,398,307 238,491,829
TOTAL 89,178,086 301,525,519 390,703,605 77,480,660 226,448,026 303,928,686
16.1. Cash at the bank and in hand
At 31 Dec 2011 At 31 Dec 2010
Description Life General Total Life General Total
HRK HRK HRK HRK HRK HRK
Cash at business account 3,918,390 75,407,245 79,325,635 1,172,350 57,713,155 58,885,505
Cash funds for coverage of mathematical provision 2,127,973 0 2,127,973 6,205,208 0 6,205,208
Cash in hand 6,558 342,795 349,353 9,580 336,564 346,144
TOTAL 6,052,921 75,750,040 81,802,961 7,387,138 58,049,719 65,436,857
/i/ Cash at business account
At 31 Dec 2011 At 31 Dec 2010
Description Life General Total Life General Total
HRK HRK HRK HRK HRK HRK
Cash at HRK accounts 2,771,273 45,983,458 48,754,731 964,880 35,708,195 36,673,075
Cash at foreign currency accounts 1,147,117 29,423,787 30,570,904 207,470 22,004,960 22,212,430
TOTAL 3,918,390 75,407,245 79,325,635 1,172,350 57,713,155 58,885,505
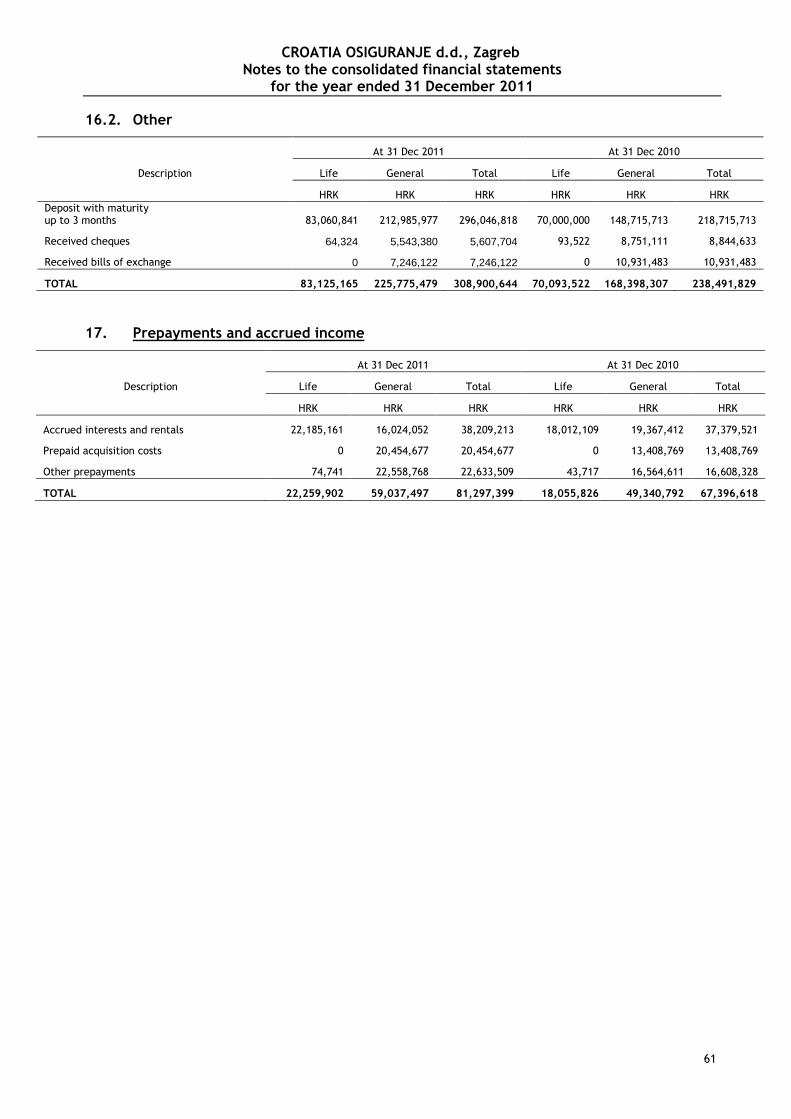
CROATIA OSIGURANJE d.d., Zagreb Notes to the consolidated financial statements
for the year ended 31 December 2011
61
16.2. Other
At 31 Dec 2011 At 31 Dec 2010
Description Life General Total Life General Total
HRK HRK HRK HRK HRK HRK Deposit with maturity up to 3 months 83,060,841 212,985,977 296,046,818 70,000,000 148,715,713 218,715,713
Received cheques 64,324 5,543,380 5,607,704 93,522 8,751,111 8,844,633
Received bills of exchange 0 7,246,122 7,246,122 0 10,931,483 10,931,483
TOTAL 83,125,165 225,775,479 308,900,644 70,093,522 168,398,307 238,491,829
17. Prepayments and accrued income
At 31 Dec 2011 At 31 Dec 2010
Description Life General Total Life General Total
HRK HRK HRK HRK HRK HRK
Accrued interests and rentals 22,185,161 16,024,052 38,209,213 18,012,109 19,367,412 37,379,521
Prepaid acquisition costs 0 20,454,677 20,454,677 0 13,408,769 13,408,769
Other prepayments 74,741 22,558,768 22,633,509 43,717 16,564,611 16,608,328
TOTAL 22,259,902 59,037,497 81,297,399 18,055,826 49,340,792 67,396,618

CROATIA OSIGURANJE d.d., Zagreb Notes to the consolidated financial statements
for the year ended 31 December 2011
62
18. Capital and reserves 18.1. Subscribed capital
Subscribed capital is determined in the nominal amount of HRK 442,887,200 (At 31 December 2010: in the same amount) and consists of 316,348 shares in the nominal value of HRK 1,400, which were entirely paid in cash, and is registered at the Commercial court in Zagreb.
All shares are initial public offering shares and are marked as follows:
• 307,598 shares are ordinary shares marked as CROS-R-A • 8,750 shares are preferred shares marked as CROS-P-A.
Each share, ordinary and preferred, relate to 1 (one) vote at the General Assembly of the Company. All shares are entirely paid, issued in non-material form, are free for transfer and are recorded in depository of the Central Depository and Clearing Company d.d.
Ownership structure as at 31 December 2011 and 31 December 2010 is shown as follows:
At 31 Dec 2011 At 31 Dec 2010
Shareholder Number Amount in % of stakes Number Amount in % of stakes
Of shares HRK In equity Of shares HRK In equity
AUDIO/Republika Hrvatska 253.807 355.329.800 80,23 253.961 355.545.400 80,28
Raiffeisenbank Austria d.d. – custody account 19.692 27.568.800 6,22 19.655 27.517.000 6,21
Hrvatska poštanska banka d.d. - custody account 6.505 9.107.000 2,06 6.904 9.665.600 2,18
Societe Generale - Splitska banka d.d. – custody account 6.441 9.017.400 2,04 6.022 8.430.800 1,90
Privredna banka Zagreb d.d., Zagreb -– custody account 2.753 3.854.200 0,87 2.407 3.369.800 0,76
Zvon ena holding d.d. ( former Julius k.d.d., Maribor) 2.122 2.970.800 0,67 2.122 2.970.800 0,67
Hypo Alpe Adria Bank d.d., Zagreb - custody account 1.497 2.095.800 0,47 1.078 1.509.200 0,34
Kraš d.d., Zagreb 1.400 1.960.000 0,44 1.400 1.960.000 0,44
Erste & Steiermärkische Bank d.d., Rijeka – custody account 1.231 1.723.400 0,39 1.295 1.813.000 0,41
Auto Hrvatska d.d., Zagreb 1.004 1.405.600 0,32 1.004 1.405.600 0,32
Zagrebačka banka d.d. – custody account 711 995.400 0,22 729 1.020.600 0,23
Komercijalna banka Zagreb d.d., Zagreb – in bankruptcy 700 980.000 0,22 700 980.000 0,22
Bahovec Srećko 566 792.400 0,18 558 781.200 0,18
Adriacommerce d.o.o., Split 500 700.000 0,16 500 700.000 0,16
Radić Antun 408 571.200 0,13 408 571.200 0,13
Tankerska plovidba d.d., Zadar 400 560.000 0,13 400 560.000 0,13
Škaro Miroslav 380 532.000 0,12 380 532.000 0,12
Fran Mihaljević - klinika za infektivne bolesti 330 462.000 0,1 330 462.000 0,10
Cemex Hrvatska d.d. 249 348.600 0,08 249 348.600 0,08
Končar-elektroindustrija d.d. 230 322.000 0,07 230 322.000 0,07
Other small shareholders 15.422 21.590.800 4,88 16.016 22.422.400 5,06
UKUPNO 316.348 442.887.200 100,00 316.348 442.887.200 100,00

CROATIA OSIGURANJE d.d., Zagreb Notes to the consolidated financial statements
for the year ended 31 December 2011
63
18.2. Revaluation reserves
Revaluation reserves in the amount of HRK 496,993,709 (At 31 December 2010: HRK 560,772,396) are shown as follows:
At 31 Dec 2011 At 31 Dec 2010
Description Life General Total Life General Total
HRK HRK HRK HRK HRK HRK
Land and buildings (64,994) 520,883,395 520,818,401 0 518,667,184 518,667,184
Financial investments (15,653,736) (15,000,350) (30,654,086) 8,753,985 26,530,844 35,284,829
Other revaluation reserves 0 6,829,394 6,829,395 0 6,820,382 6,820,382
TOTAL (15,718,730) 512,712,439 496,993,709 8,753,985 552,018,410 560,772,395
/i/ Revaluation reserves for lands and buildings:
Description Revaluation of
properties
HRK
Balance at 31 December 2009 524,881,616
Correction of previous period errors (2,969,843)
Transfer to retained earnings (depreciation revaluation) (5,356,680)
Other gains/losses recognized directly in equity 2,112,091
Balance at 31 December 2010 518,667,184
Correction of previous period errors 74,365
Transfer to retained earnings (depreciation revaluation) (6,668,635)
Addition during 2011 7,411,757
Transfer from deferred tax property 1,333,730
Balance at 31 Dec 2011 520,818,401
/ii/ Revaluation reserves of financial investments:
Description Revaluation of
financial investments HRK
Balance at 1 January 2011 (43,213,943)
Correction of previous period errors 62,143
Change in fair value of financial assets available for sale (7,746,521)
Realized losses from financial assets available for sale / net 85,933,879
Other gains / losses recognized directly in equity 249,271
Balance at 31 December 2010 35,284,829
Change in fair value of financial assets available for sale (48,173,323)
Realized losses from financial assets available for sale / net (18,064,979)
Other gains / losses recognized directly in equity 299,387
Balance at 31 December 2011 (30,654,086)

CROATIA OSIGURANJE d.d., Zagreb Notes to the consolidated financial statements
for the year ended 31 December 2011
64
iii/ Other revaluation reserves:
Description Revaluation of
financial investments HRK
Balance at 1 January 2010 10,903,006
Correction of previous period errors (4,620,361)
Other gains / losses recognized directly in equity 537,737
Balance at 31 December 2010 6,820,382
Other gains / losses recognized directly in equity 9,012
Balance at 31 December 2011 6,829,394
18.3. Reserves
Reserves in the amount of HRK 456,466,779 (At 31 December 2010: HRK 443,930,661) were determined by the Decisions of the Company's General assembly from previous years’ profit, and are shown as follows:
Description
At 31 Dec 2011 At 31 Dec 2010
HRK HRK
Legal reserves 19,642,171 17,461,976
Statutory reserves 94,613,780 84,257,858
Other reserves 342,210,828 342,210,827
TOTAL 456,466,779 443,930,661
18.4. Retained earnings
Description Retained earnings
HRK
At 1 January 2011 402,754,919
Correction of previous period errors (39,843)
Transfer of part of 2010 profit 43,749,827
Unrealized gains or losses from tangible property 6,835,588
Other non-ownership changes in equity 2,358,648
At 31 December 2011 455,659,139
18.5. Profit for the year
Profit for the current year was realized in the amount of HRK 107,047,104 (At 31 December 2010: HRK 84,949,765).

CROATIA OSIGURANJE d.d., Zagreb Notes to the consolidated financial statements
for the year ended 31 December 2011
65
19. Technical provision
At 31 Dec 2011 At 31 Dec 2010
Description Life General Total Life General Total
HRK HRK HRK HRK HRK HRK
Unearned premiums, gross 3,929,192 1,114,848,550 1,118,777,742 3,986,675 1,173,196,945 1,177,183,620 Mathematical insurance provision, gross 1,945,987,781 0 1,945,987,781 1,877,152,130 0 1,877,152,130
Claim provision, gross 36,769,501 3,133,643,783 3,170,413,284 42,921,772 3,074,104,217 3,117,025,989 Provision for premium return (bonuses or discounts), gross 0 5,812,976 5,812,976 0 5,977,339 5,977,339 Other insurance-technical provision, gross 0 66,427,000 66,427,000 0 55,757,000 55,757,000
TOTAL 1,986,686,474 4,320,732,309 6,307,418,783 1,924,060,577 4,309,035,501 6,233,096,078
/i/ Claim provision
At 31 Dec 2011 At 31 Dec 2010
Description Life General Total Life General Total
HRK HRK HRK HRK HRK HRK
Provision for registered, non- -liquidated claims 31,738,033 1,816,107,726 1,847,845,759 37,838,195 1,736,519,203 1,774,357,398 Provision for registered claims for unknown motor vehicles 0 (748,124) (748,124) 0 3,074,307 3,074,307 Provision for claims handling costs 412,985 85,531,511 85,944,496 478,515 82,894,407 83,372,922 Provision for occurred unregistered claims (IBNR) 4,618,483 1,232,752,670 1,237,371,153 4,605,062 1,251,616,300 1,256,221,362
TOTAL 36,769,501 3,133,643,782 3,170,413,284 42,921,772 3,074,104,217 3,117,025,989
20. Life insurance technical provisions when the insurer bears risk
Life insurance technical provisions when the insurer bears risk in the amount of HRK 16,320,627 (At 31 December 2010: HRK 22,374,967) were formed for life insurance policies in which the insurer bears investment risk.
21. Other reserves
At 31 Dec 2011 At 31 Dec 2010
Description Life General Total Life General Total
HRK HRK HRK HRK HRK HRK Reserves for pensions and legal court disputes 2,557,348 82,502,608 85,059,956 2,647,001 78,382,881 81,029,882
Other reserves 0 5,411,284 5,411,284 0 6,833,905 6,833,905
TOTAL 2,557,348 87,913,892 90,471,240 2,647,001 85,216,786 87,863,787

CROATIA OSIGURANJE d.d., Zagreb Notes to the consolidated financial statements
for the year ended 31 December 2011
66
/i/ Movements of reserves for pensions and court disputes during 2011 are shown as follows:
Description Court dispute
costs
Jubilee awards and severance
payments Total
HRK HRK HRK
Balance at 1 January 2011 11,615,719 69,414,163 81,029,882
Correction of the opening balance – foreign exchange difference 0 28,602 28,602
Additional provisions 1,786,000 19,539,662 21,325,662
Elimination of provisions (3,173,664) (13,599,690) (16,773,354)
Utilization of provisions (15,806) (535,030) (550,836)
Balance at 31 December 2011 10,212,249 74,847,707 85,059,956
/ii/ Other reserves
At 31 Dec 2011 At 31 Dec 2010
Description Life General Total Life General Total
HRK HRK HRK HRK HRK HRK Other reserves – Residential fund 0 0 0 0 2,836,300 2,836,300
Other reserves 0 5,411,284 5,411,284 0 3,997,605 3,997,605
TOTAL 0 5,411,284 5,411,284 0 6,833,905 6,833,905
22. Deferred and current tax liability
At 31 Dec 2011 At 31 Dec 2010
Description Life General Total Life General Total
HRK HRK HRK HRK HRK HRK
Deferred tax liability 0 122,317,430 122,317,430 0 123,685,469 123,685,469
Current tax liability 55,052 12,527,327 12,582,379 0 5,753,201 5,753,201
TOTAL 55,052 134,844,757 134,899,809 0 129,438,670 129,438,670
Deferred tax liability is recognized under the adjustment to the fair value of operational land and buildings and a part of non-operational land and buildings.

CROATIA OSIGURANJE d.d., Zagreb Notes to the consolidated financial statements
for the year ended 31 December 2011
67
23. Financial liabilities
At 31 Dec 2011 At 31 Dec 2010
Description Life General Total Life General Total
HRK HRK HRK HRK HRK HRK
Loan liabilities 0 84,079,870 84,079,870 0 146,314,015 146,314,015
Other financial liabilities 100,067 4,320,194 4,420,261 144,963 14,747,616 14,892,578
TOTAL 100,067 88,400,064 88,500,131 144,963 161,061,631 161,206,593
/i/ Loan liabilities
Review of loan liabilities at 31 December 2011:
Maturity
Creditor Interest rate 1 year or less 2-5 years Over 5 years
HRK HRK HRK
Privredna banka Zagreb d.d., Zagreb 3MEUR+5,5 16,237,467 0 16,237,467
Privredna banka Zagreb d.d., Zagreb 3MEUR+5,5 7,353,454 0 7,353,454
Privredna banka Zagreb d.d., Zagreb 3MEUR+5,5 16,472,794 0 16,472,794
Erste & Steiermärkische Bank d.d., Rijeka 7%fix 7,290,745 1,552,528 5,738,217
Hrvatska poštanska banka d.d., Zagreb 8,5%variable 10,651,160 0 10,651,160
Hrvatska poštanska banka d.d., Zagreb 9,95% variable 24,052,244 24,052,244 0
Zagrebačka banka d.d., Zagreb
1,916,813 1,916,813 0
Unicreditleasing d.o.o., Zagreb 10% 105,193 105,193 0
Total 84,079,870 27,626,778 56,453,092
Review of loan liabilities at 31 December 2010:
Maturity
Creditor Interest rate 1 year or less 2-5 years Over 5 years Creditor
HRK HRK HRK HRK
Privredna banka Zagreb d.d., Zagreb 3MEUR+5.5 21,232,371 5,308,093 15,924,278 0
Privredna banka Zagreb d.d., Zagreb 3MEUR+5.5 21,540,089 5,385,022 16,155,067 0
Privredna banka Zagreb d.d., Zagreb 3MEUR+5.5 9,615,494 2,403,874 7,211,620 0
Erste & Steiermarkische Bank d.d., Rijeka 7%fix 17,722,800 17,722,800 0 0
Hypo Alpe-Adria bank d.d., Zagreb 1MEUR+2.2 3,022,873 3,022,873 0 0
Hrvatska poštanska banka d.d., Zagreb 8.5%variable 21,216,026 9,717,323 11,498,703 0
Hrvatska poštanska banka d.d., Zagreb 9.95%variable 40,470,748 40,470,748 0 0
Erste & Steiermärkische Bank d.d., Rijeka 6% 8,584,250 1,434,129 7,150,121 0
Zagrebačka banka d.d., zagreb 7% 537,141 48,829 0 488,312
VB Leasing d.o.o., Zagreb 8% 1,758,614 103,254 1,655,360 0
Hypo Leasing Kroatien d.o.o., Zagreb 9% 154,702 5,981 148,721 0
Unicreditleasing d.o.o., Zagreb 10% 130,753 1,760 128,993 0
HypoAlpeAdria Bank, Mostar 0.1042 294,032 0 294,032 0
UniCredit leasing d.o.o. Sarajevo variable 34,122 0 34,122 0
Total
146,314,015 85,624,686 60,201,017 488,312

CROATIA OSIGURANJE d.d., Zagreb Notes to the consolidated financial statements
for the year ended 31 December 2011
68
24. Other liabilities
At 31 Dec 2011 At 31 Dec 2010
Description Life General Total Life General Total
HRK HRK HRK HRK HRK HRK Liabilities from direct insurance activities 2,025,459 110,716,980 112,742,439 974,033 109,025,151 109,999,184 Liabilities from coinsurance and reinsurance activities 1,693 67,958,283 67,959,976 1,665 38,334,150 38,335,815
Other liabilities 31,363,056 126,378,871 157,741,927 44,038,033 111,096,931 155,134,964
TOTAL 33,390,208 305,054,134 338,444,342 45,013,731 258,456,232 303,469,963
/i/ Liabilities from direct insurance activities
At 31 Dec 2011 At 31 Dec 2010
Description Life General Total Life General Total
HRK HRK HRK HRK HRK HRK
Liabilities for Guarantee fund 384,483 30,826,407 31,210,890 0 60,955,475 60,955,475
Liabilities toward HUO 0 52,820,284 52,820,284 0 163,863 163,863
Liabilities under liquidated claims (228) 13,901,456 13,901,228 242,474 41,382,771 41,625,245
Liabilities for health insurance contribution out of motor TPL ins. 0 3,814,506 3,814,506 0 3,862,350 3,862,350
Liabilities for fire depar. contributions 0 1,654,889 1,654,889 0 1,911,098 1,911,098
Liabilities for the fee to regulator 0 111,421 111,421 0 0 0 Other liabilities 1,641,204 7,588,017 9,229,221 731,559 749,594 1,481,153
TOTAL 2,025,459 110,716,980 112,742,439 974,033 109,025,151 109,999,184
/ii/ Liabilities from coinsurance and reinsurance activities
At 31 Dec 2011 At 31 Dec 2010
Description Life General Total Life General Total
HRK HRK HRK HRK HRK HRK
Liabilities for reinsurance premium abroad 0 67,417,854 67,417,854 0 37,587,867 37,587,867
Liabilities for reinsurance premium in the country 1,693 404,972 406,665 1,665 746,283 747,948
Liabilities for coinsurance premium in the country 0 135,457 135,457 0 0 0
TOTAL 1,693 67,958,283 67,959,976 1,665 38,334,150 38,335,815

CROATIA OSIGURANJE d.d., Zagreb Notes to the consolidated financial statements
for the year ended 31 December 2011
69
/iii/ Other liabilities
At 31 Dec 2011 At 31 Dec 2010
Description Life General Total Life General Total
HRK HRK HRK HRK HRK HRK
Trade payables 350,268 33,340,925 33,691,193 162,772 30,813,917 30,976,689
Liabilities to employees 440,521 1,569,042 2,009,563 6,665 2,203,823 2,210,488
Contributions, memberships and similar 39,760 22,605,748 22,645,508 227 366,556 366,782
Contributions from salaries 18,438 8,436,967 8,455,406 21,682 7,003,275 7,024,956
Corporate income tax 2,976 5,722,889 5,725,864 0 826,608 826,608
Contributions on salaries 6,249 6,588,142 6,594,391 7,344 6,126,444 6,133,788
Prepayment liabilities 1,132 7,635,511 7,636,643 198,888 634,519 833,406
Liabilities to the State for sold apartments 0 472,606 472,606 0 6,817,152 6,817,152
Liabilities under motor TPL and motor- full insurance tax 0 1,923,972 1,923,972 0 10,821,571 10,821,571
Liabilities for net salaries 0 5,996,868 5,996,868 45,303 21,946,668 21,991,971
Deductions from salaries and wages 0 443,071 443,071 0 2,462,622 2,462,622
Taxes and surtaxes from salaries 508 201,735 202,243 3,183 4,502,991 4,506,174
Liabilities for dividends 0 10,466,917 10,466,917 0 1,259,137 1,259,137
Other liabilities 30,503,205 20,974,477 51,477,682 43,591,964 15,311,647 58,903,611
TOTAL 31,363,057 126,378,871 157,741,927 44,038,027 111,096,929 155,134,956
25. Accrued expenses and deferred income
At 31 Dec 2011 At 31 Dec 2010
Description Life General Total Life General Total
HRK HRK HRK HRK HRK HRK
Total accrued expenses 0 25,674,754 25,674,754 3,773 383,612 387,385
Deferred income
Accrued premium 118,329 2,983,686 3,102,015 42,085,204 0 42,085,204 Deferred income due to collection uncertainty 0 6,672,391 6,672,391 0 10,872,595 10,872,595
Other deferred income 60,088 6,047,023 6,107,111 43,540 9,343,611 9,387,151
Total deferred income 178,417 15,703,100 15,881,517 42,128,744 20,216,206 62,344,950
TOTAL 178,417 41,377,854 41,556,271 42,132,517 20,599,818 62,732,335

CROATIA OSIGURANJE d.d., Zagreb Notes to the consolidated financial statements
for the year ended 31 December 2011
70
26. Off-balance sheet records
Description 31 Dec 2010 Increase Decrease At 31 Dec 2011
HRK HRK HRK HRK
Premiums from companies in bankruptcy 119,169,573 22,550,711 7,934,773 133,785,511
Shares and stakes of companies in bankruptcy 14,251,620 0 0 14,251,620 Placements and interest from companies in bankruptcy 74,509,957 0 834,650 73,675,307
Default interest on placements 8,750,411 40,941 37,941 8,753,411
Other 0 37,500,000 10,000,000 27,500,000
Receivables from companies in bankruptcy 216,681,561 60,091,652 18,807,364 257,965,849
Recourse receivables 487,889,259 16,881,506 28,603,541 476,167,223
TOTAL 704,570,820 76,973,158 47,410,905 734,133,072
27. Reimbursement to the Management Board
At 31 Dec 2011 At 31 Dec 2010
Description HRK'000 HRK'000
Gross salaries of Management Board 1,233,992 1,508,790
Fees to Management Board 197,408 128,158
TOTAL 1,431,400 1,636,948
IV COURT DISPUTES AND CONTIGENT LIABILITIES
According to information received from the legal department, other than litigation initiated against the Group for damages, against the Group are initiated also court disputes of other nature. Assessing the outcome of disputes initiated against the Group, it is determined the potential outflow of funds based on loss of disputes, and on that basis the Group stated provision in the amount of HRK 10,212,249.

CROATIA OSIGURANJE d.d., Zagreb Notes to the consolidated financial statements
for the year ended 31 December 2011
71
V APPROVAL OF THE CONSOLIDATED FINANCIAL STATEMENTS The consolidated financial statements were adopted and approved for issuance by the Management Board on 29 March 2012.
CROATIA OSIGURANJE d.d. Miramarska 22 10 000 Zagreb The Republic of Croatia 29 March 2012

72
FINANCIAL STATEMENTS FOR THE COMPANY ACCORDING TO REGULATION ON THE STRUCTURE AND CONTENT OF FINANCIAL STATEMENTS
On the basis of Regulation on the structure and content of the financial statements for insurance and coinsurance companies (National gazette No 132/10) which on the basis of Insurance law and the Accounting law has been brought by the Croatian agency for the control of financial services, in addition we give the consolidated financial statements for the Company CROATIA osiguranje d.d., Zagreb in the form according to the Regulation stated.
Adjustment between the financial statements shown in addition on pages 72 to 82 which are prescribed by Regulation on the structure and content of financial statements of insurance and coinsurance companies and also the annual financial statements prepared in accordance with the reporting framework of IFRS ,is shown on pages 83 to 85 under name „Adjustment of consolidated financial statements“.

CROATIA OSIGURANJE d.d., Zagreb Consolidated statement of income / Consolidated statement of comprehensive income for the year 2011
73
2011 2010
POSITION
Life General Total Life General Total
HRK HRK HRK HRK HRK HRK
EARNED PREMIUMS (INCOME)
Earned gross premiums
387,803,438 2,851,750,030 3,239,553,468 385,704,710 2,911,414,493 3,297,119,203
Coinsurance premiums
1,024,374 1,024,374 0 556,583 556,583
Impairment and collected impairment of insurance premium
(69,013,259) (69,013,259) 0 (52,405,459) (52,405,459)
Outwards reinsurance
(319,731) (328,188,741) (328,508,471) (6,859) (352,894,530) (352,901,389)
Outwards coinsurance
0 (3,744,946) (3,744,946) 0 (5,383,364) (5,383,364)
Change in gross unearned premium provision
73,219 6,876,011 6,949,231 112,708 74,099,692 74,212,400
Change in unearned premium provision, reinsurance portion
138 (4,609,200) (4,609,062) 0 4,342,854 4,342,854
Change in unearned premium provision, coinsurance portion
0 0 0
0 1,073,932 1,073,932
Total earned premiums
387,557,064 2,454,094,271 2,841,651,335
385,810,559 2,580,804,201 2,966,614,760
INVESTMENT INCOME
Income from investment in land and buildings
4,566 62,867,176 62,871,742
4,474 12,240,130 12,244,604
Interest income
108,747,360 160,646,103 269,393,462
120,273,024 173,695,336 293,968,360
Unrealized gains at fair value through profit and loss account
2,494,897 8,892,042 11,386,939
3,898,786 6,693,193 10,591,979
Gains from sale of financial investments
3,870,283 6,598,217 10,468,500
3,455,091 7,390,415 10,845,506
Net foreign exchange gains
19,753,250 16,947,707 36,700,956
11,058,585 12,329,780 23,388,365
Other investment income
225,763 52,861,146 53,086,909
(6,287,538) 4,240,155 (2,047,383)
Total investment income
135,096,118 308,812,391 443,908,509
132,402,422 216,589,009 348,991,431
OTHER INCOME
Income from fees and commissions
69,101 44,660,305 44,729,407
90,042 45,903,228 45,993,270
Other insurance-technical income, net from reinsurance
108,336 20,825,011 20,933,348
728,107 39,647,332 40,375,439
Other income
1,361,321 213,761,067 215,122,388
1,832,993 244,744,866 246,577,859
Total other income
1,538,758 279,246,383 280,785,143
2,651,142 330,295,426 332,946,568

CROATIA OSIGURANJE d.d., Zagreb Consolidated statement of income / Consolidated statement of comprehensive income for the year 2011
74
2011 2010
POSITION
Life General Total Life General Total
HRK HRK HRK HRK HRK HRK
INSURED EVENT EXPENSES,NET
Liquidated claims
(329,935,998) (1,470,065,857) (1,800,001,855) (230,501,346) (1,578,904,031) (1,809,405,377)
Change in claim provision
6,167,438 66,370,388 72,537,826 572,342 29,198,177 29,770,519
Total insured event expenses, net
(323,768,560) (1,403,695,469) (1,727,464,029)
(229,929,004) (1,549,705,854) (1,779,634,858)
CHANGE IN OTHER TECHNICAL PROVISION, NET FROM REINSURANCE
Change in mathematical insurance provision
(64,996,943) 0 (64,996,943) (136,507,486) 0 (136,507,486)
Change in other technical provision, net from reinsurance
0 (10,670,000) (10,670,000)
0 (13,847,225) (13,847,225)
Total change in other technical provision, net from reinsurance
(64,996,943) (10,670,000) (75,666,943)
(136,507,486) (13,847,225) (150,354,711)
CHANGES IN SPECIAL LIFE INSURANCE PROVISION WHEN POLICYHOLDER BEARS INVESTMENT RISK, NET FROM REINSURANCE
Changes in life insurance technical provision when policyholders bears the risk
4,700,768 0 4,700,768 1,918,336 0 1,918,336
Total changes in life insurance technical provision when policyholders bears the risk
4,700,768 0 4,700,768 1,918,336 0 1,918,336
COSTS FOR PREMIUM RETURN (BONUSES AND DISCOUNTS), NET FROM REINSUARNCE
Dependent from the result (bonuses)
0 (104,981) (104,981)
0 (390,424) (390,424)
Independent from the result (discounts)
0 (361,232) (361,232)
0 4,004,526 4,004,526
Total costs for premium return (bonuses and discounts), net from reinsurance
0 (466,213) (466,213)
0 3,614,102 3,614,102
OPERATING COSTS, NET
Acquisition costs
(35,290,163) (296,237,384) (331,527,547) (40,406,269) (303,952,105) (344,358,374)
Management costs (administrative costs)
(73,593,614) (744,180,013) (817,773,627) (73,474,404) (718,525,098) (791,999,502)
Total operating costs, net
(108,883,777) (1,040,417,397) (1,149,301,174)
(113,880,673) (1,022,477,203) (1,136,357,876)

CROATIA OSIGURANJE d.d., Zagreb Consolidated statement of income / Consolidated statement of comprehensive income for the year 2011
75
2011 2010
POSITION
Life General Total Life General Total
HRK HRK HRK HRK HRK HRK
INVESTMENT COSTS
Depreciation (non-operational buildings)
0 0 0
0 (1,271,102) (1,271,102)
Interest
(12,186) (1,354) (13,539) (16,051) (476,808) (92,859)
Investment impairment
(12,043,534) (32,152,661) (44,196,195) (16,717,359) (20,330,656) (37,048,015)
Loss from sale (realization) of investment
(2,575,940) (21,363,966) (23,939,906) (13,739,085) (38,910,657) (52,649,742)
Reconciliation of financial assets at fair value through P&L account
(5,089,978) (8,014,888) (13,104,866) (726,384) (111,231) (837,615)
Other investment costs
(511,965) (123,220,944) (123,732,909) (2,611,264) (81,131,368) (83,742,632)
Total investment costs
(20,233,603) (184,753,813) (204,987,415)
(33,810,143) (142,231,822) (176,041,965)
OTHER COSTS
Other technical costs, net from reinsurance
(190,956) (84,668,049) (84,859,006)
(305,749) (82,178,583) (82,484,332)
Other costs, including value adjustments
(1,142,463) (168,881,499) (170,023,962)
(60,845) (210,100,989) (210,161,834)
Total other costs
(1,333,419) (253,549,548) (254,882,967)
(366,594) (292,279,572) (292,646,166)
TOTAL INCOME
524,191,941 3,042,153,045 3,566,344,986
520,864,123 3,127,688,636 3,648,552,759
TOTAL EXPENSES
(514,515,534) (2,893,552,439) (3,408,067,973)
(513,626,758) (3,046,627,015) (3,560,253,773)
PROFIT BEFORE TAXATION
9,676,407 148,600,606 158,277,012
8,288,559 110,761,062 119,049,621
Corporate income tax
(2,551,474) (46,033,081) (48,584,554)
(1,051,195) (29,699,442) (30,750,637)
PROFIT FOR THE CURRENT YEAR
7,124,933 102,567,525 109,692,459
7,237,363 81,061,621 88,298,984
Other comprehensive income
(24,407,721) (39,370,966) (63,778,687)
16,309,458 64,383,814 80,693,272
TOTAL COMPREHENSIVE INCOME
(17,282,788) 63,196,559 45,913,771
23,546,823 145,445,435 168,992,258

CROATIA OSIGURANJE d.d., Zagreb Consolidated balance sheet / Consolidated statement of financial position as at 31 December 2011
76
At 31 Dec 2011 At 31 Dec 2010
POSITION
Life General Total Life General Total
HRK HRK HRK HRK HRK HRK
INTANGIBLE ASSETS
Goodwill
0 42,263,906 42,263,906 0 43,154,776 43,154,776
Other intangible assets
59,932 21,045,433 21,105,365 35,779 25,417,174 25,452,953
Total intangible assets
59,932 63,309,339 63,369,271 35,779 68,571,950 68,607,729
TANGIBLE ASSETS
Land and buildings for operational activities
3,679,148 1,347,814,385 1,351,493,534 4,185,330 1,372,329,198 1,376,514,528
Equipment
491,763 98,488,524 98,980,287 521,068 140,887,166 141,408,234
Other tangible assets
134,553 38,558,497 38,693,050 162,043 38,483,099 38,645,142
Total tangible assets
4,305,464 1,484,861,406 1,489,166,871
4,868,441 1,551,699,463 1,556,567,904
INVESTMENTS
Investments in land and buildings (non-operational)
437,198 968,976,989 969,414,187
816,718,189 816,718,189
Investments in branch offices, associates and joint ventures
0 17,607,576 17,607,576 0 19,140,405 19,140,405
Other financial investments
2,105,858,599 2,960,661,409 5,066,520,008 2,083,905,096 3,009,927,595 5,093,832,691
Total investments
2,106,295,797 3,947,245,974 6,053,541,771 2,083,905,096 3,845,786,189 5,929,691,285
INVESTMENTS FOR THE ACCOUNT AND ON THE RISK OF THE LIFE INSURANCE POLICY HOLDERS
Investments for the account and on the risk of the life insurance policy holders
16,320,627 0 16,320,627 22,374,967 0 22,374,967
Total investments for the account and on the risk of the life insurance policy holders
16,320,627 0 16,320,627 22,374,967 0 22,374,967
REINSURANCE PORTION IN TECHNICAL PROVISION
Unearned premiums, reinsurance portion
138 19,806,023 19,806,161 0 77,653,096 77,653,096
Mathematical provision, reinsurance portion
164,490 0 164,490 11,607 0 11,607
Claim provision , reinsurance portion
0 215,781,823 215,781,823
0 92,306,696 92,306,696 Provision for premium returns dependent and independent from the result(bonuses and discounts), reinsurance portion
0 519,328 519,328
0 617,871 617,871
Total reinsurance portion in technical provision
164,628 236,107,174 236,271,802 11,607 170,577,663 170,589,270

CROATIA OSIGURANJE d.d., Zagreb Consolidated balance sheet / Consolidated statement of financial position as at 31 December 2011
77
At 31 Dec 2011 At 31 Dec 2010
POSITION
Life General Total Life General Total Life
HRK HRK HRK HRK HRK HRK
DEFFERED AND CURRENT TAX ASSETS
Deferred and current tax assets
2,451,330 3,588,575 6,039,905
3,365,941 8,089,287 11,455,228
Total deferred and current tax assets
2,451,330 3,588,575 6,039,905
3,365,941 8,089,287 11,455,228
RECEIVABLES
Receivables from direct insurance activities
162,077 681,383,908 681,545,985
41,306,800 689,902,212 731,209,012
Receivables from coinsurance and reinsurance activities
0 61,234,875 61,234,875
0 29,146,633 29,146,633
Total other receivables
10,130,650 258,534,884 268,665,533
6,273,128 325,550,592 331,823,720
Total receivables
10,292,727 1,001,153,667 1,011,446,393
47,579,928 1,044,599,437 1,092,179,365
OTHER ASSETS
Cash on account and in hand
6,052,921 75,750,040 81,802,961
7,387,138 58,049,720 65,436,858
Other
64,325 12,789,502 12,853,826
93,522 19,682,594 19,776,116
Total other assets
6,117,246 88,539,542 94,656,787
7,480,660 77,732,314 85,212,974
PREPAYMENTS AND ACCRUED INCOME
Prepayments and accrued income
22,259,902 59,037,498 81,297,400
18,055,825 49,340,791 67,396,616
Total prepayments and accrued income
22,259,902 59,037,498 81,297,400
18,055,825 49,340,791 67,396,616
TOTAL ASSETS
2,168,267,651 6,883,843,174 9,052,110,826
2,187,678,244 6,816,397,094 9,004,075,338
OFF-BALANCE SHEET RECORDS
0 734,133,072 734,133,072
0 704,570,820 704,570,820
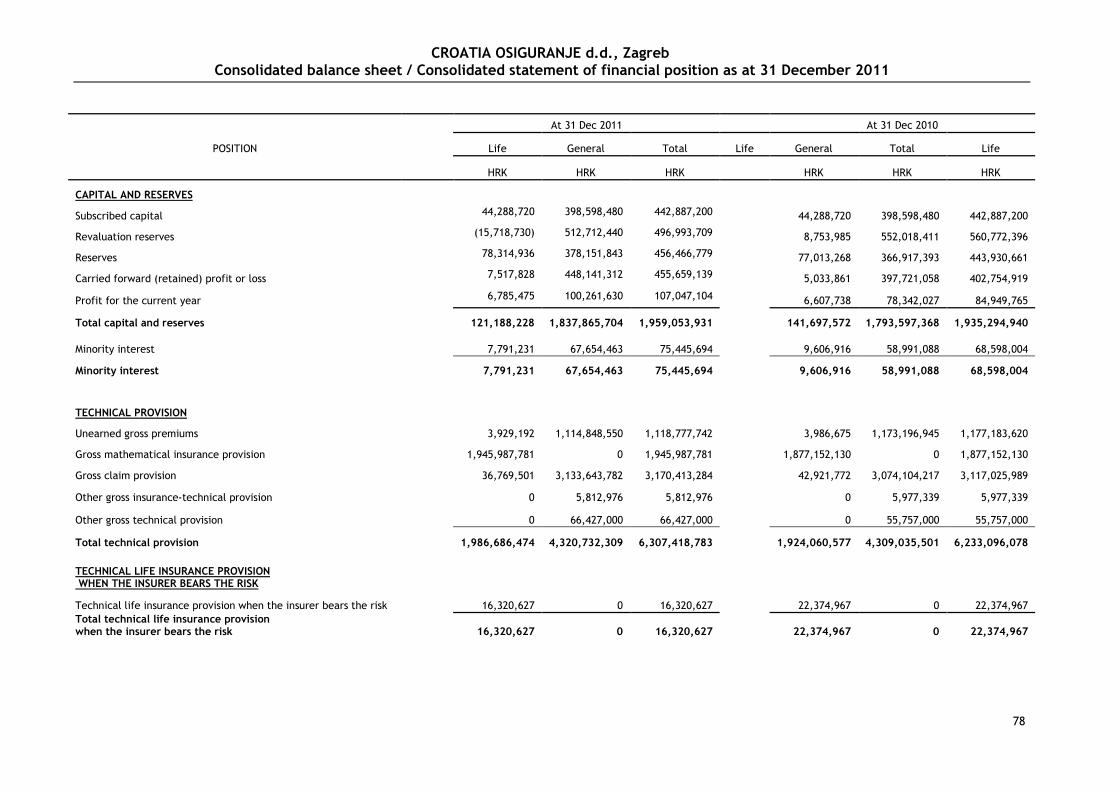
CROATIA OSIGURANJE d.d., Zagreb Consolidated balance sheet / Consolidated statement of financial position as at 31 December 2011
78
At 31 Dec 2011 At 31 Dec 2010
POSITION
Life General Total Life General Total Life
HRK HRK HRK HRK HRK HRK
CAPITAL AND RESERVES
Subscribed capital
44,288,720 398,598,480 442,887,200
44,288,720 398,598,480 442,887,200
Revaluation reserves
(15,718,730) 512,712,440 496,993,709
8,753,985 552,018,411 560,772,396
Reserves
78,314,936 378,151,843 456,466,779
77,013,268 366,917,393 443,930,661
Carried forward (retained) profit or loss
7,517,828 448,141,312 455,659,139
5,033,861 397,721,058 402,754,919
Profit for the current year
6,785,475 100,261,630 107,047,104
6,607,738 78,342,027 84,949,765
Total capital and reserves
121,188,228 1,837,865,704 1,959,053,931
141,697,572 1,793,597,368 1,935,294,940
Minority interest
7,791,231 67,654,463 75,445,694
9,606,916 58,991,088 68,598,004
Minority interest
7,791,231 67,654,463 75,445,694
9,606,916 58,991,088 68,598,004
TECHNICAL PROVISION
Unearned gross premiums
3,929,192 1,114,848,550 1,118,777,742
3,986,675 1,173,196,945 1,177,183,620
Gross mathematical insurance provision
1,945,987,781 0 1,945,987,781
1,877,152,130 0 1,877,152,130
Gross claim provision
36,769,501 3,133,643,782 3,170,413,284
42,921,772 3,074,104,217 3,117,025,989
Other gross insurance-technical provision
0 5,812,976 5,812,976
0 5,977,339 5,977,339
Other gross technical provision
0 66,427,000 66,427,000
0 55,757,000 55,757,000
Total technical provision
1,986,686,474 4,320,732,309 6,307,418,783
1,924,060,577 4,309,035,501 6,233,096,078
TECHNICAL LIFE INSURANCE PROVISION WHEN THE INSURER BEARS THE RISK
Technical life insurance provision when the insurer bears the risk
16,320,627 0 16,320,627
22,374,967 0 22,374,967
Total technical life insurance provision when the insurer bears the risk
16,320,627 0 16,320,627
22,374,967 0 22,374,967

CROATIA OSIGURANJE d.d., Zagreb Consolidated balance sheet / Consolidated statement of financial position as at 31 December 2011
79
At 31 Dec 2011 At 31 Dec 2010
POSITION
Life General Total
Life General Total
HRK HRK HRK
HRK HRK HRK
OTHER RESERVES
Other reserves
2,557,348 87,913,892 90,471,240
2,647,001 85,216,786 87,863,787
Total other reserves
2,557,348 87,913,892 90,471,240
2,647,001 85,216,786 87,863,787
DEFERRED AND CURRENT TAX LIABILITIES
Deferred and current tax liabilities
55,052 134,844,757 134,899,809
0 129,438,670 129,438,670
Total deferred and current tax liabilities
55,052 134,844,757 134,899,809
0 129,438,670 129,438,670
FINANCIAL LIABILITIES
Financial liabilities
100,067 88,400,064 88,500,131
144,963 161,061,626 161,206,589
Total financial liabilities
100,067 88,400,064 88,500,131
144,963 161,061,626 161,206,589
OTHER LIABILITIES
Liabilities from direct insurance activities
2,025,459 110,716,980 112,742,439
974,033 109,025,151 109,999,184
Liabilities from coinsurance and reinsurance activities
1,693 67,958,283 67,959,976
1,665 38,334,150 38,335,815
Other liabilities
31,363,056 126,378,871 157,741,927
44,038,033 111,096,931 155,134,964
Total other liabilities
33,390,208 305,054,134 338,444,342
45,013,731 258,456,232 303,469,963
ACCRUED EXPENSES AND DEFERRED INCOME
Accrued expenses and deferred income
178,417 41,377,850 41,556,267
42,132,517 20,599,823 62,732,340
Total accrued expenses and deferred income
178,417 41,377,850 41,556,267
42,132,517 20,599,823 62,732,340
TOTAL CAPITAL AND LIABILITIES
2,168,267,652 6,883,843,174 9,052,110,825
2,187,678,244 6,816,397,094 9,004,075,338
OFF-BALANCE SHEET RECORDS
0 734,133,072 734,133,072
0 704,570,820 704,570,820

CROATIA OSIGURANJE d.d., Zagreb Consolidated statement of changes in equity in 2011
80
Description
Attributable to the owners of the parent company Attributable to non-controlling
interests
Total capital and reserves Paid-in capital
Revaluation reserve
Reserves (legal,
statutory, other)
Retained earnings
Profit of the current year
Total capital and reserves
Balance at 1 December 2009 442,887,200 492,570,679 423,894,650 274,246,101 152,504,002 1,786,102,634 62,855,107 1,848,957,741
Change in accounting policy 0 0 0 906,944 0 906,944 1,746,368 2,653,312
Correction of previous period errors 0 (7,526,061) (6,134,196) 0 (13,660,257) 835,504 (12,824,753)
Balance at 1 January 2010 (corrected) 442,887,200 485,044,618 423,894,652 269,018,849 152,504,002 1,773,349,321 65,436,979 1,838,786,300
Payment of shares in profit /dividends 0 0 (2,898,883) (2,898,883) (986,729) (3,885,612)
Other distributions to the owners 0 0 20,036,009 129,569,110 (149,605,119) 0 0 0
Unrealized gains / losses from tangible assets 0 (3,244,589) 0 5,356,680 0 2,112,091 0 2,112,091
Unrealized gains / losses from assets available for sale 0 (7,746,521) 0 0 0 (7,746,521) 245,624 (7,500,897)
Realized gains / losses from assets available for sale 0 85,933,879 0 0 0 85,933,879 0 85,933,879
Other non-ownership changes in capital 0 785,008 (1,189,721) 0 (404,713) 552,911 148,198
Profit for the period 0 0 0 0 84,949,765 84,949,765 3,349,219 88,298,984
Balance at 31 December 2010 442,887,200 560,772,395 443,930,661 402,754,919 84,949,765 1,935,294,939 68,598,004 2,003,892,943
Correction of previous period errors 0 74,365 0 (39,842) 0 34,523 0 34,523
Balance at 1 January 2011 (corrected) 442,887,200 560,846,760 443,930,661 402,715,077 84,949,765 1,935,329,462 68,598,004 2,003,927,466
Payment of shares in profit /dividends 0 0 0 0 (28,663,820) (28,663,820) (2,101,173) (30,764,993)
Other distributions to the owners 0 0 12,536,118 43,749,827 (56,285,945) 0 0 0
Unrealized gains / losses from tangible assets 0 2,320,408 0 6,835,588 0 9,155,996 8,144,812 17,300,807
Unrealized gains / losses from assets available for sale 0 (48,173,323) 0 0 0 (48,173,323) (1,494,807) (49,668,130)
Realized gains / losses from assets available for sale 0 (18,064,979) 0 0 0 (18,064,979) 0 (18,064,979)
Other non-ownership changes in capital 0 64,843 0 2,358,648 0 2,423,491 (346,494) 2,076,997
Profit for the period 0 0 0 0 107,047,104 107,047,104 2,645,353 109,692,457
Balance at 31 December 2011 442,887,200 496,993,709 456,466,779 455,659,139 107,047,104 1,959,053,931 75,445,694 2,034,499,624

CROATIA OSIGURANJE d.d., Zagreb Consolidated statement of cash flows for 2011 – indirect method
81
POSITION 2011 2010
HRK HRK
Cash flows from operating activities
Profit before taxation 158,277,013
119,049,621
Depreciation of property and equipment 78,610,696
92,593,942
Depreciation of intangible assets 6,452,213
5,466,381
Impairments and gains/losses from adjustment to fair value 56,114,022
83,072,151
Interest costs 482
0
Interest income (229,499,066)
7,100,560
Losses from sale of tangible assets (including land and buildings) 0
(16,754)
Portions in profit of associated companies (34,558,009)
0
Gains/losses from sale of tangible assets 10,899,507
0
Other adjustments (118,291,401)
(23,201,194)
Cash flows before changes in operating assets and liabilities (71,994,543)
284,064,707
Decrease in investments available for sale 180,407,596
50,800,526
Increase in investments at fair value through P&L account (126,638,762)
(117,423,599)
Decrease in deposits, loans and receivables 162,056,557 76,305,127 Increase / decrease in investments for the account and on the risk of the life insurance policy holders 6,054,340
(47,302)
Increase in reinsurance portion in technical provisions (65,682,532)
(19,556,515)
Decrease / increase in tax assets 5,415,323
(5,298,967)
Decrease in receivables 271,894,249
204,840,393
Decrease in other assets 0
3,274,980
Increase in prepayments and accrued income (13,900,781)
(19,580,536)
Increase in technical provision 74,322,706
52,266,070
Decrease / increase in life insurance technical provision in the case when insurer bears investment risk (6,054,340)
47,302
Increase / decrease in tax liabilities 5,461,139
(15,770,859)
Decrease in financial liabilities (72,706,459)
(71,162,828)
Increase / decrease in other liabilities 37,581,832
(50,142,167)
Decrease in accrued expenses and deferred income (21,176,070)
(44,550,308)
Increase / decrease in operating assets and liabilities 437,034,800
44,001,317
Paid corporate income tax (45,860,486)
(54,337,240)
Net cash flows from operating activities 319,179,770
273,728,784
Cash flows from investment activities Receipts from sale of tangible assets 19,955,263
9,222,035
Expenditures for acquisition of tangible assets (34,193,150)
(69,267,621) Receipts from sale of intangible assets 0
237,804
Expenditures for acquisition of intangible assets (2,027,176)
(8,903,911)
Receipts from sale of non-operational land and buildings 0
433,119
Expenditures for acquisition of non-operational land and buildings (81,376,244)
(11,820,494)
Decrease/increase in investments in branch offices, associates and joint ventures 40,116,167
13,688,777
Receipts from investments held to maturity 109,012,553
80,271,090
Expenditures for investments held to maturity (299,092,603)
(188,366,596)
Receipts from sale of securities and shares 1,314,422
0
Expenditures for investments in securities and shares (1,288,898)
(8,086,626)
Receipts from dividends and shares in profit 2,787,773
1,982,736
Receipts from repayment of short-term and long-term loans 323,751,179
6,271,979
Expenditures for given short-term and long-term loans (320,824,217)
(3,939,423)
Net cash flows from investment activities (241,864,931)
(178,277,131)

CROATIA OSIGURANJE d.d., Zagreb Consolidated statement of cash flows for 2011 – indirect method
82
POSITION 2011 2010
HRK HRK
Cash flows from financial activities
Receipts from received short-term and long-term loans 31,596 203,347
Expenditures for repayment of short-term and long-term loans (1,026,315) (96,843,597)
Expenditures for payment of dividend and shares in profit (33,844,798) (2,898,883)
Net cash flows from financial activities (34,839,517) (99,539,133)
NET CASH FLOWS 42,475,322 (4,087,480)
CASH EFFECTS FROM CHANGES IN FOREIGN EXCHANGE RATES (33,031,508) 812,500
NET DECREASE IN CASH AND CASH EQUIVALENTS 9,443,814 (3,274,980)
Cash and cash equivalents at the beginning of the period 9,443,814 88,487,953
Cash and cash equivalents at the end of the period 85,212,974 85,212,973
NET DECREASE IN CASH AND CASH EQUIVALENTS 94,656,788 (3,274,980)
On behalf of the Management Board:

CROATIA OSIGURANJE d.d., Zagreb Adjustment of financial statements in 2011
83
ADJUSTMENT OF CONSOLIDATED FINANCIAL STATEMENTS
1. The position - Other tangible assets does not include small inventory and stocks in the amount of HRK 14,449,158 (2010: in the amount of HRK 13,763,420) which is in the financial statements for the purpose of HANFA shown as „Other tangible assets and stocks“, and in the basic financial statements the position of small inventory and stocks is shown within the figure of „Other receivables“.
Basic financial According to
statements Regulation Difference
2011
Other tangible assets 24,243,892 38,693,050 (14,449,158)
Other receivables 283,114,691 268,665,533 14,449,158
2010
Other tangible assets 24,881,721 38,645,141 (13,763,420)
Other receivables 345,587,139 331,823,719 13,763,420
2. Deposits with maturities of up to 3 months in the amount of HRK 296,046,817 (2010: in the amount of HRK 218,715,713) in the basic financial statements are shown within the group of Other assets (sub-group other) while in the financial statements for the purposes of HANFA are stated within the figure „Other investments“.
Basic financial According to
in HRK statements Regulation Difference
2011
Other investment – Deposits, loans and receivables 4,770,473,574 5,066,520,008 (296,046,434)
Other assets – other 308,900,644 12,853,826 296,046,818
2010
Other investment – Deposits, loans and receivables 4,875,117,361 5,093,832,691 (218,715,330)
Other assets – other 238,491,829 19,776,116 218,715,713
3. Earned gross premiums The Group has for the purpose of reporting of HANFA stated separately Net value provision of insurance premium and also the coinsurance premium, while in the basic financial statements the stated provision and the coinsurance premium is shown within the figure of earned gross premiums.
Basic financial According to
statements Regulation Difference
2011
Earned gross premiums (including coinsurance premiums) 3,171,564,583 3,240,577,842 (69,013,259)
2010
Earned gross premiums (including coinsurance premiums) 3,245,270,327 3,297,675,786 (52,405,459)

CROATIA OSIGURANJE d.d., Zagreb Adjustment of financial statements in 2011
84
4. Income /expenses from investments In the basic financial statements investment costs are stated under category of net investment income (as net amount where it was practicable, while in the statements for the purpose of HANFA are stated separately).
Basic financial According to
statements Regulation Difference
2011 Income from investments 238,921,094
443,908,509
0 Expenses from investments (204,987,415)
2010
Income from investments 172,949,465
348,991,430
0 Expenses from investments (176.041.965)

CROATIA OSIGURANJE d.d., Zagreb Adjustment of financial statements in 2011
85
At 31 Dec 2011 At 31 Dec 2010
Financial
statements
Regulation
Difference Financial
statements
Regulation
Difference Description Life General Total Life General Total
HRK HRK HRK HRK HRK HRK HRK HRK HRK HRK
Income from investments Income from property
investments (land and buildings) 35,046,732 4,566 62,867,176 62,871,742 (27,825,010) (20,738,114) 4,474 12,240,130 12,244,604 (32,982,718)
Interest income 269,379,923 108,747,360 160,646,103 269,393,462 (13,539) 293,475,501 120,273,024 173,695,336 293,968,360 (492,859) Unrealized gains from investments at fair value through profit and loss account (70,086,616) 2,494,897 8,892,042 11,386,939 (81,473,555) (37,048,014) 3,898,786 6,693,193 10,591,979 (47,639,993) Gains from sale (realization) of financial investments (1,717,926) 3,870,283 6,598,217 10,468,500 (12,186,426) 9,754,364 3,455,091 7,390,415 10,845,506 (1,091,142) Decrease in value of investments (13,471,406) 0 0 0 (13,471,406) (41,804,237) 0
0 (41,804,237)
Net foreign exchange gains 36,700,957 19,753,250 16,947,707 36,700,956 1 23,388,365 11,058,585 12,329,780 23,388,365 0
Other investment income (16,930,570) 225,763 52,861,146 53,086,909 (70,017,479) (54,078,400) (6,287,538) 4,240,155 (2,047,383) (52,031,017)
TOTAL 238,921,094 135,096,118 308,812,391 443,908,509 (204,987,415) 172,949,465 132,402,422 216,589,009 348,991,431 (176,041,966)
Investment expenses
Depreciation (non-operational buildings) 0 0 0 0 0 0 0 1,271,103 1,271,103 (1,271,103)
Interest 0 12,186 1,354 13,539 (13,539) 0 16,051 476,808 492,859 (492,859) Decrease in value of investments 0 12,043,534 32,152,661 44,196,195 (44,196,195) 0 16,717,359 20,330,656 37,048,015 (37,048,015) Losses from sale (realization) of investments 0 2,575,940 21,363,966 23,939,906 (23,939,906) 0 13,739,085 38,910,657 52,649,742 (52,649,742) Adjustment of financial property at fair value through profit and loss account 0 5,089,978 8,014,888 13,104,866 (13,104,866) 0 726,384 111,231 837,615 (837,615)
Other investment income 0 511,965 123,220,944 123,732,909 (123,732,909) 0 2,611,264 81,131,368 83,742,632 (83,742,632)
TOTAL 0 20,233,603 184,753,812 204,987,415 (204,987,415) 0 33810143 142,231,823 176,041,966 (176,041,966)