Embed Size (px)
Citation preview
World Bank
CROATIA
POLICY
NOTES
Croatia: Policy Options for Further
Pension System Reform
The World Bank
Croatia: Policy Options for Further
Pension System Reform
July 2011
The World Bank Document
Table of Contents A. Background .................................................................................................................. 6 B. Recent Pension System Issues and Developments ....................................................... 8
C. Projections of the Current System .............................................................................. 18 D. Options for Further Reform of the Croatian Pension System .................................... 23 E. Recommendations ...................................................................................................... 35 Annex 1. Administrative Costs of the Croatian Second Pension Pillar ................................... 38 Annex 2. Simulation Results: PAYG Balance, Replacement Rates, and Implicit Pension Debt
(Differences from Baseline by Decades) ................................................................................. 40 Annex 3. Parameters of the Croatian Pension System ............................................................. 41
References ................................................................................................................................ 44
Tables
Table 1. Average Age and Length of Service of New Old-Age Pensioners ............................ 11 Table 2. Minimum Pension as Percent of Average Net Wage ................................................ 12 Table 3. Pension Valorization and Indexation Rules in OECD and Eastern Europe Countries
.................................................................................................................................................. 14 Table 4. Merit Pension Beneficiaries and Average Benefits, December 2010 ........................ 15
Table 5. Annualized Net Rates of Return (RoR) of Mandatory Second Pillar ........................ 17 Table 6. Macroeconomic Assumptions in the Baseline Scenario (period average) ................ 19 Table 7. Pension Reform Scenarios Simulated with the Pension Model ................................. 24
Table 8. Simulation Results: Replacement Rates, Men and Women ...................................... 25
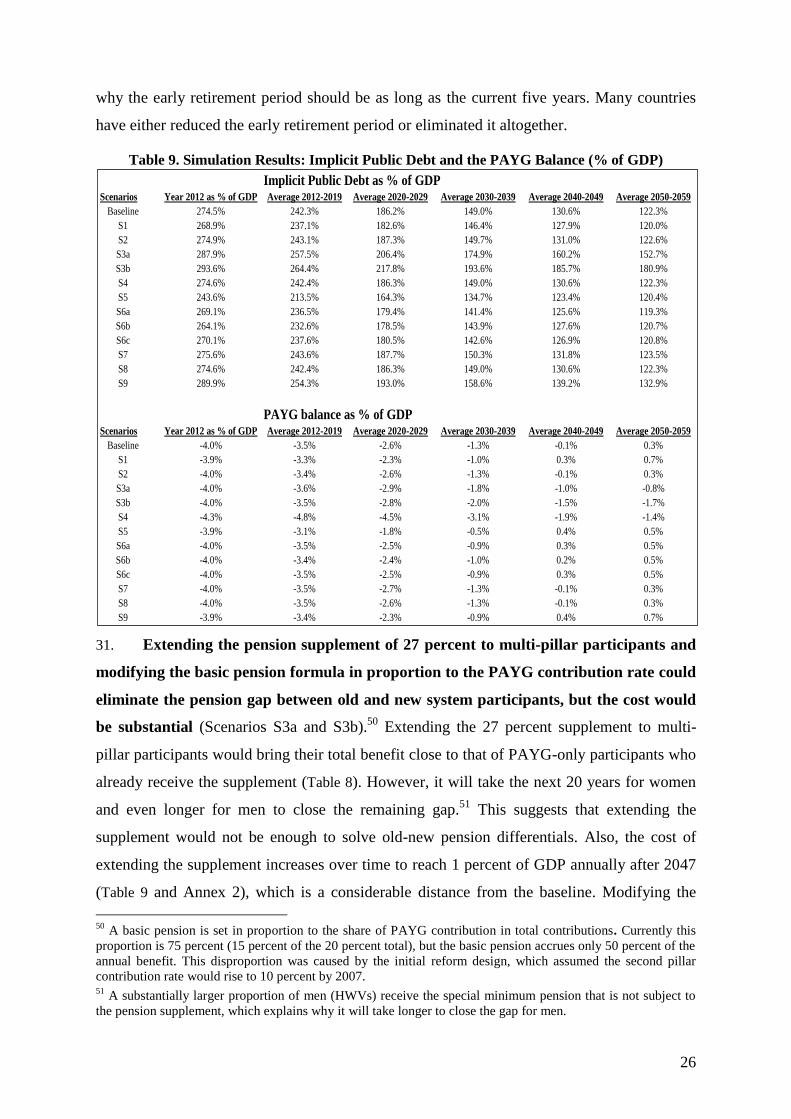
Table 9. Simulation Results: Implicit Public Debt and the PAYG Balance (% of GDP)........ 26 Table 10. Policy Mixes: Replacement Rates, Men and Women.............................................. 33 Table 11. Policy Mixes: Implicit Public Debt and PAYG Balance (% of GDP) ..................... 33
Table A12. Second Pillar Administration Fees,....................................................................... 38
Figures
Figure 1. PAYG Pension Expenditures and Contributions (% of GDP) ................................... 8 Figure 2. International Comparisons of Social Insurance Contribution Rates .......................... 9
Figure 3. Life Expectancy at Retirement, 2010—Europe and Central Asia ............................ 10 Figure 4. Population, Insured Persons, and Pensioners, ......................................................... 19
Figure 5. Gross Replacement Rate, Old-age Pensions, ........................................................... 20 Figure 6. Initial Gross Replacement Rate of New Old-age Pensioners, Baseline ................... 21 Figure 7. Baseline and Pre-Baseline Simulation Results ......................................................... 22 Figure 8. Implicit Pension Debt in Croatia, Baseline and Pre-Baseline .................................. 23 Figure 9. Average Gross Replacement Rate, Baseline and Basic Policy Mix (P1) ................. 32
Figure 10. PAYG Deficit and Implicit Public Debt, Baseline and Basic Policy Mix (P1) ..... 32 Figure 11. PAYG Expenditures/GDP Ratio and Transfer Requirements: ............................... 34
Boxes
Box 1. Croatian Pension System – Basic Parameters ................................................................ 8
Croatia: Policy Options for Further Pension System Reform
Executive Summary
In response to prolonged recession, in April 2010 the Croatian Government adopted an
Economic Recovery Program to safeguard macroeconomic stability and support faster
recovery of the private sector. A central element of the program is comprehensive overhaul of
the pension insurance system to ensure long-term fiscal and social sustainability as the
population ages. The authorities have asked the World Bank to both support the reform
design1 and develop a pension simulation model to support decision-making process.
2 This
technical note is intended to facilitate discussion on ways to improve the entire pension
system. This note assesses the impact of the recent pension measures and how they could be
combined with other measures to make the system sustainable in the long run.
After Croatia launched its pension reform by reforming the first pillar in 1998, and
subsequently in 2002 added a second, mandatory and fully-funded, pillar, there were frequent
cost-expanding interventions in the Croatian Pay-as-You-Go (PAYG) system. As a result,
pension reform diverged from its initial course, eroding the system’s fiscal sustainability, and
there was a halt in development of the second pillar, which was intended to support future
pension growth as the society ages. With first pillar PAYG expenditures now seriously
inflated (at 10.6 percent of GDP), Croatia’s current pension system also faces the challenges
of worsening demographic ratios, low labor participation rates, low and declining replacement
rates3, inadequate pensions for multi-pillar cohorts, large cross-cohort differences in pensions,
and overly generous special schemes (privileged pensions). To bring the pension system back
to a fiscally and socially sustainable path, these must be tackled without delay. However,
1 This note was prepared by World Bank staff (Zoran Anusic, Sergiy Biletsky, Sanja Madzarevic Sujster) based
on official information and background papers prepared by Bank consultant (Danijel Nestic). The pension
simulation model for Croatia was developed in close collaboration with the Croatian Pension Institute and the
Ministry of Labor during a workshop in Zagreb in 2010. It is intended to stimulate discussion of possible
pension system reforms. The team would like to thank Anita Schwarz, Ljiljana Marusic, Satu Kahkonen, and the
IMF team for their useful comments. 2 Government capacity for pension policy simulations is currently centered in the Pension Institute (HZMO), the
Croatian PAYG system administrator. The Ministry of Labor (MOELE) requested the Bank to build up the
Ministry’s modeling capacity, re-developing PROST for Croatia and training MOELE and HZMO staff to use
the model. 3 A ratio of pension benefit to wage.
4
World Bank simulations using the PROST4 model show that this could be very difficult, and
the policy options are complex.
The main conclusions of the simulation work are the following:
Most differences in replacement rates between PAYG-only and multi-pillar
beneficiaries could be eliminated by extending the 27 percent PAYG pension
supplement introduced in 2007 to all multi-pillar participants and modifying basic
pension parameters in proportion to the share of PAYG contribution rate5 paid to the
PAYG pillar. However, by 2035 that would cost an additional 1.2 percent of GDP
annually (3.2 percent by 2060), with implicit pension debt increasing by some 80
percent of GDP by 2060 compared to the status-quo scenario. Alternatively, to reduce
the cost and existing inequity, the pension supplement could be provided to all
pensioners on a means-tested basis.
Maintaining the current Swiss wage-price indexation pattern would raise the deficit in
2020 by an average of 0.8 percent of GDP a year compared to the full wage
valorization and price indexation that international best practice would recommend.
Raising the second pillar contribution rate to 10 percent by 2016 would prevent
erosion of future cohort replacement rates, but it would also reduce PAYG revenues
and require additional annual transfers to cover the revenue shortfall of almost 2
percent of GDP. However, if the basic pension were realigned in proportion to a
declining PAYG rate, the net cost of raising the second pillar contribution rate would
be cut by about half.
These measures combined would take substantial fiscal space in the public finances unless
combined with austerity measures in the pension system. Given the high general government
deficit and rapidly rising public debt, the government aims to achieve a primary balance in the
medium term. The reform options presented in the note therefore need to be balanced with the
pressing fiscal consolidation needs. To tackle this, considerations should be given to reforms
which aim to: (i) reduce privileged pension benefits and bring them to convergence with the
general pension system; (ii) switch to wage valorization and price indexation; (iii) eliminate
early retirement; (iv) raise the retirement age; (v) reduce second pillar administrative costs by
restructuring fees and sharing the cost of collecting contributions with the companies that
4 World Bank Pension Reform Options Simulation Toolkit.
5 Currently the basic pension corresponds to 50 percent rather than 75 percent of the contribution rate paid into
the PAYG pillar (the so-called first pillar).
5
manage mandatory pension funds; and (vi) reduce the fiscal impact of the 2007 supplement,
which could bring the net-of-transfers zero balance forward to 2018. However, not only is the
political risk high; more importantly, this would likely imply higher poverty among oldest
cohorts. Although simulations show that these measures would yield savings, by 2028 they
would not be sufficient to cover the entire net-of-mandatory-transfers deficit.
In these circumstances raising the second pillar rate would be a significant stretch. However, a
rate rise can be justified by (i) higher future replacement rates and lower implicit pension debt
compared to realigning the basic pension alone; (ii) declining PAYG expenditures throughout
the simulation period; and (iii) a declining financing requirement for privileged pensions and
the second pillar shortfall. Delaying a rise in the second pillar contribution rate would
negatively affect future multi-pillar replacement rates and burden future generations with an
even larger problem. An alternative would be to increase the pension contribution rate to
support the lost revenues due to transition cost. However, the higher the contribution rate, the
higher the labor cost, the lower the competitiveness, and the larger the shadow economy. This
should therefore be considered a measure of last resort unless the increase comes at the
expense of other contributions currently charged on wages. Finally, options for protecting a
fall in replacement rates for current pensioners and PAYG-only participants should be
discussed only when the fiscal space would allow such interventions.
6
A. Background
1. Croatia launched pension reform in 1998 by reforming PAYG system
parameters and setting the stage for an eventual multi-pillar system. The objective was
to create an equitable, growth-oriented, and financially sustainable pension system, which
would be achieved by gradual and partial substitution of the first-pillar PAYG system with an
equally-sized fully funded mandatory ―second pillar‖. The second pillar was launched
smoothly in 2002 but was not as forward-looking as was intended.6 Numerous revisions of
the PAYG system adopted between 2004 and 20077 created additional fiscal pressures,
prolonging transition to the multi-pillar system. The interventions also created significant
differences in benefits between various pensioners cohorts.8 The economic downturn starting
in late 2008 amplified fiscal problems by shrinking the contribution base and increasing
flows to retirement, which worsened the system dependency ratio to historical lows and
worsened the pension system deficit.
2. In 2009 short-term pension measures were introduced to reduce the expanding
pension system deficit. They included (i) suspension of pension indexation in 20109; (ii)
imposition of a crisis tax of 2 percent on monthly pensions above HRK3,000 and 4 percent
on those above HRK6,00010
; and (iii) a reduction in privileged pensions by 10 percent as of
August 2009.11
Rather than curbing the system deficit, a suspension of pension indexation (a
nominal freeze in pension payments) in 2010 generated the opposite effect: an additional cost
of HRK70 million due to a fall in wages and deflation.12
This was largely offset by the crisis
tax on pensions (which brought in an estimated HRK365 million)13
and savings from
selective reductions in privileged pensions (about HRK10 million). Although these measures
6 The government plan was to set the second pillar contribution rate at 5 percent in the first year with a gradual
rise to 10 percent by the fifth year of the multi-pillar system. The law, however, set the minimum second pillar
contribution rate at 5 percent of gross wage without any schedule for its rise. 7 The revisions were (i) adding ―100kn+6%‖ pension supplement into the pension base; (ii) restoring the
―pensioners’ debt‖; (iii) a temporary shift to wage indexation in 2005; (iv) a 2007 pension supplement of 27%
for PAYG-only retirees; (v) a reduction of the early retirement decrement in 2007 from 4 to 1.8 percent a year;
and (vi) an increase in the minimum pension for 30+ years of service. 8 World Bank (2008) and Marusic and Skember (2008).
9 Law on the Special Tax on Wages, Pensions, and Other Income, also known as the Crisis Tax Law (Zakon o
posebnom porezu na plaće, mirovine i druge primitke), OG 94/09, art. 1, para 2. 10
Crisis Tax Law, art. 5, para. 1. 11
Law on Reduction of Pensions Determined by Law on Rights and Duties of Croatian Parliament Members,
OG 86/09, article 2. Pensions of government officials and Constitutional Court judges are also affected. 12
Had the indexation formula not been suspended, pensions would have declined by 0.35 percent in January
2010 and then increased by 0.30 percent in July. 13
Pension Insurance Fund (HZMO) administrative data.
7
improved the fiscal outlook, they did not address the major system issues: cross-cohort
differences and declining replacement rates for current and future pensioners.
3. The Economic Recovery Program (ERP) launched in April 2010 stressed a need
to complete pension reform by stabilizing the system in the short run and ensuring its
long-run sustainability. The pension reform measures it cited were (i) revision of privileged
pensions; (ii) retirement age increases; (iii) a higher early retirement age and higher
decrement; (iv) a higher second pillar contribution rate; (v) more favorable tax treatment of
employer contributions to voluntary pension funds; and (vi) a reduction in the costs of second
pillar management. Amendments to the Law on Homeland War Veterans14
that closed the
early retirement window for veterans and a 10 percent reduction as of July 2010 in privileged
pensions above HRK3,50015
were the first steps toward reforming the privileged pension
system. In October 2010 Parliament amended the Pension Insurance Act to raise by three
months each calendar year the statutory retirement age for women to 65 and the early
retirement age to 60; introduce a progressive early retirement decrement of 4 percent a year
for those with 30 years of service to only 1.8 percent a year for those with 40 years of service;
and introduce a late retirement bonus of 1.8 percent a year.16
4. Although the recent measures provided short-term fiscal relief, they were not
enough to assure long-run system sustainability. This note assesses the impact of the
recent pension measures and how they could be combined with other measures to make the
system sustainable in the long run. Section B describes recent pension system developments
and compares elements of the Croatian pension system with those of European Union (EU)
members and other countries17
. Section C presents simulation results for the baseline scenario
where results are compared to a pre-reform scenario without the 2010 measures. Section D
projects the fiscal and social implications of alternative pension policy scenarios for the near
future. Section E draws conclusions.
14
Official Gazette 137/09. 15
Law on Reduction of Pensions Determined by Special Regulation on Pension Insurance, OG 71/10. 16
Amendments to the Pension Insurance Act, OG 121/10. Although the government proposal that reached
Parliament in June 2010 for consideration under the urgent procedure for application in July 2010 called for 6-
month increments and a 4 percent decrement and an equal bonus for late retirement, discussions with social
partners led to a less ambitious timetable and less stringent penalties—not to mention a rush into retirement in
the second half of 2010. 17
Annex 3 describes in detail the current Croatian pension system parameters.
8
B. Recent Pension System Issues and Developments
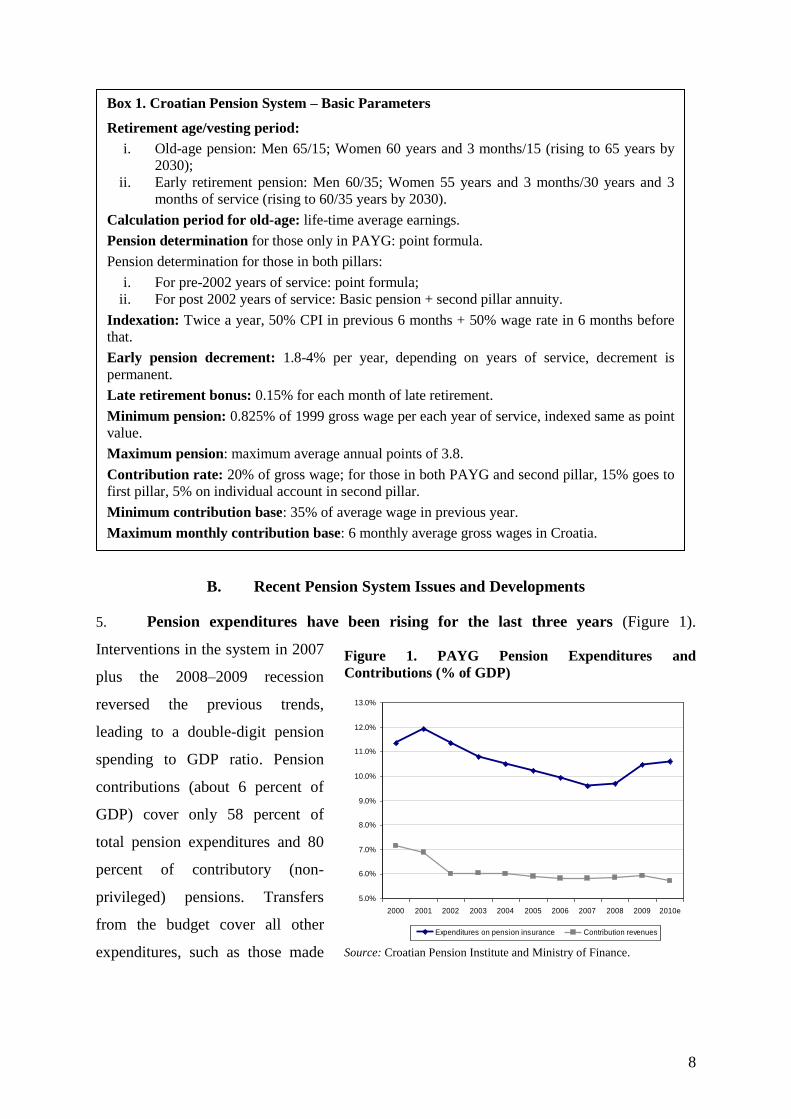
5. Pension expenditures have been rising for the last three years (Figure 1).
Interventions in the system in 2007
plus the 2008–2009 recession
reversed the previous trends,
leading to a double-digit pension
spending to GDP ratio. Pension
contributions (about 6 percent of
GDP) cover only 58 percent of
total pension expenditures and 80
percent of contributory (non-
privileged) pensions. Transfers
from the budget cover all other
expenditures, such as those made
Figure 1. PAYG Pension Expenditures and
Contributions (% of GDP)
Source: Croatian Pension Institute and Ministry of Finance.
5.0%
6.0%
7.0%
8.0%
9.0%
10.0%
11.0%
12.0%
13.0%
2000 2001 2002 2003 2004 2005 2006 2007 2008 2009 2010e
Expenditures on pension insurance Contribution revenues
Box 1. Croatian Pension System – Basic Parameters
Retirement age/vesting period:
i. Old-age pension: Men 65/15; Women 60 years and 3 months/15 (rising to 65 years by
2030);
ii. Early retirement pension: Men 60/35; Women 55 years and 3 months/30 years and 3
months of service (rising to 60/35 years by 2030).
Calculation period for old-age: life-time average earnings.
Pension determination for those only in PAYG: point formula.
Pension determination for those in both pillars:
i. For pre-2002 years of service: point formula;
ii. For post 2002 years of service: Basic pension + second pillar annuity.
Indexation: Twice a year, 50% CPI in previous 6 months + 50% wage rate in 6 months before
that.
Early pension decrement: 1.8-4% per year, depending on years of service, decrement is
permanent.
Late retirement bonus: 0.15% for each month of late retirement.
Minimum pension: 0.825% of 1999 gross wage per each year of service, indexed same as point
value.
Maximum pension: maximum average annual points of 3.8.
Contribution rate: 20% of gross wage; for those in both PAYG and second pillar, 15% goes to
first pillar, 5% on individual account in second pillar.
Minimum contribution base: 35% of average wage in previous year.
Maximum monthly contribution base: 6 monthly average gross wages in Croatia.
9
pursuant to special laws related to pension supplements, PAYG revenue shortfalls due to
second pillar contributions,18
and privileged pension payments.19
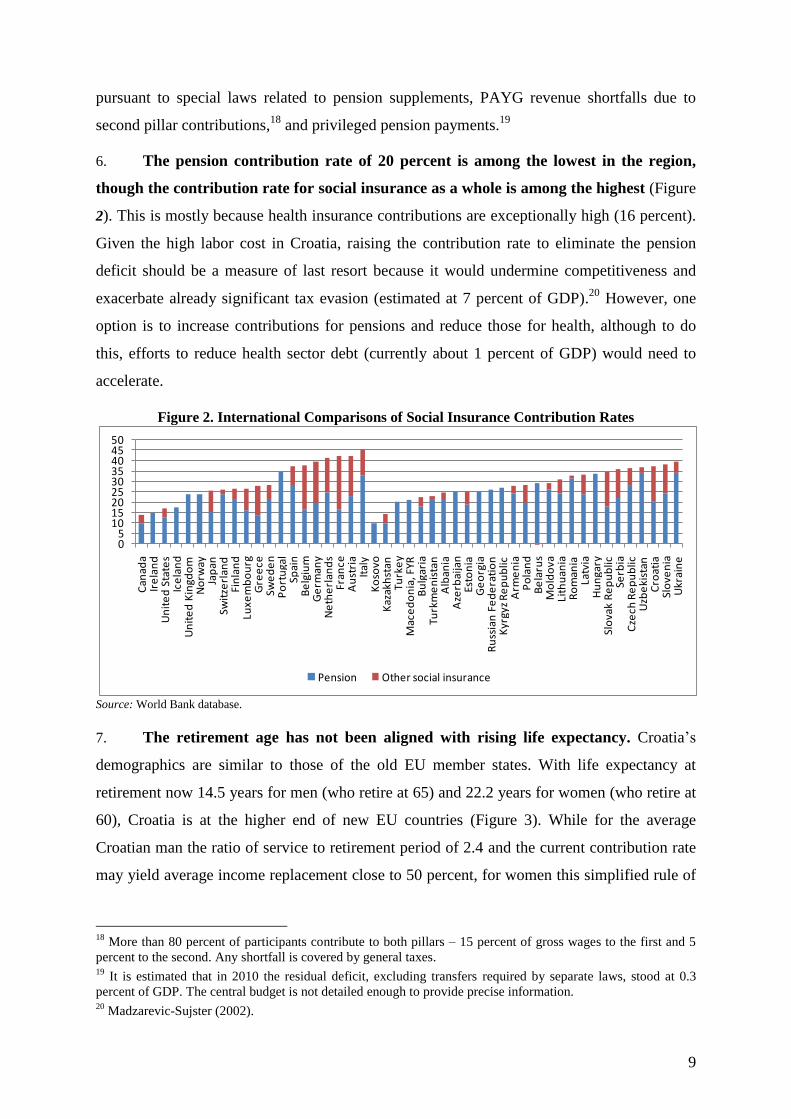
6. The pension contribution rate of 20 percent is among the lowest in the region,
though the contribution rate for social insurance as a whole is among the highest (Figure
2). This is mostly because health insurance contributions are exceptionally high (16 percent).
Given the high labor cost in Croatia, raising the contribution rate to eliminate the pension
deficit should be a measure of last resort because it would undermine competitiveness and
exacerbate already significant tax evasion (estimated at 7 percent of GDP).20
However, one
option is to increase contributions for pensions and reduce those for health, although to do
this, efforts to reduce health sector debt (currently about 1 percent of GDP) would need to
accelerate.
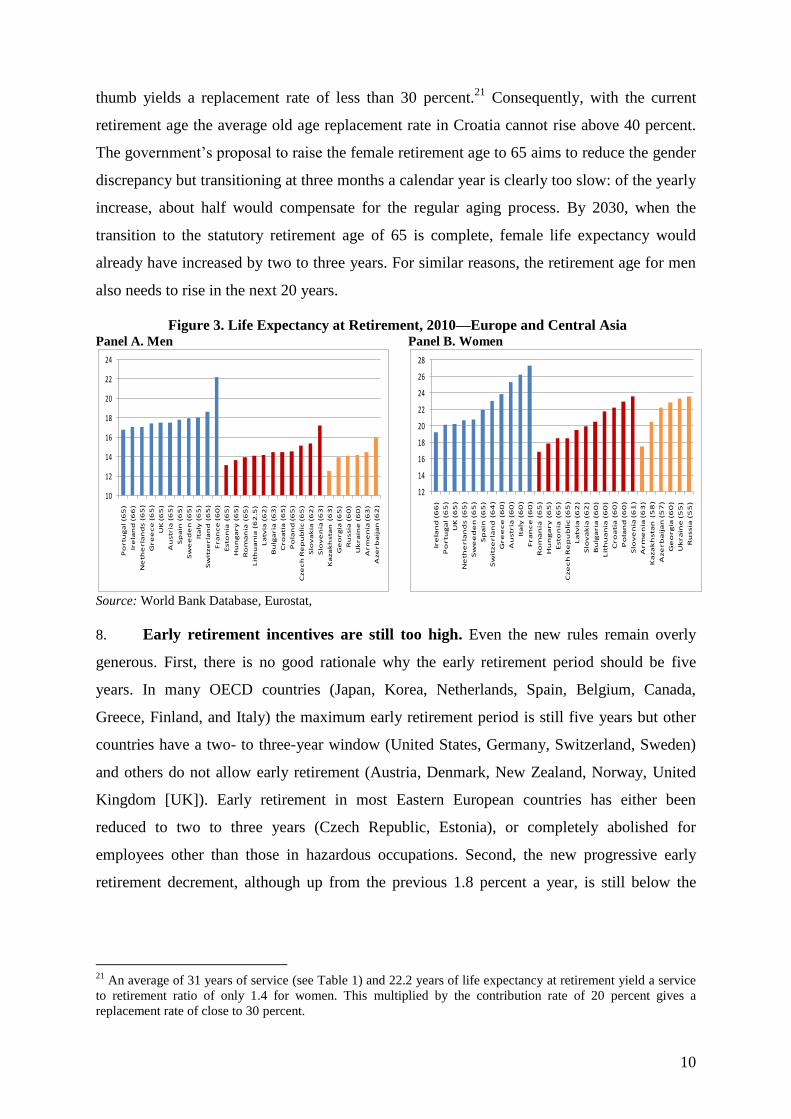
7. The retirement age has not been aligned with rising life expectancy. Croatia’s
demographics are similar to those of the old EU member states. With life expectancy at
retirement now 14.5 years for men (who retire at 65) and 22.2 years for women (who retire at
60), Croatia is at the higher end of new EU countries (Figure 3). While for the average
Croatian man the ratio of service to retirement period of 2.4 and the current contribution rate
may yield average income replacement close to 50 percent, for women this simplified rule of
18
More than 80 percent of participants contribute to both pillars – 15 percent of gross wages to the first and 5
percent to the second. Any shortfall is covered by general taxes. 19
It is estimated that in 2010 the residual deficit, excluding transfers required by separate laws, stood at 0.3
percent of GDP. The central budget is not detailed enough to provide precise information. 20
Madzarevic-Sujster (2002).
Figure 2. International Comparisons of Social Insurance Contribution Rates
Source: World Bank database.
05
101520253035404550
Can
ada
Ire
lan
dU
nit
ed
Sta
tes
Ice
lan
dU
nit
ed
Kin
gdo
mN
orw
ayJa
pan
Swit
zerl
and
Fin
lan
dLu
xem
bo
urg
Gre
ece
Swe
de
nP
ort
uga
lSp
ain
Be
lgiu
mG
erm
any
Ne
the
rlan
ds
Fran
ceA
ust
ria
Ital
yK
oso
voK
azak
hst
anTu
rke
yM
ace
do
nia
, FYR
Bu
lgar
iaTu
rkm
en
ista
nA
lban
iaA
zerb
aija
nEs
ton
iaG
eo
rgia
Ru
ssia
n F
ed
era
tio
nK
yrgy
z R
ep
ub
licA
rme
nia
Po
lan
dB
ela
rus
Mo
ldo
vaLi
thu
ania
Ro
man
iaLa
tvia
Hu
nga
rySl
ova
k R
ep
ub
licSe
rbia
Cze
ch R
ep
ub
licU
zbe
kist
anC
roat
iaSl
ove
nia
Ukr
ain
ePension Other social insurance
10
thumb yields a replacement rate of less than 30 percent.21
Consequently, with the current
retirement age the average old age replacement rate in Croatia cannot rise above 40 percent.
The government’s proposal to raise the female retirement age to 65 aims to reduce the gender
discrepancy but transitioning at three months a calendar year is clearly too slow: of the yearly
increase, about half would compensate for the regular aging process. By 2030, when the
transition to the statutory retirement age of 65 is complete, female life expectancy would
already have increased by two to three years. For similar reasons, the retirement age for men
also needs to rise in the next 20 years.
Figure 3. Life Expectancy at Retirement, 2010—Europe and Central Asia Panel A. Men Panel B. Women
Source: World Bank Database, Eurostat,
8. Early retirement incentives are still too high. Even the new rules remain overly
generous. First, there is no good rationale why the early retirement period should be five
years. In many OECD countries (Japan, Korea, Netherlands, Spain, Belgium, Canada,
Greece, Finland, and Italy) the maximum early retirement period is still five years but other
countries have a two- to three-year window (United States, Germany, Switzerland, Sweden)
and others do not allow early retirement (Austria, Denmark, New Zealand, Norway, United
Kingdom [UK]). Early retirement in most Eastern European countries has either been
reduced to two to three years (Czech Republic, Estonia), or completely abolished for
employees other than those in hazardous occupations. Second, the new progressive early
retirement decrement, although up from the previous 1.8 percent a year, is still below the
21
An average of 31 years of service (see Table 1) and 22.2 years of life expectancy at retirement yield a service
to retirement ratio of only 1.4 for women. This multiplied by the contribution rate of 20 percent gives a
replacement rate of close to 30 percent.
10
12
14
16
18
20
22
24
Po
rtu
ga
l (6
5)
Ire
lan
d (
66
)
Ne
the
rla
nd
s (
65
)
Gre
ec
e (
65
)
UK
(6
5)
Au
str
ia (
65
)
Sp
ain
(6
5)
Sw
ee
de
n (
65
)
Ita
ly (
65
)
Sw
itze
rla
nd
(6
5)
Fra
nc
e (
60
)
Esto
nia
(6
5)
Hu
ng
ary
(6
5)
Ro
ma
nia
(6
5)
Lit
hu
an
ia (
62
.5)
La
tvia
(6
2)
Bu
lga
ria
(6
3)
Cro
ati
a (
65
)
Po
lan
d (
65
)
Cze
ch
Re
pu
bli
c (
65
)
Slo
va
kia
(6
2)
Slo
ve
nia
(6
3)
Ka
za
kh
sta
n (
63
)
Ge
org
ia (
65
)
Ru
ssia
(6
0)
Uk
ra
ine
(6
0)
Arm
en
ia (
63
)
Aze
rb
aij
an
(6
2)
12
14
16
18
20
22
24
26
28
Ire
lan
d (
66
)
Po
rtu
ga
l (6
5)
UK
(6
5)
Ne
the
rla
nd
s (
65
)
Sw
ee
de
n (
65
)
Sp
ain
(6
5)
Sw
itze
rla
nd
(6
4)
Gre
ec
e (
60
)
Au
str
ia (
60
)
Ita
ly (
60
)
Fra
nc
e (
60
)
Ro
ma
nia
(6
5)
Hu
ng
ary
(6
5)
Esto
nia
(6
5)
Cze
ch
Re
pu
bli
c (
65
)
La
tvia
(6
2)
Slo
va
kia
(6
2)
Bu
lga
ria
(6
0)
Lit
hu
an
ia (
60
)
Cro
ati
a (
60
)
Po
lan
d (
60
)
Slo
ve
nia
(6
1)
Arm
en
ia (
63
)
Ka
za
kh
sta
n (
58
)
Aze
rb
aij
an
(5
7)
Ge
org
ia (
60
)
Uk
ra
ine
(5
5)
Ru
ssia
(5
5)
11
actuarially neutral level of 3 to 4 percent estimated for Croatia22
and decrement implemented
in many European countries (Slovenia, France, Austria, Latvia, Bulgaria, Slovak Republic,
Czech Republic). Hungary, Spain, and Italy have now introduced 5 and 6 percent decrements.
9. Incentives to postpone retirement are too weak. The new late retirement increment
of 1.8 percent a year is below the actuarially fair increment and is unlikely to stimulate a
longer stay in employment. In most EU countries the late retirement increment exceeds 3
percent a year; it reaches 5 percent in the Czech and Slovak Republics and even 7 percent in
Portugal.
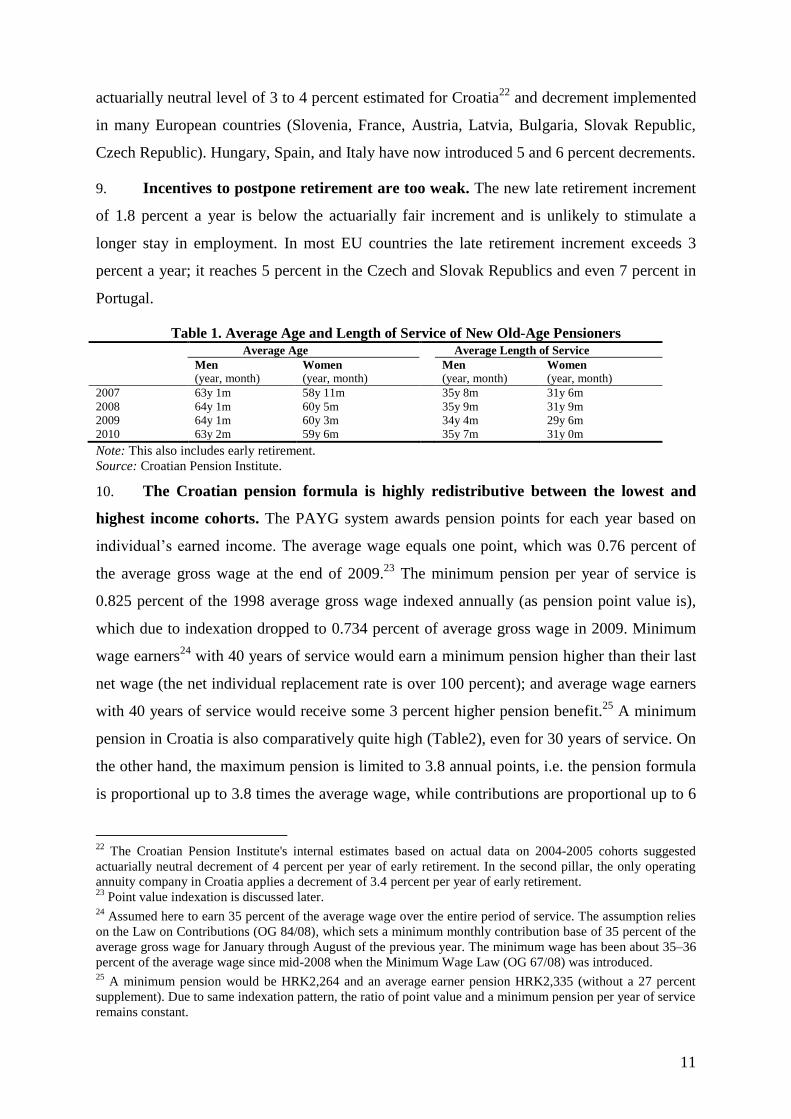
Table 1. Average Age and Length of Service of New Old-Age Pensioners
Average Age Average Length of Service
Men
(year, month) Women
(year, month)
Men
(year, month) Women
(year, month)
2007 63y 1m 58y 11m 35y 8m 31y 6m
2008 64y 1m 60y 5m 35y 9m 31y 9m
2009 64y 1m 60y 3m 34y 4m 29y 6m
2010 63y 2m 59y 6m 35y 7m 31y 0m
Note: This also includes early retirement.
Source: Croatian Pension Institute.
10. The Croatian pension formula is highly redistributive between the lowest and
highest income cohorts. The PAYG system awards pension points for each year based on
individual’s earned income. The average wage equals one point, which was 0.76 percent of
the average gross wage at the end of 2009.23
The minimum pension per year of service is
0.825 percent of the 1998 average gross wage indexed annually (as pension point value is),
which due to indexation dropped to 0.734 percent of average gross wage in 2009. Minimum
wage earners24
with 40 years of service would earn a minimum pension higher than their last
net wage (the net individual replacement rate is over 100 percent); and average wage earners
with 40 years of service would receive some 3 percent higher pension benefit.25
A minimum
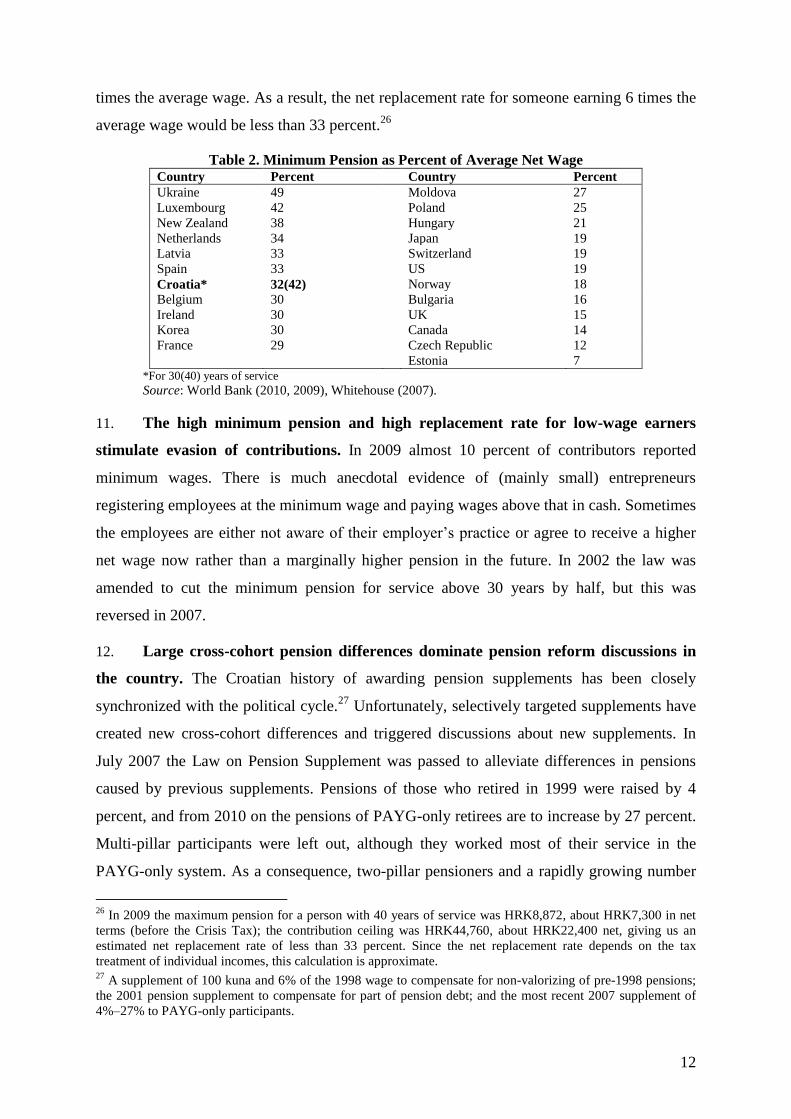
pension in Croatia is also comparatively quite high (Table2), even for 30 years of service. On
the other hand, the maximum pension is limited to 3.8 annual points, i.e. the pension formula
is proportional up to 3.8 times the average wage, while contributions are proportional up to 6
22
The Croatian Pension Institute's internal estimates based on actual data on 2004-2005 cohorts suggested
actuarially neutral decrement of 4 percent per year of early retirement. In the second pillar, the only operating
annuity company in Croatia applies a decrement of 3.4 percent per year of early retirement. 23
Point value indexation is discussed later. 24
Assumed here to earn 35 percent of the average wage over the entire period of service. The assumption relies
on the Law on Contributions (OG 84/08), which sets a minimum monthly contribution base of 35 percent of the
average gross wage for January through August of the previous year. The minimum wage has been about 35–36
percent of the average wage since mid-2008 when the Minimum Wage Law (OG 67/08) was introduced. 25
A minimum pension would be HRK2,264 and an average earner pension HRK2,335 (without a 27 percent
supplement). Due to same indexation pattern, the ratio of point value and a minimum pension per year of service
remains constant.
12
times the average wage. As a result, the net replacement rate for someone earning 6 times the
average wage would be less than 33 percent.26
Table 2. Minimum Pension as Percent of Average Net Wage Country Percent Country Percent
Ukraine 49 Moldova 27
Luxembourg 42 Poland 25
New Zealand 38 Hungary 21
Netherlands 34 Japan 19
Latvia 33 Switzerland 19
Spain 33 US 19
Croatia* 32(42) Norway 18
Belgium 30 Bulgaria 16
Ireland 30 UK 15
Korea 30 Canada 14
France 29 Czech Republic 12
Estonia 7 *For 30(40) years of service
Source: World Bank (2010, 2009), Whitehouse (2007).
11. The high minimum pension and high replacement rate for low-wage earners
stimulate evasion of contributions. In 2009 almost 10 percent of contributors reported
minimum wages. There is much anecdotal evidence of (mainly small) entrepreneurs
registering employees at the minimum wage and paying wages above that in cash. Sometimes
the employees are either not aware of their employer’s practice or agree to receive a higher
net wage now rather than a marginally higher pension in the future. In 2002 the law was
amended to cut the minimum pension for service above 30 years by half, but this was
reversed in 2007.
12. Large cross-cohort pension differences dominate pension reform discussions in
the country. The Croatian history of awarding pension supplements has been closely
synchronized with the political cycle.27
Unfortunately, selectively targeted supplements have
created new cross-cohort differences and triggered discussions about new supplements. In
July 2007 the Law on Pension Supplement was passed to alleviate differences in pensions
caused by previous supplements. Pensions of those who retired in 1999 were raised by 4
percent, and from 2010 on the pensions of PAYG-only retirees are to increase by 27 percent.
Multi-pillar participants were left out, although they worked most of their service in the
PAYG-only system. As a consequence, two-pillar pensioners and a rapidly growing number
26
In 2009 the maximum pension for a person with 40 years of service was HRK8,872, about HRK7,300 in net
terms (before the Crisis Tax); the contribution ceiling was HRK44,760, about HRK22,400 net, giving us an
estimated net replacement rate of less than 33 percent. Since the net replacement rate depends on the tax
treatment of individual incomes, this calculation is approximate. 27
A supplement of 100 kuna and 6% of the 1998 wage to compensate for non-valorizing of pre-1998 pensions;
the 2001 pension supplement to compensate for part of pension debt; and the most recent 2007 supplement of
4%–27% to PAYG-only participants.
13
of multi-pillar retirees will receive significantly lower pensions than PAYG-only participants.
Although the 2007 supplement discriminates against multi-pillar participants, its extension to
all insured individuals would extend costs far into the future and reduce fiscal space for the
second pillar rate increase (Section D).
13. The pension benefit formula undervalues historical earnings. The initial old-age
pension benefit is obtained by multiplying the sum of personal points for all years of service
by the point value, which is adjusted by the mean of inflation and the wage rate (the Swiss
formula). Pension payments are indexed similarly. Swiss valorization and indexation were
introduced to prevent large differences between new and old pensioners. Most OECD
countries and some Europe and Central Asia (ECA) countries (Table 3) have introduced 100
percent wage valorization and 100 percent price indexation. This is considered international
best practice because (a) it preserves the purchasing power of the elderly as they age; (b)
long-term, it yields both fiscally and socially sustainable benefits; and (c) it strengthens the
link between lifetime contributions and benefits.
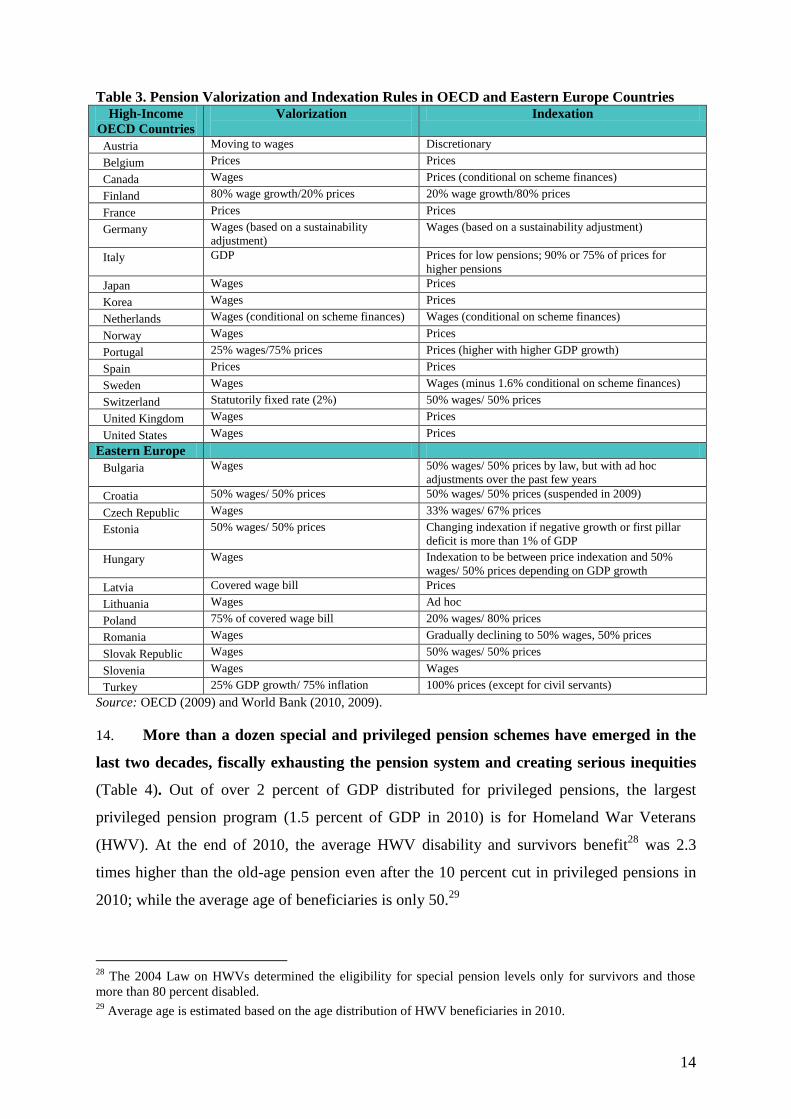
14
Table 3. Pension Valorization and Indexation Rules in OECD and Eastern Europe Countries High-Income
OECD Countries
Valorization
Indexation
Austria Moving to wages Discretionary
Belgium Prices Prices
Canada Wages Prices (conditional on scheme finances)
Finland 80% wage growth/20% prices 20% wage growth/80% prices
France Prices Prices
Germany Wages (based on a sustainability
adjustment)
Wages (based on a sustainability adjustment)
Italy GDP Prices for low pensions; 90% or 75% of prices for
higher pensions
Japan Wages Prices
Korea Wages Prices
Netherlands Wages (conditional on scheme finances) Wages (conditional on scheme finances)
Norway Wages Prices
Portugal 25% wages/75% prices Prices (higher with higher GDP growth)
Spain Prices Prices
Sweden Wages Wages (minus 1.6% conditional on scheme finances)
Switzerland Statutorily fixed rate (2%) 50% wages/ 50% prices
United Kingdom Wages Prices
United States Wages Prices
Eastern Europe
Bulgaria Wages 50% wages/ 50% prices by law, but with ad hoc
adjustments over the past few years
Croatia 50% wages/ 50% prices 50% wages/ 50% prices (suspended in 2009)
Czech Republic Wages 33% wages/ 67% prices
Estonia 50% wages/ 50% prices Changing indexation if negative growth or first pillar
deficit is more than 1% of GDP
Hungary Wages Indexation to be between price indexation and 50%
wages/ 50% prices depending on GDP growth
Latvia Covered wage bill Prices
Lithuania Wages Ad hoc
Poland 75% of covered wage bill 20% wages/ 80% prices
Romania Wages Gradually declining to 50% wages, 50% prices
Slovak Republic Wages 50% wages/ 50% prices
Slovenia Wages Wages
Turkey 25% GDP growth/ 75% inflation 100% prices (except for civil servants)
Source: OECD (2009) and World Bank (2010, 2009).
14. More than a dozen special and privileged pension schemes have emerged in the
last two decades, fiscally exhausting the pension system and creating serious inequities
(Table 4). Out of over 2 percent of GDP distributed for privileged pensions, the largest
privileged pension program (1.5 percent of GDP in 2010) is for Homeland War Veterans
(HWV). At the end of 2010, the average HWV disability and survivors benefit28
was 2.3
times higher than the old-age pension even after the 10 percent cut in privileged pensions in
2010; while the average age of beneficiaries is only 50.29
28
The 2004 Law on HWVs determined the eligibility for special pension levels only for survivors and those
more than 80 percent disabled. 29
Average age is estimated based on the age distribution of HWV beneficiaries in 2010.
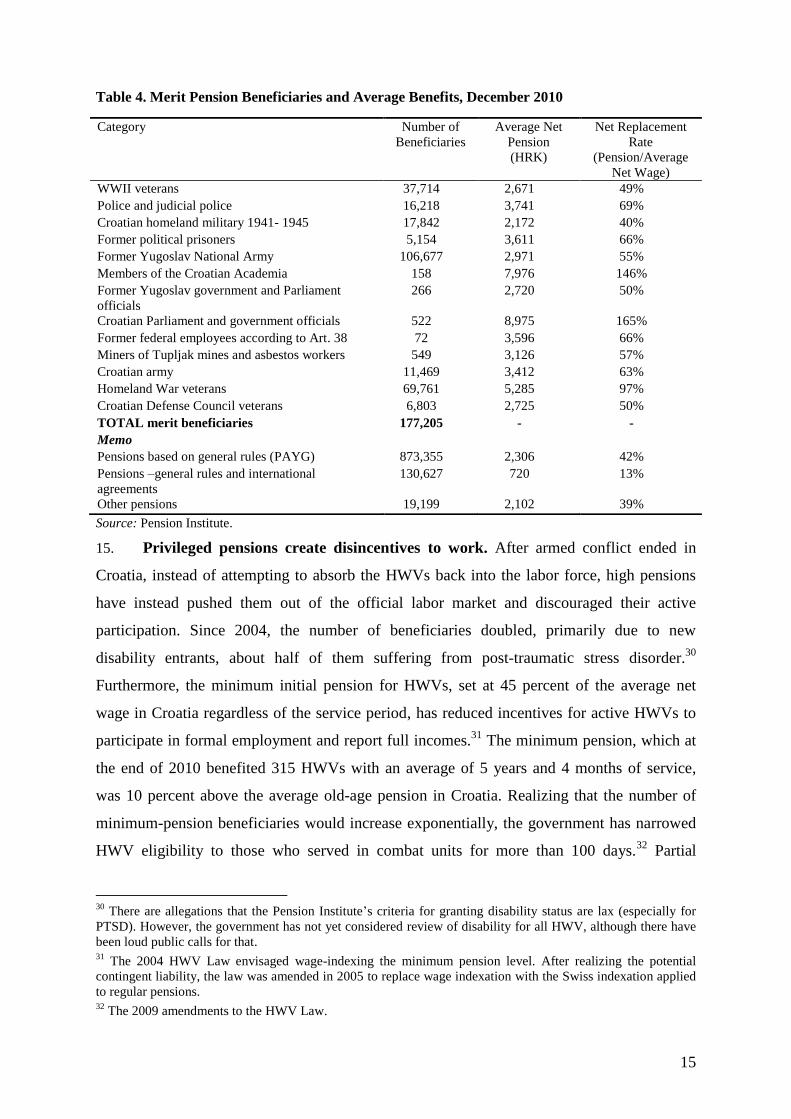
15
Table 4. Merit Pension Beneficiaries and Average Benefits, December 2010
Source: Pension Institute.
15. Privileged pensions create disincentives to work. After armed conflict ended in
Croatia, instead of attempting to absorb the HWVs back into the labor force, high pensions
have instead pushed them out of the official labor market and discouraged their active
participation. Since 2004, the number of beneficiaries doubled, primarily due to new
disability entrants, about half of them suffering from post-traumatic stress disorder.30
Furthermore, the minimum initial pension for HWVs, set at 45 percent of the average net
wage in Croatia regardless of the service period, has reduced incentives for active HWVs to
participate in formal employment and report full incomes.31
The minimum pension, which at
the end of 2010 benefited 315 HWVs with an average of 5 years and 4 months of service,
was 10 percent above the average old-age pension in Croatia. Realizing that the number of
minimum-pension beneficiaries would increase exponentially, the government has narrowed
HWV eligibility to those who served in combat units for more than 100 days.32
Partial
30
There are allegations that the Pension Institute’s criteria for granting disability status are lax (especially for
PTSD). However, the government has not yet considered review of disability for all HWV, although there have
been loud public calls for that. 31
The 2004 HWV Law envisaged wage-indexing the minimum pension level. After realizing the potential
contingent liability, the law was amended in 2005 to replace wage indexation with the Swiss indexation applied
to regular pensions. 32
The 2009 amendments to the HWV Law.
Category Number of
Beneficiaries
Average Net
Pension
(HRK)
Net Replacement
Rate
(Pension/Average
Net Wage)
WWII veterans 37,714 2,671 49%
Police and judicial police 16,218 3,741 69%
Croatian homeland military 1941- 1945 17,842 2,172 40%
Former political prisoners 5,154 3,611 66%
Former Yugoslav National Army 106,677 2,971 55%
Members of the Croatian Academia 158 7,976 146%
Former Yugoslav government and Parliament
officials
266 2,720 50%
Croatian Parliament and government officials 522 8,975 165%
Former federal employees according to Art. 38 72 3,596 66%
Miners of Tupljak mines and asbestos workers 549 3,126 57%
Croatian army 11,469 3,412 63%
Homeland War veterans 69,761 5,285 97%
Croatian Defense Council veterans 6,803 2,725 50%
TOTAL merit beneficiaries 177,205 - -
Memo
Pensions based on general rules (PAYG) 873,355 2,306 42%
Pensions –general rules and international
agreements
130,627 720 13%
Other pensions 19,199 2,102 39%
16
reforms to military and police pension systems were launched early in the 2000s to extend the
vesting period to 35 service years for men and 30 for women, raising the retirement age to
regular retirement age, and widening the calculation period to the 10 best-earning years. The
number of pension beneficiaries who participated in World War II or had been political
prisoners is declining gradually.
16. There is no clear justification for privileged pension benefits for members of
Parliament, government officials, constitutional court judges, and academics. Their jobs
are not hazardous to require early retirement and their above-average wages would earn more
points in the regular PAYG system. Their retirement age is also lower than in the general
system, with equalization of retirement age for women (to 60) planned for 2030. In June 2010
the Law on Privileged Pension Reduction cut practically all privileged pensions above
HRK3,500 by 10 percent (except 100 percent disabled war veterans, coal miners, and
asbestos workers). Most important, this measure was announced as the beginning of a more
comprehensive reform to bring privileged pensions to convergence with general pension
levels.
17. Second pillar funds have regained pre-crisis rates of return. At the end of 2010,
second pillar membership of 1.56 million exceeded registered employment (of about 1.37
million).33
Net second pillar assets reached 10 percent of GDP, with pension funds now
becoming the largest non-bank institutional investor in the capital market. In the first six
years of operation (2002–07), the rates of return on second pillar pension funds significantly
outgrew average wage growth, except for 2008 (Table 5). Second pillar accounts lost 12.5
percent on average, while wages continued to grow. Pre-crisis rates of return were restored in
2009 and 2010, while average wages moderated in 2009 and even declined in 2010. The
average nominal net rate of return since second pillar inception was 5.3 percent, with a real
rate of 3.1 percent, slightly above real average wage growth. Nevertheless, the contribution
rate for the second pillar in Croatia has been held at only 5 percent, restraining future annuity
levels that were supposed to partially substitute for PAYG pensions. Frequent costly
interventions in the PAYG system have reduced the fiscal space for the planned increase of
the contribution rate to 10 percent.
33
There are some 300,000 accounts of individuals who are not insured in the PAYG system, such as students,
temporary employees, mothers for whom the state contributed, etc., that have some occasional account activity.
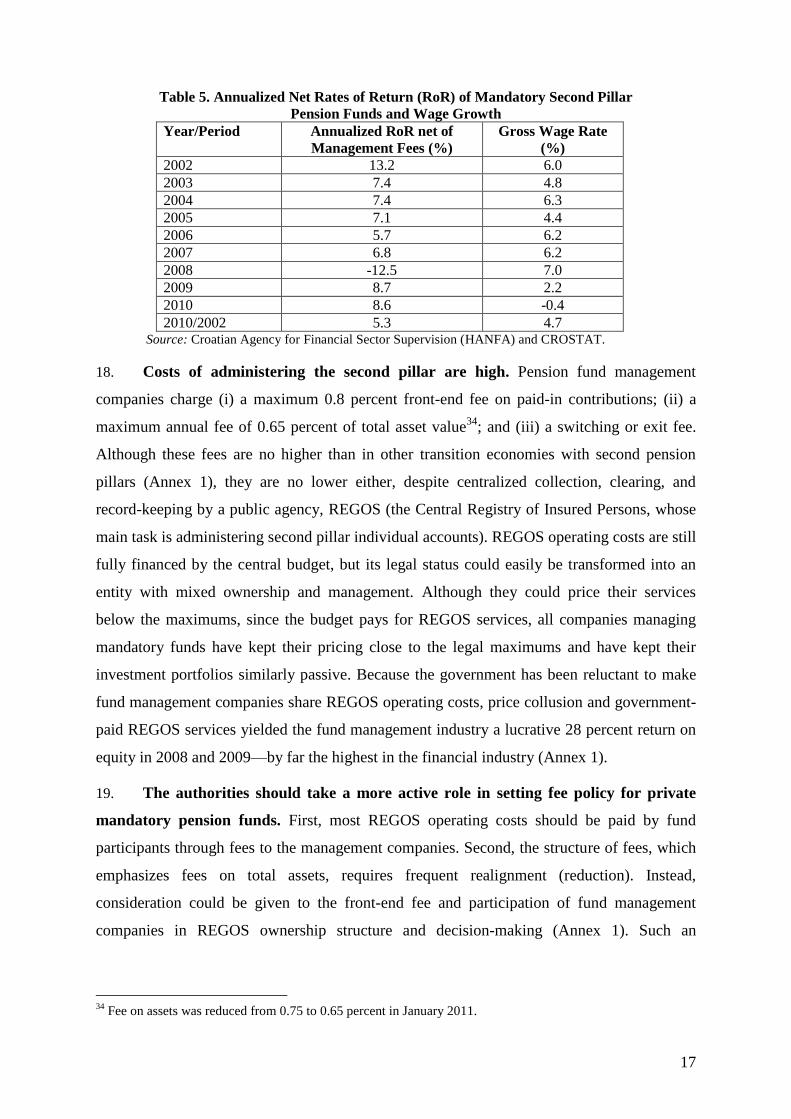
17
Table 5. Annualized Net Rates of Return (RoR) of Mandatory Second Pillar
Pension Funds and Wage Growth
Year/Period Annualized RoR net of
Management Fees (%)
Gross Wage Rate
(%)
2002 13.2 6.0
2003 7.4 4.8
2004 7.4 6.3
2005 7.1 4.4
2006 5.7 6.2
2007 6.8 6.2
2008 -12.5 7.0
2009 8.7 2.2
2010 8.6 -0.4
2010/2002 5.3 4.7 Source: Croatian Agency for Financial Sector Supervision (HANFA) and CROSTAT.
18. Costs of administering the second pillar are high. Pension fund management
companies charge (i) a maximum 0.8 percent front-end fee on paid-in contributions; (ii) a
maximum annual fee of 0.65 percent of total asset value34
; and (iii) a switching or exit fee.
Although these fees are no higher than in other transition economies with second pension
pillars (Annex 1), they are no lower either, despite centralized collection, clearing, and
record-keeping by a public agency, REGOS (the Central Registry of Insured Persons, whose
main task is administering second pillar individual accounts). REGOS operating costs are still
fully financed by the central budget, but its legal status could easily be transformed into an
entity with mixed ownership and management. Although they could price their services
below the maximums, since the budget pays for REGOS services, all companies managing
mandatory funds have kept their pricing close to the legal maximums and have kept their
investment portfolios similarly passive. Because the government has been reluctant to make
fund management companies share REGOS operating costs, price collusion and government-
paid REGOS services yielded the fund management industry a lucrative 28 percent return on
equity in 2008 and 2009—by far the highest in the financial industry (Annex 1).
19. The authorities should take a more active role in setting fee policy for private
mandatory pension funds. First, most REGOS operating costs should be paid by fund
participants through fees to the management companies. Second, the structure of fees, which
emphasizes fees on total assets, requires frequent realignment (reduction). Instead,
consideration could be given to the front-end fee and participation of fund management
companies in REGOS ownership structure and decision-making (Annex 1). Such an
34
Fee on assets was reduced from 0.75 to 0.65 percent in January 2011.
18
arrangement has shown positive results in countries like Estonia and Mexico.35
Revision of
the second pillar administration system thus should include (i) revision of the level and
structure of fees to make it compatible with the centralized administration system; (ii)
revision of the responsibilities of REGOS in the centralized monthly personified data
collection of all payroll taxes; and (iii) participation of mandatory fund management
companies in REGOS ownership structure and management.
C. Projections of the Current System
20. Projection of the impact of reform on the financial sustainability of the pension
system relies on the World Bank PROST model adjusted to fit Croatian pension system
parameters.36
PROST incorporates the most recent demographic and economic data,
including detailed data on the age, gender, and earnings of pension system contributors and
beneficiaries, special pension categories (here limited to HWVs and military and police
personnel),37
pension system eligibility requirements, the benefit formula, and system
parameters. After establishing the baseline using projected economic and demographic
trends, the model is run to estimate future outcomes in terms of coverage, dependency ratio,
pension system financial flows, replacement rates for new and current pensioners, etc. The
base year for the Croatia PROST model is 2009, with data for 2010 included when available.
The baseline scenario assumes economic recovery starting from 2011,38
with GDP growing
2.3 percent in 2011-12 and 3.9 percent in 2013–20, then slowing toward 2.1 percent in 2021–
35 and 1.5 percent in 2036–70 in line with the convergence hypothesis. Such growth is
expected as a result of underlying employment and productivity changes. Employment is
projected to expand in the period up to 2020 in line with the economic recovery, but decline
afterwards with faster population ageing. Employment growth in the baseline scenario
accounts for the recently enacted rise in legal retirement age.39
Labor productivity and wages
are assumed to increase on average at 2.2 percent a year for 2010 through 2070, with the pace
faster up to 2020 because of productivity gains related to EU accession, and slowing
35
The Croatian Central Clearing Depository Company (former Central Depository Agency) took such an
approach. 36
PROST is a standard World Bank tool used to analyze pension system features in more than 90 countries. 37
For the special pension categories for HWVs and military and police personnel, separate PROST modules
were developed to allow group-specific simulations. 38
Macroeconomic assumptions are based on the government’s Pre-Accession Economic Program 2011–2013;
the IMF World Economic Outlook Database (October 2010); the Institute of Economics (Croatian Economic
Outlook Quarterly, October 2010); and World Bank staff projections. 39
The baseline scenario implies pension system parameters as of January 1, 2011, with all 2010 policy
interventions, including the higher early retirement decrement and equalizing retirement age, taken into account.
To assess the impact of recent measures, there is a pre-baseline scenario using pre-reform parameters.
19
gradually thereafter. Inflation is set at 3 percent by 2025 and then decelerates to 2 percent by
2070. Total fertility rate is assumed to increase slowly from the current 1.4 to 1.85 in 2070.40
The real gross rate of return on second pillar individual accounts is projected at 3.6 percent in
the accumulation phase and 0.5 percent in the annuities phase. Annuity calculations are
unisex based on World Bank population projections.
Table 6. Macroeconomic Assumptions in the Baseline Scenario (period average)
2011–2012 2013–2020 2021-2035 2036-2070
Average employment
growth (per year)
1.1 1.5 -0.2 -0.7
Real wage growth 1.1 2.7 2.2 2.2
Inflation rate 2.8 3.0 2.9 2.5
Real GDP growth 2.3 3.9 2.1 1.5
Sources: Government of the Republic of Croatia (Pre-Accession Economic Program 2011–2013); IMF (WEO
Database, October 2010); the Institute of Economics (Croatian Economic Outlook Quarterly, October 2010);
and World Bank staff projections.
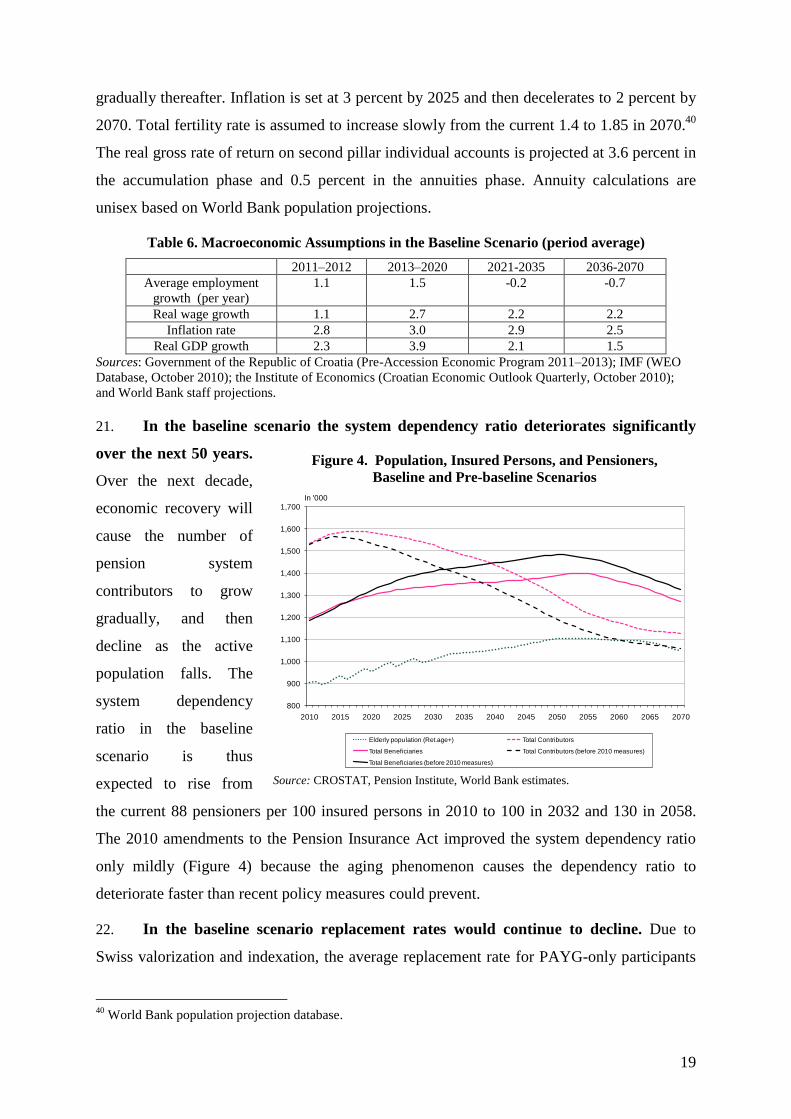
21. In the baseline scenario the system dependency ratio deteriorates significantly
over the next 50 years.
Over the next decade,
economic recovery will
cause the number of
pension system
contributors to grow
gradually, and then
decline as the active
population falls. The
system dependency
ratio in the baseline
scenario is thus
expected to rise from
the current 88 pensioners per 100 insured persons in 2010 to 100 in 2032 and 130 in 2058.
The 2010 amendments to the Pension Insurance Act improved the system dependency ratio
only mildly (Figure 4) because the aging phenomenon causes the dependency ratio to
deteriorate faster than recent policy measures could prevent.
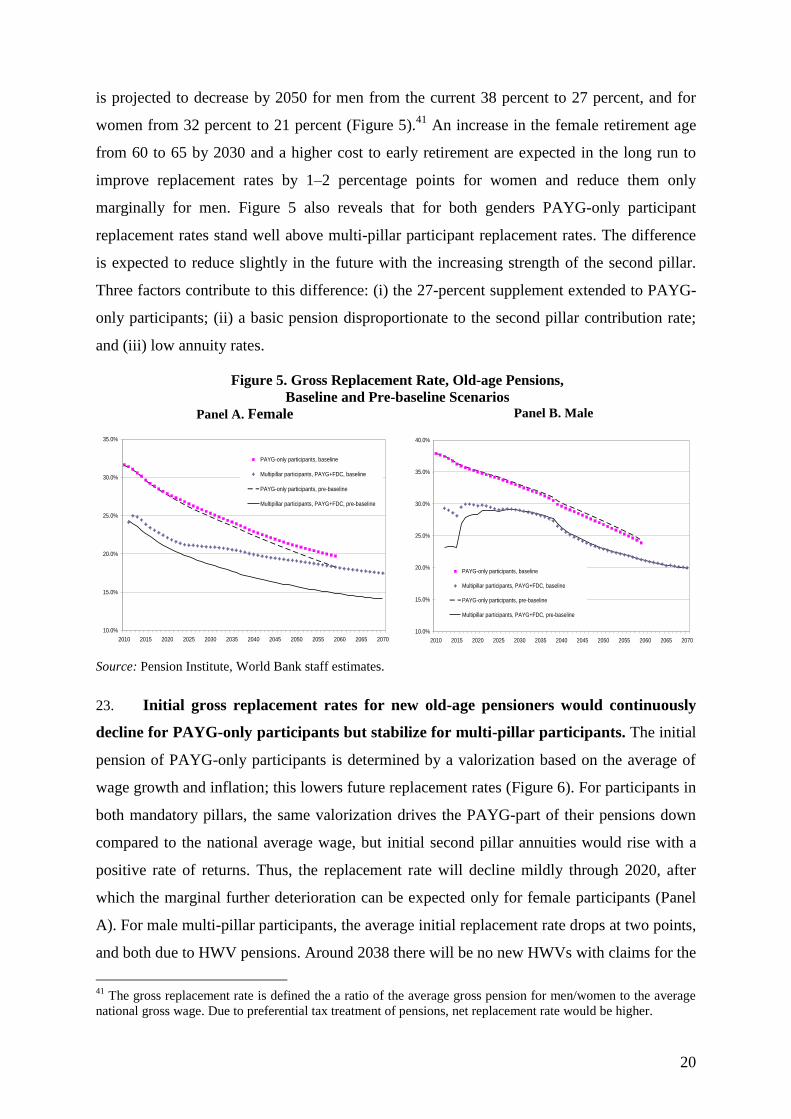
22. In the baseline scenario replacement rates would continue to decline. Due to
Swiss valorization and indexation, the average replacement rate for PAYG-only participants
40
World Bank population projection database.
Figure 4. Population, Insured Persons, and Pensioners,
Baseline and Pre-baseline Scenarios
Source: CROSTAT, Pension Institute, World Bank estimates.
800
900
1,000
1,100
1,200
1,300
1,400
1,500
1,600
1,700
2010 2015 2020 2025 2030 2035 2040 2045 2050 2055 2060 2065 2070
Elderly population (Ret.age+) Total Contributors
Total Beneficiaries Total Contributors (before 2010 measures)
Total Beneficiaries (before 2010 measures)
In '000
20
is projected to decrease by 2050 for men from the current 38 percent to 27 percent, and for
women from 32 percent to 21 percent (Figure 5).41
An increase in the female retirement age
from 60 to 65 by 2030 and a higher cost to early retirement are expected in the long run to
improve replacement rates by 1–2 percentage points for women and reduce them only
marginally for men. Figure 5 also reveals that for both genders PAYG-only participant
replacement rates stand well above multi-pillar participant replacement rates. The difference
is expected to reduce slightly in the future with the increasing strength of the second pillar.
Three factors contribute to this difference: (i) the 27-percent supplement extended to PAYG-
only participants; (ii) a basic pension disproportionate to the second pillar contribution rate;
and (iii) low annuity rates.
Figure 5. Gross Replacement Rate, Old-age Pensions,
Baseline and Pre-baseline Scenarios Panel A. Female Panel B. Male
Source: Pension Institute, World Bank staff estimates.
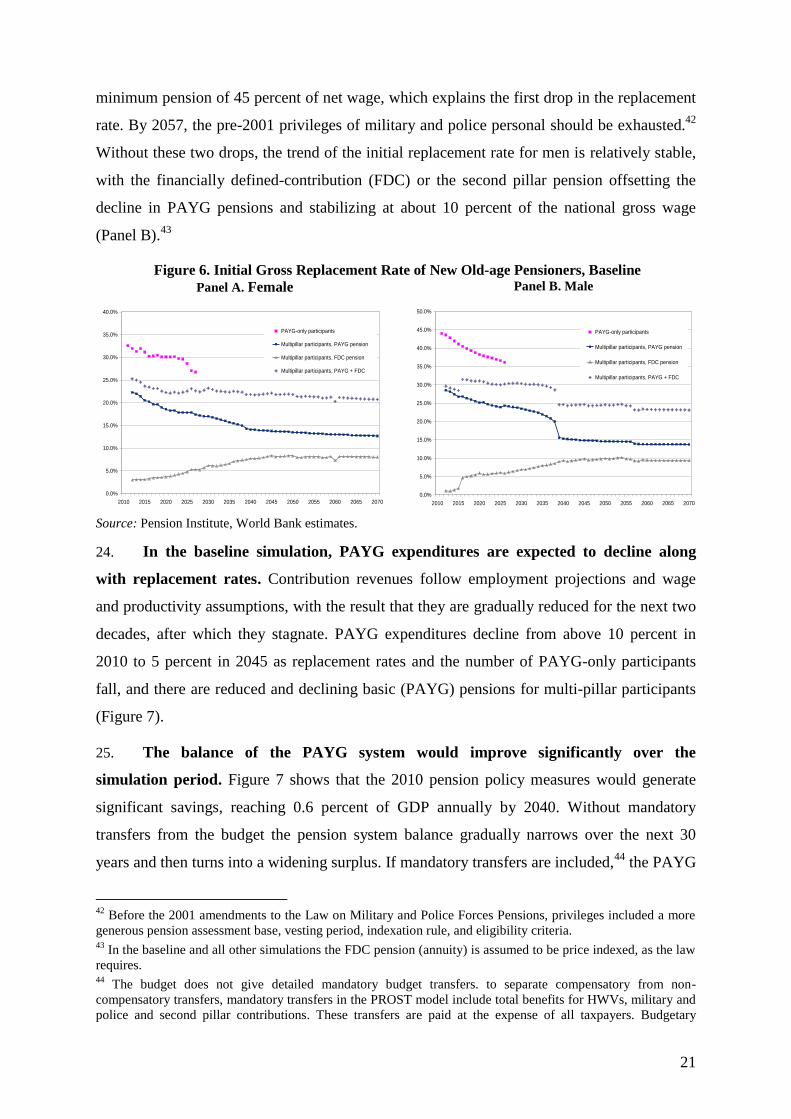
23. Initial gross replacement rates for new old-age pensioners would continuously
decline for PAYG-only participants but stabilize for multi-pillar participants. The initial
pension of PAYG-only participants is determined by a valorization based on the average of
wage growth and inflation; this lowers future replacement rates (Figure 6). For participants in
both mandatory pillars, the same valorization drives the PAYG-part of their pensions down
compared to the national average wage, but initial second pillar annuities would rise with a
positive rate of returns. Thus, the replacement rate will decline mildly through 2020, after
which the marginal further deterioration can be expected only for female participants (Panel
A). For male multi-pillar participants, the average initial replacement rate drops at two points,
and both due to HWV pensions. Around 2038 there will be no new HWVs with claims for the
41
The gross replacement rate is defined the a ratio of the average gross pension for men/women to the average
national gross wage. Due to preferential tax treatment of pensions, net replacement rate would be higher.
10.0%
15.0%
20.0%
25.0%
30.0%
35.0%
2010 2015 2020 2025 2030 2035 2040 2045 2050 2055 2060 2065 2070
PAYG-only participants, baseline
Multipillar participants, PAYG+FDC, baseline
PAYG-only participants, pre-baseline
Multipillar participants, PAYG+FDC, pre-baseline
10.0%
15.0%
20.0%
25.0%
30.0%
35.0%
40.0%
2010 2015 2020 2025 2030 2035 2040 2045 2050 2055 2060 2065 2070
PAYG-only participants, baseline
Multipillar participants, PAYG+FDC, baseline
PAYG-only participants, pre-baseline
Multipillar participants, PAYG+FDC, pre-baseline
21
minimum pension of 45 percent of net wage, which explains the first drop in the replacement
rate. By 2057, the pre-2001 privileges of military and police personal should be exhausted.42
Without these two drops, the trend of the initial replacement rate for men is relatively stable,
with the financially defined-contribution (FDC) or the second pillar pension offsetting the
decline in PAYG pensions and stabilizing at about 10 percent of the national gross wage
(Panel B).43
Figure 6. Initial Gross Replacement Rate of New Old-age Pensioners, Baseline Panel A. Female Panel B. Male
Source: Pension Institute, World Bank estimates.
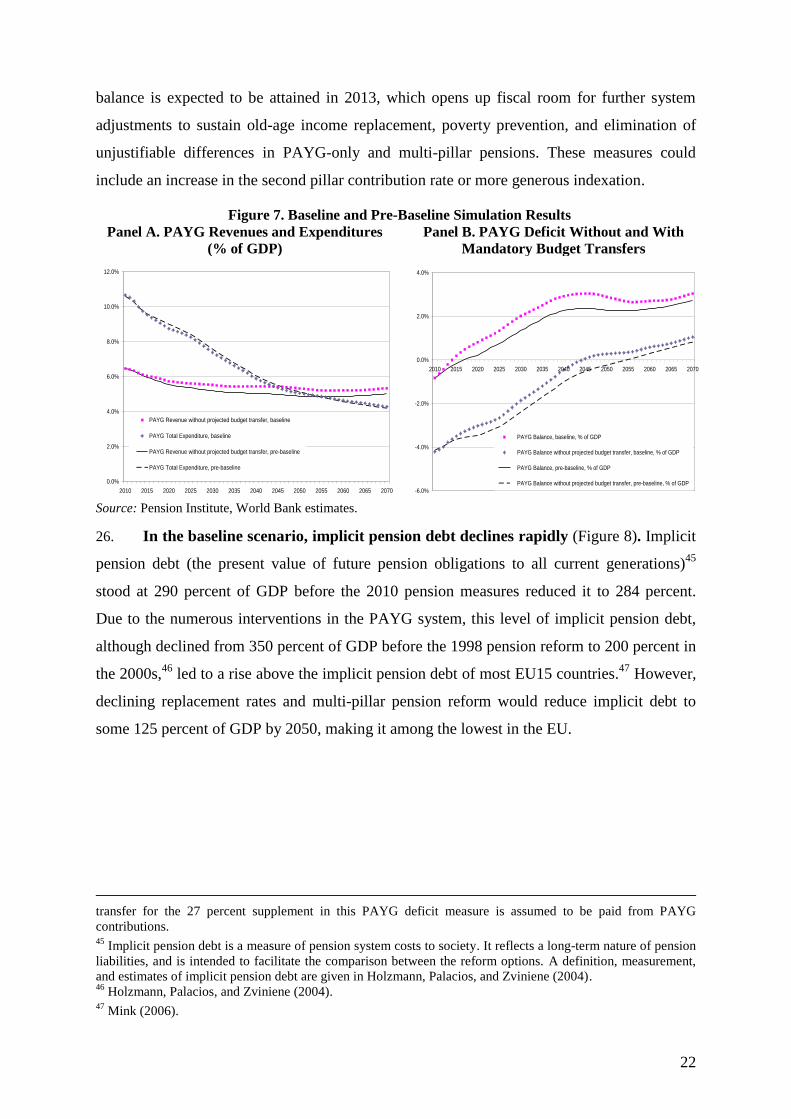
24. In the baseline simulation, PAYG expenditures are expected to decline along
with replacement rates. Contribution revenues follow employment projections and wage
and productivity assumptions, with the result that they are gradually reduced for the next two
decades, after which they stagnate. PAYG expenditures decline from above 10 percent in
2010 to 5 percent in 2045 as replacement rates and the number of PAYG-only participants
fall, and there are reduced and declining basic (PAYG) pensions for multi-pillar participants
(Figure 7).
25. The balance of the PAYG system would improve significantly over the
simulation period. Figure 7 shows that the 2010 pension policy measures would generate
significant savings, reaching 0.6 percent of GDP annually by 2040. Without mandatory
transfers from the budget the pension system balance gradually narrows over the next 30
years and then turns into a widening surplus. If mandatory transfers are included,44
the PAYG
42
Before the 2001 amendments to the Law on Military and Police Forces Pensions, privileges included a more
generous pension assessment base, vesting period, indexation rule, and eligibility criteria. 43
In the baseline and all other simulations the FDC pension (annuity) is assumed to be price indexed, as the law
requires. 44
The budget does not give detailed mandatory budget transfers. to separate compensatory from non-
compensatory transfers, mandatory transfers in the PROST model include total benefits for HWVs, military and
police and second pillar contributions. These transfers are paid at the expense of all taxpayers. Budgetary
0.0%
5.0%
10.0%
15.0%
20.0%
25.0%
30.0%
35.0%
40.0%
2010 2015 2020 2025 2030 2035 2040 2045 2050 2055 2060 2065 2070
PAYG-only participants
Multipillar participants, PAYG pension
Multipillar participants, FDC pension
Multipillar participants, PAYG + FDC
0.0%
5.0%
10.0%
15.0%
20.0%
25.0%
30.0%
35.0%
40.0%
45.0%
50.0%
2010 2015 2020 2025 2030 2035 2040 2045 2050 2055 2060 2065 2070
PAYG-only participants
Multipillar participants, PAYG pension
Multipillar participants, FDC pension
Multipillar participants, PAYG + FDC
22
balance is expected to be attained in 2013, which opens up fiscal room for further system
adjustments to sustain old-age income replacement, poverty prevention, and elimination of
unjustifiable differences in PAYG-only and multi-pillar pensions. These measures could
include an increase in the second pillar contribution rate or more generous indexation.
Figure 7. Baseline and Pre-Baseline Simulation Results
Panel A. PAYG Revenues and Expenditures
(% of GDP)
Panel B. PAYG Deficit Without and With
Mandatory Budget Transfers
Source: Pension Institute, World Bank estimates.
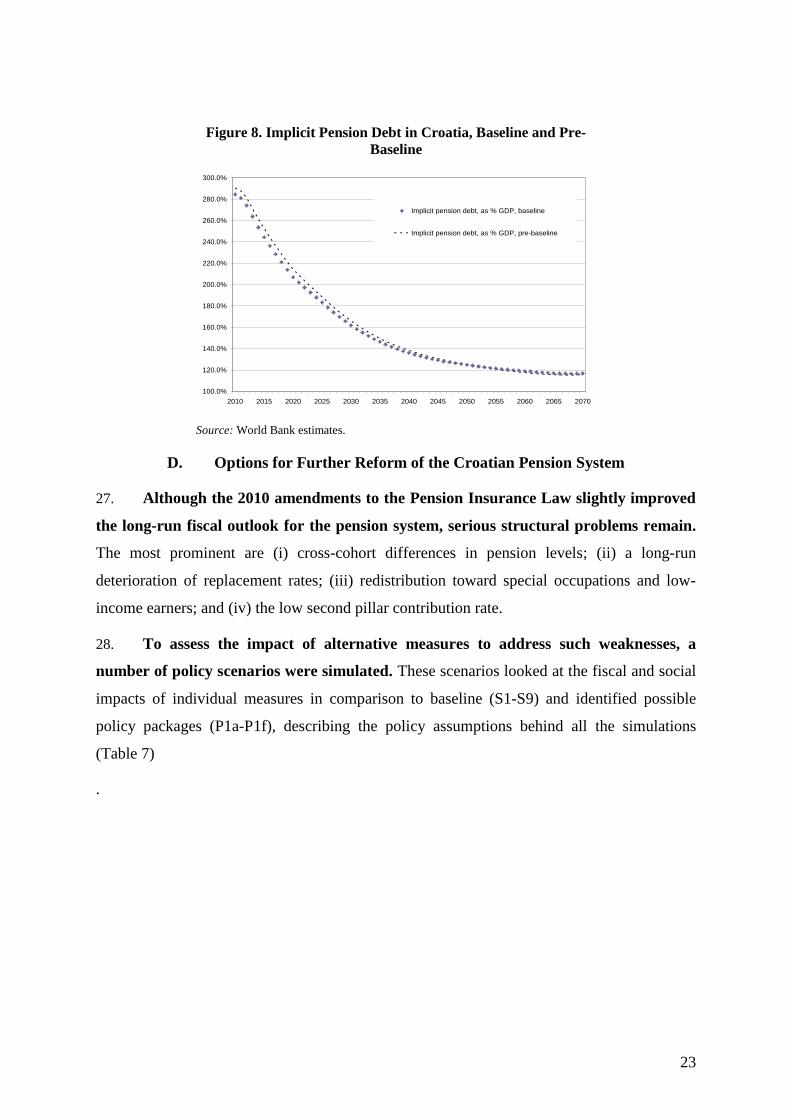
26. In the baseline scenario, implicit pension debt declines rapidly (Figure 8). Implicit
pension debt (the present value of future pension obligations to all current generations)45
stood at 290 percent of GDP before the 2010 pension measures reduced it to 284 percent.
Due to the numerous interventions in the PAYG system, this level of implicit pension debt,
although declined from 350 percent of GDP before the 1998 pension reform to 200 percent in
the 2000s,46
led to a rise above the implicit pension debt of most EU15 countries.47
However,
declining replacement rates and multi-pillar pension reform would reduce implicit debt to
some 125 percent of GDP by 2050, making it among the lowest in the EU.
transfer for the 27 percent supplement in this PAYG deficit measure is assumed to be paid from PAYG
contributions. 45
Implicit pension debt is a measure of pension system costs to society. It reflects a long-term nature of pension
liabilities, and is intended to facilitate the comparison between the reform options. A definition, measurement,
and estimates of implicit pension debt are given in Holzmann, Palacios, and Zviniene (2004). 46
Holzmann, Palacios, and Zviniene (2004). 47
Mink (2006).
0.0%
2.0%
4.0%
6.0%
8.0%
10.0%
12.0%
2010 2015 2020 2025 2030 2035 2040 2045 2050 2055 2060 2065 2070
PAYG Revenue without projected budget transfer, baseline
PAYG Total Expenditure, baseline
PAYG Revenue without projected budget transfer, pre-baseline
PAYG Total Expenditure, pre-baseline
-6.0%
-4.0%
-2.0%
0.0%
2.0%
4.0%
2010 2015 2020 2025 2030 2035 2040 2045 2050 2055 2060 2065 2070
PAYG Balance, baseline, % of GDP
PAYG Balance without projected budget transfer, baseline, % of GDP
PAYG Balance, pre-baseline, % of GDP
PAYG Balance without projected budget transfer, pre-baseline, % of GDP
23
D. Options for Further Reform of the Croatian Pension System
27. Although the 2010 amendments to the Pension Insurance Law slightly improved
the long-run fiscal outlook for the pension system, serious structural problems remain.
The most prominent are (i) cross-cohort differences in pension levels; (ii) a long-run
deterioration of replacement rates; (iii) redistribution toward special occupations and low-
income earners; and (iv) the low second pillar contribution rate.
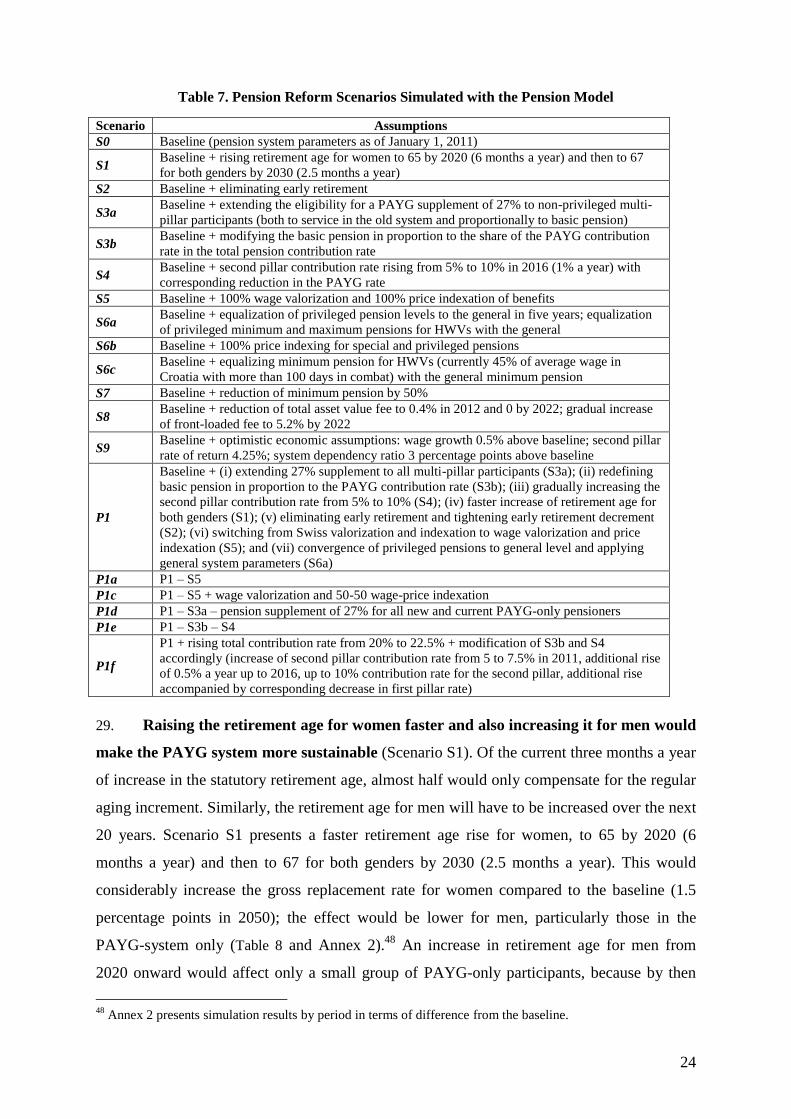
28. To assess the impact of alternative measures to address such weaknesses, a
number of policy scenarios were simulated. These scenarios looked at the fiscal and social
impacts of individual measures in comparison to baseline (S1-S9) and identified possible
policy packages (P1a-P1f), describing the policy assumptions behind all the simulations
(Table 7)
.
Figure 8. Implicit Pension Debt in Croatia, Baseline and Pre-
Baseline
Source: World Bank estimates.
100.0%
120.0%
140.0%
160.0%
180.0%
200.0%
220.0%
240.0%
260.0%
280.0%
300.0%
2010 2015 2020 2025 2030 2035 2040 2045 2050 2055 2060 2065 2070
Implicit pension debt, as % GDP, baseline
Implicit pension debt, as % GDP, pre-baseline
24
Table 7. Pension Reform Scenarios Simulated with the Pension Model
29. Raising the retirement age for women faster and also increasing it for men would
make the PAYG system more sustainable (Scenario S1). Of the current three months a year
of increase in the statutory retirement age, almost half would only compensate for the regular
aging increment. Similarly, the retirement age for men will have to be increased over the next
20 years. Scenario S1 presents a faster retirement age rise for women, to 65 by 2020 (6
months a year) and then to 67 for both genders by 2030 (2.5 months a year). This would
considerably increase the gross replacement rate for women compared to the baseline (1.5
percentage points in 2050); the effect would be lower for men, particularly those in the
PAYG-system only (Table 8 and Annex 2).48
An increase in retirement age for men from
2020 onward would affect only a small group of PAYG-only participants, because by then
48
Annex 2 presents simulation results by period in terms of difference from the baseline.
Scenario Assumptions
S0 Baseline (pension system parameters as of January 1, 2011)
S1 Baseline + rising retirement age for women to 65 by 2020 (6 months a year) and then to 67
for both genders by 2030 (2.5 months a year)
S2 Baseline + eliminating early retirement
S3a Baseline + extending the eligibility for a PAYG supplement of 27% to non-privileged multi-
pillar participants (both to service in the old system and proportionally to basic pension)
S3b Baseline + modifying the basic pension in proportion to the share of the PAYG contribution
rate in the total pension contribution rate
S4 Baseline + second pillar contribution rate rising from 5% to 10% in 2016 (1% a year) with
corresponding reduction in the PAYG rate
S5 Baseline + 100% wage valorization and 100% price indexation of benefits
S6a Baseline + equalization of privileged pension levels to the general in five years; equalization
of privileged minimum and maximum pensions for HWVs with the general
S6b Baseline + 100% price indexing for special and privileged pensions
S6c Baseline + equalizing minimum pension for HWVs (currently 45% of average wage in
Croatia with more than 100 days in combat) with the general minimum pension
S7 Baseline + reduction of minimum pension by 50%
S8 Baseline + reduction of total asset value fee to 0.4% in 2012 and 0 by 2022; gradual increase
of front-loaded fee to 5.2% by 2022
S9 Baseline + optimistic economic assumptions: wage growth 0.5% above baseline; second pillar
rate of return 4.25%; system dependency ratio 3 percentage points above baseline
P1
Baseline + (i) extending 27% supplement to all multi-pillar participants (S3a); (ii) redefining
basic pension in proportion to the PAYG contribution rate (S3b); (iii) gradually increasing the
second pillar contribution rate from 5% to 10% (S4); (iv) faster increase of retirement age for
both genders (S1); (v) eliminating early retirement and tightening early retirement decrement
(S2); (vi) switching from Swiss valorization and indexation to wage valorization and price
indexation (S5); and (vii) convergence of privileged pensions to general level and applying
general system parameters (S6a)
P1a P1 – S5
P1c P1 – S5 + wage valorization and 50-50 wage-price indexation
P1d P1 – S3a – pension supplement of 27% for all new and current PAYG-only pensioners
P1e P1 – S3b – S4
P1f
P1 + rising total contribution rate from 20% to 22.5% + modification of S3b and S4
accordingly (increase of second pillar contribution rate from 5 to 7.5% in 2011, additional rise
of 0.5% a year up to 2016, up to 10% contribution rate for the second pillar, additional rise
accompanied by corresponding decrease in first pillar rate)
25
most employees (those who were younger than 40 in 2002, when the multi-pillar system was
introduced) would be multi-pillar participants. The improvement in the PAYG balance is
considerable: annual savings might reach 0.5 percent of GDP (Table 9). PAYG finances
(without mandatory budget transfers) are expected to be balanced in 2042, three years earlier
than in the baseline scenario.
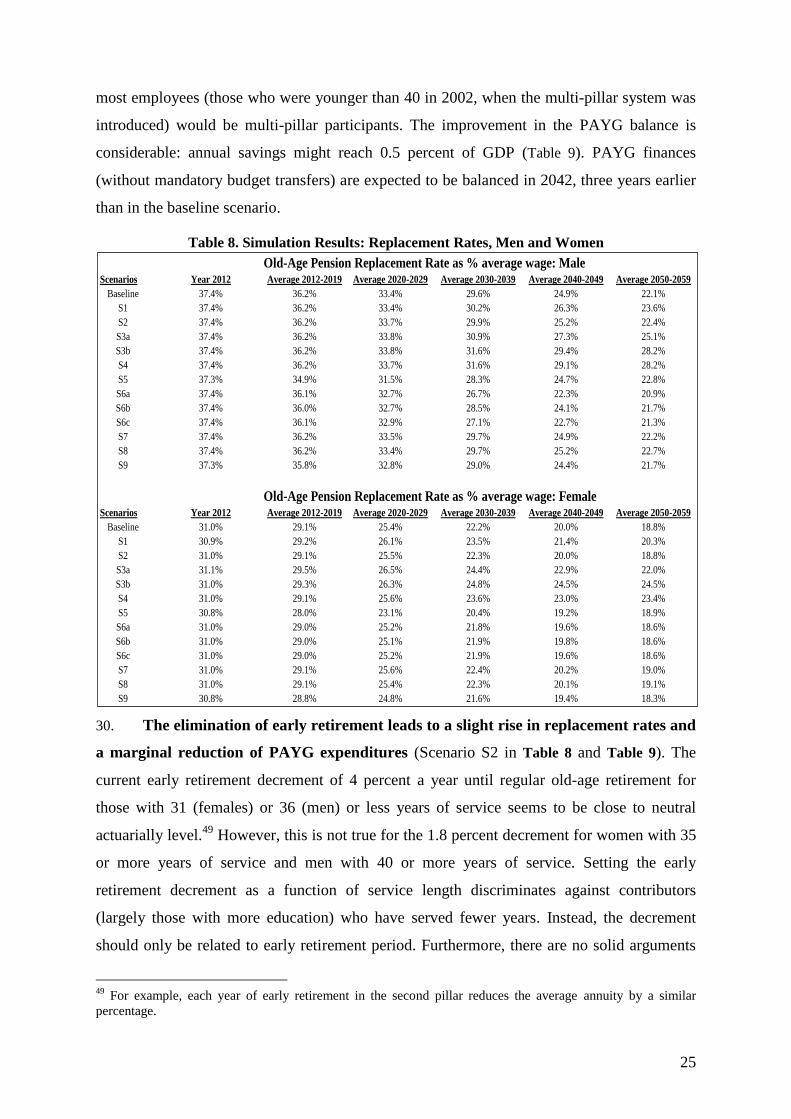
Table 8. Simulation Results: Replacement Rates, Men and Women
30. The elimination of early retirement leads to a slight rise in replacement rates and
a marginal reduction of PAYG expenditures (Scenario S2 in Table 8 and Table 9). The
current early retirement decrement of 4 percent a year until regular old-age retirement for
those with 31 (females) or 36 (men) or less years of service seems to be close to neutral
actuarially level.49
However, this is not true for the 1.8 percent decrement for women with 35
or more years of service and men with 40 or more years of service. Setting the early
retirement decrement as a function of service length discriminates against contributors
(largely those with more education) who have served fewer years. Instead, the decrement
should only be related to early retirement period. Furthermore, there are no solid arguments
49
For example, each year of early retirement in the second pillar reduces the average annuity by a similar
percentage.
Old-Age Pension Replacement Rate as % average wage: MaleScenarios Year 2012 Average 2012-2019 Average 2020-2029 Average 2030-2039 Average 2040-2049 Average 2050-2059
Baseline 37.4% 36.2% 33.4% 29.6% 24.9% 22.1%
S1 37.4% 36.2% 33.4% 30.2% 26.3% 23.6%
S2 37.4% 36.2% 33.7% 29.9% 25.2% 22.4%
S3a 37.4% 36.2% 33.8% 30.9% 27.3% 25.1%
S3b 37.4% 36.2% 33.8% 31.6% 29.4% 28.2%
S4 37.4% 36.2% 33.7% 31.6% 29.1% 28.2%
S5 37.3% 34.9% 31.5% 28.3% 24.7% 22.8%
S6a 37.4% 36.1% 32.7% 26.7% 22.3% 20.9%
S6b 37.4% 36.0% 32.7% 28.5% 24.1% 21.7%
S6c 37.4% 36.1% 32.9% 27.1% 22.7% 21.3%
S7 37.4% 36.2% 33.5% 29.7% 24.9% 22.2%
S8 37.4% 36.2% 33.4% 29.7% 25.2% 22.7%
S9 37.3% 35.8% 32.8% 29.0% 24.4% 21.7%
Old-Age Pension Replacement Rate as % average wage: FemaleScenarios Year 2012 Average 2012-2019 Average 2020-2029 Average 2030-2039 Average 2040-2049 Average 2050-2059
Baseline 31.0% 29.1% 25.4% 22.2% 20.0% 18.8%
S1 30.9% 29.2% 26.1% 23.5% 21.4% 20.3%
S2 31.0% 29.1% 25.5% 22.3% 20.0% 18.8%
S3a 31.1% 29.5% 26.5% 24.4% 22.9% 22.0%
S3b 31.0% 29.3% 26.3% 24.8% 24.5% 24.5%
S4 31.0% 29.1% 25.6% 23.6% 23.0% 23.4%
S5 30.8% 28.0% 23.1% 20.4% 19.2% 18.9%
S6a 31.0% 29.0% 25.2% 21.8% 19.6% 18.6%
S6b 31.0% 29.0% 25.1% 21.9% 19.8% 18.6%
S6c 31.0% 29.0% 25.2% 21.9% 19.6% 18.6%
S7 31.0% 29.1% 25.6% 22.4% 20.2% 19.0%
S8 31.0% 29.1% 25.4% 22.3% 20.1% 19.1%
S9 30.8% 28.8% 24.8% 21.6% 19.4% 18.3%
26
why the early retirement period should be as long as the current five years. Many countries
have either reduced the early retirement period or eliminated it altogether.
Table 9. Simulation Results: Implicit Public Debt and the PAYG Balance (% of GDP)
31. Extending the pension supplement of 27 percent to multi-pillar participants and
modifying the basic pension formula in proportion to the PAYG contribution rate could
eliminate the pension gap between old and new system participants, but the cost would
be substantial (Scenarios S3a and S3b).50
Extending the 27 percent supplement to multi-
pillar participants would bring their total benefit close to that of PAYG-only participants who
already receive the supplement (Table 8). However, it will take the next 20 years for women
and even longer for men to close the remaining gap.51
This suggests that extending the
supplement would not be enough to solve old-new pension differentials. Also, the cost of
extending the supplement increases over time to reach 1 percent of GDP annually after 2047
(Table 9 and Annex 2), which is a considerable distance from the baseline. Modifying the
50
A basic pension is set in proportion to the share of PAYG contribution in total contributions. Currently this
proportion is 75 percent (15 percent of the 20 percent total), but the basic pension accrues only 50 percent of the
annual benefit. This disproportion was caused by the initial reform design, which assumed the second pillar
contribution rate would rise to 10 percent by 2007. 51
A substantially larger proportion of men (HWVs) receive the special minimum pension that is not subject to
the pension supplement, which explains why it will take longer to close the gap for men.
Implicit Public Debt as % of GDPScenarios Year 2012 as % of GDP Average 2012-2019 Average 2020-2029 Average 2030-2039 Average 2040-2049 Average 2050-2059
Baseline 274.5% 242.3% 186.2% 149.0% 130.6% 122.3%
S1 268.9% 237.1% 182.6% 146.4% 127.9% 120.0%
S2 274.9% 243.1% 187.3% 149.7% 131.0% 122.6%
S3a 287.9% 257.5% 206.4% 174.9% 160.2% 152.7%
S3b 293.6% 264.4% 217.8% 193.6% 185.7% 180.9%
S4 274.6% 242.4% 186.3% 149.0% 130.6% 122.3%
S5 243.6% 213.5% 164.3% 134.7% 123.4% 120.4%
S6a 269.1% 236.5% 179.4% 141.4% 125.6% 119.3%
S6b 264.1% 232.6% 178.5% 143.9% 127.6% 120.7%
S6c 270.1% 237.6% 180.5% 142.6% 126.9% 120.8%
S7 275.6% 243.6% 187.7% 150.3% 131.8% 123.5%
S8 274.6% 242.4% 186.3% 149.0% 130.6% 122.3%
S9 289.9% 254.3% 193.0% 158.6% 139.2% 132.9%
PAYG balance as % of GDPScenarios Year 2012 as % of GDP Average 2012-2019 Average 2020-2029 Average 2030-2039 Average 2040-2049 Average 2050-2059
Baseline -4.0% -3.5% -2.6% -1.3% -0.1% 0.3%
S1 -3.9% -3.3% -2.3% -1.0% 0.3% 0.7%
S2 -4.0% -3.4% -2.6% -1.3% -0.1% 0.3%
S3a -4.0% -3.6% -2.9% -1.8% -1.0% -0.8%
S3b -4.0% -3.5% -2.8% -2.0% -1.5% -1.7%
S4 -4.3% -4.8% -4.5% -3.1% -1.9% -1.4%
S5 -3.9% -3.1% -1.8% -0.5% 0.4% 0.5%
S6a -4.0% -3.5% -2.5% -0.9% 0.3% 0.5%
S6b -4.0% -3.4% -2.4% -1.0% 0.2% 0.5%
S6c -4.0% -3.5% -2.5% -0.9% 0.3% 0.5%
S7 -4.0% -3.5% -2.7% -1.3% -0.1% 0.3%
S8 -4.0% -3.5% -2.6% -1.3% -0.1% 0.3%
S9 -3.9% -3.4% -2.3% -0.9% 0.4% 0.7%
27
basic pension (Scenario S3b) would do less to close the benefit gap in the short run than
extending the supplement but in the longer run would do much more. For men and women
participating in both pillars, the average total pension benefit even with the basic pension
modified would be higher than the average benefit of those participating only in PAYG after
2031. However, the cost increases faster than in Scenario S3a; compared to the baseline, this
scenario adds about 1 percent of GDP in 2040 and 2 percent of GDP in 2060. In the longer
run Scenario S3b is more expensive and ensures higher replacement rates, but alone it does
not resolve the pension gap between PAYG-only and multi-pillar participants. S3a and S3b
together would, as later simulations showed, eliminate most of the pension differentials and
substantially improve replacement rates for new system participants. However, the cost
would be high and there would be less space for other reform measures that have explicit
fiscal costs, such as raising the second pillar contribution rate.
32. Gradually raising the second pillar contribution rate from the current 5 percent
to 10 percent by 2016 and reducing the PAYG rate at the same scale would improve
replacement rates for future generations but substantially increase the PAYG deficit
(Scenario 4). It would leave unchanged the pensions of PAYG-only participants and boost
future replacement rates for participants in both pillars (Table 8 and Annex 2). A declining
replacement rate after 2038 for men participating in both pillars is due to the declining
proportion of HWVs and their higher-than-average pensions. For other male old-age
pensioners, the average replacement rate would continue to rise, as it would for female
pensioners. The increase in the second pillar contribution rate and the corresponding
reduction in the PAYG contribution rate are costly. Budget transfers for lost revenues are
expected to reach 1.7 percent of GDP a year in 2016 and stay there from then on. Due to
declining contributions, without mandatory budget transfers the PAYG balance will not be
restored even by 2070 (Table 9). If mandatory transfers are included as PAYG regular
revenues, doubling the second pillar contribution rate would not affect the residual
deficit/balance.
33. A rise in the second pillar contribution rate would compete for limited resources
with extension of the 2007 supplement to all future generations. Introducing both
simultaneously to solve both the low replacement rate and cross-cohort differentials would
require substantial fiscal efforts. At the same time, adjusting the basic pension to the
proportion of the PAYG contribution rate complements introduction of the second pillar. If
the second pillar rate is increased, basic pension costs would remain as in the baseline; if not,
28
they increase significantly. Unless it is possible to simultaneously apply all three scenarios
(S3a, S3b, and S4), other options should be explored, such as (i) extending the supplement
first and postponing the second pillar rate increase52
; (ii) abolishing the 2007 supplement53
;
and (iii) increasing the employee pension contribution rate.54
None of the alternatives is
without cost, borne by either public finances or employees and employers: postponing the
increase in the second pillar contribution rate expands the PAYG expenditures generated by
the modified basic pension; abolishing the supplement reduces real pensions and increases
old-age poverty; increasing the contribution rate pushes up labor costs. On the other hand,
these measures enhance equity in the pension system and ensure that future pension benefits
will be adequate. The impact of these options is analyzed in selected policy mixes.
34. Wage valorization and price indexation would restore the formula’s equity and
improve the fiscal outlook for the PAYG system (Scenario S5). As the baseline scenario
shows, valorization of past wages and indexation of pensions using the Swiss formula would
further undermine replacement rates generally and reduce initial replacement rates. The Swiss
formula does alleviate differences between successive cohorts of retirees, an issue that is
apparently of great importance and sensitivity in Croatia.55
An alternative simulated here is
application of 100 percent wage valorization and 100 percent price indexation, as is done in
most OECD and some ECA countries. This approach is considered international best practice
because (a) it preserves the purchasing power of the elderly as they age; (b) in the long run it
yields both fiscal sustainability and socially sustainable benefits; and (c) it tightens the link
between contributions and benefits. Indeed, Scenario S5 shows that this would yield higher
initial replacement rates for new retirees56
but substantially lower average replacement rates,
52
Presented in S3a with a delayed increase in the second pillar rate and adjustment of the basic pension, but S3a
does not resolve the problem of current new pensioner differentials. Simulation P1e presents a modified version,
freezing the second pillar rate at 5 percent with no realignment of the basic pension. 53
Presented in the P1d simulation. Means-testing the 2007 supplement would be less painful. However, a more
precise simulation of means-testing would require additional data and side calculations in addition to PROST. 54
Simulated in P1f. 55
The Swiss formula for both valorization and indexation was introduced after a famous public debate on three
schoolteachers who retired in three successive years with identical circumstances. It seems the public supported
the notion that their pensions should be nominally the same, regardless of changes in national productivity and
inflation. The political choice was to use the mid-point values—the Swiss formula—to alleviate the differences. 56
After 2040 the PAYG replacement rate for new multi-pillar pensioners would become fairly constant. Until
then, replacement rates would gradually decline because part of the pension benefit rewards the old system
service period, which would not exist after 2040.
29
particularly for PAYG-only pensioners (Table 8). However, such a policy generates a fiscally
more sustainable system; annual fiscal savings reach 0.8 percent of GDP by 2020 (Table 9).57
35. Reducing the differences between privileged and old-age pension benefits brings
more equity to the system and reduces the pension system deficit (Scenarios S6a, S6b,
and S6c). The Croatia PROST model distinguishes two special pension benefit groups,
HWVs and police/military pensioners. Three scenarios were considered. Scenario S6a
presents gradual equalization to general conditions for police/military and HWV pensions.
For police/military pensions, a 45-percent premium on point values decreases to the 27
percent for PAYG-only participants—a decline to the level that includes the 27 percent
supplement), while for multi-pillar participants the premium drops from 45 percent to zero.
For HWVs, the maximum pension converges to the general maximum level and the minimum
pension of 45 percent of the net average wage is abolished. The simulation assumes
convergence of parameters within five years, starting in 2012. Such a policy would reduce the
gross replacement rate for men by about 5 percentage points in the 2030s and progressively
reduce pension expenditures by about 0.03 percent of GDP a year in 2017 to 0.44 percent in
2038 (Table 9). After 2040 savings are expected to decline.
36. Price indexing the privileged pensions of both HWVs and police/military
personnel rather than using the Swiss formula would reduce annual expenditures by at
most 0.3 percent of GDP in the 2030s (Scenario S6b). Compared to S6a, savings are
expected to be higher in the first 20 years but lower thereafter. Scenario S6c estimates the
impact of equalizing the minimum HWV pension (45 percent of the average wage) with the
general minimum pension. Savings are similar to S6a. Although annually the savings are not
impressive, their cumulative effects are considerable (9 percent of GDP by 2050), indicating
that the Law on HWVs carries large contingent liabilities. There is no clear rationale why
currently employed HWVs should enjoy a higher minimum pension than other employees,
since the period of their war service is already counted as a double length of service.
37. A reduction in the minimum pension by 50 percent would separate the minimum
from the average pension and thus reduce incentives to evade contribution payment
(Scenario S7). It would lower the PAYG deficit by up to 0.4 percent of GDP and implicit
pension debt by 12 percent of GDP, but because it would also lower the average old age
replacement rate by about 1 percentage point, it might exacerbate poverty (Table 8 and Table
57
Savings result from a more generous valorization of new pensioners and less generous indexation of all
pensioners.
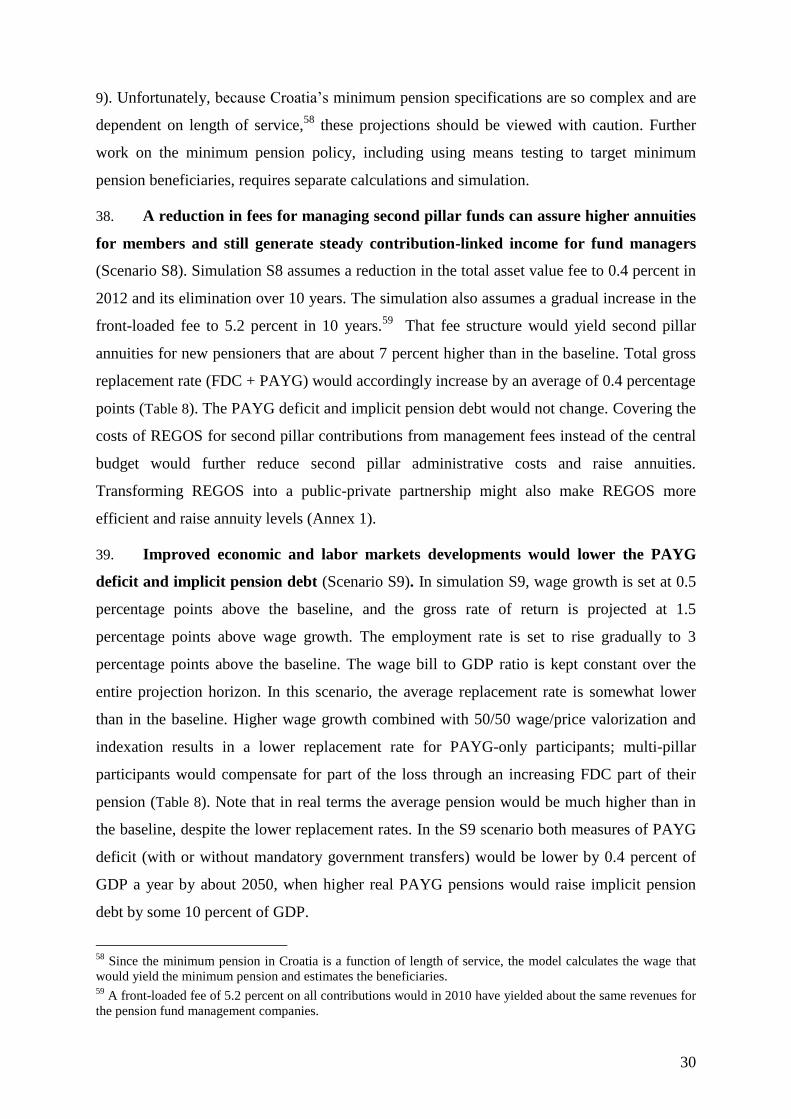
30
9). Unfortunately, because Croatia’s minimum pension specifications are so complex and are
dependent on length of service,58
these projections should be viewed with caution. Further
work on the minimum pension policy, including using means testing to target minimum
pension beneficiaries, requires separate calculations and simulation.
38. A reduction in fees for managing second pillar funds can assure higher annuities
for members and still generate steady contribution-linked income for fund managers
(Scenario S8). Simulation S8 assumes a reduction in the total asset value fee to 0.4 percent in
2012 and its elimination over 10 years. The simulation also assumes a gradual increase in the
front-loaded fee to 5.2 percent in 10 years.59
That fee structure would yield second pillar
annuities for new pensioners that are about 7 percent higher than in the baseline. Total gross
replacement rate (FDC + PAYG) would accordingly increase by an average of 0.4 percentage
points (Table 8). The PAYG deficit and implicit pension debt would not change. Covering the
costs of REGOS for second pillar contributions from management fees instead of the central
budget would further reduce second pillar administrative costs and raise annuities.
Transforming REGOS into a public-private partnership might also make REGOS more
efficient and raise annuity levels (Annex 1).
39. Improved economic and labor markets developments would lower the PAYG
deficit and implicit pension debt (Scenario S9). In simulation S9, wage growth is set at 0.5
percentage points above the baseline, and the gross rate of return is projected at 1.5
percentage points above wage growth. The employment rate is set to rise gradually to 3
percentage points above the baseline. The wage bill to GDP ratio is kept constant over the
entire projection horizon. In this scenario, the average replacement rate is somewhat lower
than in the baseline. Higher wage growth combined with 50/50 wage/price valorization and
indexation results in a lower replacement rate for PAYG-only participants; multi-pillar
participants would compensate for part of the loss through an increasing FDC part of their
pension (Table 8). Note that in real terms the average pension would be much higher than in
the baseline, despite the lower replacement rates. In the S9 scenario both measures of PAYG
deficit (with or without mandatory government transfers) would be lower by 0.4 percent of
GDP a year by about 2050, when higher real PAYG pensions would raise implicit pension
debt by some 10 percent of GDP.
58
Since the minimum pension in Croatia is a function of length of service, the model calculates the wage that
would yield the minimum pension and estimates the beneficiaries. 59
A front-loaded fee of 5.2 percent on all contributions would in 2010 have yielded about the same revenues for
the pension fund management companies.
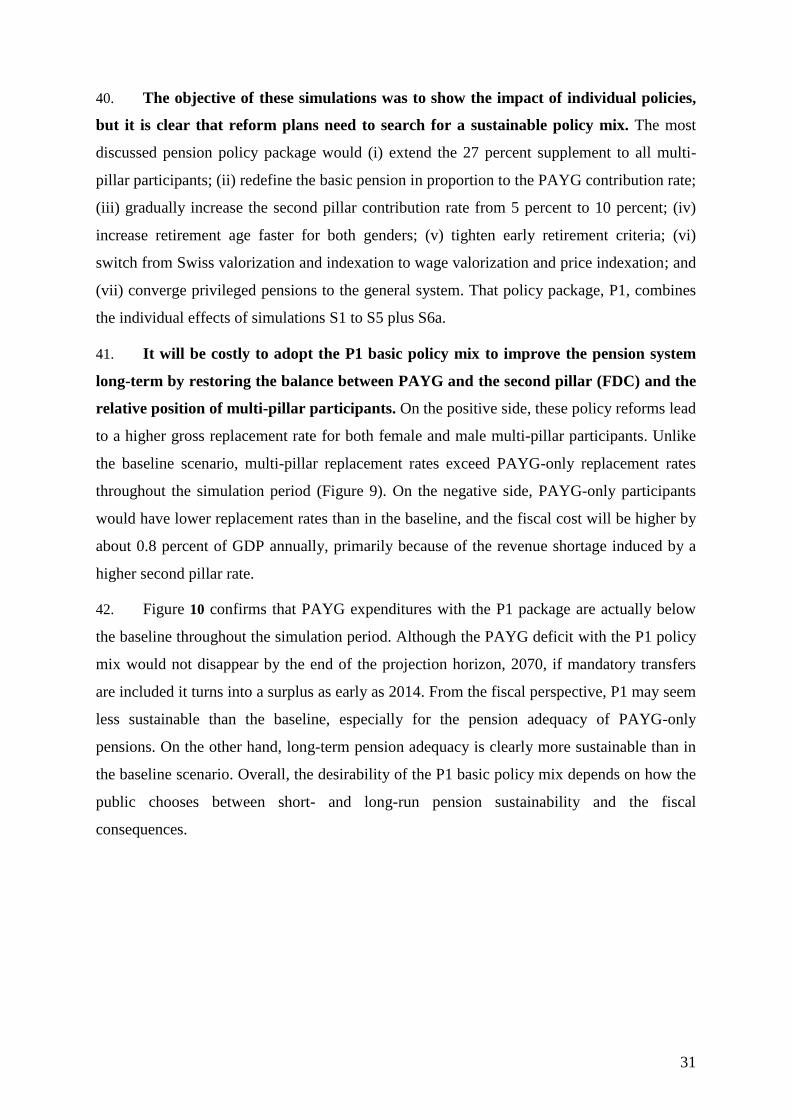
31
40. The objective of these simulations was to show the impact of individual policies,
but it is clear that reform plans need to search for a sustainable policy mix. The most
discussed pension policy package would (i) extend the 27 percent supplement to all multi-
pillar participants; (ii) redefine the basic pension in proportion to the PAYG contribution rate;
(iii) gradually increase the second pillar contribution rate from 5 percent to 10 percent; (iv)
increase retirement age faster for both genders; (v) tighten early retirement criteria; (vi)
switch from Swiss valorization and indexation to wage valorization and price indexation; and
(vii) converge privileged pensions to the general system. That policy package, P1, combines
the individual effects of simulations S1 to S5 plus S6a.
41. It will be costly to adopt the P1 basic policy mix to improve the pension system
long-term by restoring the balance between PAYG and the second pillar (FDC) and the
relative position of multi-pillar participants. On the positive side, these policy reforms lead
to a higher gross replacement rate for both female and male multi-pillar participants. Unlike
the baseline scenario, multi-pillar replacement rates exceed PAYG-only replacement rates
throughout the simulation period (Figure 9). On the negative side, PAYG-only participants
would have lower replacement rates than in the baseline, and the fiscal cost will be higher by
about 0.8 percent of GDP annually, primarily because of the revenue shortage induced by a
higher second pillar rate.
42. Figure 10 confirms that PAYG expenditures with the P1 package are actually below
the baseline throughout the simulation period. Although the PAYG deficit with the P1 policy
mix would not disappear by the end of the projection horizon, 2070, if mandatory transfers
are included it turns into a surplus as early as 2014. From the fiscal perspective, P1 may seem
less sustainable than the baseline, especially for the pension adequacy of PAYG-only
pensions. On the other hand, long-term pension adequacy is clearly more sustainable than in
the baseline scenario. Overall, the desirability of the P1 basic policy mix depends on how the
public chooses between short- and long-run pension sustainability and the fiscal
consequences.
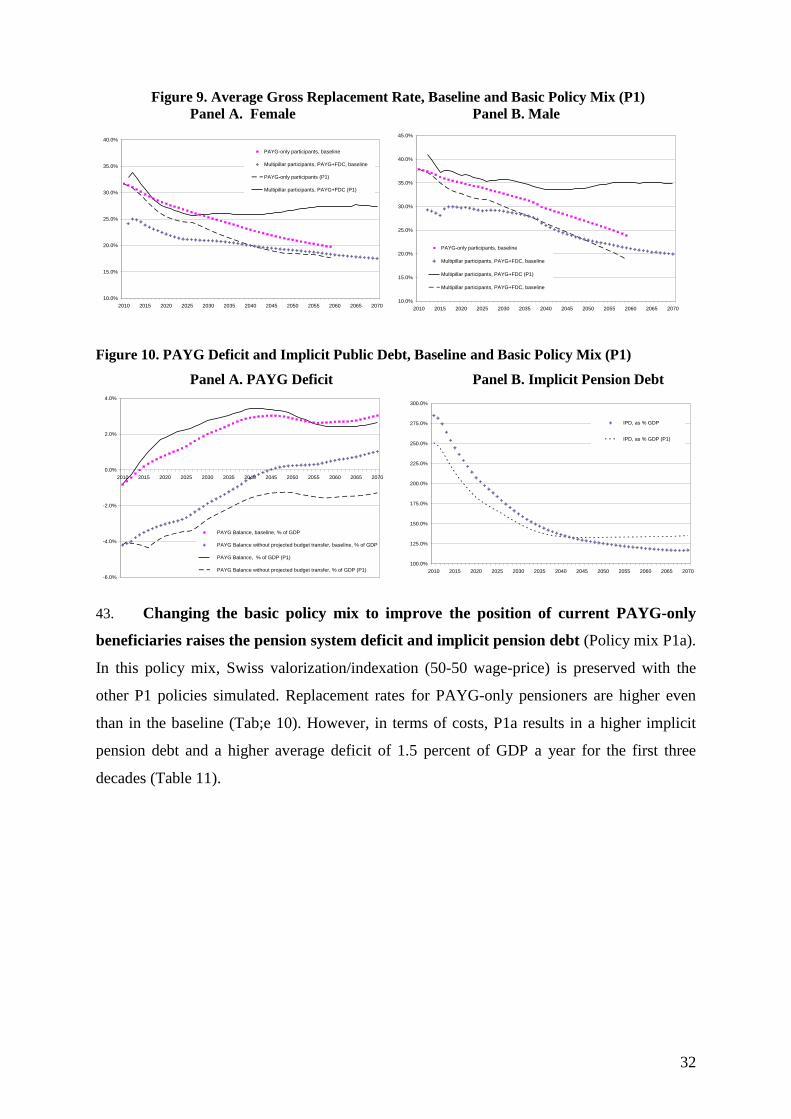
32
Figure 9. Average Gross Replacement Rate, Baseline and Basic Policy Mix (P1)
Panel A. Female Panel B. Male
Figure 10. PAYG Deficit and Implicit Public Debt, Baseline and Basic Policy Mix (P1)
Panel A. PAYG Deficit Panel B. Implicit Pension Debt
43. Changing the basic policy mix to improve the position of current PAYG-only
beneficiaries raises the pension system deficit and implicit pension debt (Policy mix P1a).
In this policy mix, Swiss valorization/indexation (50-50 wage-price) is preserved with the
other P1 policies simulated. Replacement rates for PAYG-only pensioners are higher even
than in the baseline (Tab;e 10). However, in terms of costs, P1a results in a higher implicit
pension debt and a higher average deficit of 1.5 percent of GDP a year for the first three
decades (Table 11).
10.0%
15.0%
20.0%
25.0%
30.0%
35.0%
40.0%
2010 2015 2020 2025 2030 2035 2040 2045 2050 2055 2060 2065 2070
PAYG-only participants, baseline
Multipillar participants, PAYG+FDC, baseline
PAYG-only participants (P1)
Multipillar participants, PAYG+FDC (P1)
10.0%
15.0%
20.0%
25.0%
30.0%
35.0%
40.0%
45.0%
2010 2015 2020 2025 2030 2035 2040 2045 2050 2055 2060 2065 2070
PAYG-only participants, baseline
Multipillar participants, PAYG+FDC, baseline
Multipillar participants, PAYG+FDC (P1)
Multipillar participants, PAYG+FDC, baseline
-6.0%
-4.0%
-2.0%
0.0%
2.0%
4.0%
2010 2015 2020 2025 2030 2035 2040 2045 2050 2055 2060 2065 2070
PAYG Balance, baseline, % of GDP
PAYG Balance without projected budget transfer, baseline, % of GDP
PAYG Balance, % of GDP (P1)
PAYG Balance without projected budget transfer, % of GDP (P1)
100.0%
125.0%
150.0%
175.0%
200.0%
225.0%
250.0%
275.0%
300.0%
2010 2015 2020 2025 2030 2035 2040 2045 2050 2055 2060 2065 2070
IPD, as % GDP
IPD, as % GDP (P1)
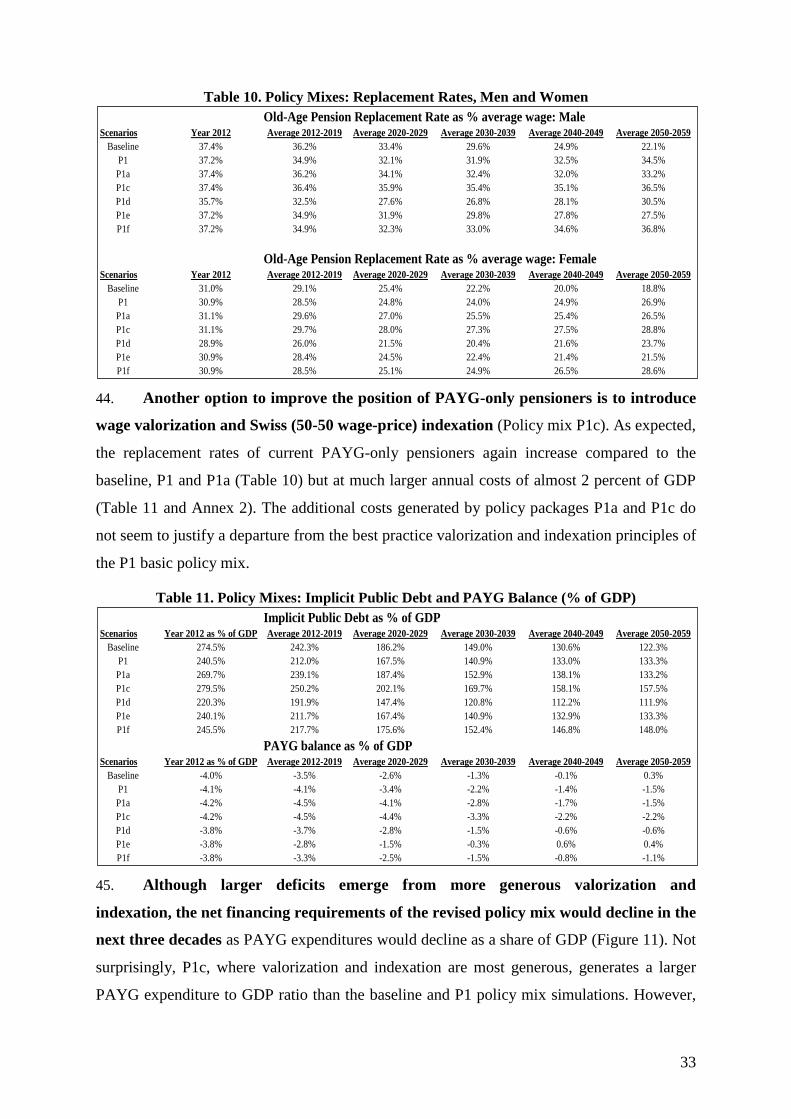
33
Table 10. Policy Mixes: Replacement Rates, Men and Women
44. Another option to improve the position of PAYG-only pensioners is to introduce
wage valorization and Swiss (50-50 wage-price) indexation (Policy mix P1c). As expected,
the replacement rates of current PAYG-only pensioners again increase compared to the
baseline, P1 and P1a (Table 10) but at much larger annual costs of almost 2 percent of GDP
(Table 11 and Annex 2). The additional costs generated by policy packages P1a and P1c do
not seem to justify a departure from the best practice valorization and indexation principles of
the P1 basic policy mix.
Table 11. Policy Mixes: Implicit Public Debt and PAYG Balance (% of GDP)
45. Although larger deficits emerge from more generous valorization and
indexation, the net financing requirements of the revised policy mix would decline in the
next three decades as PAYG expenditures would decline as a share of GDP (Figure 11). Not
surprisingly, P1c, where valorization and indexation are most generous, generates a larger
PAYG expenditure to GDP ratio than the baseline and P1 policy mix simulations. However,
Old-Age Pension Replacement Rate as % average wage: MaleScenarios Year 2012 Average 2012-2019 Average 2020-2029 Average 2030-2039 Average 2040-2049 Average 2050-2059
Baseline 37.4% 36.2% 33.4% 29.6% 24.9% 22.1%
P1 37.2% 34.9% 32.1% 31.9% 32.5% 34.5%
P1a 37.4% 36.2% 34.1% 32.4% 32.0% 33.2%
P1c 37.4% 36.4% 35.9% 35.4% 35.1% 36.5%
P1d 35.7% 32.5% 27.6% 26.8% 28.1% 30.5%
P1e 37.2% 34.9% 31.9% 29.8% 27.8% 27.5%
P1f 37.2% 34.9% 32.3% 33.0% 34.6% 36.8%
Old-Age Pension Replacement Rate as % average wage: FemaleScenarios Year 2012 Average 2012-2019 Average 2020-2029 Average 2030-2039 Average 2040-2049 Average 2050-2059
Baseline 31.0% 29.1% 25.4% 22.2% 20.0% 18.8%
P1 30.9% 28.5% 24.8% 24.0% 24.9% 26.9%
P1a 31.1% 29.6% 27.0% 25.5% 25.4% 26.5%
P1c 31.1% 29.7% 28.0% 27.3% 27.5% 28.8%
P1d 28.9% 26.0% 21.5% 20.4% 21.6% 23.7%
P1e 30.9% 28.4% 24.5% 22.4% 21.4% 21.5%
P1f 30.9% 28.5% 25.1% 24.9% 26.5% 28.6%
Implicit Public Debt as % of GDPScenarios Year 2012 as % of GDP Average 2012-2019 Average 2020-2029 Average 2030-2039 Average 2040-2049 Average 2050-2059
Baseline 274.5% 242.3% 186.2% 149.0% 130.6% 122.3%
P1 240.5% 212.0% 167.5% 140.9% 133.0% 133.3%
P1a 269.7% 239.1% 187.4% 152.9% 138.1% 133.2%
P1c 279.5% 250.2% 202.1% 169.7% 158.1% 157.5%
P1d 220.3% 191.9% 147.4% 120.8% 112.2% 111.9%
P1e 240.1% 211.7% 167.4% 140.9% 132.9% 133.3%
P1f 245.5% 217.7% 175.6% 152.4% 146.8% 148.0%
PAYG balance as % of GDPScenarios Year 2012 as % of GDP Average 2012-2019 Average 2020-2029 Average 2030-2039 Average 2040-2049 Average 2050-2059
Baseline -4.0% -3.5% -2.6% -1.3% -0.1% 0.3%
P1 -4.1% -4.1% -3.4% -2.2% -1.4% -1.5%
P1a -4.2% -4.5% -4.1% -2.8% -1.7% -1.5%
P1c -4.2% -4.5% -4.4% -3.3% -2.2% -2.2%
P1d -3.8% -3.7% -2.8% -1.5% -0.6% -0.6%
P1e -3.8% -2.8% -1.5% -0.3% 0.6% 0.4%
P1f -3.8% -3.3% -2.5% -1.5% -0.8% -1.1%
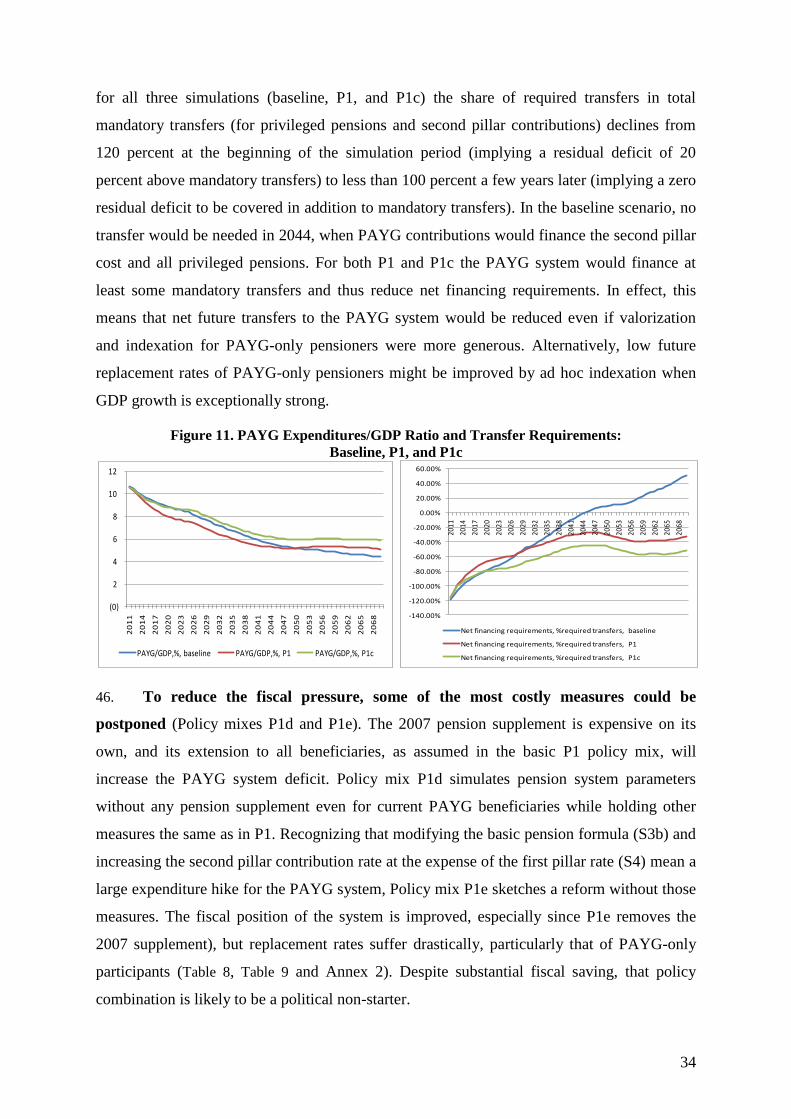
34
for all three simulations (baseline, P1, and P1c) the share of required transfers in total
mandatory transfers (for privileged pensions and second pillar contributions) declines from
120 percent at the beginning of the simulation period (implying a residual deficit of 20
percent above mandatory transfers) to less than 100 percent a few years later (implying a zero
residual deficit to be covered in addition to mandatory transfers). In the baseline scenario, no
transfer would be needed in 2044, when PAYG contributions would finance the second pillar
cost and all privileged pensions. For both P1 and P1c the PAYG system would finance at
least some mandatory transfers and thus reduce net financing requirements. In effect, this
means that net future transfers to the PAYG system would be reduced even if valorization
and indexation for PAYG-only pensioners were more generous. Alternatively, low future
replacement rates of PAYG-only pensioners might be improved by ad hoc indexation when
GDP growth is exceptionally strong.
Figure 11. PAYG Expenditures/GDP Ratio and Transfer Requirements:
Baseline, P1, and P1c
46. To reduce the fiscal pressure, some of the most costly measures could be
postponed (Policy mixes P1d and P1e). The 2007 pension supplement is expensive on its
own, and its extension to all beneficiaries, as assumed in the basic P1 policy mix, will
increase the PAYG system deficit. Policy mix P1d simulates pension system parameters
without any pension supplement even for current PAYG beneficiaries while holding other
measures the same as in P1. Recognizing that modifying the basic pension formula (S3b) and
increasing the second pillar contribution rate at the expense of the first pillar rate (S4) mean a
large expenditure hike for the PAYG system, Policy mix P1e sketches a reform without those
measures. The fiscal position of the system is improved, especially since P1e removes the
2007 supplement), but replacement rates suffer drastically, particularly that of PAYG-only
participants (Table 8, Table 9 and Annex 2). Despite substantial fiscal saving, that policy
combination is likely to be a political non-starter.
(0)
2
4
6
8
10
12
20
11
20
14
20
17
20
20
20
23
20
26
20
29
20
32
20
35
20
38
20
41
20
44
20
47
20
50
20
53
20
56
20
59
20
62
20
65
20
68
PAYG/GDP,%, baseline PAYG/GDP,%, P1 PAYG/GDP,%, P1c
-140.00%
-120.00%
-100.00%
-80.00%
-60.00%
-40.00%
-20.00%
0.00%
20.00%
40.00%
60.00%
2011
2014
2017
2020
2023
2026
2029
2032
2035
2038
2041
2044
2047
2050
2053
2056
2059
2062
2065
2068
Net financing requirements, %required transfers, baseline
Net financing requirements, %required transfers, P1
Net financing requirements, %required transfers, P1c
35
47. One possible way to address the need to increase replacement rates and a higher
pension system deficit is to increase the contribution rate (Policy mix P1f). All else being
equal, policy mix P1f simulates an increase in the contribution rate of 2.5 percent, paid by
employees. In the first three decades this policy would yield a lower deficit and a higher
surplus than the baseline, with multi-pillar pensions outgrowing PAYG-only ones. However,
since the required financing in the basic policy mix, P1, outgrows the mandatory transfers
(for privileged pensions and the second pillar), it seems inappropriate to finance this gap by a
supplementary contribution rate for all insured individuals.
E. Recommendations
48. The pension system in Croatia faces several challenges – worsening demographic
ratios, low labor participation rates, low and declining replacement rates, inadequate pensions
for multi-pillar cohorts, large cross-cohort differences in pensions, and overly generous
privileged pensions. These must be tackled without delay to bring the pension system back to
a fiscally and socially sustainable path. However, World Bank simulations using the PROST
model show that this would involve complex policy choices.
49. Extending the pension supplement, introduced in 2007 for PAYG pensioners, to
all multi-pillar participants and modifying basic pension parameters in proportion to
the share of PAYG contribution rate would eliminate most differences in replacement rates
between new PAYG-only and multi-pillar beneficiaries. However, that would require
additional PAYG spending of 1.2 percent of GDP a year by 2035 and 3.2 percent by 2060,
when implicit debt would increase by some 80 percent of GDP compared to the status quo.
50. Another option is to means-test the supplement for all participants to limit costs
but still protect the vulnerable. Removing the 2007 supplement from all current recipients
would ease the fiscal burden and bring the net-of-transfers zero balance forward to 2018;
however, it carries extreme political risk and a risk of deeper poverty for the oldest cohorts.
51. Continuing the current Swiss wage-price indexation would raise the deficit each
year during the 2020s by an average of 0.8 percent of GDP compared to full wage
valorization and price indexation, which international best practice would recommend. A fall
in replacement rates for current pensioners and PAYG-only participants could be slowed by
some form of supplementary indexation when fiscal space would permit during times of
exceptional GDP growth. More generous pension valorization and indexation could hardly be
justified on equity and fiscal costs grounds.

36
52. Raising the second pillar contribution rate to 10 percent by 2016 would prevent
erosion of replacement rates for future cohorts but would reduce PAYG revenues and require
additional annual transfers to cover the shortfall of almost 2 percent of GDP. However, if the
basic pension is realigned in proportion to the declining PAYG rate, the net cost of raising
second pillar contributions would be reduced by about half. Unless supported by adequate
savings in the pension system, however, these measures combined would exhaust substantial
fiscal space in the general public finances and crowd out funds for other public programs.
53. Savings measures to offset rising costs might include: (i) reducing privileged
pension benefits and bringing them to convergence with the general pension system; (ii)
switching from combined wage-price (Swiss) valorization and indexation to wage
valorization and price indexation; (iii) abolishing early retirement; and (iv) accelerating the
increases in the retirement age. These measures would yield savings, although not enough to
cover the whole net-of-mandatory transfers deficit by 2028. An alternative to cuts would be
to increase pension contribution rates to support higher PAYG expenditures. A higher
contribution rate implies higher labor cost, reduced competitiveness, and a larger shadow
economy. It should be considered a fiscal measure of last resort if further savings in the
PAYG system are not possible.
54. Second pillar administrative costs should also be reduced. Three options could be
explored:
Fee restructuring: reducing the asset value fee and raising the front-loaded fee. This
option reduces the administrative burden in the long run and provides a stable flow of
income for administration and fund management. On the other hand it continues
budgetary financing of REGOS costs and slows improvements in its efficiency and
management.
A charge on companies managing mandatory pension funds that is proportionate to
the services REGOS provides to second pillar funds. This option reduces second pillar
costs by some HRK60 million but limits fund management company control over
REGOS operational decisions.
A private –public partnership type of ownership for REGOS.60
This option reduces
management fees and may further rationalize REGOS operations but there may be
60
As in the former Central Depository Agency.

37
extreme data privacy risks if REGOS performs other functions not related to the
second pillar.
55. Ideally, all three options would be initiated simultaneously. The minimum that
could be done in the short run is to charge fund management companies for REGOS
operating costs. At the same time, fees and REGOS restructuring should be discussed with
the business sector.
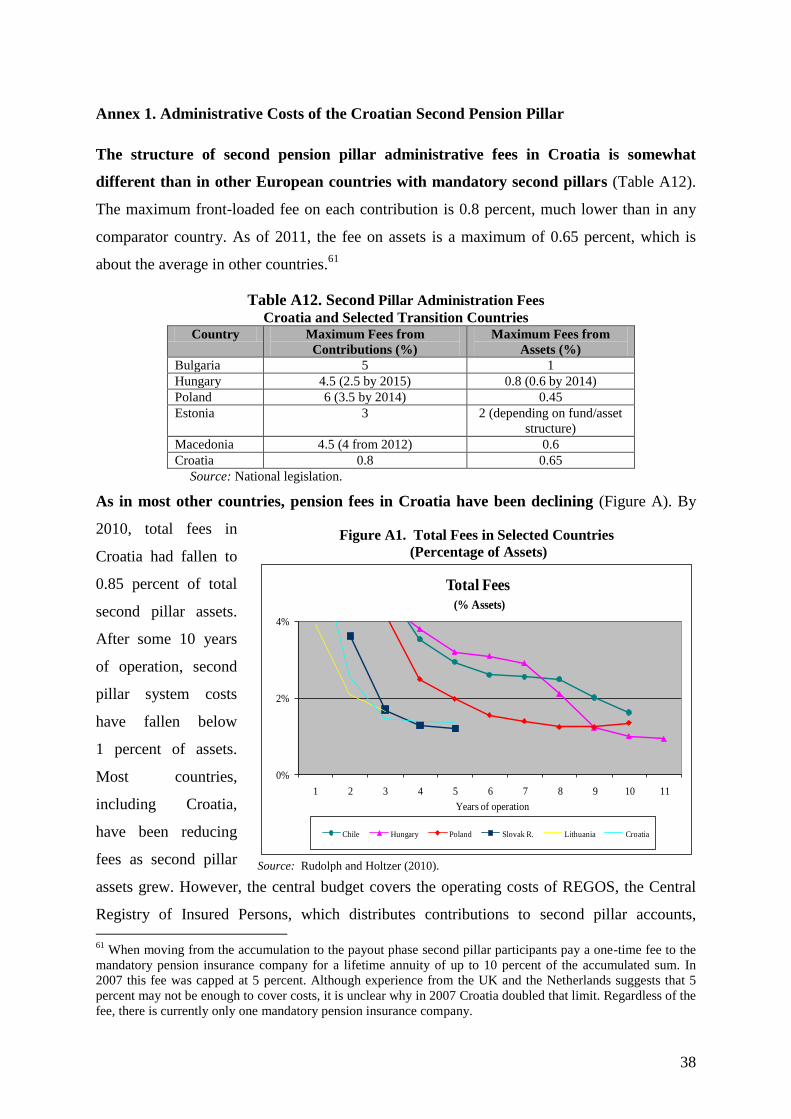
38
Annex 1. Administrative Costs of the Croatian Second Pension Pillar
The structure of second pension pillar administrative fees in Croatia is somewhat
different than in other European countries with mandatory second pillars (Table A12).
The maximum front-loaded fee on each contribution is 0.8 percent, much lower than in any
comparator country. As of 2011, the fee on assets is a maximum of 0.65 percent, which is
about the average in other countries.61
Table A12. Second Pillar Administration Fees
Croatia and Selected Transition Countries Country Maximum Fees from
Contributions (%)
Maximum Fees from
Assets (%)
Bulgaria 5 1
Hungary 4.5 (2.5 by 2015) 0.8 (0.6 by 2014)
Poland 6 (3.5 by 2014) 0.45
Estonia 3 2 (depending on fund/asset
structure)
Macedonia 4.5 (4 from 2012) 0.6
Croatia 0.8 0.65
Source: National legislation.
As in most other countries, pension fees in Croatia have been declining (Figure A). By
2010, total fees in
Croatia had fallen to
0.85 percent of total
second pillar assets.
After some 10 years
of operation, second
pillar system costs
have fallen below
1 percent of assets.
Most countries,
including Croatia,
have been reducing
fees as second pillar
assets grew. However, the central budget covers the operating costs of REGOS, the Central
Registry of Insured Persons, which distributes contributions to second pillar accounts,
61
When moving from the accumulation to the payout phase second pillar participants pay a one-time fee to the
mandatory pension insurance company for a lifetime annuity of up to 10 percent of the accumulated sum. In
2007 this fee was capped at 5 percent. Although experience from the UK and the Netherlands suggests that 5
percent may not be enough to cover costs, it is unclear why in 2007 Croatia doubled that limit. Regardless of the
fee, there is currently only one mandatory pension insurance company.
Figure A1. Total Fees in Selected Countries
(Percentage of Assets)
0%
2%
4%
1 2 3 4 5 6 7 8 9 10 11
Years of operation
Total Fees
(% Assets)
Chile Hungary Poland Slovak R. Lithuania Croatia
Source: Rudolph and Holtzer (2010).
39
collects monthly reports, administers individual accounts, reports to individuals, and
performs other second pillar clearing functions. In 2009 and 2010, total REGOS costs were
about 0.2 percent of total second pillar assets. In addition to being the second pillar clearing
house, REGOS reports to the Pension Institute (the PAYG administrator) and other social
insurance agencies on individual contributions due and paid.62
However, it is estimated that
more than 80 percent of REGOS operations are devoted exclusively to supporting the second
pillar.
In 2009 mandatory pension funds management companies collected HRK237 million in fees,
86 percent of them asset fees. Thus, pension fund management was the most profitable type
of financial business in 2009 – its return on equity was 28.3 percent, compared with 0.12
percent for insurance, 22 percent for factoring, and 6.7 percent for commercial banking. In
2009 the average fund management fee per second pillar member (collected by the
companies) was HRK155; the average cost to REGOS per second pillar member was HRK46
for a much larger workload. Apparently, there is room to substantially reduce second pillar
administrative costs and for fund management companies to contribute to REGOS operating
costs.63
The current Laws on Mandatory and Voluntary Pension Funds and on Collecting
Monthly Personified Data on Pension Insurance allow REGOS to set and collect fees from
fund management companies and to restructure REGOS ownership and management
structure as a public-private partnership.
62
The scope of work and responsibilities of REGOS were more ambitious at its launch in 2001. It was
established and unified monthly reporting introduced with an objective of creating a central database of all
contribution and personal income taxpayers and insured individuals, updated centrally with status and monthly
income data channeled through a single reporting stream, which would make more frequent and accurate data
available to all interested institutions. The unified reporting system has been in existence for three years, during
which parallel reporting to the Pension Institute was successfully replaced by a unified monthly (RS) form.
However, instead of absorbing the RS form into its reporting system, the Tax Department has refused to make
use of it as a source of information, alleging that it was incompatible with Tax Department data requirements
and the monthly frequency of personified data was irrelevant for its purposes. In 2004, unified reporting was
abolished, so the institutional framework for payroll tax collection is still complicated and fragmented: REGOS
performs most of its functions through the Financial Agency (FINA) infrastructure, and the Tax Department,
Pension Institute, Health Institute, and Employment Fund are all involved in different data collection or
registration processes. Reforming the payroll tax reporting system has thus led to more reporting requirements
and higher administrative and compliance costs. 63
Fund management companies often argue that the dual function of REGOS to serve both second pillar funds
and the Pension Institute makes it impossible to determinate the ―appropriate― share of REGOS costs they
would have to cover. Another argument was to allege that outsourcing of REGOS activities to FINA has led to
overcharging for account management, in which the management companies do not want to participate without
an opportunity to influence that process. That argument needs further analysis. However, the fixed account
management fee in Chile and Mexico is about US$10, above what REGOS charges.
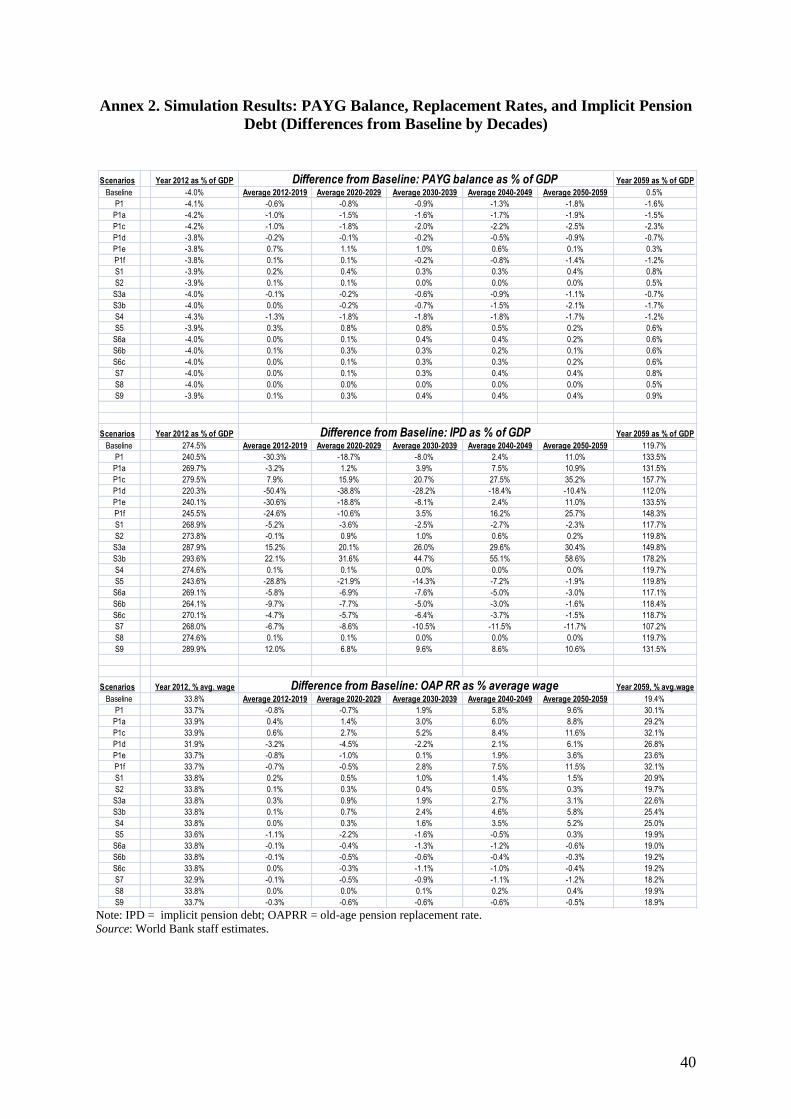
40
Annex 2. Simulation Results: PAYG Balance, Replacement Rates, and Implicit Pension
Debt (Differences from Baseline by Decades)
Note: IPD = implicit pension debt; OAPRR = old-age pension replacement rate.
Source: World Bank staff estimates.
Scenarios Year 2012 as % of GDP Year 2059 as % of GDP
Baseline -4.0% Average 2012-2019 Average 2020-2029 Average 2030-2039 Average 2040-2049 Average 2050-2059 0.5%
P1 -4.1% -0.6% -0.8% -0.9% -1.3% -1.8% -1.6%
P1a -4.2% -1.0% -1.5% -1.6% -1.7% -1.9% -1.5%
P1c -4.2% -1.0% -1.8% -2.0% -2.2% -2.5% -2.3%
P1d -3.8% -0.2% -0.1% -0.2% -0.5% -0.9% -0.7%
P1e -3.8% 0.7% 1.1% 1.0% 0.6% 0.1% 0.3%
P1f -3.8% 0.1% 0.1% -0.2% -0.8% -1.4% -1.2%
S1 -3.9% 0.2% 0.4% 0.3% 0.3% 0.4% 0.8%
S2 -3.9% 0.1% 0.1% 0.0% 0.0% 0.0% 0.5%
S3a -4.0% -0.1% -0.2% -0.6% -0.9% -1.1% -0.7%
S3b -4.0% 0.0% -0.2% -0.7% -1.5% -2.1% -1.7%
S4 -4.3% -1.3% -1.8% -1.8% -1.8% -1.7% -1.2%
S5 -3.9% 0.3% 0.8% 0.8% 0.5% 0.2% 0.6%
S6a -4.0% 0.0% 0.1% 0.4% 0.4% 0.2% 0.6%
S6b -4.0% 0.1% 0.3% 0.3% 0.2% 0.1% 0.6%
S6c -4.0% 0.0% 0.1% 0.3% 0.3% 0.2% 0.6%
S7 -4.0% 0.0% 0.1% 0.3% 0.4% 0.4% 0.8%
S8 -4.0% 0.0% 0.0% 0.0% 0.0% 0.0% 0.5%
S9 -3.9% 0.1% 0.3% 0.4% 0.4% 0.4% 0.9%
Scenarios Year 2012 as % of GDP Year 2059 as % of GDP
Baseline 274.5% Average 2012-2019 Average 2020-2029 Average 2030-2039 Average 2040-2049 Average 2050-2059 119.7%
P1 240.5% -30.3% -18.7% -8.0% 2.4% 11.0% 133.5%
P1a 269.7% -3.2% 1.2% 3.9% 7.5% 10.9% 131.5%
P1c 279.5% 7.9% 15.9% 20.7% 27.5% 35.2% 157.7%
P1d 220.3% -50.4% -38.8% -28.2% -18.4% -10.4% 112.0%
P1e 240.1% -30.6% -18.8% -8.1% 2.4% 11.0% 133.5%
P1f 245.5% -24.6% -10.6% 3.5% 16.2% 25.7% 148.3%
S1 268.9% -5.2% -3.6% -2.5% -2.7% -2.3% 117.7%
S2 273.8% -0.1% 0.9% 1.0% 0.6% 0.2% 119.8%
S3a 287.9% 15.2% 20.1% 26.0% 29.6% 30.4% 149.8%
S3b 293.6% 22.1% 31.6% 44.7% 55.1% 58.6% 178.2%
S4 274.6% 0.1% 0.1% 0.0% 0.0% 0.0% 119.7%
S5 243.6% -28.8% -21.9% -14.3% -7.2% -1.9% 119.8%
S6a 269.1% -5.8% -6.9% -7.6% -5.0% -3.0% 117.1%
S6b 264.1% -9.7% -7.7% -5.0% -3.0% -1.6% 118.4%
S6c 270.1% -4.7% -5.7% -6.4% -3.7% -1.5% 118.7%
S7 268.0% -6.7% -8.6% -10.5% -11.5% -11.7% 107.2%
S8 274.6% 0.1% 0.1% 0.0% 0.0% 0.0% 119.7%
S9 289.9% 12.0% 6.8% 9.6% 8.6% 10.6% 131.5%
Scenarios Year 2012, % avg. wage Year 2059, % avg.wage
Baseline 33.8% Average 2012-2019 Average 2020-2029 Average 2030-2039 Average 2040-2049 Average 2050-2059 19.4%
P1 33.7% -0.8% -0.7% 1.9% 5.8% 9.6% 30.1%
P1a 33.9% 0.4% 1.4% 3.0% 6.0% 8.8% 29.2%
P1c 33.9% 0.6% 2.7% 5.2% 8.4% 11.6% 32.1%
P1d 31.9% -3.2% -4.5% -2.2% 2.1% 6.1% 26.8%
P1e 33.7% -0.8% -1.0% 0.1% 1.9% 3.6% 23.6%
P1f 33.7% -0.7% -0.5% 2.8% 7.5% 11.5% 32.1%
S1 33.8% 0.2% 0.5% 1.0% 1.4% 1.5% 20.9%
S2 33.8% 0.1% 0.3% 0.4% 0.5% 0.3% 19.7%
S3a 33.8% 0.3% 0.9% 1.9% 2.7% 3.1% 22.6%
S3b 33.8% 0.1% 0.7% 2.4% 4.6% 5.8% 25.4%
S4 33.8% 0.0% 0.3% 1.6% 3.5% 5.2% 25.0%
S5 33.6% -1.1% -2.2% -1.6% -0.5% 0.3% 19.9%
S6a 33.8% -0.1% -0.4% -1.3% -1.2% -0.6% 19.0%
S6b 33.8% -0.1% -0.5% -0.6% -0.4% -0.3% 19.2%
S6c 33.8% 0.0% -0.3% -1.1% -1.0% -0.4% 19.2%
S7 32.9% -0.1% -0.5% -0.9% -1.1% -1.2% 18.2%
S8 33.8% 0.0% 0.0% 0.1% 0.2% 0.4% 19.9%
S9 33.7% -0.3% -0.6% -0.6% -0.6% -0.5% 18.9%
Difference from Baseline: PAYG balance as % of GDP
Difference from Baseline: IPD as % of GDP
Difference from Baseline: OAP RR as % average wage

41
Annex 3. Parameters of the Croatian Pension System
Retirement age:
Old- age pension: (i) Men: age 65 + 15 years of service; (ii) Women: age 60 years and 3 months + 15
years of service (rising to 65 years by 2031)
Early retirement pension: (i) Men: age 60 + 35 years of qualifying periods; (ii) Women: age 55 years
and 3 months + 30 years and 3 months of service (rising to 60/35 years by 2031).
Disability pension:
Eligibility: The insured must have coverage during at least 33.3% of the working life after age 20 (age
23 for insured persons with postsecondary education; age 26 for insured persons with a university
degree). There is no minimum qualifying period if the general (full) disability is the result of a work
injury or an occupational disease.
Benefit: full disability - average points for 40 years of service; partial disability 80% of that; if
continued working 50%. From second pillar: Paid if the value of the mandatory individual account
pension combined with the social insurance disability pension is greater than the regular disability
pension. Otherwise, the funds are transferred to the PAYG in exchange for regular disability pensions.
Survivors:
Eligibility: If deceased was a pensioner, an occupational rehabilitation beneficiary, had completed 5
years of insurance coverage, or met the qualifying period conditions for a disability pension. There is
no minimum qualifying period if the death resulted from a work injury or an occupational disease.
Benefit: 70%-100% of the actual or assumed pension, depending on the number of family members.
From second pillar: same as for disability.
Calculation period for old-age: life-time average earnings.
Pension determination (point formula) for those only in PAYG:
Initial pension = ∑ i (INDIVIDUAL POINTS)i * (POINT VALUE) i
INDIVIDUAL POINTS i = INDIVIDUAL WAGE i / AVERAGE NATIONAL WAGEi
Pension determination for those in both pillars:
For pre-2002 years of service: same formula as above.
For post 2002 years of service: Basic pension + second pillar annuity.
Basic pension = [0.25%* ∑ i (INDIVIDUAL POINTS)i * (POINT VALUE)i] + [0.025%*average
gross wage in Croatia i]
Indexation pattern:
Twice a year (January-July, effective April-October), 50% CPI in previous 6 months + 50% wage rate
in 6 months before that;
POINT VALUE i = POINT VALUE i-1 * (1+ (∆w/w i-2 + ∆p/p i-1)/2)
POINT VALUE (July 2009) = 58.37
Effectively, in Croatia there is 50%-50% wage-price valorization and indexation.
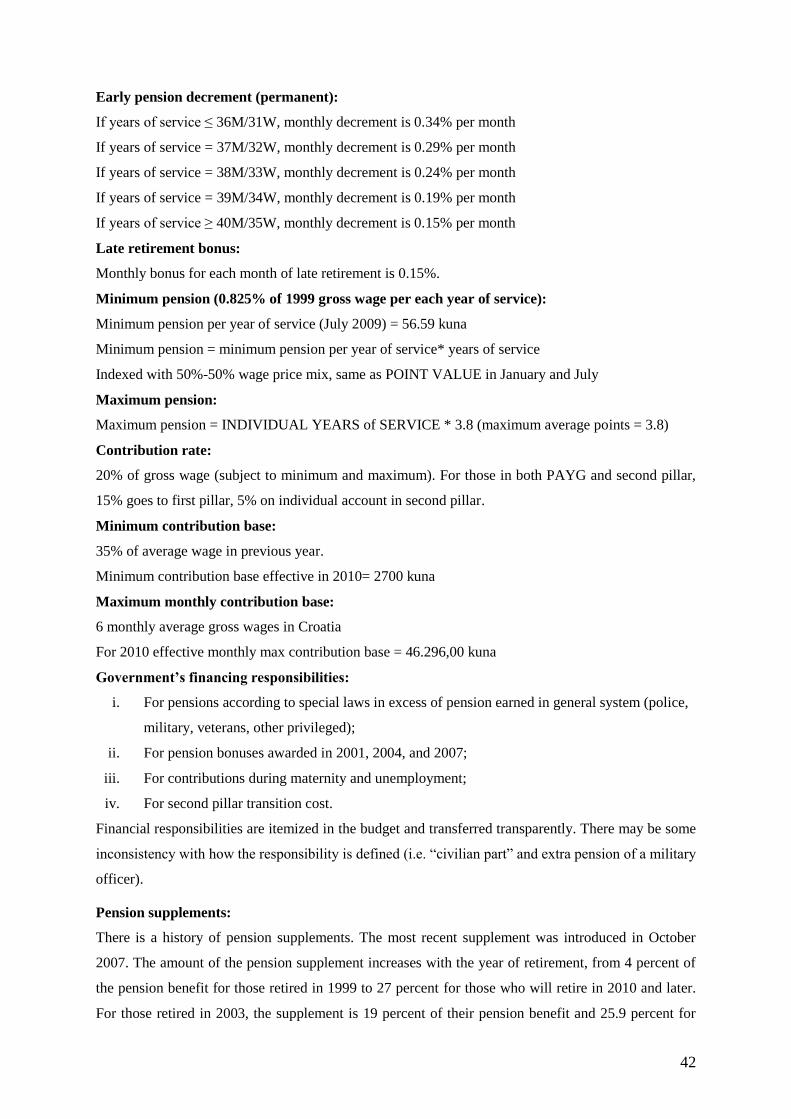
42
Early pension decrement (permanent):
If years of service ≤ 36M/31W, monthly decrement is 0.34% per month
If years of service = 37M/32W, monthly decrement is 0.29% per month
If years of service = 38M/33W, monthly decrement is 0.24% per month
If years of service = 39M/34W, monthly decrement is 0.19% per month
If years of service ≥ 40M/35W, monthly decrement is 0.15% per month
Late retirement bonus:
Monthly bonus for each month of late retirement is 0.15%.
Minimum pension (0.825% of 1999 gross wage per each year of service):
Minimum pension per year of service (July 2009) = 56.59 kuna
Minimum pension = minimum pension per year of service* years of service
Indexed with 50%-50% wage price mix, same as POINT VALUE in January and July
Maximum pension:
Maximum pension = INDIVIDUAL YEARS of SERVICE * 3.8 (maximum average points = 3.8)
Contribution rate:
20% of gross wage (subject to minimum and maximum). For those in both PAYG and second pillar,
15% goes to first pillar, 5% on individual account in second pillar.
Minimum contribution base:
35% of average wage in previous year.
Minimum contribution base effective in 2010= 2700 kuna
Maximum monthly contribution base:
6 monthly average gross wages in Croatia
For 2010 effective monthly max contribution base = 46.296,00 kuna
Government’s financing responsibilities:
i. For pensions according to special laws in excess of pension earned in general system (police,
military, veterans, other privileged);
ii. For pension bonuses awarded in 2001, 2004, and 2007;
iii. For contributions during maternity and unemployment;
iv. For second pillar transition cost.
Financial responsibilities are itemized in the budget and transferred transparently. There may be some
inconsistency with how the responsibility is defined (i.e. ―civilian part‖ and extra pension of a military
officer).
Pension supplements:
There is a history of pension supplements. The most recent supplement was introduced in October
2007. The amount of the pension supplement increases with the year of retirement, from 4 percent of
the pension benefit for those retired in 1999 to 27 percent for those who will retire in 2010 and later.
For those retired in 2003, the supplement is 19 percent of their pension benefit and 25.9 percent for

43
those retired in 2008. Members of both pension pillars are not eligible for the supplement. Retirees
from both pillars (some 1,000 of them) have therefore received lower total pensions.
Second pillar fees (currently applied in 2011):
v. 0.8% of each contribution,
vi. 0.65% of net asset value annually,
vii. Switching fee (0.2-0.8% depending of participation period).
Privileged/merit categories:
There are three larger sub-systems with contributors – police, military, and bailiffs. For them state
pays contributions (higher rate), and pays a difference between a civilian-regular pension and
privileged, higher one. For others (Homeland War Veterans, WWII veterans, Croatian Home Guard
Army 1941-45, ex-Yugoslav executives, former Yugoslav Army, former political prisoners, Croatian
Academia, asbestos miners, Croatian Defense Council, MPs, Croatian Government officials,
Constitutional Court Judges) the state pays a full pension unless they can determine a contributory
part. The entry to Homeland War Veterans pension has been closed since 2009.

44
References
1. Eurostat, ec.europa.eu/eurostat
2. Holzmann, R., R. Palacios. and A. Zviniene. 2004. Implicit Pension Debt: Issues,
Measurement and Scope in International Perspective. World Bank Pension Primer.
Washington, DC: World Bank.
3. Hrvatski zavod za mirovinsko osiguranje. Various years. Statistical Information.
4. Madzarevic-Sujster, S. 2002. ―An Estimate of Tax Evasion in Croatia.‖ Occasional Paper
No. 13. Zagreb, Croatia: Institute for Public Finance.
5. Marusic, Lj. and A. Skember. 2008. ―Social and Economic Aspects of the Introduction of
Mandatory Pension Insurance based on Individual Capitalized Savings.‖ Revija za
socijalnu politiku 15(3): 343–63.
6. Mink, R. 2006. General Government Pension Obligations in Europe. Frankfurt,
Germany: European Central Bank.
7. OECD. 2009. Pensions at a Glance. Paris, France: OECD.
8. Rudolph, H., and P. Holtzer. 2010. ―Challenges of the Mandatory Funded Pension System
in the Russian Federation.‖ World Bank Policy Research Working Paper 5514.
Washington, DC: World Bank.
9. Whitehouse, E. 2007. Pensions Panorama. Washington, DC: World Bank.
10. World Bank. 2008. Croatia: Restructuring Public Finance to Sustain Growth and
Improve Public Services, A Public Finance Review. Washington, DC: World Bank.
11. __________. 2010, 2009. Pensions Database.