Embed Size (px)
Citation preview
1 April 2019
INDIA I ELECTRICAL CONSUMER DURABLES INITIATING COVERAGE
Crompton Greaves Consumer Electricals
Scores well on many counts
)
Leadership in key segments I Strong return ratios I Initiate with BUY;
TP of INR 275
JM Financial Institutional Securities Limited
Achal Lohade
[email protected] Tel: (91 22) 66303081
Manish Agrawal [email protected]
Tel: (91 22) 66303068
Shrenik Bachhawat
Tel: (91 22) 66303074
TABLE OF CONTENTS
03 Introduction
04 Focus charts
06 Crompton Consumer – Scores well on many counts
07 Investment thesis
11 Key Concerns
13 Financials and Valuation
15 Comparison with Havells
18 Business Analysis - ECD (fans and pumps)
25 Business Analysis - Lighting
27 Financial Performance Analysis
29 Go To Market (GTM)
31 Company Background
33 Annexure
37 Financial tables
RECENT REPORTS
Chalet Hotels What killed India’s food inflation?
India Road Sector India Specialty Chemicals
Outlook 2019: Beyond the obvious
JM Financial Institutional Securities Limited Page 2
01 April 2019
INDIA | ELECTRICAL CONSUMER DURABLES
COVERAGE INITIATION
01 April 2019
INDIA | ELECTRICAL CONSUMER DURABLES COVERAGE INITIATION
Crompton Greaves Consumer Electricals
Scores well on many counts
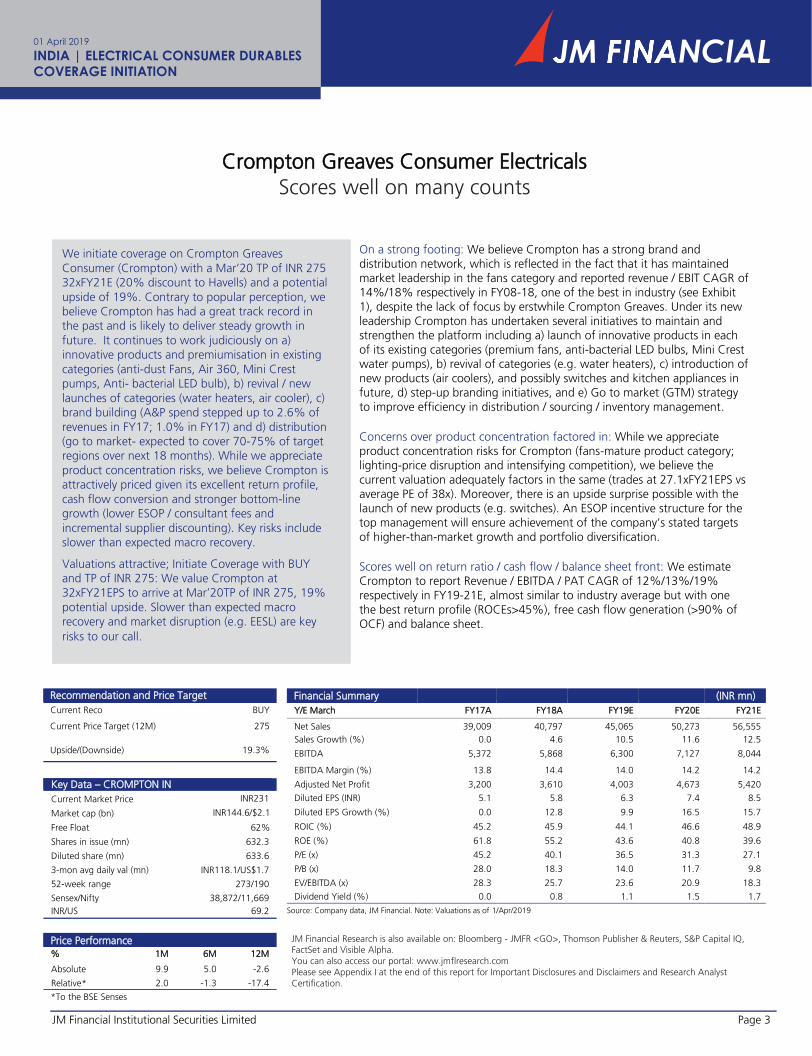
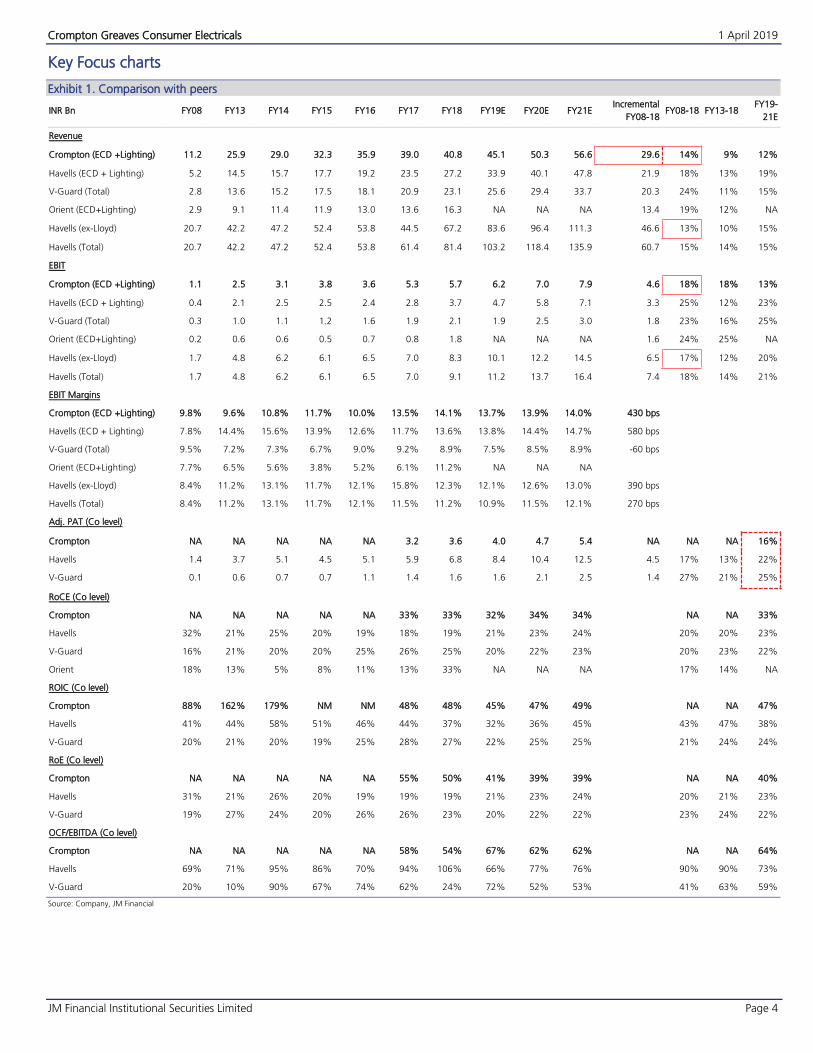
On a strong footing: We believe Crompton has a strong brand and distribution network, which is reflected in the fact that it has maintained market leadership in the fans category and reported revenue / EBIT CAGR of 14%/18% respectively in FY08-18, one of the best in industry (see Exhibit 1), despite the lack of focus by erstwhile Crompton Greaves. Under its new leadership Crompton has undertaken several initiatives to maintain and strengthen the platform including a) launch of innovative products in each of its existing categories (premium fans, anti-bacterial LED bulbs, Mini Crest water pumps), b) revival of categories (e.g. water heaters), c) introduction of new products (air coolers), and possibly switches and kitchen appliances in future, d) step-up branding initiatives, and e) Go to market (GTM) strategy to improve efficiency in distribution / sourcing / inventory management.
Concerns over product concentration factored in: While we appreciate product concentration risks for Crompton (fans-mature product category; lighting-price disruption and intensifying competition), we believe the current valuation adequately factors in the same (trades at 27.1xFY21EPS vs average PE of 38x). Moreover, there is an upside surprise possible with the launch of new products (e.g. switches). An ESOP incentive structure for the top management will ensure achievement of the company’s stated targets of higher-than-market growth and portfolio diversification.
Scores well on return ratio / cash flow / balance sheet front: We estimate Crompton to report Revenue / EBITDA / PAT CAGR of 12%/13%/19% respectively in FY19-21E, almost similar to industry average but with one the best return profile (ROCEs>45%), free cash flow generation (>90% of OCF) and balance sheet.
We initiate coverage on Crompton Greaves
Consumer (Crompton) with a Mar’20 TP of INR 275 32xFY21E (20% discount to Havells) and a potential
upside of 19%. Contrary to popular perception, we believe Crompton has had a great track record in
the past and is likely to deliver steady growth in
future. It continues to work judiciously on a)
innovative products and premiumisation in existing
categories (anti-dust Fans, Air 360, Mini Crest pumps, Anti- bacterial LED bulb), b) revival / new
launches of categories (water heaters, air cooler), c) brand building (A&P spend stepped up to 2.6% of
revenues in FY17; 1.0% in FY17) and d) distribution (go to market- expected to cover 70-75% of target regions over next 18 months). While we appreciate
product concentration risks, we believe Crompton is attractively priced given its excellent return profile,
cash flow conversion and stronger bottom-line growth (lower ESOP / consultant fees and
incremental supplier discounting). Key risks include slower than expected macro recovery.
Valuations attractive; Initiate Coverage with BUY
and TP of INR 275: We value Crompton at 32xFY21EPS to arrive at Mar’20TP of INR 275, 19%
potential upside. Slower than expected macro recovery and market disruption (e.g. EESL) are key
risks to our call.
Recommendation and Price Target Financial Summary (INR mn)
Current Reco BUY Y/E March FY17A FY18A FY19E FY20E FY21E
Current Price Target (12M) 275 Net Sales 39,009 40,797 45,065 50,273 56,555
Upside/(Downside) 19.3% Sales Growth (%) 0.0 4.6 10.5 11.6 12.5
EBITDA 5,372 5,868 6,300 7,127 8,044
EBITDA Margin (%) 13.8 14.4 14.0 14.2 14.2
Key Data – CROMPTON IN Adjusted Net Profit 3,200 3,610 4,003 4,673 5,420
Current Market Price INR231 Diluted EPS (INR) 5.1 5.8 6.3 7.4 8.5
Market cap (bn) INR144.6/$2.1 Diluted EPS Growth (%) 0.0 12.8 9.9 16.5 15.7
Free Float 62% ROIC (%) 45.2 45.9 44.1 46.6 48.9
Shares in issue (mn) 632.3 ROE (%) 61.8 55.2 43.6 40.8 39.6
Diluted share (mn) 633.6 P/E (x) 45.2 40.1 36.5 31.3 27.1
3-mon avg daily val (mn) INR118.1/US$1.7 P/B (x) 28.0 18.3 14.0 11.7 9.8
52-week range 273/190 EV/EBITDA (x) 28.3 25.7 23.6 20.9 18.3
Sensex/Nifty 38,872/11,669 Dividend Yield (%) 0.0 0.8 1.1 1.5 1.7
INR/US 69.2 Source: Company data, JM Financial. Note: Valuations as of 1/Apr/2019
Price Performance JM Financial Research is also available on: Bloomberg - JMFR <GO>, Thomson Publisher & Reuters, S&P Capital IQ, FactSet and Visible Alpha.
You can also access our portal: www.jmflresearch.com
Please see Appendix I at the end of this report for Important Disclosures and Disclaimers and Research Analyst
Certification.
% 1M 6M 12M
Absolute 9.9 5.0 -2.6
Relative* 2.0 -1.3 -17.4
*To the BSE Senses
JM Financial Institutional Securities Limited Page 3
Crompton Greaves Consumer Electricals 1 April 2019
JM Financial Institutional Securities Limited Page 4
Key Focus charts
Comparison with peers Exhibit 1.
INR Bn FY08 FY13 FY14 FY15 FY16 FY17 FY18 FY19E FY20E FY21E Incremental
FY08-18 FY08-18 FY13-18
FY19-
21E
Revenue
Crompton (ECD +Lighting) 11.2 25.9 29.0 32.3 35.9 39.0 40.8 45.1 50.3 56.6 29.6 14% 9% 12%
Havells (ECD + Lighting) 5.2 14.5 15.7 17.7 19.2 23.5 27.2 33.9 40.1 47.8 21.9 18% 13% 19%
V-Guard (Total) 2.8 13.6 15.2 17.5 18.1 20.9 23.1 25.6 29.4 33.7 20.3 24% 11% 15%
Orient (ECD+Lighting) 2.9 9.1 11.4 11.9 13.0 13.6 16.3 NA NA NA 13.4 19% 12% NA
Havells (ex-Lloyd) 20.7 42.2 47.2 52.4 53.8 44.5 67.2 83.6 96.4 111.3 46.6 13% 10% 15%
Havells (Total) 20.7 42.2 47.2 52.4 53.8 61.4 81.4 103.2 118.4 135.9 60.7 15% 14% 15%
EBIT
Crompton (ECD +Lighting) 1.1 2.5 3.1 3.8 3.6 5.3 5.7 6.2 7.0 7.9 4.6 18% 18% 13%
Havells (ECD + Lighting) 0.4 2.1 2.5 2.5 2.4 2.8 3.7 4.7 5.8 7.1 3.3 25% 12% 23%
V-Guard (Total) 0.3 1.0 1.1 1.2 1.6 1.9 2.1 1.9 2.5 3.0 1.8 23% 16% 25%
Orient (ECD+Lighting) 0.2 0.6 0.6 0.5 0.7 0.8 1.8 NA NA NA 1.6 24% 25% NA
Havells (ex-Lloyd) 1.7 4.8 6.2 6.1 6.5 7.0 8.3 10.1 12.2 14.5 6.5 17% 12% 20%
Havells (Total) 1.7 4.8 6.2 6.1 6.5 7.0 9.1 11.2 13.7 16.4 7.4 18% 14% 21%
EBIT Margins
Crompton (ECD +Lighting) 9.8% 9.6% 10.8% 11.7% 10.0% 13.5% 14.1% 13.7% 13.9% 14.0% 430 bps
Havells (ECD + Lighting) 7.8% 14.4% 15.6% 13.9% 12.6% 11.7% 13.6% 13.8% 14.4% 14.7% 580 bps
V-Guard (Total) 9.5% 7.2% 7.3% 6.7% 9.0% 9.2% 8.9% 7.5% 8.5% 8.9% -60 bps
Orient (ECD+Lighting) 7.7% 6.5% 5.6% 3.8% 5.2% 6.1% 11.2% NA NA NA
Havells (ex-Lloyd) 8.4% 11.2% 13.1% 11.7% 12.1% 15.8% 12.3% 12.1% 12.6% 13.0% 390 bps
Havells (Total) 8.4% 11.2% 13.1% 11.7% 12.1% 11.5% 11.2% 10.9% 11.5% 12.1% 270 bps
Adj. PAT (Co level)
Crompton NA NA NA NA NA 3.2 3.6 4.0 4.7 5.4 NA NA NA 16%
Havells 1.4 3.7 5.1 4.5 5.1 5.9 6.8 8.4 10.4 12.5 4.5 17% 13% 22%
V-Guard 0.1 0.6 0.7 0.7 1.1 1.4 1.6 1.6 2.1 2.5 1.4 27% 21% 25%
RoCE (Co level)
Crompton NA NA NA NA NA 33% 33% 32% 34% 34% NA NA 33%
Havells 32% 21% 25% 20% 19% 18% 19% 21% 23% 24% 20% 20% 23%
V-Guard 16% 21% 20% 20% 25% 26% 25% 20% 22% 23% 20% 23% 22%
Orient 18% 13% 5% 8% 11% 13% 33% NA NA NA 17% 14% NA
ROIC (Co level)
Crompton 88% 162% 179% NM NM 48% 48% 45% 47% 49% NA NA 47%
Havells 41% 44% 58% 51% 46% 44% 37% 32% 36% 45% 43% 47% 38%
V-Guard 20% 21% 20% 19% 25% 28% 27% 22% 25% 25% 21% 24% 24%
RoE (Co level)
Crompton NA NA NA NA NA 55% 50% 41% 39% 39% NA NA 40%
Havells 31% 21% 26% 20% 19% 19% 19% 21% 23% 24% 20% 21% 23%
V-Guard 19% 27% 24% 20% 26% 26% 23% 20% 22% 22% 23% 24% 22%
OCF/EBITDA (Co level)
Crompton NA NA NA NA NA 58% 54% 67% 62% 62% NA NA 64%
Havells 69% 71% 95% 86% 70% 94% 106% 66% 77% 76% 90% 90% 73%
V-Guard 20% 10% 90% 67% 74% 62% 24% 72% 52% 53% 41% 63% 59%
Source: Company, JM Financial
Crompton Greaves Consumer Electricals 1 April 2019
JM Financial Institutional Securities Limited Page 5
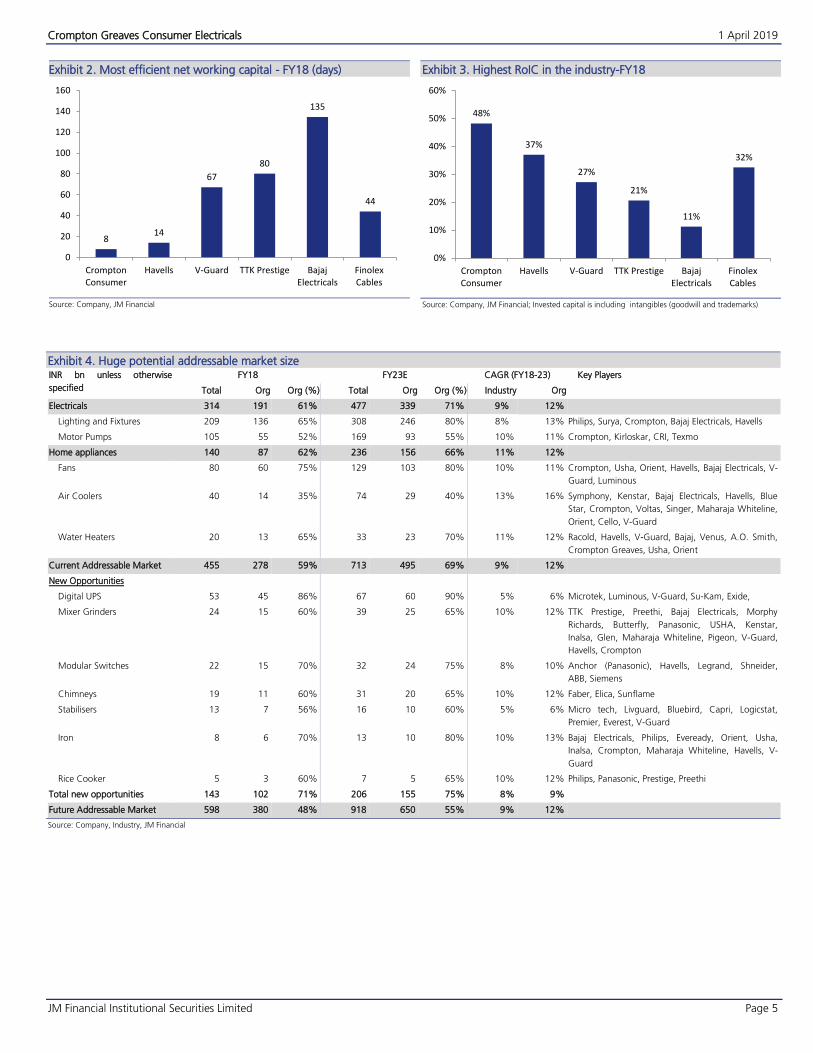
Most efficient net working capital - FY18 (days) Exhibit 2.
Source: Company, JM Financial
Highest RoIC in the industry-FY18 Exhibit 3.
Source: Company, JM Financial; Invested capital is including intangibles (goodwill and trademarks)
Huge potential addressable market size Exhibit 4.INR bn unless otherwise
specified
FY18 FY23E CAGR (FY18-23) Key Players
Total Org Org (%) Total Org Org (%) Industry Org
Electricals 314 191 61% 477 339 71% 9% 12%
Lighting and Fixtures 209 136 65% 308 246 80% 8%
Motor Pumps 105 55 52% 169 93 55% 10%
13% Philips, Surya, Crompton, Bajaj Electricals, Havells
11% Crompton, Kirloskar, CRI, Texmo
Home appliances 140 87 62% 236 156 66% 11% 12%
Fans 80 60 75% 129 103 80% 10% 11% Crompton, Usha, Orient, Havells, Bajaj Electricals, V-
Guard, Luminous
Air Coolers 40 14 35% 74 29 40% 13% 16% Symphony, Kenstar, Bajaj Electricals, Havells, Blue
Star, Crompton, Voltas, Singer, Maharaja Whiteline,
Orient, Cello, V-Guard
Water Heaters 20 13 65% 33 23 70% 11% 12% Racold, Havells, V-Guard, Bajaj, Venus, A.O. Smith,
Crompton Greaves, Usha, Orient
Current Addressable Market 455 278 59% 713 495 69% 9% 12%
New Opportunities
Digital UPS 53 45 86% 67 60 90% 5% 6% Microtek, Luminous, V-Guard, Su-Kam, Exide,
Mixer Grinders 24 15 60% 39 25 65% 10% 12% TTK Prestige, Preethi, Bajaj Electricals, Morphy
Richards, Butterfly, Panasonic, USHA, Kenstar,
Inalsa, Glen, Maharaja Whiteline, Pigeon, V-Guard,
Havells, Crompton
Modular Switches 22 15 70% 32 24 75% 8% 10% Anchor (Panasonic), Havells, Legrand, Shneider,
ABB, Siemens
Chimneys 19 11 60% 31 20 65% 10% 12% Faber, Elica, Sunflame
Stabilisers 13 7 56% 16 10 60% 5% 6% Micro tech, Livguard, Bluebird, Capri, Logicstat,
Premier, Everest, V-Guard
Iron 8 6 70% 13 10 80% 10% 13% Bajaj Electricals, Philips, Eveready, Orient, Usha,
Inalsa, Crompton, Maharaja Whiteline, Havells, V-
Guard
Rice Cooker 5 3 60% 7 5 65% 10% 12% Philips, Panasonic, Prestige, Preethi
Total new opportunities 143 102 71% 206 155 75% 8% 9%
Future Addressable Market 598 380 48% 918 650 55% 9% 12%
Source: Company, Industry, JM Financial
814
67
80
135
44
0
20
40
60
80
100
120
140
160
CromptonConsumer
Havells V-Guard TTK Prestige BajajElectricals
FinolexCables
48%
37%
27%
21%
11%
32%
0%
10%
20%
30%
40%
50%
60%
CromptonConsumer
Havells V-Guard TTK Prestige BajajElectricals
FinolexCables
Crompton Greaves Consumer Electricals 1 April 2019
JM Financial Institutional Securities Limited Page 6
Crompton in charts
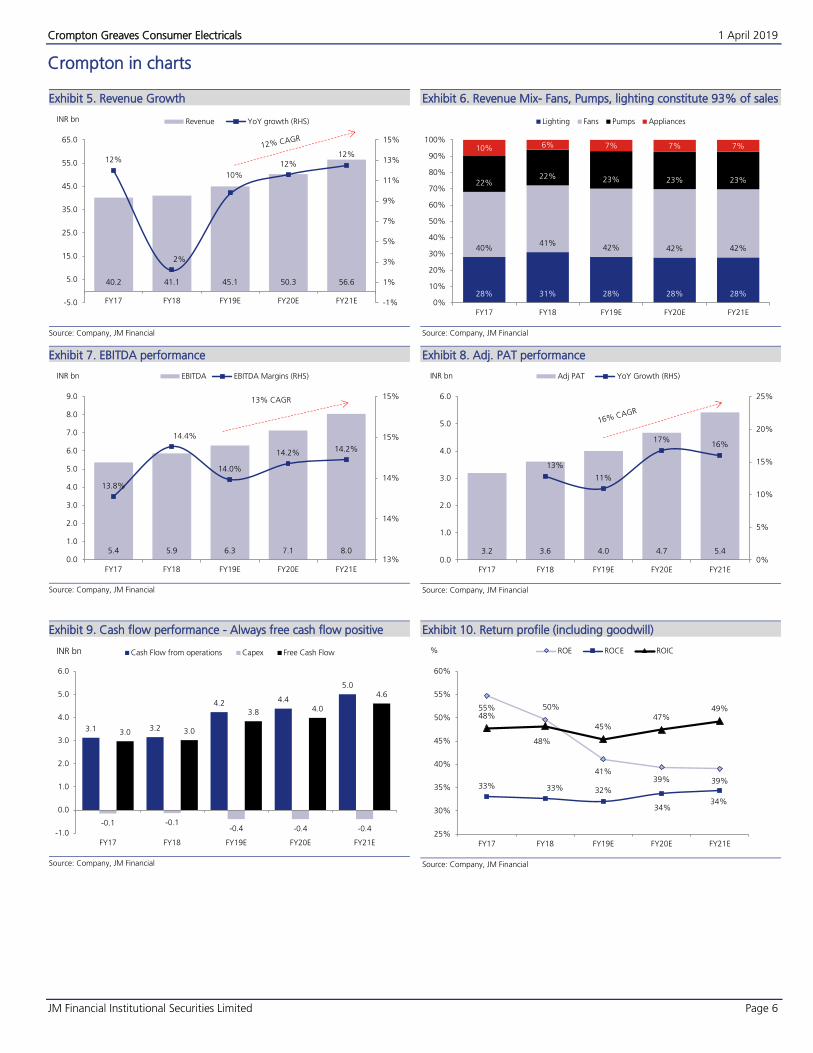
Revenue Growth Exhibit 5.
Source: Company, JM Financial
Revenue Mix- Fans, Pumps, lighting constitute 93% of sales Exhibit 6.
Source: Company, JM Financial
EBITDA performance Exhibit 7.
Source: Company, JM Financial
Adj. PAT performance Exhibit 8.
Source: Company, JM Financial
Cash flow performance - Always free cash flow positive Exhibit 9.
Source: Company, JM Financial
Return profile (including goodwill) Exhibit 10.
Source: Company, JM Financial
40.2 41.1 45.1 50.3 56.6
12%
2%
10%
12%12%
-1%
1%
3%
5%
7%
9%
11%
13%
15%
-5.0
5.0
15.0
25.0
35.0
45.0
55.0
65.0
FY17 FY18 FY19E FY20E FY21E
INR bn Revenue YoY growth (RHS)
28% 31% 28% 28% 28%
40%41%
42% 42% 42%
22%22% 23% 23% 23%
10% 6% 7% 7% 7%
0%
10%
20%
30%
40%
50%
60%
70%
80%
90%
100%
FY17 FY18 FY19E FY20E FY21E
Lighting Fans Pumps Appliances
5.4 5.9 6.3 7.1 8.0
13.8%
14.4%
14.0%
14.2% 14.2%
13%
14%
14%
15%
15%
0.0
1.0
2.0
3.0
4.0
5.0
6.0
7.0
8.0
9.0
FY17 FY18 FY19E FY20E FY21E
INR bn EBITDA EBITDA Margins (RHS)
13% CAGR
3.2 3.6 4.0 4.7 5.4
13%
11%
17%16%
0%
5%
10%
15%
20%
25%
0.0
1.0
2.0
3.0
4.0
5.0
6.0
FY17 FY18 FY19E FY20E FY21E
INR bn Adj PAT YoY Growth (RHS)
3.1 3.2
4.2 4.4
5.0
-0.1 -0.1-0.4 -0.4 -0.4
3.0 3.0
3.8 4.0
4.6
-1.0
0.0
1.0
2.0
3.0
4.0
5.0
6.0
FY17 FY18 FY19E FY20E FY21E
Cash Flow from operations Capex Free Cash FlowINR bn
55% 50%
41%39% 39%
33% 33% 32%
34%34%
48%
48%
45%47%
49%
25%
30%
35%
40%
45%
50%
55%
60%
FY17 FY18 FY19E FY20E FY21E
% ROE ROCE ROIC
Crompton Greaves Consumer Electricals 1 April 2019
JM Financial Institutional Securities Limited Page 7
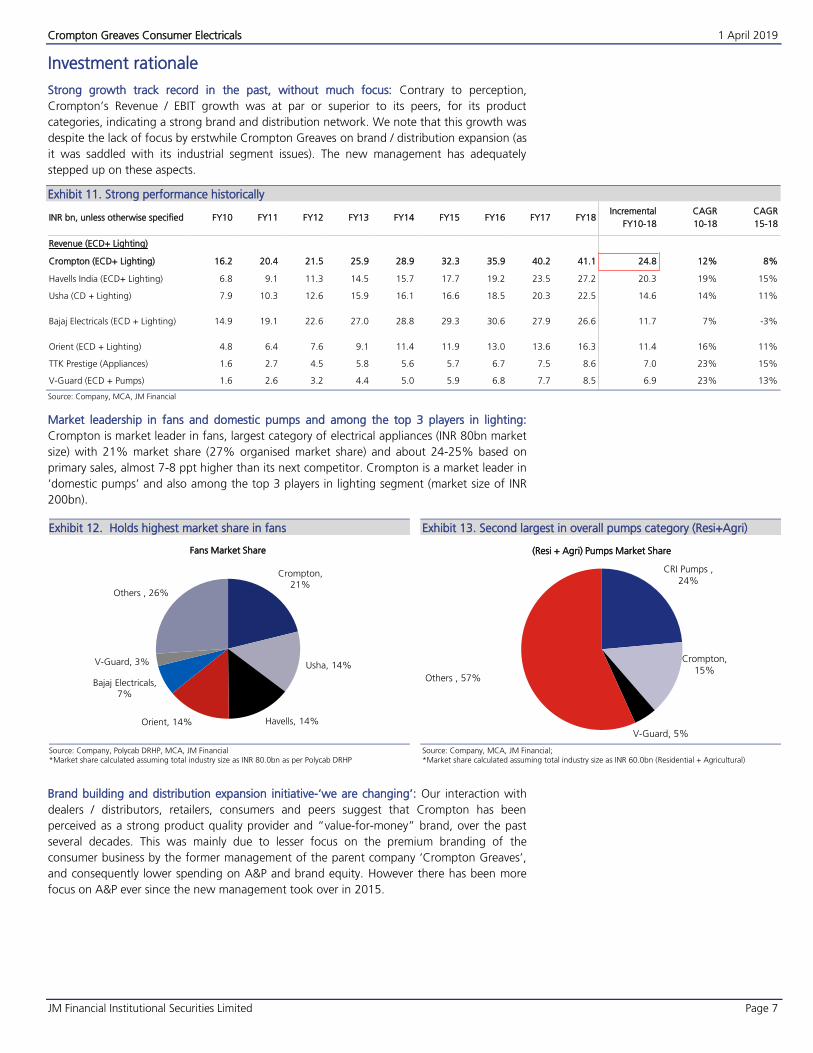
Investment rationale
Strong growth track record in the past, without much focus: Contrary to perception,
Crompton’s Revenue / EBIT growth was at par or superior to its peers, for its product
categories, indicating a strong brand and distribution network. We note that this growth was
despite the lack of focus by erstwhile Crompton Greaves on brand / distribution expansion (as
it was saddled with its industrial segment issues). The new management has adequately
stepped up on these aspects.
Strong performance historically Exhibit 11.
INR bn, unless otherwise specified FY10 FY11 FY12 FY13 FY14 FY15 FY16 FY17 FY18 Incremental
FY10-18
CAGR
10-18
CAGR
15-18
Revenue (ECD+ Lighting)
Crompton (ECD+ Lighting) 16.2 20.4 21.5 25.9 28.9 32.3 35.9 40.2 41.1 24.8 12% 8%
Havells India (ECD+ Lighting) 6.8 9.1 11.3 14.5 15.7 17.7 19.2 23.5 27.2 20.3 19% 15%
Usha (CD + Lighting) 7.9 10.3 12.6 15.9 16.1 16.6 18.5 20.3 22.5 14.6 14% 11%
Bajaj Electricals (ECD + Lighting) 14.9 19.1 22.6 27.0 28.8 29.3 30.6 27.9 26.6 11.7 7% -3%
Orient (ECD + Lighting) 4.8 6.4 7.6 9.1 11.4 11.9 13.0 13.6 16.3 11.4 16% 11%
TTK Prestige (Appliances) 1.6 2.7 4.5 5.8 5.6 5.7 6.7 7.5 8.6 7.0 23% 15%
V-Guard (ECD + Pumps) 1.6 2.6 3.2 4.4 5.0 5.9 6.8 7.7 8.5 6.9 23% 13%
Source: Company, MCA, JM Financial
Market leadership in fans and domestic pumps and among the top 3 players in lighting:
Crompton is market leader in fans, largest category of electrical appliances (INR 80bn market
size) with 21% market share (27% organised market share) and about 24-25% based on
primary sales, almost 7-8 ppt higher than its next competitor. Crompton is a market leader in
‘domestic pumps’ and also among the top 3 players in lighting segment (market size of INR
200bn).
Holds highest market share in fans Exhibit 12.
Source: Company, Polycab DRHP, MCA, JM Financial *Market share calculated assuming total industry size as INR 80.0bn as per Polycab DRHP
Second largest in overall pumps category (Resi+Agri) Exhibit 13.
Source: Company, MCA, JM Financial; *Market share calculated assuming total industry size as INR 60.0bn (Residential + Agricultural)
Brand building and distribution expansion initiative-‘we are changing’: Our interaction with
dealers / distributors, retailers, consumers and peers suggest that Crompton has been
perceived as a strong product quality provider and “value-for-money” brand, over the past
several decades. This was mainly due to lesser focus on the premium branding of the
consumer business by the former management of the parent company ‘Crompton Greaves’,
and consequently lower spending on A&P and brand equity. However there has been more
focus on A&P ever since the new management took over in 2015.
Crompton,
21%
Usha, 14%
Havells, 14%Orient, 14%
Bajaj Electricals,
7%
V-Guard, 3%
Others , 26%
Fans Market Share
CRI Pumps ,
24%
Crompton,
15%
V-Guard, 5%
Others , 57%
(Resi + Agri) Pumps Market Share
Crompton Greaves Consumer Electricals 1 April 2019
JM Financial Institutional Securities Limited Page 8
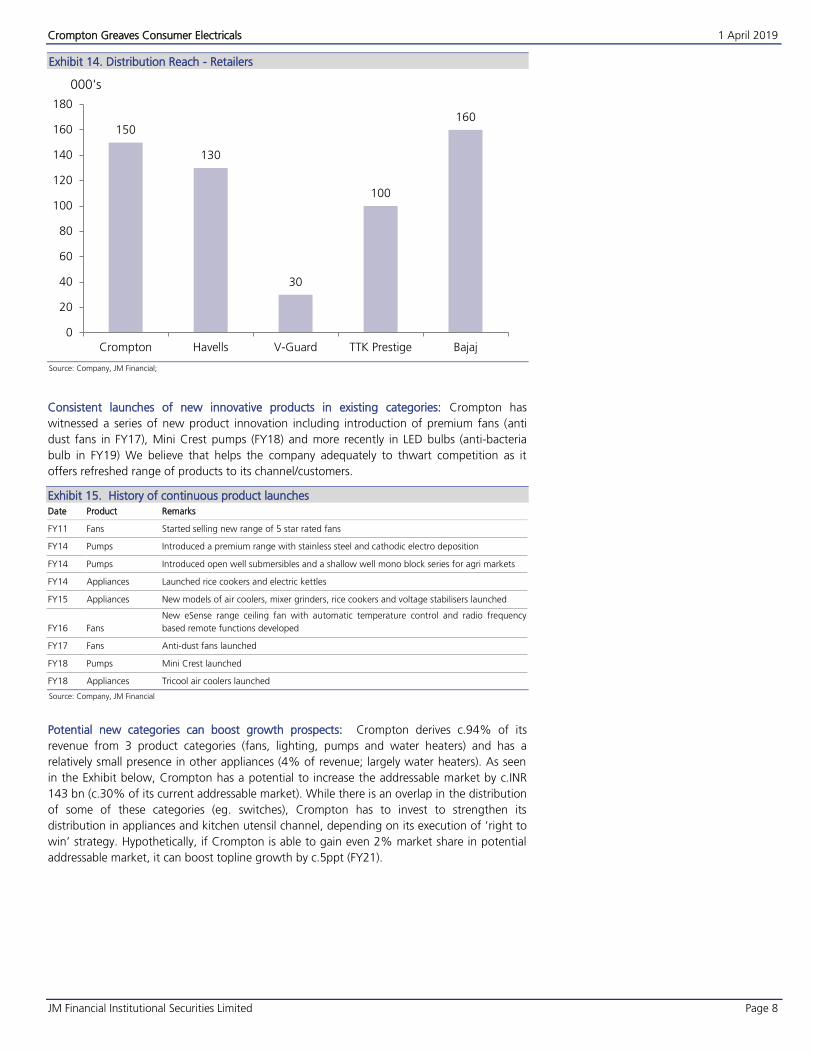
Distribution Reach - Retailers Exhibit 14.
Source: Company, JM Financial;
Consistent launches of new innovative products in existing categories: Crompton has
witnessed a series of new product innovation including introduction of premium fans (anti
dust fans in FY17), Mini Crest pumps (FY18) and more recently in LED bulbs (anti-bacteria
bulb in FY19) We believe that helps the company adequately to thwart competition as it
offers refreshed range of products to its channel/customers.
History of continuous product launches Exhibit 15.
Date Product Remarks
FY11 Fans Started selling new range of 5 star rated fans
FY14 Pumps Introduced a premium range with stainless steel and cathodic electro deposition
FY14 Pumps Introduced open well submersibles and a shallow well mono block series for agri markets
FY14 Appliances Launched rice cookers and electric kettles
FY15 Appliances New models of air coolers, mixer grinders, rice cookers and voltage stabilisers launched
FY16 Fans
New eSense range ceiling fan with automatic temperature control and radio frequency
based remote functions developed
FY17 Fans Anti-dust fans launched
FY18 Pumps Mini Crest launched
FY18 Appliances Tricool air coolers launched
Source: Company, JM Financial
Potential new categories can boost growth prospects: Crompton derives c.94% of its
revenue from 3 product categories (fans, lighting, pumps and water heaters) and has a
relatively small presence in other appliances (4% of revenue; largely water heaters). As seen
in the Exhibit below, Crompton has a potential to increase the addressable market by c.INR
143 bn (c.30% of its current addressable market). While there is an overlap in the distribution
of some of these categories (eg. switches), Crompton has to invest to strengthen its
distribution in appliances and kitchen utensil channel, depending on its execution of ‘right to
win’ strategy. Hypothetically, if Crompton is able to gain even 2% market share in potential
addressable market, it can boost topline growth by c.5ppt (FY21).
150
130
30
100
160
0
20
40
60
80
100
120
140
160
180
Crompton Havells V-Guard TTK Prestige Bajaj
000's
Crompton Greaves Consumer Electricals 1 April 2019
JM Financial Institutional Securities Limited Page 9
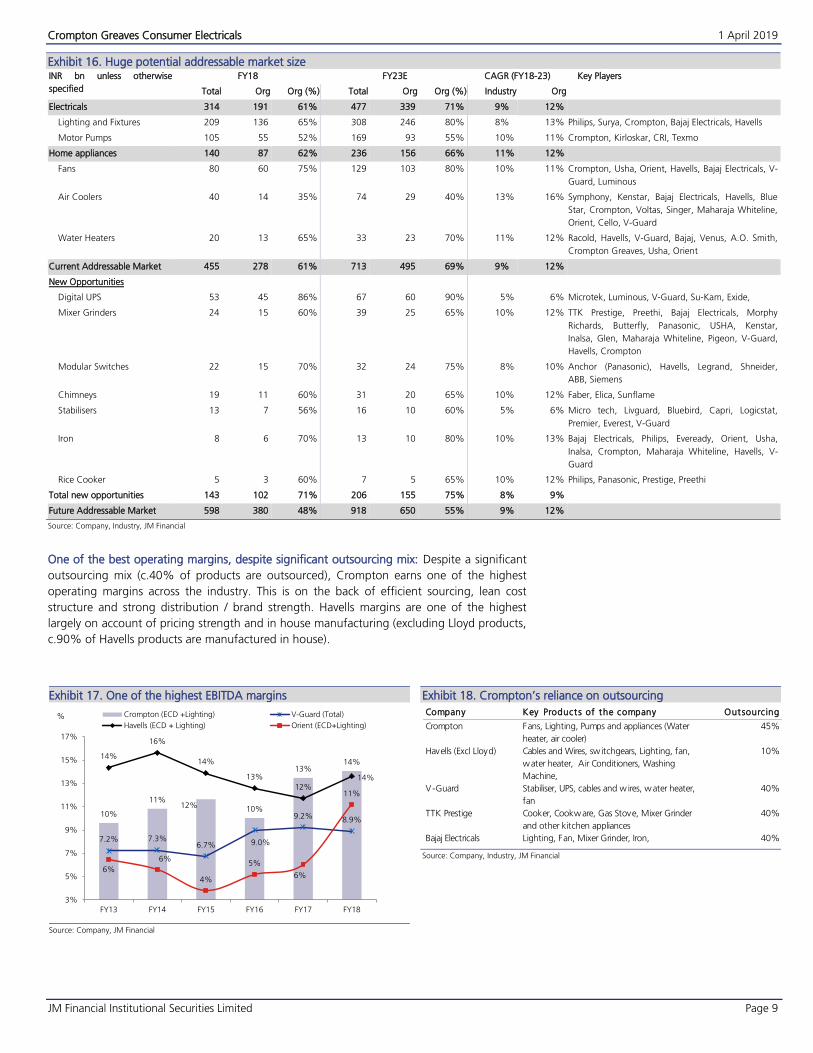
Huge potential addressable market size Exhibit 16.INR bn unless otherwise
specified
FY18 FY23E CAGR (FY18-23) Key Players
Total Org Org (%) Total Org Org (%) Industry Org
Electricals 314 191 61% 477 339 71% 9% 12%
Lighting and Fixtures 209 136 65% 308 246 80% 8%
Motor Pumps 105 55 52% 169 93 55% 10%
13% Philips, Surya, Crompton, Bajaj Electricals, Havells
11% Crompton, Kirloskar, CRI, Texmo
Home appliances 140 87 62% 236 156 66% 11% 12%
Fans 80 60 75% 129 103 80% 10% 11% Crompton, Usha, Orient, Havells, Bajaj Electricals, V-
Guard, Luminous
Air Coolers 40 14 35% 74 29 40% 13% 16% Symphony, Kenstar, Bajaj Electricals, Havells, Blue
Star, Crompton, Voltas, Singer, Maharaja Whiteline,
Orient, Cello, V-Guard
Water Heaters 20 13 65% 33 23 70% 11% 12% Racold, Havells, V-Guard, Bajaj, Venus, A.O. Smith,
Crompton Greaves, Usha, Orient
Current Addressable Market 455 278 61% 713 495 69% 9% 12%
New Opportunities
Digital UPS 53 45 86% 67 60 90% 5% 6% Microtek, Luminous, V-Guard, Su-Kam, Exide,
Mixer Grinders 24 15 60% 39 25 65% 10% 12% TTK Prestige, Preethi, Bajaj Electricals, Morphy
Richards, Butterfly, Panasonic, USHA, Kenstar,
Inalsa, Glen, Maharaja Whiteline, Pigeon, V-Guard,
Havells, Crompton
Modular Switches 22 15 70% 32 24 75% 8% 10% Anchor (Panasonic), Havells, Legrand, Shneider,
ABB, Siemens
Chimneys 19 11 60% 31 20 65% 10% 12% Faber, Elica, Sunflame
Stabilisers 13 7 56% 16 10 60% 5% 6% Micro tech, Livguard, Bluebird, Capri, Logicstat,
Premier, Everest, V-Guard
Iron 8 6 70% 13 10 80% 10% 13% Bajaj Electricals, Philips, Eveready, Orient, Usha,
Inalsa, Crompton, Maharaja Whiteline, Havells, V-
Guard
Rice Cooker 5 3 60% 7 5 65% 10% 12% Philips, Panasonic, Prestige, Preethi
Total new opportunities 143 102 71% 206 155 75% 8% 9%
Future Addressable Market 598 380 48% 918 650 55% 9% 12%
Source: Company, Industry, JM Financial
One of the best operating margins, despite significant outsourcing mix: Despite a significant
outsourcing mix (c.40% of products are outsourced), Crompton earns one of the highest
operating margins across the industry. This is on the back of efficient sourcing, lean cost
structure and strong distribution / brand strength. Havells margins are one of the highest
largely on account of pricing strength and in house manufacturing (excluding Lloyd products,
c.90% of Havells products are manufactured in house).
One of the highest EBITDA margins Exhibit 17.
Source: Company, JM Financial
Crompton’s reliance on outsourcing Exhibit 18.
Source: Company, Industry, JM Financial
10%
11%12% 10%
13%14%
7.2% 7.3%6.7% 9.0%
9.2% 8.9%
14%
16%
14%
13%
12%14%
6%
6%
4%
5%
6%
11%
3%
5%
7%
9%
11%
13%
15%
17%
FY13 FY14 FY15 FY16 FY17 FY18
% Crompton (ECD +Lighting) V-Guard (Total)
Havells (ECD + Lighting) Orient (ECD+Lighting)
Company Key Products of the company Outsourcing
Crompton Fans, Lighting, Pumps and appliances (Water
heater, air cooler)
45%
Havells (Excl Lloyd) Cables and Wires, sw itchgears, Lighting, fan,
water heater, Air Conditioners, Washing
Machine,
10%
V-Guard Stabiliser, UPS, cables and w ires, water heater,
fan
40%
TTK Prestige Cooker, Cookware, Gas Stove, Mixer Grinder
and other kitchen appliances
40%
Bajaj Electricals Lighting, Fan, Mixer Grinder, Iron, 40%
Crompton Greaves Consumer Electricals 1 April 2019
JM Financial Institutional Securities Limited Page 10
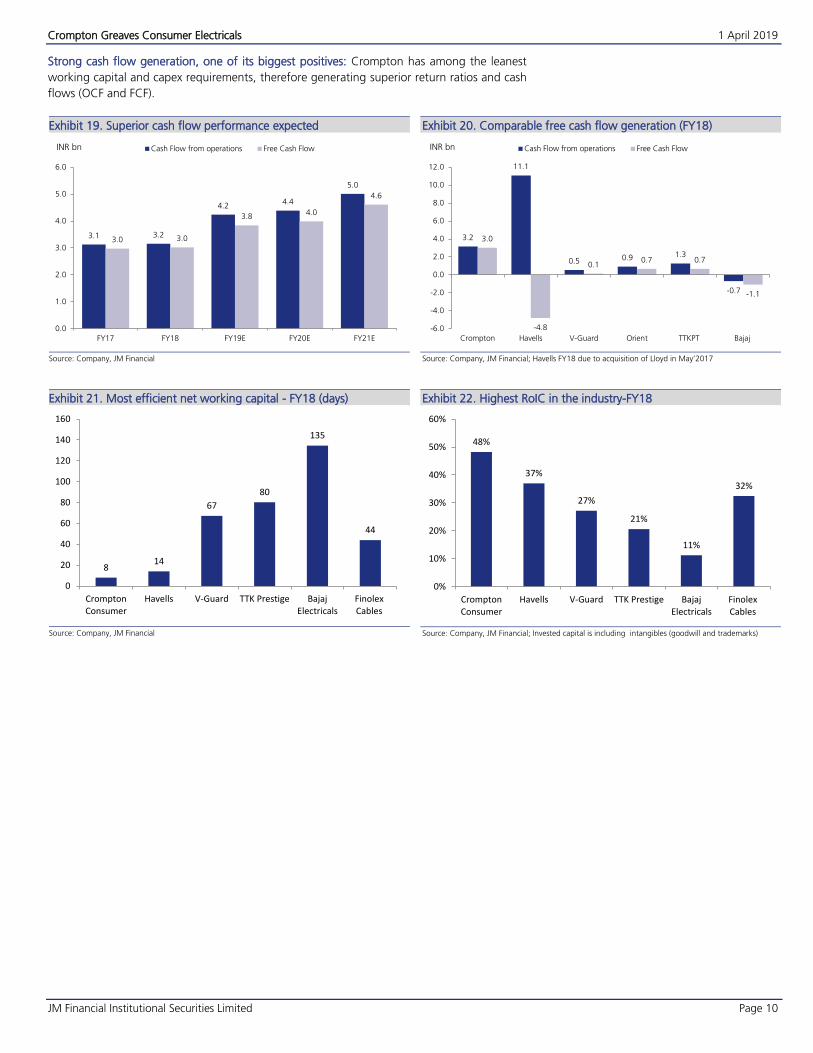
Strong cash flow generation, one of its biggest positives: Crompton has among the leanest
working capital and capex requirements, therefore generating superior return ratios and cash
flows (OCF and FCF).
Superior cash flow performance expected Exhibit 19.
Source: Company, JM Financial
Comparable free cash flow generation (FY18) Exhibit 20.
Source: Company, JM Financial; Havells FY18 due to acquisition of Lloyd in May’2017
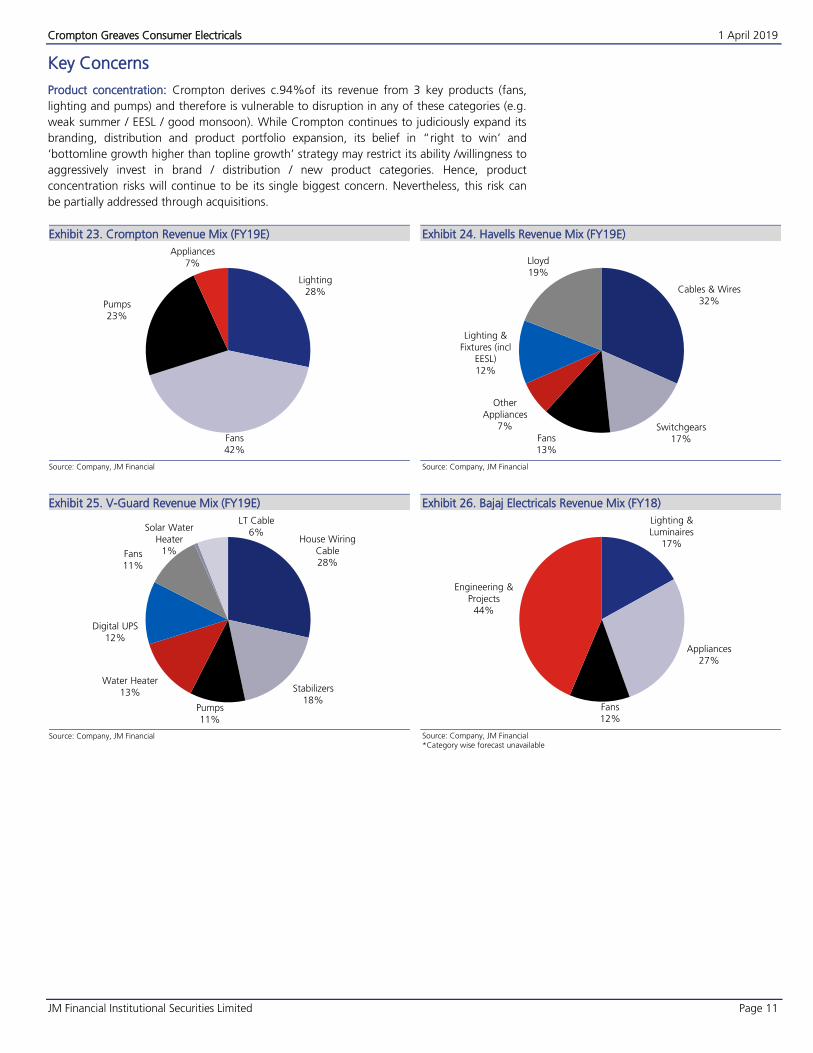
Most efficient net working capital - FY18 (days) Exhibit 21.
Source: Company, JM Financial
Highest RoIC in the industry-FY18 Exhibit 22.
Source: Company, JM Financial; Invested capital is including intangibles (goodwill and trademarks)
3.1 3.2
4.24.4
5.0
3.0 3.0
3.84.0
4.6
0.0
1.0
2.0
3.0
4.0
5.0
6.0
FY17 FY18 FY19E FY20E FY21E
Cash Flow from operations Free Cash FlowINR bn
3.2
11.1
0.5 0.9 1.3
-0.7
3.0
-4.8
0.10.7 0.7
-1.1
-6.0
-4.0
-2.0
0.0
2.0
4.0
6.0
8.0
10.0
12.0
Crompton Havells V-Guard Orient TTKPT Bajaj
Cash Flow from operations Free Cash FlowINR bn
814
67
80
135
44
0
20
40
60
80
100
120
140
160
CromptonConsumer
Havells V-Guard TTK Prestige BajajElectricals
FinolexCables
48%
37%
27%
21%
11%
32%
0%
10%
20%
30%
40%
50%
60%
CromptonConsumer
Havells V-Guard TTK Prestige BajajElectricals
FinolexCables
Crompton Greaves Consumer Electricals 1 April 2019
JM Financial Institutional Securities Limited Page 11
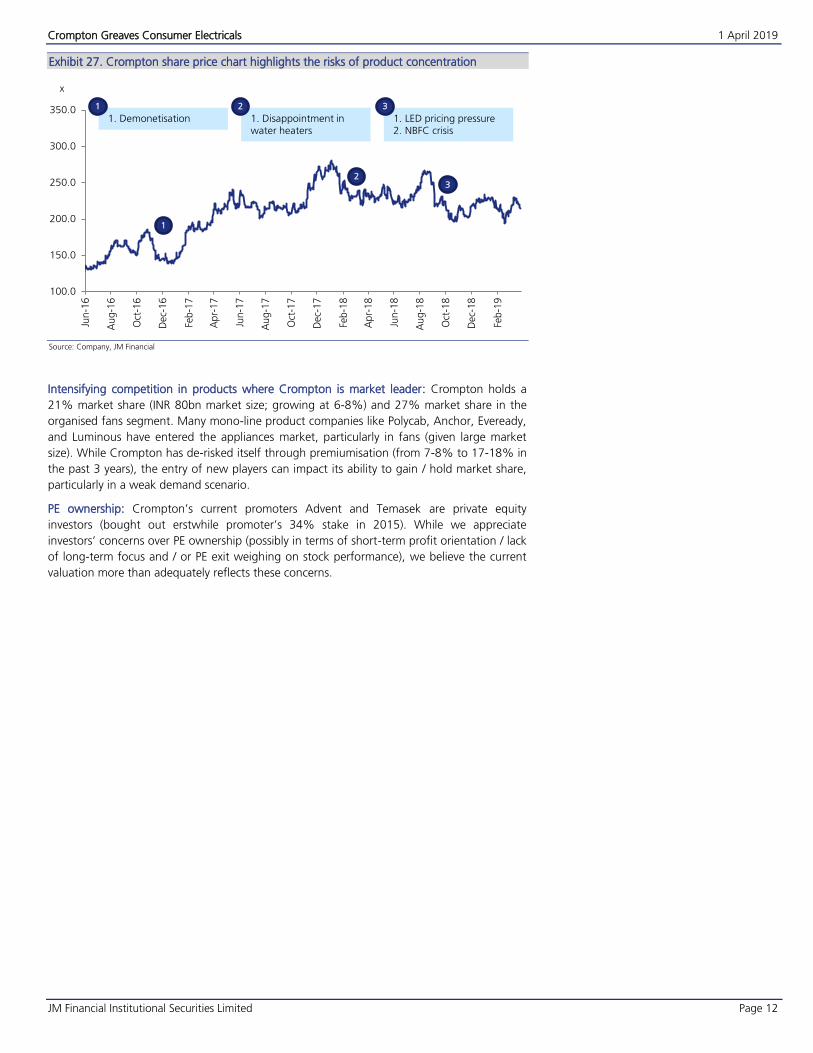
Key Concerns
Product concentration: Crompton derives c.94%of its revenue from 3 key products (fans,
lighting and pumps) and therefore is vulnerable to disruption in any of these categories (e.g.
weak summer / EESL / good monsoon). While Crompton continues to judiciously expand its
branding, distribution and product portfolio expansion, its belief in “right to win’ and
‘bottomline growth higher than topline growth’ strategy may restrict its ability /willingness to
aggressively invest in brand / distribution / new product categories. Hence, product
concentration risks will continue to be its single biggest concern. Nevertheless, this risk can
be partially addressed through acquisitions.
Crompton Revenue Mix (FY19E) Exhibit 23.
Source: Company, JM Financial
Havells Revenue Mix (FY19E) Exhibit 24.
Source: Company, JM Financial
V-Guard Revenue Mix (FY19E) Exhibit 25.
Source: Company, JM Financial
Bajaj Electricals Revenue Mix (FY18) Exhibit 26.
Source: Company, JM Financial *Category wise forecast unavailable
Lighting
28%
Fans
42%
Pumps
23%
Appliances
7%
Cables & Wires
32%
Switchgears
17%Fans
13%
Other
Appliances7%
Lighting &
Fixtures (incl EESL)
12%
Lloyd
19%
House Wiring
Cable28%
Stabilizers
18%Pumps
11%
Water Heater
13%
Digital UPS
12%
Fans
11%
Solar Water
Heater1%
LT Cable
6%
Lighting &
Luminaires17%
Appliances
27%
Fans
12%
Engineering &
Projects44%
Crompton Greaves Consumer Electricals 1 April 2019
JM Financial Institutional Securities Limited Page 12
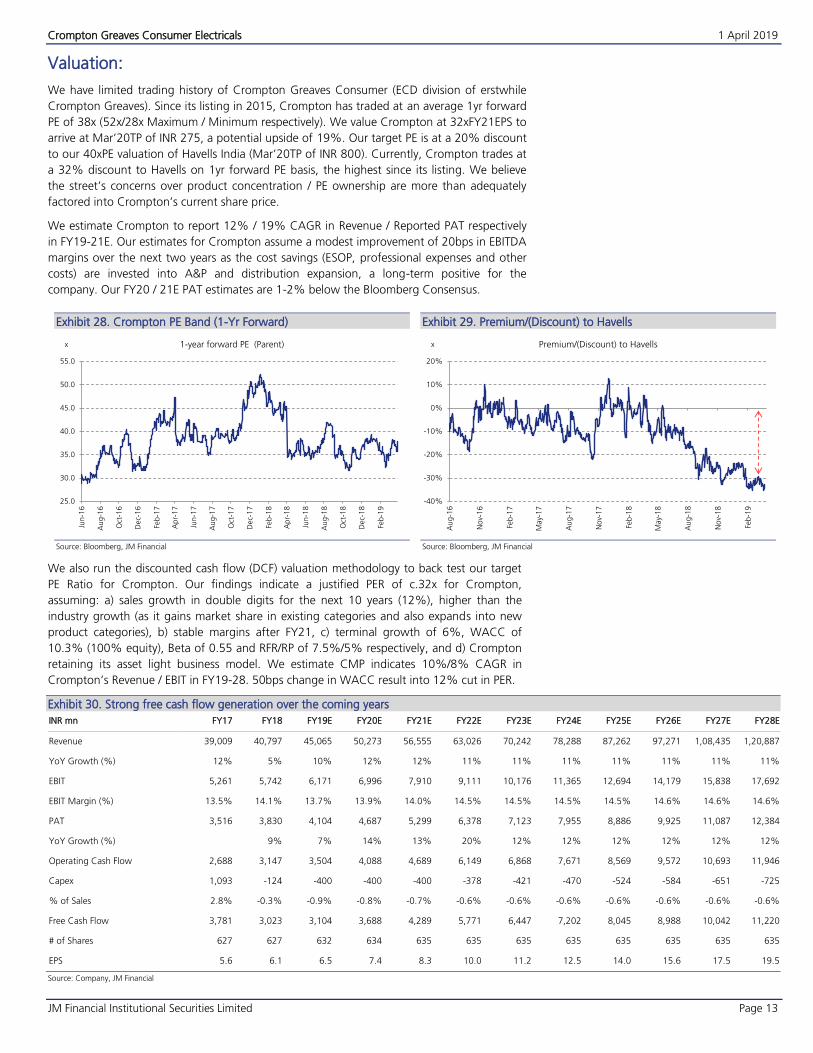
Crompton share price chart highlights the risks of product concentration Exhibit 27.
Source: Company, JM Financial
Intensifying competition in products where Crompton is market leader: Crompton holds a
21% market share (INR 80bn market size; growing at 6-8%) and 27% market share in the
organised fans segment. Many mono-line product companies like Polycab, Anchor, Eveready,
and Luminous have entered the appliances market, particularly in fans (given large market
size). While Crompton has de-risked itself through premiumisation (from 7-8% to 17-18% in
the past 3 years), the entry of new players can impact its ability to gain / hold market share,
particularly in a weak demand scenario.
PE ownership: Crompton’s current promoters Advent and Temasek are private equity
investors (bought out erstwhile promoter’s 34% stake in 2015). While we appreciate
investors’ concerns over PE ownership (possibly in terms of short-term profit orientation / lack
of long-term focus and / or PE exit weighing on stock performance), we believe the current
valuation more than adequately reflects these concerns.
100.0
150.0
200.0
250.0
300.0
350.0
Jun-1
6
Au
g-1
6
Oct
-16
Dec-
16
Feb
-17
Ap
r-17
Jun-1
7
Au
g-1
7
Oct
-17
Dec-
17
Feb
-18
Ap
r-18
Jun-1
8
Au
g-1
8
Oct
-18
Dec-
18
Feb
-19
x
1. Disappointment inwater heaters
2
23
1. LED pricing pressure2. NBFC crisis
3
1. Demonetisation
1
1
Crompton Greaves Consumer Electricals 1 April 2019
JM Financial Institutional Securities Limited Page 13
Valuation:
We have limited trading history of Crompton Greaves Consumer (ECD division of erstwhile
Crompton Greaves). Since its listing in 2015, Crompton has traded at an average 1yr forward
PE of 38x (52x/28x Maximum / Minimum respectively). We value Crompton at 32xFY21EPS to
arrive at Mar’20TP of INR 275, a potential upside of 19%. Our target PE is at a 20% discount
to our 40xPE valuation of Havells India (Mar’20TP of INR 800). Currently, Crompton trades at
a 32% discount to Havells on 1yr forward PE basis, the highest since its listing. We believe
the street’s concerns over product concentration / PE ownership are more than adequately
factored into Crompton’s current share price.
We estimate Crompton to report 12% / 19% CAGR in Revenue / Reported PAT respectively
in FY19-21E. Our estimates for Crompton assume a modest improvement of 20bps in EBITDA
margins over the next two years as the cost savings (ESOP, professional expenses and other
costs) are invested into A&P and distribution expansion, a long-term positive for the
company. Our FY20 / 21E PAT estimates are 1-2% below the Bloomberg Consensus.
Crompton PE Band (1-Yr Forward) Exhibit 28.
Source: Bloomberg, JM Financial
Premium/(Discount) to Havells Exhibit 29.
Source: Bloomberg, JM Financial
We also run the discounted cash flow (DCF) valuation methodology to back test our target
PE Ratio for Crompton. Our findings indicate a justified PER of c.32x for Crompton,
assuming: a) sales growth in double digits for the next 10 years (12%), higher than the
industry growth (as it gains market share in existing categories and also expands into new
product categories), b) stable margins after FY21, c) terminal growth of 6%, WACC of
10.3% (100% equity), Beta of 0.55 and RFR/RP of 7.5%/5% respectively, and d) Crompton
retaining its asset light business model. We estimate CMP indicates 10%/8% CAGR in
Crompton’s Revenue / EBIT in FY19-28. 50bps change in WACC result into 12% cut in PER.
Strong free cash flow generation over the coming years Exhibit 30.
INR mn FY17 FY18 FY19E FY20E FY21E FY22E FY23E FY24E FY25E FY26E FY27E FY28E
Revenue 39,009 40,797 45,065 50,273 56,555 63,026 70,242 78,288 87,262 97,271 1,08,435 1,20,887
YoY Growth (%) 12% 5% 10% 12% 12% 11% 11% 11% 11% 11% 11% 11%
EBIT 5,261 5,742 6,171 6,996 7,910 9,111 10,176 11,365 12,694 14,179 15,838 17,692
EBIT Margin (%) 13.5% 14.1% 13.7% 13.9% 14.0% 14.5% 14.5% 14.5% 14.5% 14.6% 14.6% 14.6%
PAT 3,516 3,830 4,104 4,687 5,299 6,378 7,123 7,955 8,886 9,925 11,087 12,384
YoY Growth (%) 9% 7% 14% 13% 20% 12% 12% 12% 12% 12% 12%
Operating Cash Flow 2,688 3,147 3,504 4,088 4,689 6,149 6,868 7,671 8,569 9,572 10,693 11,946
Capex 1,093 -124 -400 -400 -400 -378 -421 -470 -524 -584 -651 -725
% of Sales 2.8% -0.3% -0.9% -0.8% -0.7% -0.6% -0.6% -0.6% -0.6% -0.6% -0.6% -0.6%
Free Cash Flow 3,781 3,023 3,104 3,688 4,289 5,771 6,447 7,202 8,045 8,988 10,042 11,220
# of Shares 627 627 632 634 635 635 635 635 635 635 635 635
EPS 5.6 6.1 6.5 7.4 8.3 10.0 11.2 12.5 14.0 15.6 17.5 19.5
Source: Company, JM Financial
25.0
30.0
35.0
40.0
45.0
50.0
55.0
Jun-1
6
Au
g-1
6
Oct
-16
Dec-
16
Feb-1
7
Ap
r-17
Jun-1
7
Au
g-1
7
Oct
-17
Dec-
17
Feb-1
8
Ap
r-18
Jun-1
8
Au
g-1
8
Oct
-18
Dec-
18
Feb-1
9
1-year forward PE (Parent)x
-40%
-30%
-20%
-10%
0%
10%
20%
Au
g-1
6
No
v-16
Feb-1
7
May-
17
Au
g-1
7
No
v-17
Feb-1
8
May-
18
Au
g-1
8
No
v-18
Feb-1
9
Premium/(Discount) to Havellsx
Crompton Greaves Consumer Electricals 1 April 2019
JM Financial Institutional Securities Limited Page 14
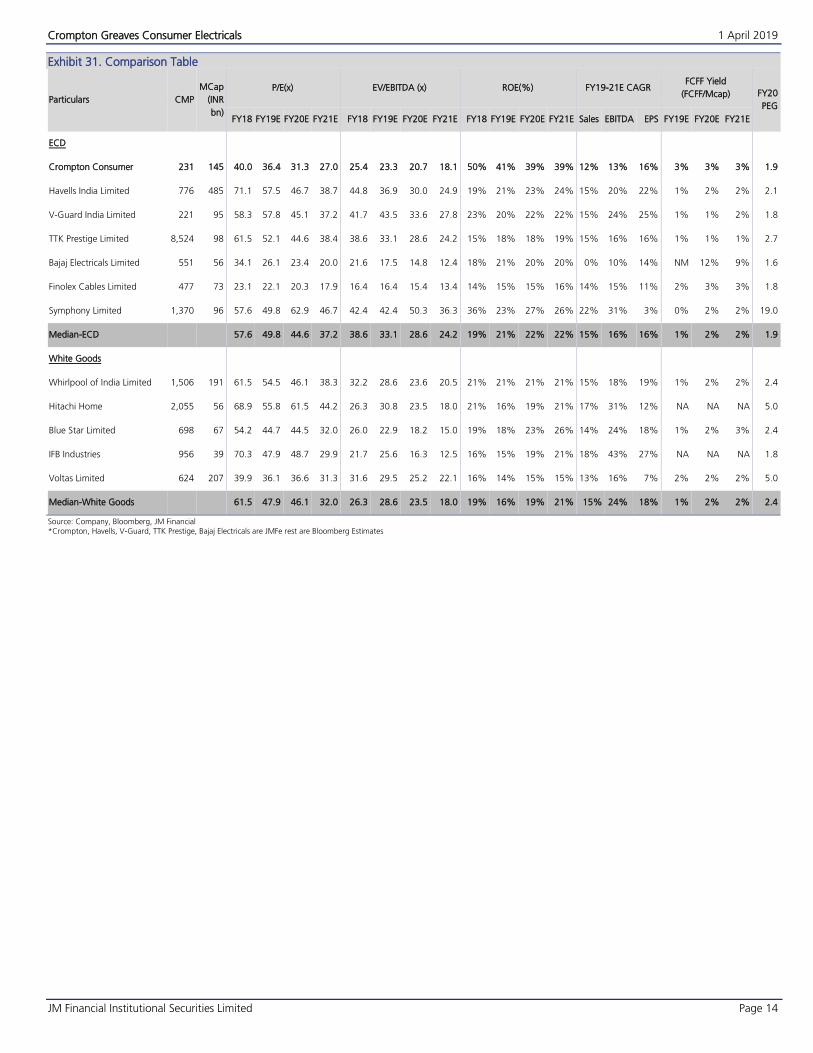
Comparison Table Exhibit 31.
Particulars CMP
MCap
(INR
bn)
P/E(x) EV/EBITDA (x) ROE(%) FY19-21E CAGR FCFF Yield
(FCFF/Mcap) FY20
PEG
FY18 FY19E FY20E FY21E FY18 FY19E FY20E FY21E FY18 FY19E FY20E FY21E Sales EBITDA EPS FY19E FY20E FY21E
ECD
Crompton Consumer 231 145 40.0 36.4 31.3 27.0 25.4 23.3 20.7 18.1 50% 41% 39% 39% 12% 13% 16% 3% 3% 3% 1.9
Havells India Limited 776 485 71.1 57.5 46.7 38.7 44.8 36.9 30.0 24.9 19% 21% 23% 24% 15% 20% 22% 1% 2% 2% 2.1
V-Guard India Limited 221 95 58.3 57.8 45.1 37.2 41.7 43.5 33.6 27.8 23% 20% 22% 22% 15% 24% 25% 1% 1% 2% 1.8
TTK Prestige Limited 8,524 98 61.5 52.1 44.6 38.4 38.6 33.1 28.6 24.2 15% 18% 18% 19% 15% 16% 16% 1% 1% 1% 2.7
Bajaj Electricals Limited 551 56 34.1 26.1 23.4 20.0 21.6 17.5 14.8 12.4 18% 21% 20% 20% 0% 10% 14% NM 12% 9% 1.6
Finolex Cables Limited 477 73 23.1 22.1 20.3 17.9 16.4 16.4 15.4 13.4 14% 15% 15% 16% 14% 15% 11% 2% 3% 3% 1.8
Symphony Limited 1,370 96 57.6 49.8 62.9 46.7 42.4 42.4 50.3 36.3 36% 23% 27% 26% 22% 31% 3% 0% 2% 2% 19.0
Median-ECD 57.6 49.8 44.6 37.2 38.6 33.1 28.6 24.2 19% 21% 22% 22% 15% 16% 16% 1% 2% 2% 1.9
White Goods
Whirlpool of India Limited 1,506 191 61.5 54.5 46.1 38.3 32.2 28.6 23.6 20.5 21% 21% 21% 21% 15% 18% 19% 1% 2% 2% 2.4
Hitachi Home 2,055 56 68.9 55.8 61.5 44.2 26.3 30.8 23.5 18.0 21% 16% 19% 21% 17% 31% 12% NA NA NA 5.0
Blue Star Limited 698 67 54.2 44.7 44.5 32.0 26.0 22.9 18.2 15.0 19% 18% 23% 26% 14% 24% 18% 1% 2% 3% 2.4
IFB Industries 956 39 70.3 47.9 48.7 29.9 21.7 25.6 16.3 12.5 16% 15% 19% 21% 18% 43% 27% NA NA NA 1.8
Voltas Limited 624 207 39.9 36.1 36.6 31.3 31.6 29.5 25.2 22.1 16% 14% 15% 15% 13% 16% 7% 2% 2% 2% 5.0
Median-White Goods 61.5 47.9 46.1 32.0 26.3 28.6 23.5 18.0 19% 16% 19% 21% 15% 24% 18% 1% 2% 2% 2.4
Source: Company, Bloomberg, JM Financial
*Crompton, Havells, V-Guard, TTK Prestige, Bajaj Electricals are JMFe rest are Bloomberg Estimates
Crompton Greaves Consumer Electricals 1 April 2019
JM Financial Institutional Securities Limited Page 15
Comparison with Havells
Product concentration risk: While Crompton derives 94% of its revenue from fans, pumps
and lighting (c.41% fans alone), Havells' product portfolio is much more diversified and
evolved (industrial cable, consumer wires, switchgears, switches, lighting, fans, water heater,
air conditioner, washing machine among others; 'consumer wire' is the largest revenue
segment contributing 16-17%).
Crompton management follows 'right to win' strategy and hence does not plan to diversify
into all appliances unless they have reasonable chances of market leadership (at least feature
among the top 3 players) in the category. Hence the product portfolio is currently restricted
to fans, pumps, appliances, consumer lighting and newly added categories of water heaters
and air coolers. This exposes the company to disruption in any product segment (eg. recent
irrational pricing in the LED segment).
Havells’ superior distribution and brand strength: Havells score significantly higher of
Crompton in terms of distribution, reach and strength across channels (electricals, appliances,
modern retail format, and multi brand outlets) given its diverse product offering and
branding initiatives. While we believe the Crompton brand is reasonably strong in tier 1/tier 2
cities, it will require significant investments to penetrate deeper into tier 3 cities and rural
markets, which are expected to be a key growth driver (beneficiary of extensive rural
electrification programmes).
Crompton’s return ratios are superior due to high operating margins and low capex /
working capital investments: Crompton has been mostly perceived as ‘value-for-money’
brand due to a lack of focus on brand positioning in the past (changing slowly from FY16).
On the other hand, Havells has positioned itself as a formidable ‘premium brand’ with
aggressive spending on brand building (INR 13.5bn in FY08-18; 10yr average of c.2.9% of
sales).
Despite the economy perception, Crompton’s RoCE / RoIC are significantly higher than that
of Havells on the back of superior EBIT margins and a negligible capex / working capital
requirement (55-60% outsourcing vs. 10-12% for Havells excluding Lloyd).
Concerns regarding PE ownership: Unlike Havells (promoter family owns c.62% of the
company), Crompton’s current promoters Advent and Temasek (bought out erstwhile
promoter’s 34% stake in 2015) are private equity investors. This creates a possible perception
of short-term profit orientation / lack of long-term focus and / or PE exit weighing on its stock
performance. We believe the current valuation more than adequately reflects these concerns.
Crompton Greaves Consumer Electricals 1 April 2019
JM Financial Institutional Securities Limited Page 16
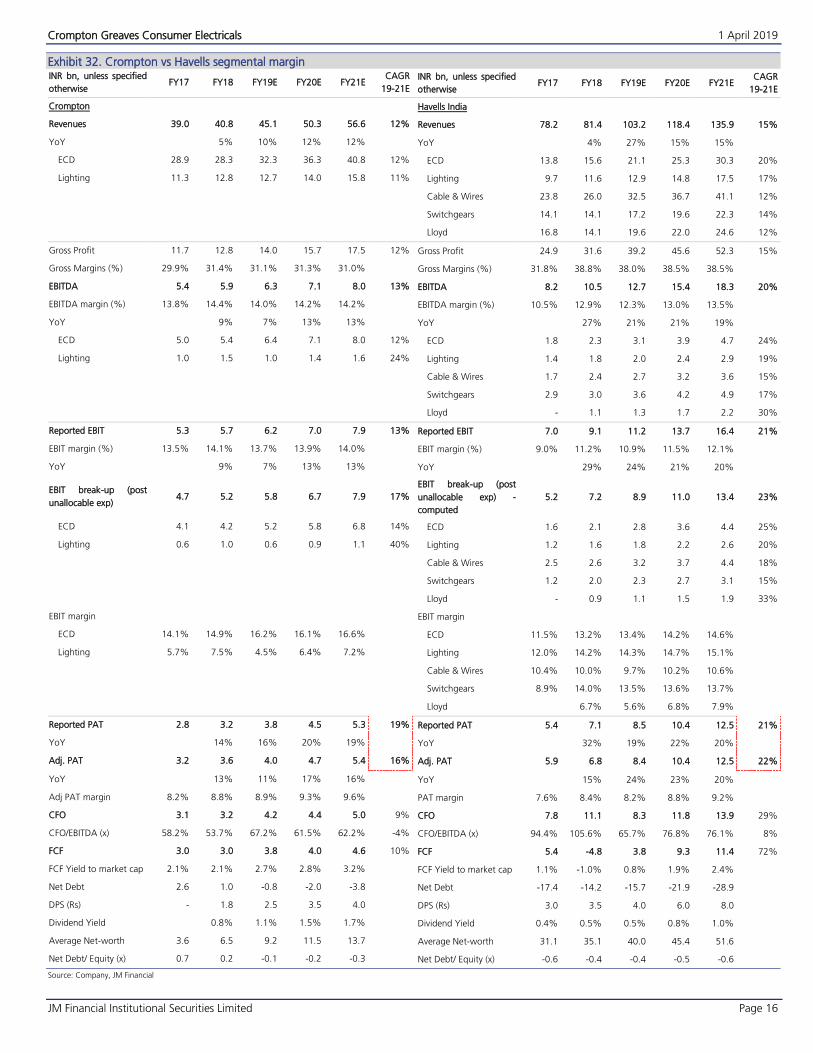
Crompton vs Havells segmental margin Exhibit 32.INR bn, unless specified
otherwise FY17 FY18 FY19E FY20E FY21E
CAGR
19-21E
INR bn, unless specified
otherwise FY17 FY18 FY19E FY20E FY21E
CAGR
19-21E
Crompton Havells India
Revenues 39.0 40.8 45.1 50.3 56.6 12% Revenues 78.2 81.4 103.2 118.4 135.9 15%
YoY 5% 10% 12% 12% YoY 4% 27% 15% 15%
ECD 28.9 28.3 32.3 36.3 40.8 12% ECD 13.8 15.6 21.1 25.3 30.3 20%
Lighting 11.3 12.8 12.7 14.0 15.8 11% Lighting 9.7 11.6 12.9 14.8 17.5 17%
Cable & Wires 23.8 26.0 32.5 36.7 41.1 12%
Switchgears 14.1 14.1 17.2 19.6 22.3 14%
Lloyd 16.8 14.1 19.6 22.0 24.6 12%
Gross Profit 11.7 12.8 14.0 15.7 17.5 12% Gross Profit 24.9 31.6 39.2 45.6 52.3 15%
Gross Margins (%) 29.9% 31.4% 31.1% 31.3% 31.0% Gross Margins (%) 31.8% 38.8% 38.0% 38.5% 38.5%
EBITDA 5.4 5.9 6.3 7.1 8.0 13% EBITDA 8.2 10.5 12.7 15.4 18.3 20%
EBITDA margin (%) 13.8% 14.4% 14.0% 14.2% 14.2% EBITDA margin (%) 10.5% 12.9% 12.3% 13.0% 13.5%
YoY 9% 7% 13% 13% YoY 27% 21% 21% 19%
ECD 5.0 5.4 6.4 7.1 8.0 12% ECD 1.8 2.3 3.1 3.9 4.7 24%
Lighting 1.0 1.5 1.0 1.4 1.6 24% Lighting 1.4 1.8 2.0 2.4 2.9 19%
Cable & Wires 1.7 2.4 2.7 3.2 3.6 15%
Switchgears 2.9 3.0 3.6 4.2 4.9 17%
Lloyd - 1.1 1.3 1.7 2.2 30%
Reported EBIT 5.3 5.7 6.2 7.0 7.9 13% Reported EBIT 7.0 9.1 11.2 13.7 16.4 21%
EBIT margin (%) 13.5% 14.1% 13.7% 13.9% 14.0% EBIT margin (%) 9.0% 11.2% 10.9% 11.5% 12.1%
YoY 9% 7% 13% 13% YoY 29% 24% 21% 20%
EBIT break-up (post
unallocable exp) 4.7 5.2 5.8 6.7 7.9 17%
EBIT break-up (post
unallocable exp) -
computed
5.2 7.2 8.9 11.0 13.4 23%
ECD 4.1 4.2 5.2 5.8 6.8 14% ECD 1.6 2.1 2.8 3.6 4.4 25%
Lighting 0.6 1.0 0.6 0.9 1.1 40% Lighting 1.2 1.6 1.8 2.2 2.6 20%
Cable & Wires 2.5 2.6 3.2 3.7 4.4 18%
Switchgears 1.2 2.0 2.3 2.7 3.1 15%
Lloyd - 0.9 1.1 1.5 1.9 33%
EBIT margin EBIT margin
ECD 14.1% 14.9% 16.2% 16.1% 16.6% ECD 11.5% 13.2% 13.4% 14.2% 14.6%
Lighting 5.7% 7.5% 4.5% 6.4% 7.2% Lighting 12.0% 14.2% 14.3% 14.7% 15.1%
Cable & Wires 10.4% 10.0% 9.7% 10.2% 10.6%
Switchgears 8.9% 14.0% 13.5% 13.6% 13.7%
Lloyd 6.7% 5.6% 6.8% 7.9%
Reported PAT 2.8 3.2 3.8 4.5 5.3 19% Reported PAT 5.4 7.1 8.5 10.4 12.5 21%
YoY 14% 16% 20% 19% YoY 32% 19% 22% 20%
Adj. PAT 3.2 3.6 4.0 4.7 5.4 16% Adj. PAT 5.9 6.8 8.4 10.4 12.5 22%
YoY 13% 11% 17% 16% YoY 15% 24% 23% 20%
Adj PAT margin 8.2% 8.8% 8.9% 9.3% 9.6% PAT margin 7.6% 8.4% 8.2% 8.8% 9.2%
CFO 3.1 3.2 4.2 4.4 5.0 9% CFO 7.8 11.1 8.3 11.8 13.9 29%
CFO/EBITDA (x) 58.2% 53.7% 67.2% 61.5% 62.2% -4% CFO/EBITDA (x) 94.4% 105.6% 65.7% 76.8% 76.1% 8%
FCF 3.0 3.0 3.8 4.0 4.6 10% FCF 5.4 -4.8 3.8 9.3 11.4 72%
FCF Yield to market cap 2.1% 2.1% 2.7% 2.8% 3.2% FCF Yield to market cap 1.1% -1.0% 0.8% 1.9% 2.4%
Net Debt 2.6 1.0 -0.8 -2.0 -3.8 Net Debt -17.4 -14.2 -15.7 -21.9 -28.9
DPS (Rs) - 1.8 2.5 3.5 4.0 DPS (Rs) 3.0 3.5 4.0 6.0 8.0
Dividend Yield 0.8% 1.1% 1.5% 1.7% Dividend Yield 0.4% 0.5% 0.5% 0.8% 1.0%
Average Net-worth 3.6 6.5 9.2 11.5 13.7 Average Net-worth 31.1 35.1 40.0 45.4 51.6
Net Debt/ Equity (x) 0.7 0.2 -0.1 -0.2 -0.3 Net Debt/ Equity (x) -0.6 -0.4 -0.4 -0.5 -0.6
Source: Company, JM Financial
Crompton Greaves Consumer Electricals 1 April 2019
JM Financial Institutional Securities Limited Page 17
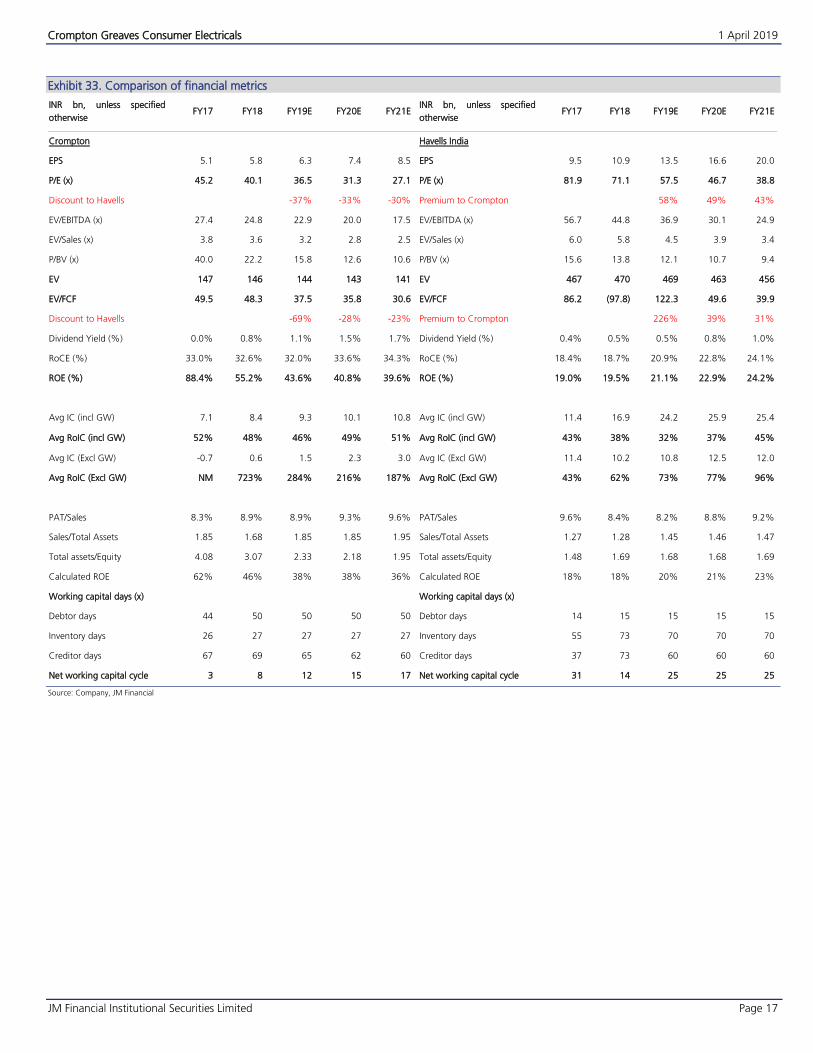
Comparison of financial metrics Exhibit 33.
INR bn, unless specified
otherwise FY17 FY18 FY19E FY20E FY21E
INR bn, unless specified
otherwise FY17 FY18 FY19E FY20E FY21E
Crompton Havells India
EPS 5.1 5.8 6.3 7.4 8.5 EPS 9.5 10.9 13.5 16.6 20.0
P/E (x) 45.2 40.1 36.5 31.3 27.1 P/E (x) 81.9 71.1 57.5 46.7 38.8
Discount to Havells -37% -33% -30% Premium to Crompton 58% 49% 43%
EV/EBITDA (x) 27.4 24.8 22.9 20.0 17.5 EV/EBITDA (x) 56.7 44.8 36.9 30.1 24.9
EV/Sales (x) 3.8 3.6 3.2 2.8 2.5 EV/Sales (x) 6.0 5.8 4.5 3.9 3.4
P/BV (x) 40.0 22.2 15.8 12.6 10.6 P/BV (x) 15.6 13.8 12.1 10.7 9.4
EV 147 146 144 143 141 EV 467 470 469 463 456
EV/FCF 49.5 48.3 37.5 35.8 30.6 EV/FCF 86.2 (97.8) 122.3 49.6 39.9
Discount to Havells -69% -28% -23% Premium to Crompton 226% 39% 31%
Dividend Yield (%) 0.0% 0.8% 1.1% 1.5% 1.7% Dividend Yield (%) 0.4% 0.5% 0.5% 0.8% 1.0%
RoCE (%) 33.0% 32.6% 32.0% 33.6% 34.3% RoCE (%) 18.4% 18.7% 20.9% 22.8% 24.1%
ROE (%) 88.4% 55.2% 43.6% 40.8% 39.6% ROE (%) 19.0% 19.5% 21.1% 22.9% 24.2%
Avg IC (incl GW) 7.1 8.4 9.3 10.1 10.8 Avg IC (incl GW) 11.4 16.9 24.2 25.9 25.4
Avg RoIC (incl GW) 52% 48% 46% 49% 51% Avg RoIC (incl GW) 43% 38% 32% 37% 45%
Avg IC (Excl GW) -0.7 0.6 1.5 2.3 3.0 Avg IC (Excl GW) 11.4 10.2 10.8 12.5 12.0
Avg RoIC (Excl GW) NM 723% 284% 216% 187% Avg RoIC (Excl GW) 43% 62% 73% 77% 96%
PAT/Sales 8.3% 8.9% 8.9% 9.3% 9.6% PAT/Sales 9.6% 8.4% 8.2% 8.8% 9.2%
Sales/Total Assets 1.85 1.68 1.85 1.85 1.95 Sales/Total Assets 1.27 1.28 1.45 1.46 1.47
Total assets/Equity 4.08 3.07 2.33 2.18 1.95 Total assets/Equity 1.48 1.69 1.68 1.68 1.69
Calculated ROE 62% 46% 38% 38% 36% Calculated ROE 18% 18% 20% 21% 23%
Working capital days (x) Working capital days (x)
Debtor days 44 50 50 50 50 Debtor days 14 15 15 15 15
Inventory days 26 27 27 27 27 Inventory days 55 73 70 70 70
Creditor days 67 69 65 62 60 Creditor days 37 73 60 60 60
Net working capital cycle 3 8 12 15 17 Net working capital cycle 31 14 25 25 25
Source: Company, JM Financial
Crompton Greaves Consumer Electricals 1 April 2019
JM Financial Institutional Securities Limited Page 18
Business Analysis #1: Electrical consumer durables segment
(FY18: 70% of revenue and 78% of EBIT)
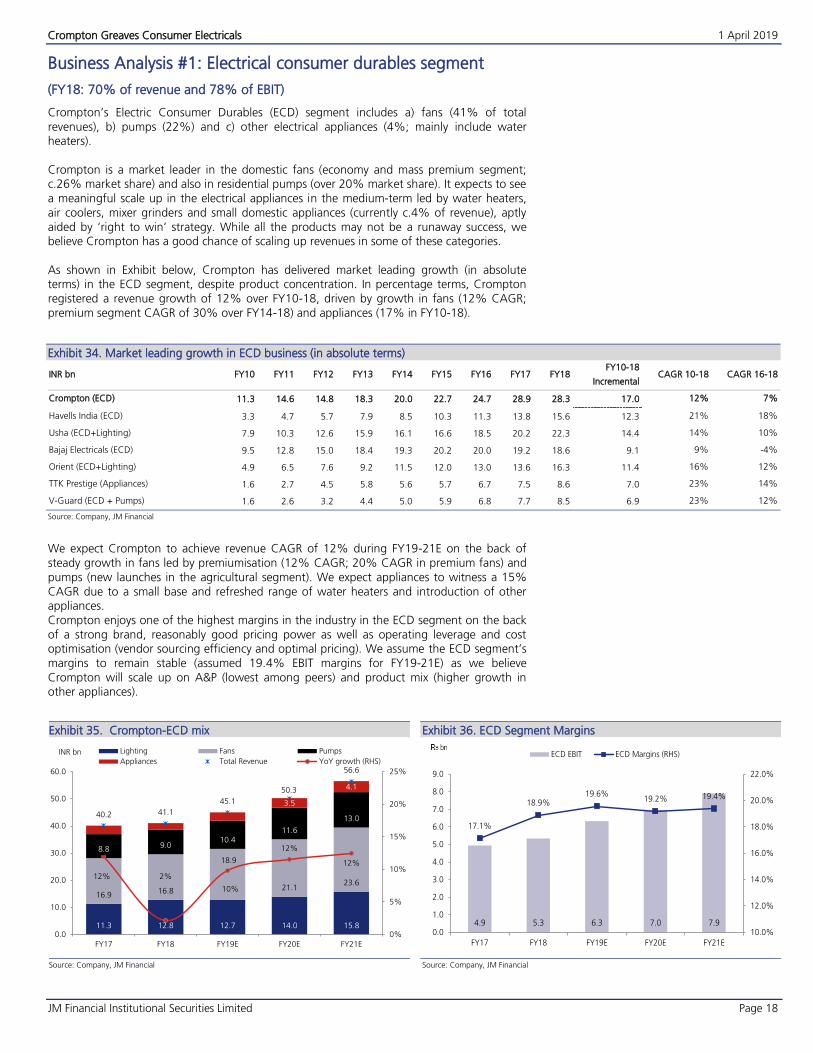
Crompton’s Electric Consumer Durables (ECD) segment includes a) fans (41% of total revenues), b) pumps (22%) and c) other electrical appliances (4%; mainly include water heaters).
Crompton is a market leader in the domestic fans (economy and mass premium segment; c.26% market share) and also in residential pumps (over 20% market share). It expects to seea meaningful scale up in the electrical appliances in the medium-term led by water heaters,air coolers, mixer grinders and small domestic appliances (currently c.4% of revenue), aptlyaided by ‘right to win’ strategy. While all the products may not be a runaway success, webelieve Crompton has a good chance of scaling up revenues in some of these categories.
As shown in Exhibit below, Crompton has delivered market leading growth (in absolute terms) in the ECD segment, despite product concentration. In percentage terms, Crompton registered a revenue growth of 12% over FY10-18, driven by growth in fans (12% CAGR; premium segment CAGR of 30% over FY14-18) and appliances (17% in FY10-18).
Market leading growth in ECD business (in absolute terms) Exhibit 34.
INR bn FY10 FY11 FY12 FY13 FY14 FY15 FY16 FY17 FY18 FY10-18
Incremental CAGR 10-18 CAGR 16-18
Crompton (ECD) 11.3 14.6 14.8 18.3 20.0 22.7 24.7 28.9 28.3 17.0 12% 7%
Havells India (ECD) 3.3 4.7 5.7 7.9 8.5 10.3 11.3 13.8 15.6 12.3 21% 18%
Usha (ECD+Lighting) 7.9 10.3 12.6 15.9 16.1 16.6 18.5 20.2 22.3 14.4 14% 10%
Bajaj Electricals (ECD) 9.5 12.8 15.0 18.4 19.3 20.2 20.0 19.2 18.6 9.1 9% -4%
Orient (ECD+Lighting) 4.9 6.5 7.6 9.2 11.5 12.0 13.0 13.6 16.3 11.4 16% 12%
TTK Prestige (Appliances) 1.6 2.7 4.5 5.8 5.6 5.7 6.7 7.5 8.6 7.0 23% 14%
V-Guard (ECD + Pumps) 1.6 2.6 3.2 4.4 5.0 5.9 6.8 7.7 8.5 6.9 23% 12%
Source: Company, JM Financial
We expect Crompton to achieve revenue CAGR of 12% during FY19-21E on the back of steady growth in fans led by premiumisation (12% CAGR; 20% CAGR in premium fans) and
pumps (new launches in the agricultural segment). We expect appliances to witness a 15% CAGR due to a small base and refreshed range of water heaters and introduction of other appliances. Crompton enjoys one of the highest margins in the industry in the ECD segment on the back of a strong brand, reasonably good pricing power as well as operating leverage and cost optimisation (vendor sourcing efficiency and optimal pricing). We assume the ECD segment’s margins to remain stable (assumed 19.4% EBIT margins for FY19-21E) as we believe Crompton will scale up on A&P (lowest among peers) and product mix (higher growth in other appliances).
Crompton-ECD mix Exhibit 35.
Source: Company, JM Financial
ECD Segment Margins Exhibit 36.
Source: Company, JM Financial
11.3 12.8 12.7 14.0 15.8
16.916.8
18.9
21.123.6
8.89.0
10.411.6
13.0
3.5
4.1
40.2 41.1
45.1
50.3
56.6
12% 2%
10%
12%
12%
0%
5%
10%
15%
20%
25%
0.0
10.0
20.0
30.0
40.0
50.0
60.0
FY17 FY18 FY19E FY20E FY21E
INR bn Lighting Fans Pumps
Appliances Total Revenue YoY growth (RHS)
4.9 5.3 6.3 7.0 7.9
17.1%
18.9%19.6%
19.2% 19.4%
10.0%
12.0%
14.0%
16.0%
18.0%
20.0%
22.0%
0.0
1.0
2.0
3.0
4.0
5.0
6.0
7.0
8.0
9.0
FY17 FY18 FY19E FY20E FY21E
ECD EBIT ECD Margins (RHS)
Crompton Greaves Consumer Electricals 1 April 2019
JM Financial Institutional Securities Limited Page 19
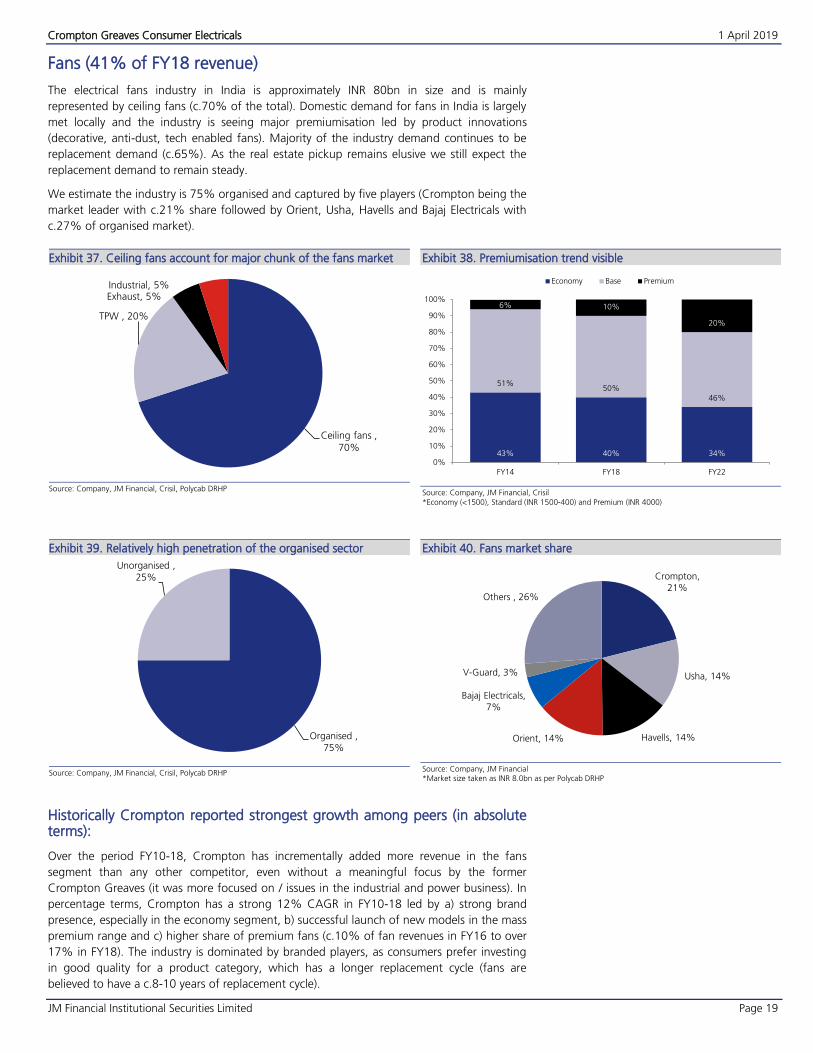
Fans (41% of FY18 revenue)
The electrical fans industry in India is approximately INR 80bn in size and is mainly
represented by ceiling fans (c.70% of the total). Domestic demand for fans in India is largely
met locally and the industry is seeing major premiumisation led by product innovations
(decorative, anti-dust, tech enabled fans). Majority of the industry demand continues to be
replacement demand (c.65%). As the real estate pickup remains elusive we still expect the
replacement demand to remain steady.
We estimate the industry is 75% organised and captured by five players (Crompton being the
market leader with c.21% share followed by Orient, Usha, Havells and Bajaj Electricals with
c.27% of organised market).
Ceiling fans account for major chunk of the fans market Exhibit 37.
Source: Company, JM Financial, Crisil, Polycab DRHP
Premiumisation trend visible Exhibit 38.
Source: Company, JM Financial, Crisil
*Economy (<1500), Standard (INR 1500-400) and Premium (INR 4000)
Relatively high penetration of the organised sector Exhibit 39.
Source: Company, JM Financial, Crisil, Polycab DRHP
Fans market share Exhibit 40.
Source: Company, JM Financial *Market size taken as INR 8.0bn as per Polycab DRHP
Historically Crompton reported strongest growth among peers (in absolute terms):
Over the period FY10-18, Crompton has incrementally added more revenue in the fans
segment than any other competitor, even without a meaningful focus by the former
Crompton Greaves (it was more focused on / issues in the industrial and power business). In
percentage terms, Crompton has a strong 12% CAGR in FY10-18 led by a) strong brand
presence, especially in the economy segment, b) successful launch of new models in the mass
premium range and c) higher share of premium fans (c.10% of fan revenues in FY16 to over
17% in FY18). The industry is dominated by branded players, as consumers prefer investing
in good quality for a product category, which has a longer replacement cycle (fans are
believed to have a c.8-10 years of replacement cycle).
Ceiling fans ,
70%
TPW , 20%
Exhaust, 5%Industrial, 5%
43% 40% 34%
51%50%
46%
6% 10%
20%
0%
10%
20%
30%
40%
50%
60%
70%
80%
90%
100%
FY14 FY18 FY22
Economy Base Premium
Organised ,
75%
Unorganised ,
25% Crompton,
21%
Usha, 14%
Havells, 14%Orient, 14%
Bajaj Electricals,
7%
V-Guard, 3%
Others , 26%
Crompton Greaves Consumer Electricals 1 April 2019
JM Financial Institutional Securities Limited Page 20
Strong growth in mature fans category Exhibit 41.
INR bn FY10 FY11 FY12 FY13 FY14 FY15 FY16 FY17 FY18
FY10-18
Incremental CAGR 10-18 CAGR 16-18
Crompton 6.6 8.6 8.8 10.7 12.4 14.1 14.7 16.9 16.8 10.3 12% 7%
Usha 4.8 6.1 7.5 8.5 8.3 8.9 9.4 10.2 11.5 6.8 12% 11%
Havells 3.3 4.3 4.9 6.1 6.4 7.7 8.4 9.7 11.5 8.1 17% 17%
Orient 4.4 6.1 6.8 7.8 8.6 9.6 9.8 10.5 11.4 7.0 13% 8%
Bajaj Electricals 3.8 5.1 5.5 6.1 6.2 6.5 6.4 5.9 5.6 1.8 5% -7%
V-Guard 0.3 0.5 0.6 0.8 1.0 1.4 1.8 2.0 2.3 2.0 31% 14%
Polycab NA NA NA NA NA NA NA 1.4 1.9 NA NA NA
Source: Company, MCA, JM Financial
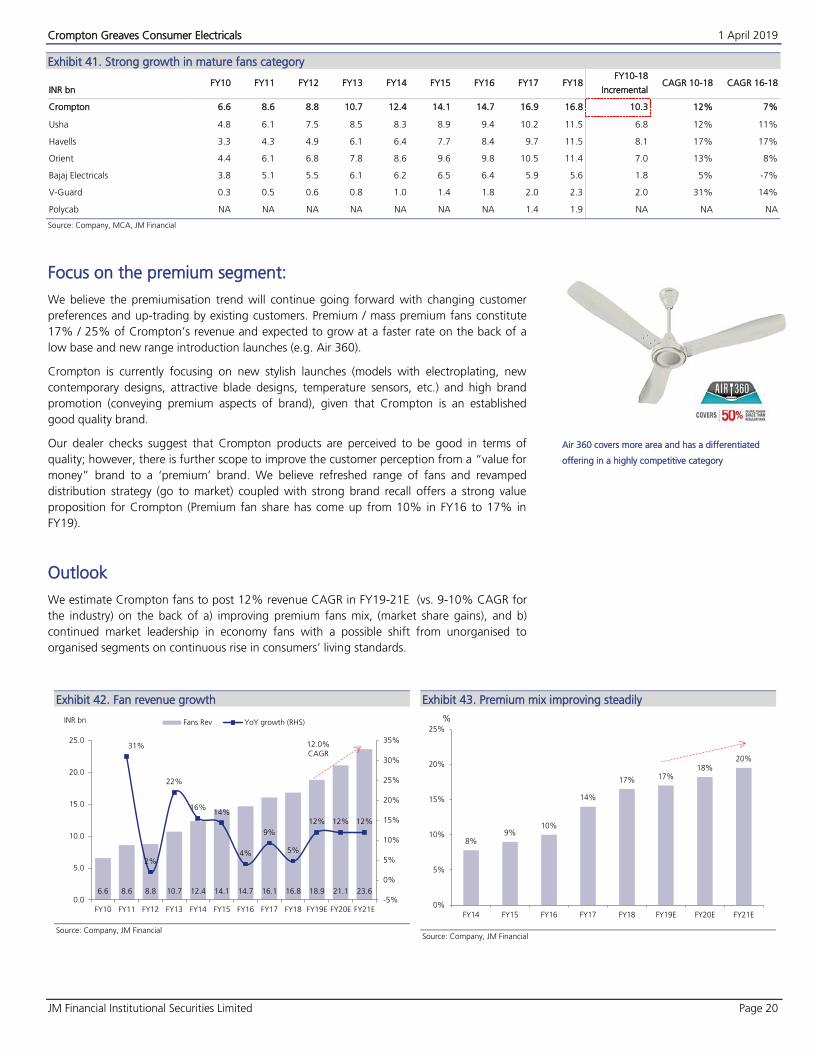
Focus on the premium segment:
We believe the premiumisation trend will continue going forward with changing customer
preferences and up-trading by existing customers. Premium / mass premium fans constitute
17% / 25% of Crompton’s revenue and expected to grow at a faster rate on the back of a
low base and new range introduction launches (e.g. Air 360).
Crompton is currently focusing on new stylish launches (models with electroplating, new
contemporary designs, attractive blade designs, temperature sensors, etc.) and high brand
promotion (conveying premium aspects of brand), given that Crompton is an established
good quality brand.
Our dealer checks suggest that Crompton products are perceived to be good in terms of
quality; however, there is further scope to improve the customer perception from a “value for
money” brand to a ‘premium’ brand. We believe refreshed range of fans and revamped
distribution strategy (go to market) coupled with strong brand recall offers a strong value
proposition for Crompton (Premium fan share has come up from 10% in FY16 to 17% in
FY19).
Outlook
We estimate Crompton fans to post 12% revenue CAGR in FY19-21E (vs. 9-10% CAGR for
the industry) on the back of a) improving premium fans mix, (market share gains), and b)
continued market leadership in economy fans with a possible shift from unorganised to
organised segments on continuous rise in consumers’ living standards.
Fan revenue growth Exhibit 42.
Source: Company, JM Financial
Premium mix improving steadily Exhibit 43.
Source: Company, JM Financial
6.6 8.6 8.8 10.7 12.4 14.1 14.7 16.1 16.8 18.9 21.1 23.6
31%
2%
22%
16%14%
4%
9%
5%
12% 12% 12%
-5%
0%
5%
10%
15%
20%
25%
30%
35%
0.0
5.0
10.0
15.0
20.0
25.0
FY10 FY11 FY12 FY13 FY14 FY15 FY16 FY17 FY18 FY19E FY20E FY21E
INR bn Fans Rev YoY growth (RHS)
12.0%CAGR
8%9%
10%
14%
17% 17%18%
20%
0%
5%
10%
15%
20%
25%
FY14 FY15 FY16 FY17 FY18 FY19E FY20E FY21E
%
Air 360 covers more area and has a differentiated
offering in a highly competitive category
Crompton Greaves Consumer Electricals 1 April 2019
JM Financial Institutional Securities Limited Page 21
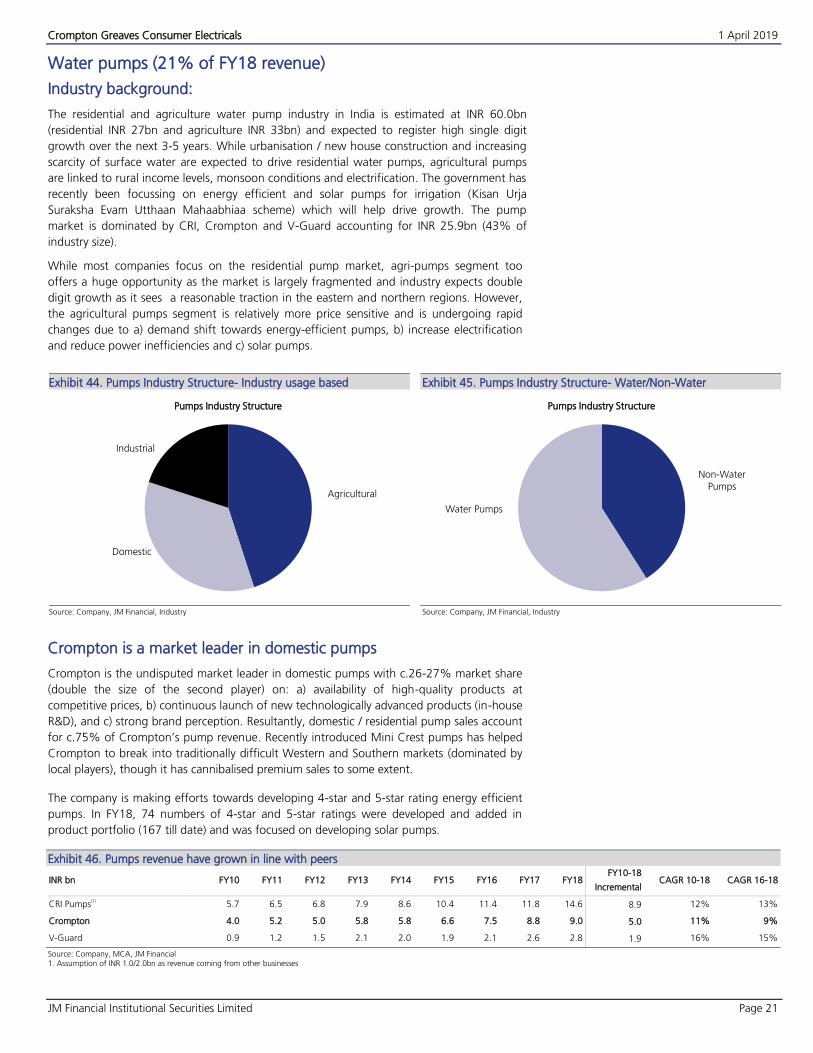
Water pumps (21% of FY18 revenue)
Industry background:
The residential and agriculture water pump industry in India is estimated at INR 60.0bn
(residential INR 27bn and agriculture INR 33bn) and expected to register high single digit
growth over the next 3-5 years. While urbanisation / new house construction and increasing
scarcity of surface water are expected to drive residential water pumps, agricultural pumps
are linked to rural income levels, monsoon conditions and electrification. The government has
recently been focussing on energy efficient and solar pumps for irrigation (Kisan Urja
Suraksha Evam Utthaan Mahaabhiaa scheme) which will help drive growth. The pump
market is dominated by CRI, Crompton and V-Guard accounting for INR 25.9bn (43% of
industry size).
While most companies focus on the residential pump market, agri-pumps segment too
offers a huge opportunity as the market is largely fragmented and industry expects double
digit growth as it sees a reasonable traction in the eastern and northern regions. However,
the agricultural pumps segment is relatively more price sensitive and is undergoing rapid
changes due to a) demand shift towards energy-efficient pumps, b) increase electrification
and reduce power inefficiencies and c) solar pumps.
Pumps Industry Structure- Industry usage based Exhibit 44.
Source: Company, JM Financial, Industry
Pumps Industry Structure- Water/Non-Water Exhibit 45.
Source: Company, JM Financial, Industry
Crompton is a market leader in domestic pumps
Crompton is the undisputed market leader in domestic pumps with c.26-27% market share
(double the size of the second player) on: a) availability of high-quality products at
competitive prices, b) continuous launch of new technologically advanced products (in-house
R&D), and c) strong brand perception. Resultantly, domestic / residential pump sales account
for c.75% of Crompton’s pump revenue. Recently introduced Mini Crest pumps has helped
Crompton to break into traditionally difficult Western and Southern markets (dominated by
local players), though it has cannibalised premium sales to some extent.
The company is making efforts towards developing 4-star and 5-star rating energy efficient
pumps. In FY18, 74 numbers of 4-star and 5-star ratings were developed and added in
product portfolio (167 till date) and was focused on developing solar pumps.
Pumps revenue have grown in line with peers Exhibit 46.
INR bn FY10 FY11 FY12 FY13 FY14 FY15 FY16 FY17 FY18 FY10-18
Incremental CAGR 10-18 CAGR 16-18
CRI Pumps(1)
5.7 6.5 6.8 7.9 8.6 10.4 11.4 11.8 14.6 8.9 12% 13%
Crompton 4.0 5.2 5.0 5.8 5.8 6.6 7.5 8.8 9.0 5.0 11% 9%
V-Guard 0.9 1.2 1.5 2.1 2.0 1.9 2.1 2.6 2.8 1.9 16% 15%
Source: Company, MCA, JM Financial 1. Assumption of INR 1.0/2.0bn as revenue coming from other businesses
Agricultural
Domestic
Industrial
Pumps Industry Structure
Non-Water
Pumps
Water Pumps
Pumps Industry Structure
Crompton Greaves Consumer Electricals 1 April 2019
JM Financial Institutional Securities Limited Page 22
We estimate Crompton’s pump revenue to report a CAGR of 12% during FY19-21E on: a)
steady industry growth and continued market leadership in domestic pumps (#1 player with
>c.27% market share), b) sinking ground water levels (c.54% of the groundwater wells
reported decline in water levels over the past seven years and 21 major cities are expected to
run out of groundwater), c) rise in electrification of rural areas (c.100% rural electrification
achieved) with improving power availability due to schemes like Saubhagya, d) expected
growth in the housing sector due to PMAY scheme, and e) shift towards branded products
on a rise in farm income (preference changing to high-quality products vs. low-cost variants).
Pumps segment growth Exhibit 47.
Source: Company, JM Financial
4.0 5.2 5.0 5.8 5.8 6.6 7.5 8.8 9.0 10.4 11.6 13.0
29%
-4%
17%
0%
13%15%
17%
2%
15%
12% 12%
-10%
-5%
0%
5%
10%
15%
20%
25%
30%
35%
0.0
2.0
4.0
6.0
8.0
10.0
12.0
14.0
FY10 FY11 FY12 FY13 FY14 FY15 FY16 FY17 FY18 FY19E FY20E FY21E
INR bn Pumps Rev YoY growth (RHS)
12% CAGR
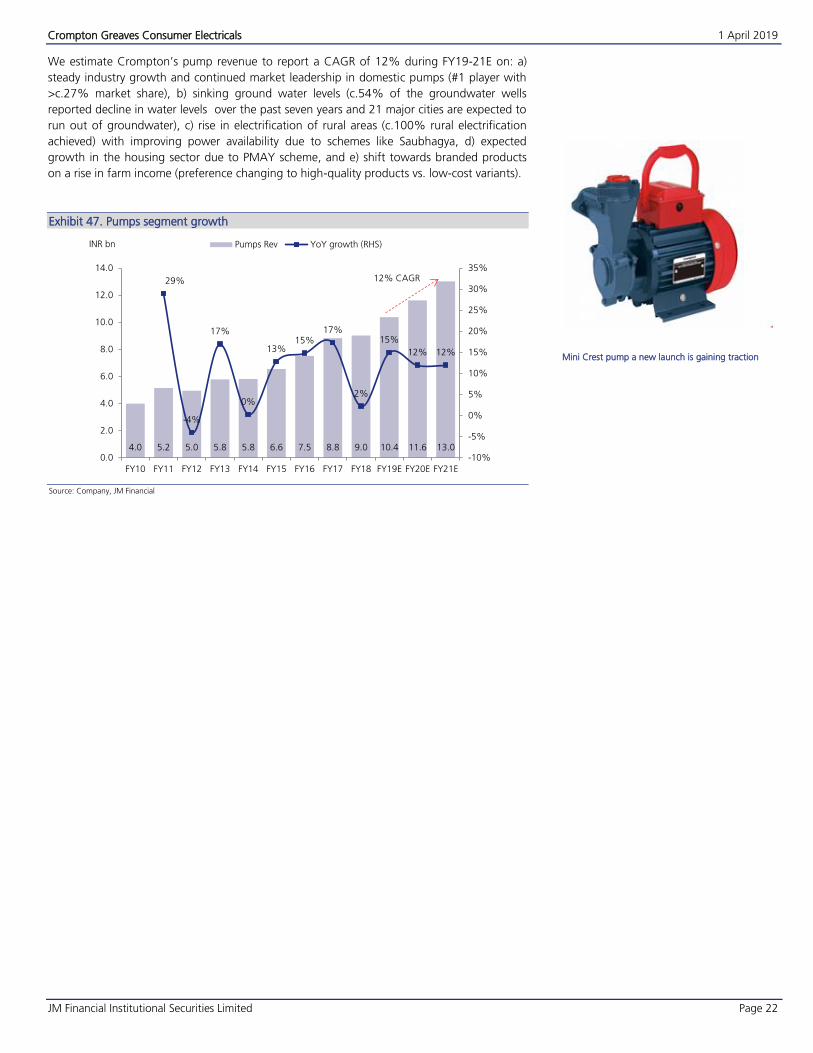
Mini Crest pump a new launch is gaining traction
Crompton Greaves Consumer Electricals 1 April 2019
JM Financial Institutional Securities Limited Page 23
Appliances (6% of FY18 Revenue) – just scratched the surface!
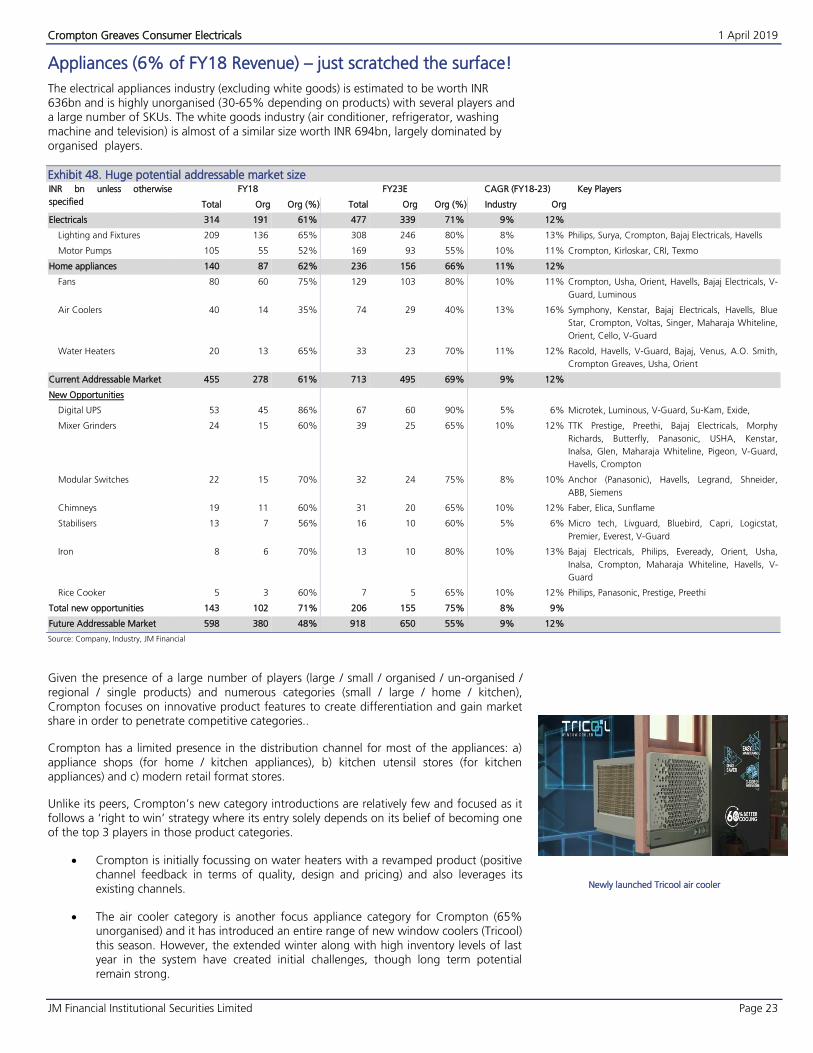
The electrical appliances industry (excluding white goods) is estimated to be worth INR 636bn and is highly unorganised (30-65% depending on products) with several players and a large number of SKUs. The white goods industry (air conditioner, refrigerator, washing machine and television) is almost of a similar size worth INR 694bn, largely dominated by organised players.
Huge potential addressable market size Exhibit 48.INR bn unless otherwise
specified
FY18 FY23E CAGR (FY18-23) Key Players
Total Org Org (%) Total Org Org (%) Industry Org
Electricals 314 191 61% 477 339 71% 9% 12%
Lighting and Fixtures 209 136 65% 308 246 80% 8%
Motor Pumps 105 55 52% 169 93 55% 10%
13% Philips, Surya, Crompton, Bajaj Electricals, Havells
11% Crompton, Kirloskar, CRI, Texmo
Home appliances 140 87 62% 236 156 66% 11% 12%
Fans 80 60 75% 129 103 80% 10% 11% Crompton, Usha, Orient, Havells, Bajaj Electricals, V-
Guard, Luminous
Air Coolers 40 14 35% 74 29 40% 13% 16% Symphony, Kenstar, Bajaj Electricals, Havells, Blue
Star, Crompton, Voltas, Singer, Maharaja Whiteline,
Orient, Cello, V-Guard
Water Heaters 20 13 65% 33 23 70% 11% 12% Racold, Havells, V-Guard, Bajaj, Venus, A.O. Smith,
Crompton Greaves, Usha, Orient
Current Addressable Market 455 278 61% 713 495 69% 9% 12%
New Opportunities
Digital UPS 53 45 86% 67 60 90% 5% 6% Microtek, Luminous, V-Guard, Su-Kam, Exide,
Mixer Grinders 24 15 60% 39 25 65% 10% 12% TTK Prestige, Preethi, Bajaj Electricals, Morphy
Richards, Butterfly, Panasonic, USHA, Kenstar,
Inalsa, Glen, Maharaja Whiteline, Pigeon, V-Guard,
Havells, Crompton
Modular Switches 22 15 70% 32 24 75% 8% 10% Anchor (Panasonic), Havells, Legrand, Shneider,
ABB, Siemens
Chimneys 19 11 60% 31 20 65% 10% 12% Faber, Elica, Sunflame
Stabilisers 13 7 56% 16 10 60% 5% 6% Micro tech, Livguard, Bluebird, Capri, Logicstat,
Premier, Everest, V-Guard
Iron 8 6 70% 13 10 80% 10% 13% Bajaj Electricals, Philips, Eveready, Orient, Usha,
Inalsa, Crompton, Maharaja Whiteline, Havells, V-
Guard
Rice Cooker 5 3 60% 7 5 65% 10% 12% Philips, Panasonic, Prestige, Preethi
Total new opportunities 143 102 71% 206 155 75% 8% 9%
Future Addressable Market 598 380 48% 918 650 55% 9% 12%
Source: Company, Industry, JM Financial
Given the presence of a large number of players (large / small / organised / un-organised / regional / single products) and numerous categories (small / large / home / kitchen), Crompton focuses on innovative product features to create differentiation and gain market share in order to penetrate competitive categories..
Crompton has a limited presence in the distribution channel for most of the appliances: a) appliance shops (for home / kitchen appliances), b) kitchen utensil stores (for kitchen appliances) and c) modern retail format stores.
Unlike its peers, Crompton’s new category introductions are relatively few and focused as it follows a ‘right to win’ strategy where its entry solely depends on its belief of becoming one of the top 3 players in those product categories.
Crompton is initially focussing on water heaters with a revamped product (positivechannel feedback in terms of quality, design and pricing) and also leverages its
existing channels.
The air cooler category is another focus appliance category for Crompton (65%unorganised) and it has introduced an entire range of new window coolers (Tricool)
this season. However, the extended winter along with high inventory levels of lastyear in the system have created initial challenges, though long term potentialremain strong.
Newly launched Tricool air cooler
Crompton Greaves Consumer Electricals 1 April 2019
JM Financial Institutional Securities Limited Page 24
It has identified mixer grinders and small appliances as the focus areas after aircoolers. Except white goods and cables and wires categories, Crompton does notrule out portfolio extension over long term.
However, a bulk of the other small appliances are sold through the consumer appliances / electronics shops while small kitchen appliances are sold through the kitchen utensil stores channel. Going forward, it plans to use the newly launched Tricool air coolers to break into the home electronics category and later a similar strategy will be replicated for mixer grinders.
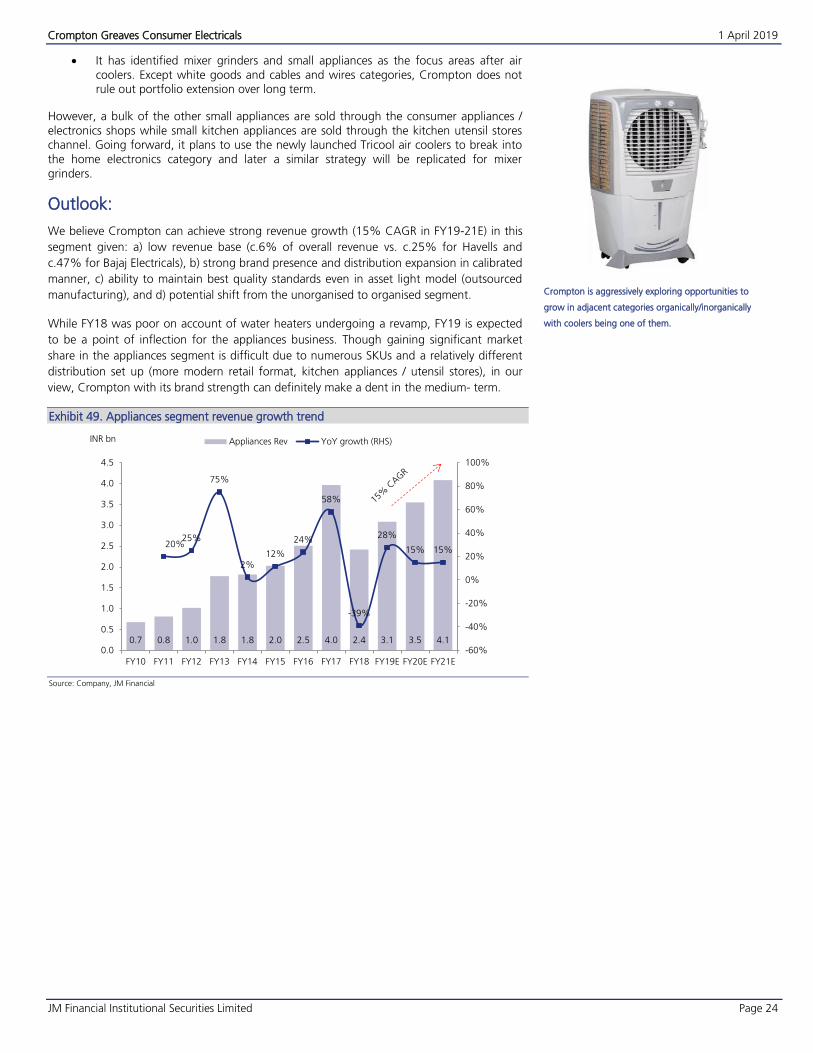
Outlook:
We believe Crompton can achieve strong revenue growth (15% CAGR in FY19-21E) in this
segment given: a) low revenue base (c.6% of overall revenue vs. c.25% for Havells and
c.47% for Bajaj Electricals), b) strong brand presence and distribution expansion in calibrated
manner, c) ability to maintain best quality standards even in asset light model (outsourced
manufacturing), and d) potential shift from the unorganised to organised segment.
While FY18 was poor on account of water heaters undergoing a revamp, FY19 is expected
to be a point of inflection for the appliances business. Though gaining significant market
share in the appliances segment is difficult due to numerous SKUs and a relatively different
distribution set up (more modern retail format, kitchen appliances / utensil stores), in our
view, Crompton with its brand strength can definitely make a dent in the medium- term.
Appliances segment revenue growth trend Exhibit 49.
Source: Company, JM Financial
0.7 0.8 1.0 1.8 1.8 2.0 2.5 4.0 2.4 3.1 3.5 4.1
20%25%
75%
2%12%
24%
58%
-39%
28%
15% 15%
-60%
-40%
-20%
0%
20%
40%
60%
80%
100%
0.0
0.5
1.0
1.5
2.0
2.5
3.0
3.5
4.0
4.5
FY10 FY11 FY12 FY13 FY14 FY15 FY16 FY17 FY18 FY19E FY20E FY21E
INR bn Appliances Rev YoY growth (RHS)
Crompton is aggressively exploring opportunities to
grow in adjacent categories organically/inorganically
with coolers being one of them.
Crompton Greaves Consumer Electricals 1 April 2019
JM Financial Institutional Securities Limited Page 25
Business Analysis #2—Lighting and luminaires:
31% of FY18 Revenue (22% of FY18 EBIT)
Industry background:
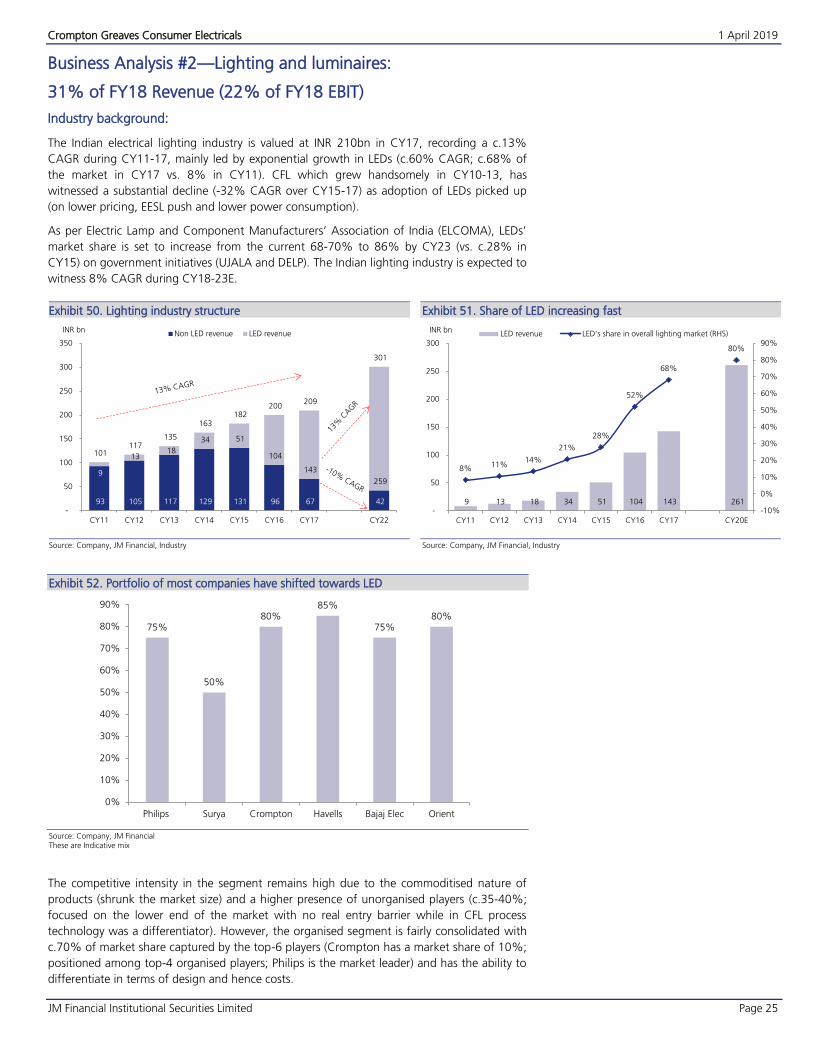
The Indian electrical lighting industry is valued at INR 210bn in CY17, recording a c.13%
CAGR during CY11-17, mainly led by exponential growth in LEDs (c.60% CAGR; c.68% of
the market in CY17 vs. 8% in CY11). CFL which grew handsomely in CY10-13, has
witnessed a substantial decline (-32% CAGR over CY15-17) as adoption of LEDs picked up
(on lower pricing, EESL push and lower power consumption).
As per Electric Lamp and Component Manufacturers’ Association of India (ELCOMA), LEDs’
market share is set to increase from the current 68-70% to 86% by CY23 (vs. c.28% in
CY15) on government initiatives (UJALA and DELP). The Indian lighting industry is expected to
witness 8% CAGR during CY18-23E.
Lighting industry structure Exhibit 50.
Source: Company, JM Financial, Industry
Share of LED increasing fast Exhibit 51.
Source: Company, JM Financial, Industry
Portfolio of most companies have shifted towards LED Exhibit 52.
Source: Company, JM Financial These are Indicative mix
The competitive intensity in the segment remains high due to the commoditised nature of
products (shrunk the market size) and a higher presence of unorganised players (c.35-40%;
focused on the lower end of the market with no real entry barrier while in CFL process
technology was a differentiator). However, the organised segment is fairly consolidated with
c.70% of market share captured by the top-6 players (Crompton has a market share of 10%;
positioned among top-4 organised players; Philips is the market leader) and has the ability to
differentiate in terms of design and hence costs.
93 105 117 129 131 96 67
-5%
42
9
13 18
34 51
104
143
259
101 117
135
163 182
200 209
301
-
50
100
150
200
250
300
350
CY11 CY12 CY13 CY14 CY15 CY16 CY17 CY22
Non LED revenue LED revenueINR bn
9 13 18 34 51 104 143 261
8% 11%14%
21%
28%
52%
68%
80%
-10%
0%
10%
20%
30%
40%
50%
60%
70%
80%
90%
-
50
100
150
200
250
300
CY11 CY12 CY13 CY14 CY15 CY16 CY17 CY20E
LED revenue LED's share in overall lighting market (RHS)INR bn
75%
50%
80%85%
75%80%
0%
10%
20%
30%
40%
50%
60%
70%
80%
90%
Philips Surya Crompton Havells Bajaj Elec Orient
Crompton Greaves Consumer Electricals 1 April 2019
JM Financial Institutional Securities Limited Page 26
There is pricing pressure in the B2B segment as well, though there is not much difference in
the gross margin between B2B and B2C (B2B:B2C mix is 50:50 for Crompton). A lot of value
engineering in the industry is also leading to cost reduction.
Lighting Industry - companies have recorded strong revenue growth in past Exhibit 53.
Lighting Revenue (INR bn) FY10 FY11 FY12 FY13 FY14 FY15 FY16 FY17 FY18 FY10-18
Incremental CAGR 10-18 CAGR 16-18
Philips India 10.4 13.6 19.5 18.7 32.4 34.5 33.0 33.3 35.1 24.7 16% 3%
Surya 5.6 7.5 7.7 9.1 10.8 11.5 13.7 13.5 14.0 8.4 12% 1%
Crompton 5.0 5.8 6.8 7.6 8.9 9.6 11.1 11.3 12.8 7.8 12% 7%
Havells 3.5 4.4 5.5 6.7 7.2 7.4 7.9 9.7 11.6 8.1 16% 21%
Wipro 1.6 2.1 5.1 5.4 5.8 5.9 7.0 8.7 10.1 8.5 26% 20%
Bajaj Electricals 5.4 6.3 7.6 8.6 9.5 9.0 10.5 8.7 8.0 2.6 5% -13%
Orient 0.6 0.6 1.0 1.3 1.9 2.2 3.1 2.9 3.9 3.3 27% 12%
Jaguar NA NA NA NA NA NA NA 1.0 2.0 NA NA NA
Usha NA NA NA NA NA NA NA 0.1 0.2 NA NA NA
Source: Company, JM Financial includes substantial export revenues for Philips and Wipro
Outlook
We believe Crompton’s lighting revenue will report a CAGR of 11% during FY19-21E mainly
due to: a) increasing demand for LED fixtures with a rise in disposable income, b) abatement
of price erosion on the bulb side (25% of LED revenue) c) rise in rural electrification and
improving power availability across the country coupled with infrastructure developments.
However, this is partially offset by: a) the rapid decline in CFL products’ revenue (c.17% of
lighting revenue), and b) downward pricing pressures in LED battern segment due to fierce
competition and scale benefits. More importantly, now with the management focus on
superior design and cost optimisation. We believe, Crompton margins will inch upwards
towards double digit by FY20E. As c.80% of its portfolio is already LED, the effect of price
decline in CFL will also reduce.
Crompton - Lighting revenue growth trend Exhibit 54.
Source: Company, JM Financial
Lighting segment margins Exhibit 55.
Source: Company, JM Financial
5.0 5.8 6.8 7.6 8.9 9.6 11.1 11.3 12.8 12.7 14.0 15.8
16%17%
13%
17%
7%
16%
2%
13%
0%
10%
13%
-5%
0%
5%
10%
15%
20%
0.0
2.0
4.0
6.0
8.0
10.0
12.0
14.0
16.0
18.0
FY10 FY11 FY12 FY13 FY14 FY15 FY16 FY17 FY18 FY19E FY20E FY21E
INR bn Lighting Rev YoY growth (RHS)
11% CAGR
1.0 1.5 1.0 1.3 1.6
8.8%
11.5%
7.9%
9.5%
10.0%
5.0%
6.0%
7.0%
8.0%
9.0%
10.0%
11.0%
12.0%
0.0
0.2
0.4
0.6
0.8
1.0
1.2
1.4
1.6
1.8
FY17 FY18 FY19E FY20E FY21E
Lighting EBIT Lighting Margins (RHS)
Newly launched anti-bacterial bulb – a unique offering
Crompton Greaves Consumer Electricals 1 April 2019
JM Financial Institutional Securities Limited Page 27
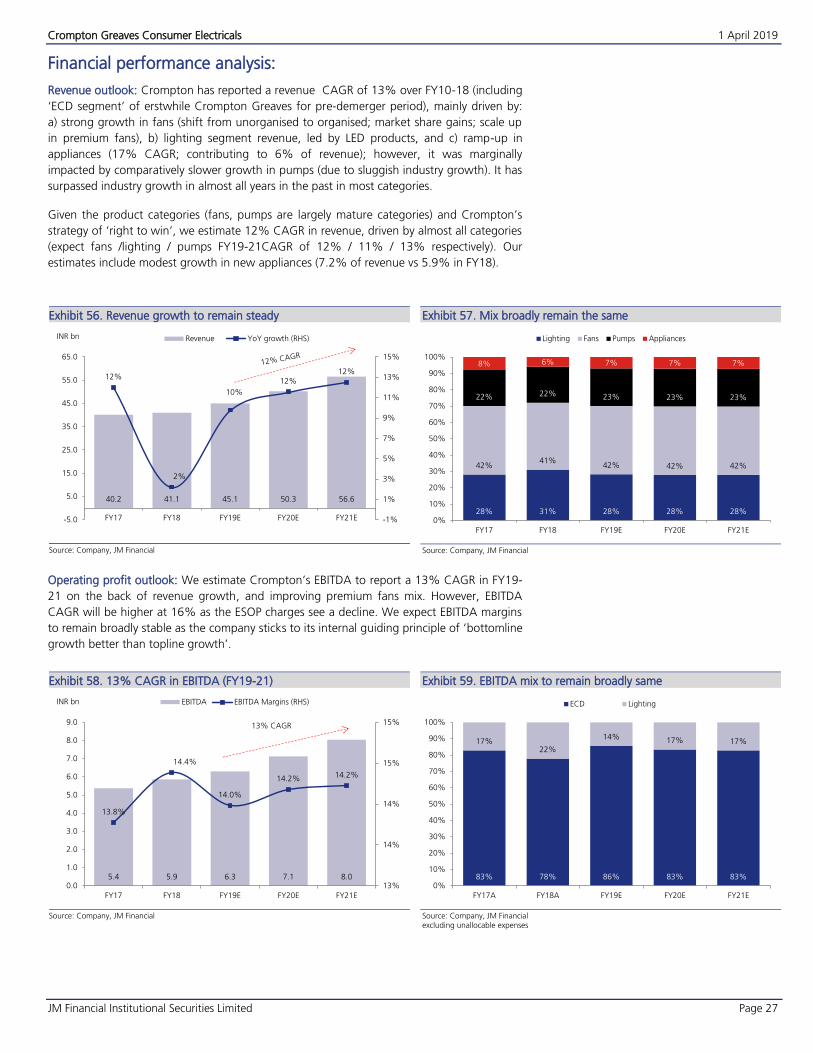
Financial performance analysis:
Revenue outlook: Crompton has reported a revenue CAGR of 13% over FY10-18 (including
‘ECD segment’ of erstwhile Crompton Greaves for pre-demerger period), mainly driven by:
a) strong growth in fans (shift from unorganised to organised; market share gains; scale up
in premium fans), b) lighting segment revenue, led by LED products, and c) ramp-up in
appliances (17% CAGR; contributing to 6% of revenue); however, it was marginally
impacted by comparatively slower growth in pumps (due to sluggish industry growth). It has
surpassed industry growth in almost all years in the past in most categories.
Given the product categories (fans, pumps are largely mature categories) and Crompton’s
strategy of ‘right to win’, we estimate 12% CAGR in revenue, driven by almost all categories
(expect fans /lighting / pumps FY19-21CAGR of 12% / 11% / 13% respectively). Our
estimates include modest growth in new appliances (7.2% of revenue vs 5.9% in FY18).
Revenue growth to remain steady Exhibit 56.
Source: Company, JM Financial
Mix broadly remain the same Exhibit 57.
Source: Company, JM Financial
Operating profit outlook: We estimate Crompton’s EBITDA to report a 13% CAGR in FY19-
21 on the back of revenue growth, and improving premium fans mix. However, EBITDA
CAGR will be higher at 16% as the ESOP charges see a decline. We expect EBITDA margins
to remain broadly stable as the company sticks to its internal guiding principle of ‘bottomline
growth better than topline growth’.
13% CAGR in EBITDA (FY19-21) Exhibit 58.
Source: Company, JM Financial
EBITDA mix to remain broadly same Exhibit 59.
Source: Company, JM Financial excluding unallocable expenses
40.2 41.1 45.1 50.3 56.6
12%
2%
10%
12%12%
-1%
1%
3%
5%
7%
9%
11%
13%
15%
-5.0
5.0
15.0
25.0
35.0
45.0
55.0
65.0
FY17 FY18 FY19E FY20E FY21E
INR bn Revenue YoY growth (RHS)
28% 31% 28% 28% 28%
42%41%
42% 42% 42%
22% 22% 23% 23% 23%
8% 6% 7% 7% 7%
0%
10%
20%
30%
40%
50%
60%
70%
80%
90%
100%
FY17 FY18 FY19E FY20E FY21E
Lighting Fans Pumps Appliances
5.4 5.9 6.3 7.1 8.0
13.8%
14.4%
14.0%
14.2% 14.2%
13%
14%
14%
15%
15%
0.0
1.0
2.0
3.0
4.0
5.0
6.0
7.0
8.0
9.0
FY17 FY18 FY19E FY20E FY21E
INR bn EBITDA EBITDA Margins (RHS)
13% CAGR
83% 78% 86% 83% 83%
17%22%
14% 17% 17%
0%
10%
20%
30%
40%
50%
60%
70%
80%
90%
100%
FY17A FY18A FY19E FY20E FY21E
ECD Lighting
Crompton Greaves Consumer Electricals 1 April 2019
JM Financial Institutional Securities Limited Page 28
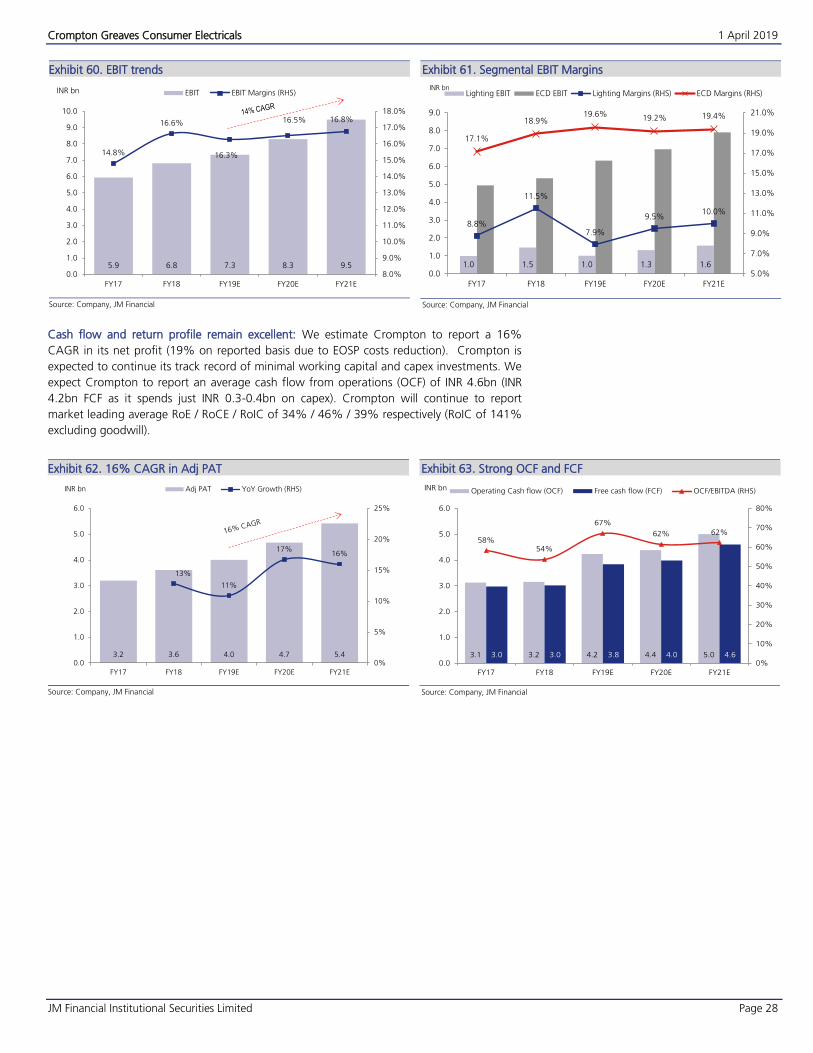
EBIT trends Exhibit 60.
Source: Company, JM Financial
Segmental EBIT Margins Exhibit 61.
Source: Company, JM Financial
Cash flow and return profile remain excellent: We estimate Crompton to report a 16%
CAGR in its net profit (19% on reported basis due to EOSP costs reduction). Crompton is
expected to continue its track record of minimal working capital and capex investments. We
expect Crompton to report an average cash flow from operations (OCF) of INR 4.6bn (INR
4.2bn FCF as it spends just INR 0.3-0.4bn on capex). Crompton will continue to report
market leading average RoE / RoCE / RoIC of 34% / 46% / 39% respectively (RoIC of 141%
excluding goodwill).
5.9 6.8 7.3 8.3 9.5
14.8%
16.6%
16.3%
16.5% 16.8%
8.0%
9.0%
10.0%
11.0%
12.0%
13.0%
14.0%
15.0%
16.0%
17.0%
18.0%
0.0
1.0
2.0
3.0
4.0
5.0
6.0
7.0
8.0
9.0
10.0
FY17 FY18 FY19E FY20E FY21E
INR bn EBIT EBIT Margins (RHS)
1.0 1.5 1.0 1.3 1.6
8.8%
11.5%
7.9%
9.5%10.0%
17.1%
18.9%19.6% 19.2% 19.4%
5.0%
7.0%
9.0%
11.0%
13.0%
15.0%
17.0%
19.0%
21.0%
0.0
1.0
2.0
3.0
4.0
5.0
6.0
7.0
8.0
9.0
FY17 FY18 FY19E FY20E FY21E
Lighting EBIT ECD EBIT Lighting Margins (RHS) ECD Margins (RHS)INR bn
16% CAGR in Adj PAT Exhibit 62.
Source: Company, JM Financial
Strong OCF and FCF Exhibit 63.
Source: Company, JM Financial
3.2 3.6 4.0 4.7 5.4
13%
11%
17%16%
0%
5%
10%
15%
20%
25%
0.0
1.0
2.0
3.0
4.0
5.0
6.0
FY17 FY18 FY19E FY20E FY21E
INR bn Adj PAT YoY Growth (RHS)
3.1 3.2 4.2 4.4 5.03.0 3.0 3.8 4.0 4.6
58%54%
67%
62% 62%
0%
10%
20%
30%
40%
50%
60%
70%
80%
0.0
1.0
2.0
3.0
4.0
5.0
6.0
FY17 FY18 FY19E FY20E FY21E
INR bn Operating Cash flow (OCF) Free cash flow (FCF) OCF/EBITDA (RHS)
Crompton Greaves Consumer Electricals 1 April 2019
JM Financial Institutional Securities Limited Page 29
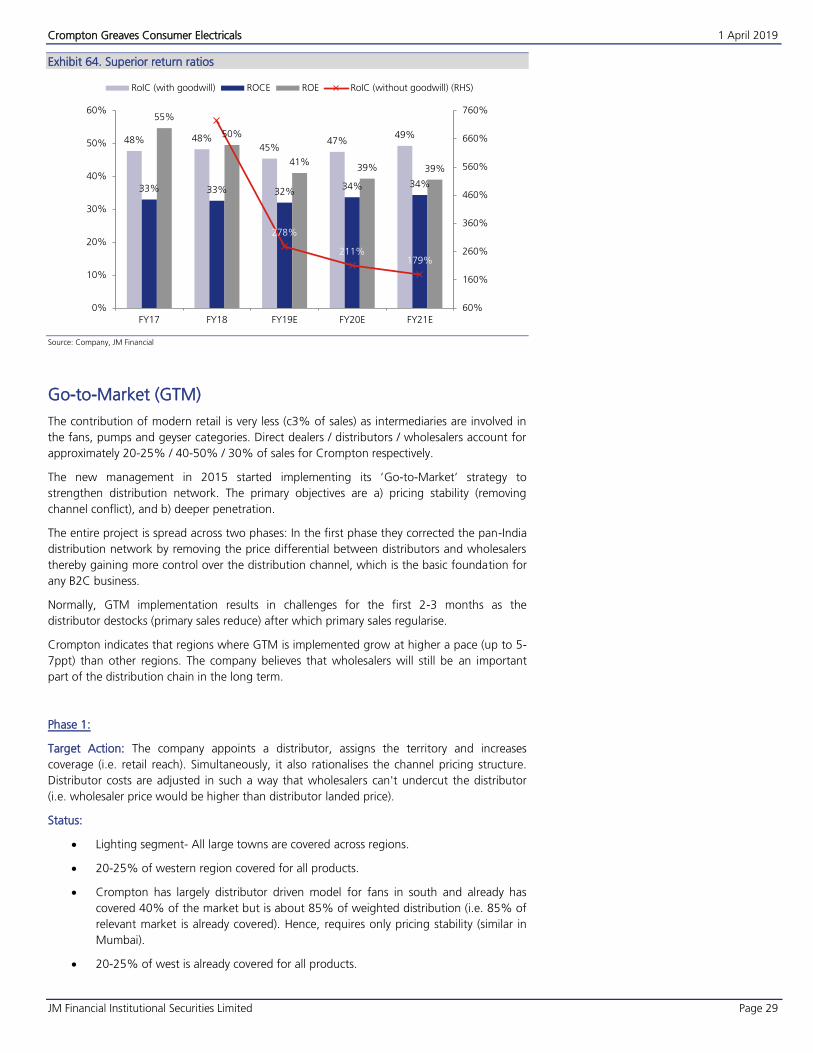
Superior return ratios Exhibit 64.
Source: Company, JM Financial
Go-to-Market (GTM)
The contribution of modern retail is very less (c3% of sales) as intermediaries are involved in
the fans, pumps and geyser categories. Direct dealers / distributors / wholesalers account for
approximately 20-25% / 40-50% / 30% of sales for Crompton respectively.
The new management in 2015 started implementing its ‘Go-to-Market’ strategy to
strengthen distribution network. The primary objectives are a) pricing stability (removing
channel conflict), and b) deeper penetration.
The entire project is spread across two phases: In the first phase they corrected the pan-India
distribution network by removing the price differential between distributors and wholesalers
thereby gaining more control over the distribution channel, which is the basic foundation for
any B2C business.
Normally, GTM implementation results in challenges for the first 2-3 months as the
distributor destocks (primary sales reduce) after which primary sales regularise.
Crompton indicates that regions where GTM is implemented grow at higher a pace (up to 5-
7ppt) than other regions. The company believes that wholesalers will still be an important
part of the distribution chain in the long term.
Phase 1:
Target Action: The company appoints a distributor, assigns the territory and increases
coverage (i.e. retail reach). Simultaneously, it also rationalises the channel pricing structure.
Distributor costs are adjusted in such a way that wholesalers can't undercut the distributor
(i.e. wholesaler price would be higher than distributor landed price).
Status:
Lighting segment- All large towns are covered across regions.
20-25% of western region covered for all products.
Crompton has largely distributor driven model for fans in south and already has
covered 40% of the market but is about 85% of weighted distribution (i.e. 85% of
relevant market is already covered). Hence, requires only pricing stability (similar in
Mumbai).
20-25% of west is already covered for all products.
48% 48%45%
47%49%
33% 33% 32%34% 34%
55%
50%
41%39% 39%
724%
278%
211%179%
60%
160%
260%
360%
460%
560%
660%
760%
0%
10%
20%
30%
40%
50%
60%
FY17 FY18 FY19E FY20E FY21E
RoIC (with goodwill) ROCE ROE RoIC (without goodwill) (RHS)
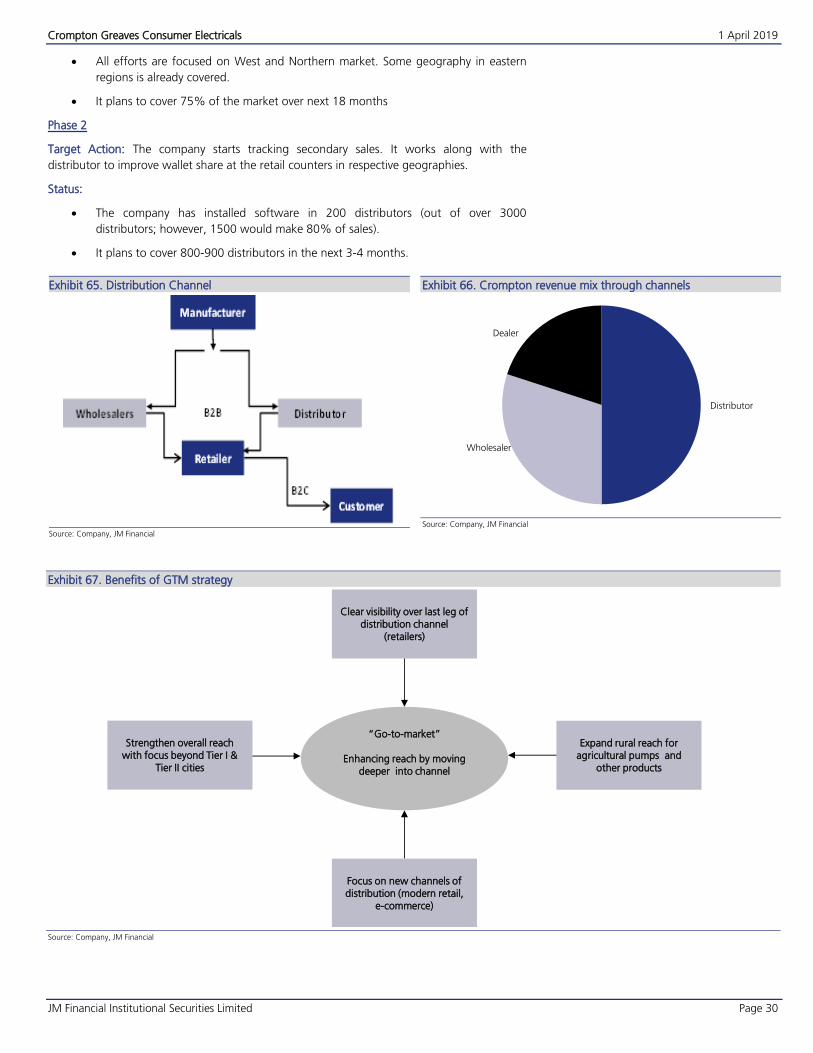
Crompton Greaves Consumer Electricals 1 April 2019
JM Financial Institutional Securities Limited Page 30
All efforts are focused on West and Northern market. Some geography in eastern
regions is already covered.
It plans to cover 75% of the market over next 18 months
Phase 2
Target Action: The company starts tracking secondary sales. It works along with the
distributor to improve wallet share at the retail counters in respective geographies.
Status:
The company has installed software in 200 distributors (out of over 3000
distributors; however, 1500 would make 80% of sales).
It plans to cover 800-900 distributors in the next 3-4 months.
Distribution Channel Exhibit 65.
Source: Company, JM Financial
Crompton revenue mix through channels Exhibit 66.
Source: Company, JM Financial
Benefits of GTM strategy Exhibit 67.
Source: Company, JM Financial
Distributor
Wholesaler
Dealer
Strengthen overall reach with focus beyond Tier I &
Tier II cities
Expand rural reach for agricultural pumps and
other products
Clear visibility over last leg of distribution channel
(retailers)
Focus on new channels of distribution (modern retail,
e-commerce)
“Go-to-market”
Enhancing reach by moving deeper into channel
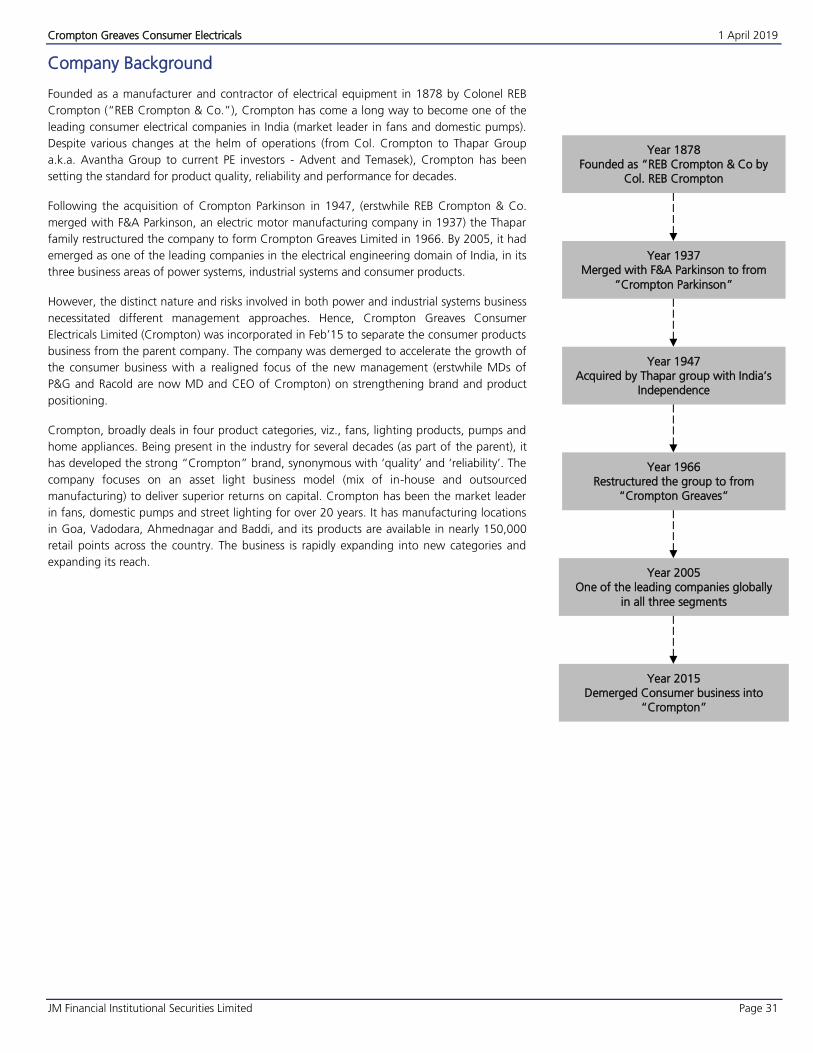
Crompton Greaves Consumer Electricals 1 April 2019
JM Financial Institutional Securities Limited Page 31
Company Background
Founded as a manufacturer and contractor of electrical equipment in 1878 by Colonel REB
Crompton (“REB Crompton & Co.”), Crompton has come a long way to become one of the
leading consumer electrical companies in India (market leader in fans and domestic pumps).
Despite various changes at the helm of operations (from Col. Crompton to Thapar Group
a.k.a. Avantha Group to current PE investors - Advent and Temasek), Crompton has been
setting the standard for product quality, reliability and performance for decades.
Following the acquisition of Crompton Parkinson in 1947, (erstwhile REB Crompton & Co.
merged with F&A Parkinson, an electric motor manufacturing company in 1937) the Thapar
family restructured the company to form Crompton Greaves Limited in 1966. By 2005, it had
emerged as one of the leading companies in the electrical engineering domain of India, in its
three business areas of power systems, industrial systems and consumer products.
However, the distinct nature and risks involved in both power and industrial systems business
necessitated different management approaches. Hence, Crompton Greaves Consumer
Electricals Limited (Crompton) was incorporated in Feb’15 to separate the consumer products
business from the parent company. The company was demerged to accelerate the growth of
the consumer business with a realigned focus of the new management (erstwhile MDs of
P&G and Racold are now MD and CEO of Crompton) on strengthening brand and product
positioning.
Crompton, broadly deals in four product categories, viz., fans, lighting products, pumps and
home appliances. Being present in the industry for several decades (as part of the parent), it
has developed the strong “Crompton” brand, synonymous with ‘quality’ and ‘reliability’. The
company focuses on an asset light business model (mix of in-house and outsourced
manufacturing) to deliver superior returns on capital. Crompton has been the market leader
in fans, domestic pumps and street lighting for over 20 years. It has manufacturing locations
in Goa, Vadodara, Ahmednagar and Baddi, and its products are available in nearly 150,000
retail points across the country. The business is rapidly expanding into new categories and
expanding its reach.
Year 1878 Founded as “REB Crompton & Co by
Col. REB Crompton
Year 1937 Merged with F&A Parkinson to from
“Crompton Parkinson”
Year 1947
Acquired by Thapar group with India’s
Independence
Year 1966 Restructured the group to from
“Crompton Greaves”
Year 2005
One of the leading companies globally
in all three segments
Year 2015 Demerged Consumer business into
“Crompton”
Crompton Greaves Consumer Electricals 1 April 2019
JM Financial Institutional Securities Limited Page 32
Company History
Key management and directors Exhibit 68.
Name Designation Brief description
Shantanu Khosla Managing Director
Joined the Company in Jan’16, Prior to Crompton, served as the MD & CEO of Procter &
Gamble India from Jul’02 to Jun’15.
Holds a Bachelor of technology in mechanical Engineering from IIT, Mumbai. Has also
completed his MBA from IIM, Calcutta.
Mathew Job Chief Executive Officer
Joined the company in Jan’16. Prior to Crompton, held several key positions with Philips
Electronics India Ltd from Jun’94 to Oct’09.
Served as VP and MD of Grohe India Pvt Ltd from Nov’09 till Jan’12, and later as MD of
Racold (Ariston) Thermo Ltd till Sep’15.
Holds a Bachelor in Technology (Electrical & Electronics) and is an alumnus of the IIM,
Calcutta.
Sandeep Batra Chief Financial Officer
Has served as CFO of ICI India and Pidilite Industries before joining Crompton.
A chartered accountant by profession with over 25 years of experience
An alumnus from St. Xavier’s College, Kolkata, and a Company Secretary by profession.
Shweta Jalan
(MD, Advent India)
Non-Executive
Additional Director at
Crompton
Serves as the MD of Advent India PE Advisors Private Limited having worked at ICICI
Venture for almost a decade.
Has a range of experience across various sectors, including healthcare, consumer and
IT/BPO.
Sahil Dalal
(Director, Advent India)
Non-Executive
Additional Director at
Crompton
Serves as director at Advent India and Advent International Corporation. After joining
Advent in 2009, focused on the industrials and technology, media and telecom sectors.
Prior to business school, served as an associate with JLL Partners, a New York-based
private equity firm, focusing on buyout and growth equity transactions.
Promeet Ghosh
(MD, Temasek India)
Non-Executive
Additional Director at
Crompton
Currently serving as MD at Temasek India. Prior to joining Temasek in 2012, has served
as a partner with BofA providing M&A and advisory services along with bearing the
responsibility of maintaining senior relationships with large conglomerates.
Source: Company, JM Financial
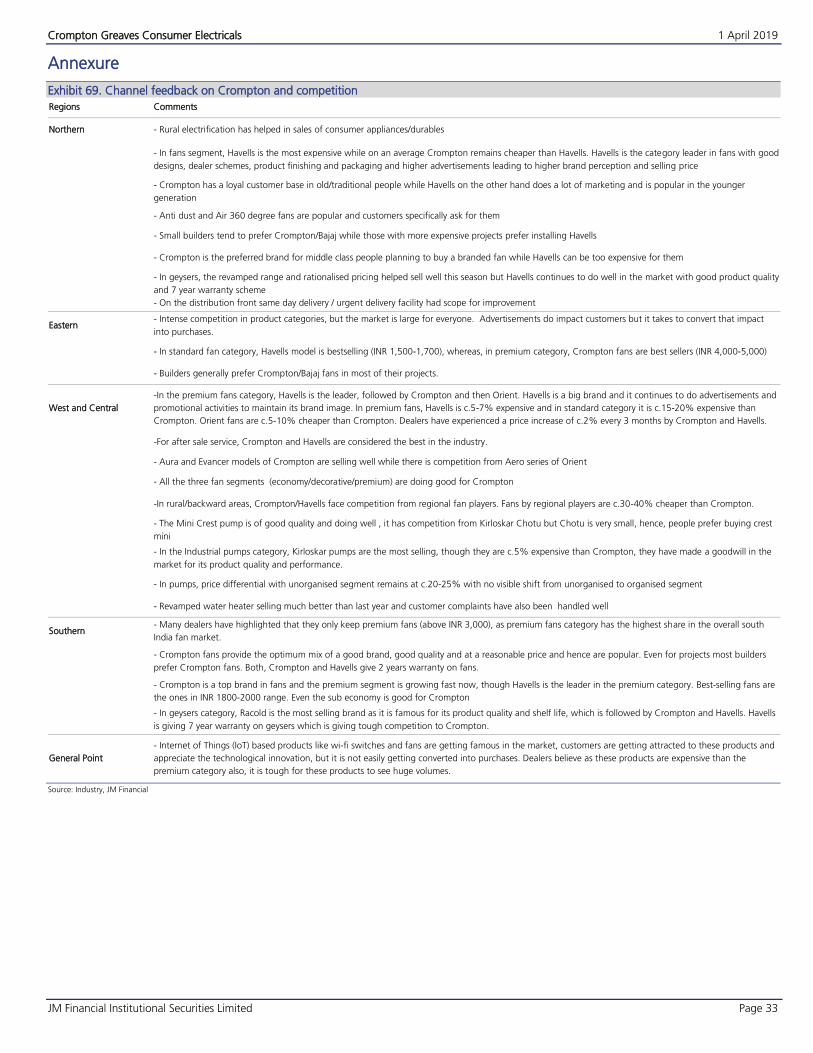
Crompton Greaves Consumer Electricals 1 April 2019
JM Financial Institutional Securities Limited Page 33
Annexure
Channel feedback on Crompton and competition Exhibit 69.
Regions Comments
Northern - Rural electrification has helped in sales of consumer appliances/durables
- In fans segment, Havells is the most expensive while on an average Crompton remains cheaper than Havells. Havells is the category leader in fans with good
designs, dealer schemes, product finishing and packaging and higher advertisements leading to higher brand perception and selling price
- Crompton has a loyal customer base in old/traditional people while Havells on the other hand does a lot of marketing and is popular in the younger
generation
- Anti dust and Air 360 degree fans are popular and customers specifically ask for them
- Small builders tend to prefer Crompton/Bajaj while those with more expensive projects prefer installing Havells
- Crompton is the preferred brand for middle class people planning to buy a branded fan while Havells can be too expensive for them
- In geysers, the revamped range and rationalised pricing helped sell well this season but Havells continues to do well in the market with good product quality
and 7 year warranty scheme
- On the distribution front same day delivery / urgent delivery facility had scope for improvement
Eastern - Intense competition in product categories, but the market is large for everyone. Advertisements do impact customers but it takes to convert that impact
into purchases.
- In standard fan category, Havells model is bestselling (INR 1,500-1,700), whereas, in premium category, Crompton fans are best sellers (INR 4,000-5,000)
- Builders generally prefer Crompton/Bajaj fans in most of their projects.
West and Central
-In the premium fans category, Havells is the leader, followed by Crompton and then Orient. Havells is a big brand and it continues to do advertisements and
promotional activities to maintain its brand image. In premium fans, Havells is c.5-7% expensive and in standard category it is c.15-20% expensive than
Crompton. Orient fans are c.5-10% cheaper than Crompton. Dealers have experienced a price increase of c.2% every 3 months by Crompton and Havells.
-For after sale service, Crompton and Havells are considered the best in the industry.
- Aura and Evancer models of Crompton are selling well while there is competition from Aero series of Orient
- All the three fan segments (economy/decorative/premium) are doing good for Crompton
-In rural/backward areas, Crompton/Havells face competition from regional fan players. Fans by regional players are c.30-40% cheaper than Crompton.
- The Mini Crest pump is of good quality and doing well , it has competition from Kirloskar Chotu but Chotu is very small, hence, people prefer buying crest
mini
- In the Industrial pumps category, Kirloskar pumps are the most selling, though they are c.5% expensive than Crompton, they have made a goodwill in the
market for its product quality and performance.
- In pumps, price differential with unorganised segment remains at c.20-25% with no visible shift from unorganised to organised segment
- Revamped water heater selling much better than last year and customer complaints have also been handled well
Southern - Many dealers have highlighted that they only keep premium fans (above INR 3,000), as premium fans category has the highest share in the overall south
India fan market.
- Crompton fans provide the optimum mix of a good brand, good quality and at a reasonable price and hence are popular. Even for projects most builders
prefer Crompton fans. Both, Crompton and Havells give 2 years warranty on fans.
- Crompton is a top brand in fans and the premium segment is growing fast now, though Havells is the leader in the premium category. Best-selling fans are
the ones in INR 1800-2000 range. Even the sub economy is good for Crompton
- In geysers category, Racold is the most selling brand as it is famous for its product quality and shelf life, which is followed by Crompton and Havells. Havells
is giving 7 year warranty on geysers which is giving tough competition to Crompton.
General Point
- Internet of Things (IoT) based products like wi-fi switches and fans are getting famous in the market, customers are getting attracted to these products and
appreciate the technological innovation, but it is not easily getting converted into purchases. Dealers believe as these products are expensive than the
premium category also, it is tough for these products to see huge volumes.
Source: Industry, JM Financial
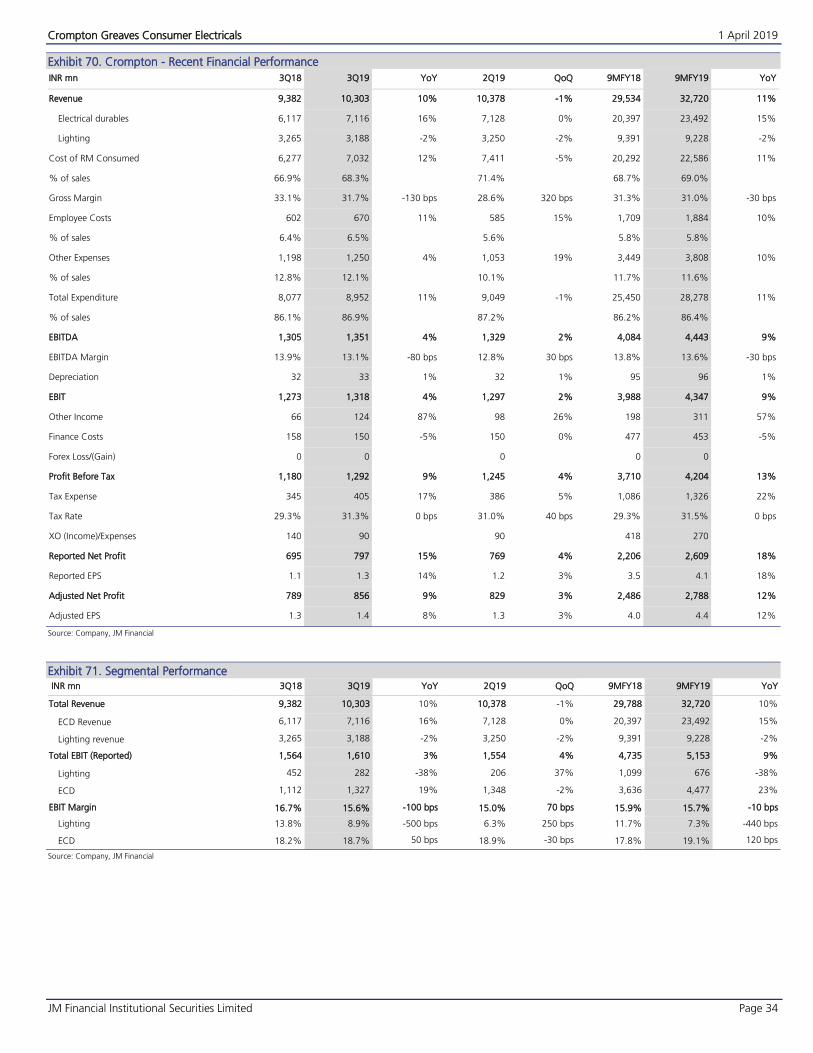
Crompton Greaves Consumer Electricals 1 April 2019
JM Financial Institutional Securities Limited Page 34
Crompton - Recent Financial Performance Exhibit 70.
INR mn 3Q18 3Q19 YoY 2Q19 QoQ 9MFY18 9MFY19 YoY
Revenue 9,382 10,303 10% 10,378 -1% 29,534 32,720 11%
Electrical durables 6,117 7,116 16% 7,128 0% 20,397 23,492 15%
Lighting 3,265 3,188 -2% 3,250 -2% 9,391 9,228 -2%
Cost of RM Consumed 6,277 7,032 12% 7,411 -5% 20,292 22,586 11%
% of sales 66.9% 68.3% 71.4% 68.7% 69.0%
Gross Margin 33.1% 31.7% -130 bps 28.6% 320 bps 31.3% 31.0% -30 bps
Employee Costs 602 670 11% 585 15% 1,709 1,884 10%
% of sales 6.4% 6.5% 5.6% 5.8% 5.8%
Other Expenses 1,198 1,250 4% 1,053 19% 3,449 3,808 10%
% of sales 12.8% 12.1% 10.1% 11.7% 11.6%
Total Expenditure 8,077 8,952 11% 9,049 -1% 25,450 28,278 11%
% of sales 86.1% 86.9% 87.2% 86.2% 86.4%
EBITDA 1,305 1,351 4% 1,329 2% 4,084 4,443 9%
EBITDA Margin 13.9% 13.1% -80 bps 12.8% 30 bps 13.8% 13.6% -30 bps
Depreciation 32 33 1% 32 1% 95 96 1%
EBIT 1,273 1,318 4% 1,297 2% 3,988 4,347 9%
Other Income 66 124 87% 98 26% 198 311 57%
Finance Costs 158 150 -5% 150 0% 477 453 -5%
Forex Loss/(Gain) 0 0 0 0 0
Profit Before Tax 1,180 1,292 9% 1,245 4% 3,710 4,204 13%
Tax Expense 345 405 17% 386 5% 1,086 1,326 22%
Tax Rate 29.3% 31.3% 0 bps 31.0% 40 bps 29.3% 31.5% 0 bps
XO (Income)/Expenses 140 90 90 418 270
Reported Net Profit 695 797 15% 769 4% 2,206 2,609 18%
Reported EPS 1.1 1.3 14% 1.2 3% 3.5 4.1 18%
Adjusted Net Profit 789 856 9% 829 3% 2,486 2,788 12%
Adjusted EPS 1.3 1.4 8% 1.3 3% 4.0 4.4 12%
Source: Company, JM Financial
Segmental Performance Exhibit 71. INR mn 3Q18 3Q19 YoY 2Q19 QoQ 9MFY18 9MFY19 YoY
Total Revenue 9,382 10,303 10% 10,378 -1% 29,788 32,720 10%
ECD Revenue 6,117 7,116 16% 7,128 0% 20,397 23,492 15%
Lighting revenue 3,265 3,188 -2% 3,250 -2% 9,391 9,228 -2%
Total EBIT (Reported) 1,564 1,610 3% 1,554 4% 4,735 5,153 9%
Lighting 452 282 -38% 206 37% 1,099 676 -38%
ECD 1,112 1,327 19% 1,348 -2% 3,636 4,477 23%
EBIT Margin 16.7% 15.6% -100 bps 15.0% 70 bps 15.9% 15.7% -10 bps
Lighting 13.8% 8.9% -500 bps 6.3% 250 bps 11.7% 7.3% -440 bps
ECD 18.2% 18.7% 50 bps 18.9% -30 bps 17.8% 19.1% 120 bps
Source: Company, JM Financial
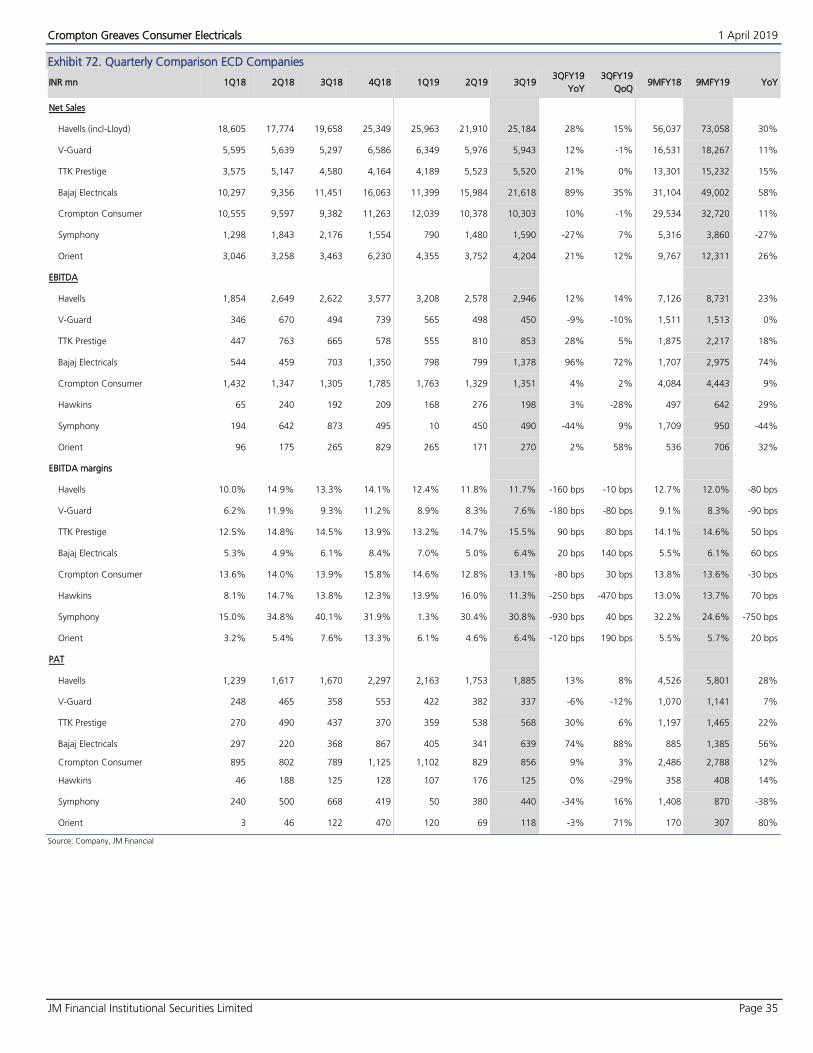
Crompton Greaves Consumer Electricals 1 April 2019
JM Financial Institutional Securities Limited Page 35
Quarterly Comparison ECD Companies Exhibit 72.
INR mn 1Q18 2Q18 3Q18 4Q18 1Q19 2Q19 3Q19 3QFY19
YoY
3QFY19
QoQ 9MFY18 9MFY19 YoY
Net Sales
Havells (incl-Lloyd) 18,605 17,774 19,658 25,349 25,963 21,910 25,184 28% 15% 56,037 73,058 30%
V-Guard 5,595 5,639 5,297 6,586 6,349 5,976 5,943 12% -1% 16,531 18,267 11%
TTK Prestige 3,575 5,147 4,580 4,164 4,189 5,523 5,520 21% 0% 13,301 15,232 15%
Bajaj Electricals 10,297 9,356 11,451 16,063 11,399 15,984 21,618 89% 35% 31,104 49,002 58%
Crompton Consumer 10,555 9,597 9,382 11,263 12,039 10,378 10,303 10% -1% 29,534 32,720 11%
Symphony 1,298 1,843 2,176 1,554 790 1,480 1,590 -27% 7% 5,316 3,860 -27%
Orient 3,046 3,258 3,463 6,230 4,355 3,752 4,204 21% 12% 9,767 12,311 26%
EBITDA
Havells 1,854 2,649 2,622 3,577 3,208 2,578 2,946 12% 14% 7,126 8,731 23%
V-Guard 346 670 494 739 565 498 450 -9% -10% 1,511 1,513 0%
TTK Prestige 447 763 665 578 555 810 853 28% 5% 1,875 2,217 18%
Bajaj Electricals 544 459 703 1,350 798 799 1,378 96% 72% 1,707 2,975 74%
Crompton Consumer 1,432 1,347 1,305 1,785 1,763 1,329 1,351 4% 2% 4,084 4,443 9%
Hawkins 65 240 192 209 168 276 198 3% -28% 497 642 29%
Symphony 194 642 873 495 10 450 490 -44% 9% 1,709 950 -44%
Orient 96 175 265 829 265 171 270 2% 58% 536 706 32%
EBITDA margins
Havells 10.0% 14.9% 13.3% 14.1% 12.4% 11.8% 11.7% -160 bps -10 bps 12.7% 12.0% -80 bps
V-Guard 6.2% 11.9% 9.3% 11.2% 8.9% 8.3% 7.6% -180 bps -80 bps 9.1% 8.3% -90 bps
TTK Prestige 12.5% 14.8% 14.5% 13.9% 13.2% 14.7% 15.5% 90 bps 80 bps 14.1% 14.6% 50 bps
Bajaj Electricals 5.3% 4.9% 6.1% 8.4% 7.0% 5.0% 6.4% 20 bps 140 bps 5.5% 6.1% 60 bps
Crompton Consumer 13.6% 14.0% 13.9% 15.8% 14.6% 12.8% 13.1% -80 bps 30 bps 13.8% 13.6% -30 bps
Hawkins 8.1% 14.7% 13.8% 12.3% 13.9% 16.0% 11.3% -250 bps -470 bps 13.0% 13.7% 70 bps
Symphony 15.0% 34.8% 40.1% 31.9% 1.3% 30.4% 30.8% -930 bps 40 bps 32.2% 24.6% -750 bps
Orient 3.2% 5.4% 7.6% 13.3% 6.1% 4.6% 6.4% -120 bps 190 bps 5.5% 5.7% 20 bps
PAT
Havells 1,239 1,617 1,670 2,297 2,163 1,753 1,885 13% 8% 4,526 5,801 28%
V-Guard 248 465 358 553 422 382 337 -6% -12% 1,070 1,141 7%
TTK Prestige 270 490 437 370 359 538 568 30% 6% 1,197 1,465 22%
Bajaj Electricals 297 220 368 867 405 341 639 74% 88% 885 1,385 56%
Crompton Consumer 895 802 789 1,125 1,102 829 856 9% 3% 2,486 2,788 12%
Hawkins 46 188 125 128 107 176 125 0% -29% 358 408 14%
Symphony 240 500 668 419 50 380 440 -34% 16% 1,408 870 -38%
Orient 3 46 122 470 120 69 118 -3% 71% 170 307 80%
Source: Company, JM Financial
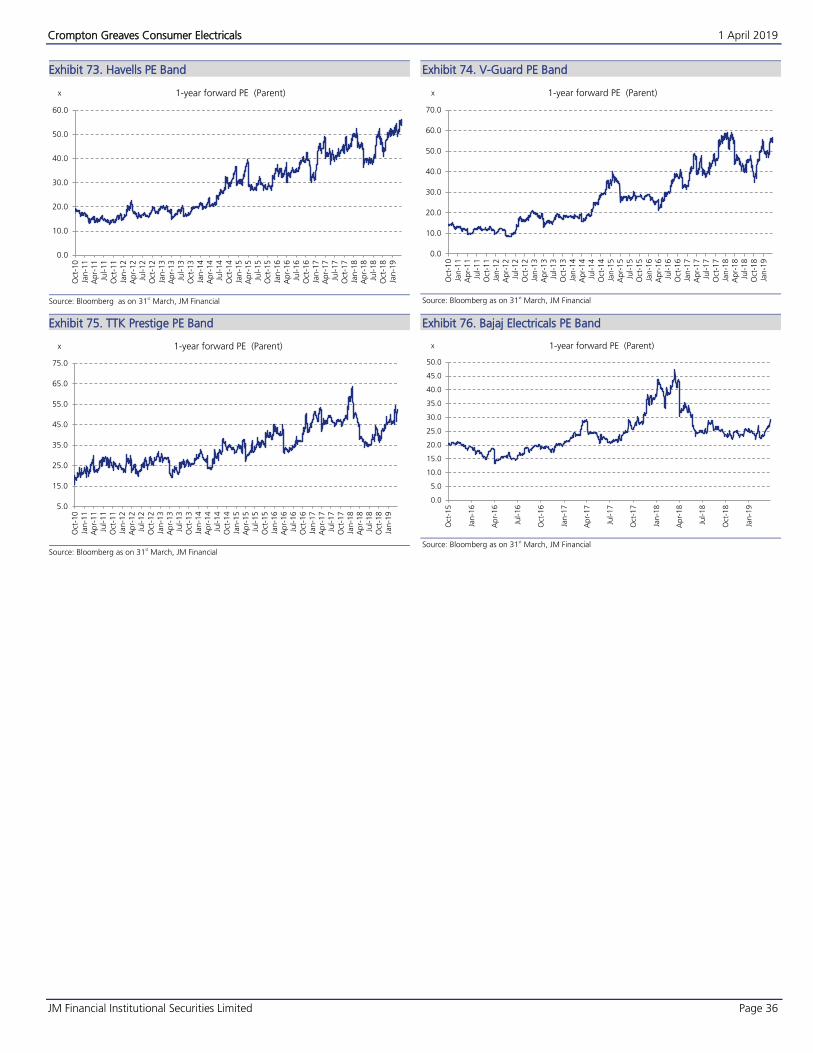
Crompton Greaves Consumer Electricals 1 April 2019
JM Financial Institutional Securities Limited Page 36
Havells PE Band Exhibit 73.
Source: Bloomberg as on 31st March, JM Financial
V-Guard PE Band Exhibit 74.
Source: Bloomberg as on 31st March, JM Financial
TTK Prestige PE Band Exhibit 75.
Source: Bloomberg as on 31st March, JM Financial
Bajaj Electricals PE Band Exhibit 76.
Source: Bloomberg as on 31st March, JM Financial
0.0
10.0
20.0
30.0
40.0
50.0
60.0
Oct
-10
Jan-1
1A
pr-
11
Jul-11
Oct
-11
Jan-1
2A
pr-
12
Jul-12
Oct
-12
Jan-1
3A
pr-
13
Jul-13
Oct
-13
Jan-1
4A
pr-
14
Jul-14
Oct
-14
Jan-1
5A
pr-
15
Jul-15
Oct
-15
Jan-1
6A
pr-
16
Jul-16
Oct
-16
Jan-1
7A
pr-
17
Jul-17
Oct
-17
Jan-1
8A
pr-
18
Jul-18
Oct
-18
Jan-1
9
1-year forward PE (Parent)x
0.0
10.0
20.0
30.0
40.0
50.0
60.0
70.0
Oct
-10
Jan-1
1A
pr-
11
Jul-11
Oct
-11
Jan-1
2A
pr-
12
Jul-12
Oct
-12
Jan-1
3A
pr-
13
Jul-13
Oct
-13
Jan-1
4A
pr-
14
Jul-14
Oct
-14
Jan-1
5A
pr-
15
Jul-15
Oct
-15
Jan-1
6A
pr-
16
Jul-16
Oct
-16
Jan-1
7A
pr-
17
Jul-17
Oct
-17
Jan-1
8A
pr-
18
Jul-18
Oct
-18
Jan-1
9
1-year forward PE (Parent)x
5.0
15.0
25.0
35.0
45.0
55.0
65.0
75.0
Oct
-10
Jan-1
1A
pr-
11
Jul-11
Oct
-11
Jan-1
2A
pr-
12
Jul-12
Oct
-12
Jan-1
3A
pr-
13
Jul-13
Oct
-13
Jan-1
4A
pr-
14
Jul-14
Oct
-14
Jan-1
5A
pr-
15
Jul-15
Oct
-15
Jan-1
6A
pr-
16
Jul-16
Oct
-16
Jan-1
7A
pr-
17
Jul-17
Oct
-17
Jan-1
8A
pr-
18
Jul-18
Oct
-18
Jan-1
9
1-year forward PE (Parent)x
0.0
5.0
10.0
15.0
20.0
25.0
30.0
35.0
40.0
45.0
50.0
Oct
-15
Jan-1
6
Ap
r-16
Jul-16
Oct
-16
Jan-1
7
Ap
r-17
Jul-17
Oct
-17
Jan-1
8
Ap
r-18
Jul-18
Oct
-18
Jan-1
9
1-year forward PE (Parent)x
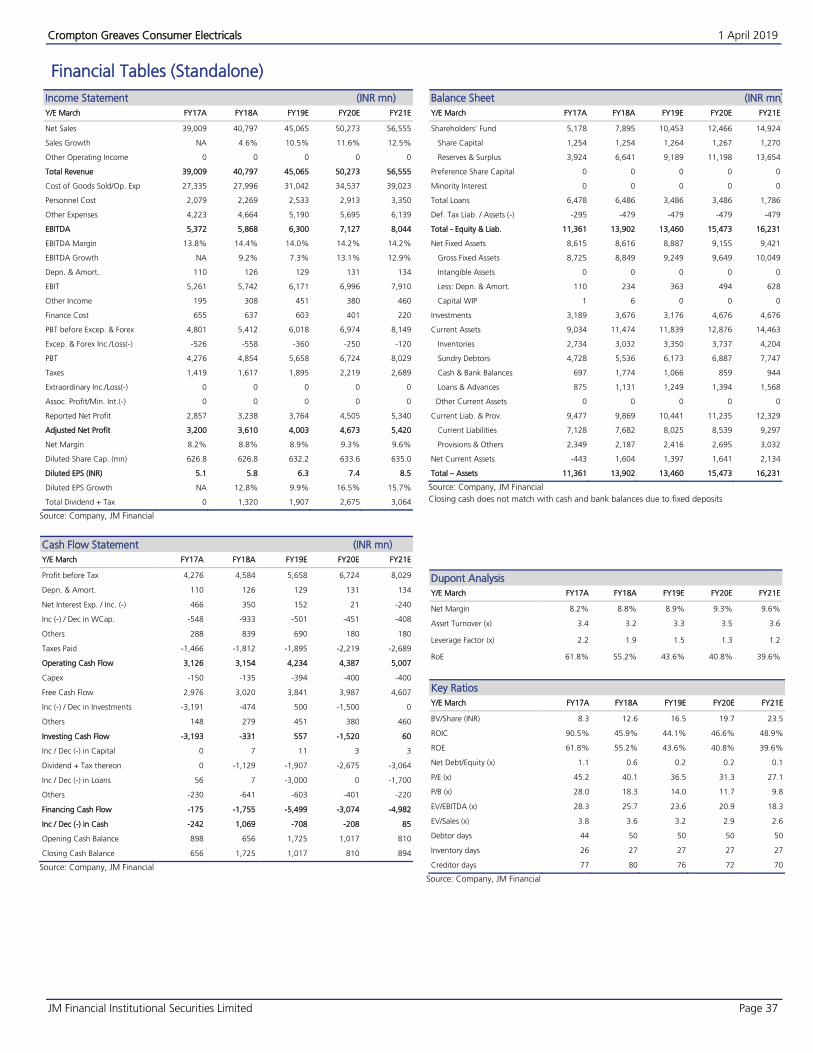
Crompton Greaves Consumer Electricals 1 April 2019
JM Financial Institutional Securities Limited Page 37
Financial Tables (Standalone)
Income Statement (INR mn)
Y/E March FY17A FY18A FY19E FY20E FY21E
Net Sales 39,009 40,797 45,065 50,273 56,555
Sales Growth NA 4.6% 10.5% 11.6% 12.5%
Other Operating Income 0 0 0 0 0
Total Revenue 39,009 40,797 45,065 50,273 56,555
Cost of Goods Sold/Op. Exp 27,335 27,996 31,042 34,537 39,023
Personnel Cost 2,079 2,269 2,533 2,913 3,350
Other Expenses 4,223 4,664 5,190 5,695 6,139
EBITDA 5,372 5,868 6,300 7,127 8,044
EBITDA Margin 13.8% 14.4% 14.0% 14.2% 14.2%
EBITDA Growth NA 9.2% 7.3% 13.1% 12.9%
Depn. & Amort. 110 126 129 131 134
EBIT 5,261 5,742 6,171 6,996 7,910
Other Income 195 308 451 380 460
Finance Cost 655 637 603 401 220
PBT before Excep. & Forex 4,801 5,412 6,018 6,974 8,149
Excep. & Forex Inc./Loss(-) -526 -558 -360 -250 -120
PBT 4,276 4,854 5,658 6,724 8,029
Taxes 1,419 1,617 1,895 2,219 2,689
Extraordinary Inc./Loss(-) 0 0 0 0 0
Assoc. Profit/Min. Int.(-) 0 0 0 0 0
Reported Net Profit 2,857 3,238 3,764 4,505 5,340
Adjusted Net Profit 3,200 3,610 4,003 4,673 5,420
Net Margin 8.2% 8.8% 8.9% 9.3% 9.6%
Diluted Share Cap. (mn) 626.8 626.8 632.2 633.6 635.0
Diluted EPS (INR) 5.1 5.8 6.3 7.4 8.5
Diluted EPS Growth NA 12.8% 9.9% 16.5% 15.7%
Total Dividend + Tax 0 1,320 1,907 2,675 3,064
Source: Company, JM Financial
Cash Flow Statement (INR mn)
Y/E March FY17A FY18A FY19E FY20E FY21E
Profit before Tax 4,276 4,584 5,658 6,724 8,029
Depn. & Amort. 110 126 129 131 134
Net Interest Exp. / Inc. (-) 466 350 152 21 -240
Inc (-) / Dec in WCap. -548 -933 -501 -451 -408
Others 288 839 690 180 180
Taxes Paid -1,466 -1,812 -1,895 -2,219 -2,689
Operating Cash Flow 3,126 3,154 4,234 4,387 5,007
Capex -150 -135 -394 -400 -400
Free Cash Flow 2,976 3,020 3,841 3,987 4,607
Inc (-) / Dec in Investments -3,191 -474 500 -1,500 0
Others 148 279 451 380 460
Investing Cash Flow -3,193 -331 557 -1,520 60
Inc / Dec (-) in Capital 0 7 11 3 3
Dividend + Tax thereon 0 -1,129 -1,907 -2,675 -3,064
Inc / Dec (-) in Loans 56 7 -3,000 0 -1,700
Others -230 -641 -603 -401 -220
Financing Cash Flow -175 -1,755 -5,499 -3,074 -4,982
Inc / Dec (-) in Cash -242 1,069 -708 -208 85
Opening Cash Balance 898 656 1,725 1,017 810
Closing Cash Balance 656 1,725 1,017 810 894
Source: Company, JM Financial
Balance Sheet (INR mn)
Y/E March FY17A FY18A FY19E FY20E FY21E
Shareholders’ Fund 5,178 7,895 10,453 12,466 14,924
Share Capital 1,254 1,254 1,264 1,267 1,270
Reserves & Surplus 3,924 6,641 9,189 11,198 13,654
Preference Share Capital 0 0 0 0 0
Minority Interest 0 0 0 0 0
Total Loans 6,478 6,486 3,486 3,486 1,786
Def. Tax Liab. / Assets (-) -295 -479 -479 -479 -479
Total - Equity & Liab. 11,361 13,902 13,460 15,473 16,231
Net Fixed Assets 8,615 8,616 8,887 9,155 9,421
Gross Fixed Assets 8,725 8,849 9,249 9,649 10,049
Intangible Assets 0 0 0 0 0
Less: Depn. & Amort. 110 234 363 494 628
Capital WIP 1 6 0 0 0
Investments 3,189 3,676 3,176 4,676 4,676
Current Assets 9,034 11,474 11,839 12,876 14,463
Inventories 2,734 3,032 3,350 3,737 4,204
Sundry Debtors 4,728 5,536 6,173 6,887 7,747
Cash & Bank Balances 697 1,774 1,066 859 944
Loans & Advances 875 1,131 1,249 1,394 1,568
Other Current Assets 0 0 0 0 0
Current Liab. & Prov. 9,477 9,869 10,441 11,235 12,329
Current Liabilities 7,128 7,682 8,025 8,539 9,297
Provisions & Others 2,349 2,187 2,416 2,695 3,032
Net Current Assets -443 1,604 1,397 1,641 2,134
Total – Assets 11,361 13,902 13,460 15,473 16,231
Source: Company, JM Financial
Closing cash does not match with cash and bank balances due to fixed deposits
Dupont Analysis
Y/E March FY17A FY18A FY19E FY20E FY21E
Net Margin 8.2% 8.8% 8.9% 9.3% 9.6%
Asset Turnover (x) 3.4 3.2 3.3 3.5 3.6
Leverage Factor (x) 2.2 1.9 1.5 1.3 1.2
RoE 61.8% 55.2% 43.6% 40.8% 39.6%
Key Ratios
Y/E March FY17A FY18A FY19E FY20E FY21E
BV/Share (INR) 8.3 12.6 16.5 19.7 23.5
ROIC 90.5% 45.9% 44.1% 46.6% 48.9%
ROE 61.8% 55.2% 43.6% 40.8% 39.6%
Net Debt/Equity (x) 1.1 0.6 0.2 0.2 0.1
P/E (x) 45.2 40.1 36.5 31.3 27.1
P/B (x) 28.0 18.3 14.0 11.7 9.8
EV/EBITDA (x) 28.3 25.7 23.6 20.9 18.3
EV/Sales (x) 3.8 3.6 3.2 2.9 2.6
Debtor days 44 50 50 50 50
Inventory days 26 27 27 27 27
Creditor days 77 80 76 72 70
Source: Company, JM Financial
Crompton Greaves Consumer Electricals 1 April 2019
JM Financial Institutional Securities Limited Page 38
APPENDIX I
JM Financial Inst itut ional Secur it ies Limited ( fo rmer l y known as JM F inanc ia l Secur i t i e s L im i ted)
Corporate Identity Number: U67100MH2017PLC296081 Member of BSE Ltd., National Stock Exchange of India Ltd. and Metropolitan Stock Exchange of India Ltd.
SEBI Registration Nos.: Stock Broker - INZ000163434, Research Analyst – INH000000610 Registered Office: 7th Floor, Cnergy, Appasaheb Marathe Marg, Prabhadevi, Mumbai 400 025, India.
Board: +9122 6630 3030 | Fax: +91 22 6630 3488 | Email: [email protected] | www.jmfl.com
Compliance Officer: Mr. Sunny Shah | Tel: +91 22 6630 3383 | Email: [email protected]
Definition of ratings
Rating Meaning
Buy Total expected returns of more than 15%. Total expected return includes dividend yields.
Hold Price expected to move in the range of 10% downside to 15% upside from the current market price.
Sell Price expected to move downwards by more than 10%
Research Analyst(s) Certification
The Research Analyst(s), with respect to each issuer and its securities covered by them in this research report, certify that:
All of the views expressed in this research report accurately reflect his or her or their personal views about all of the issuers and their securities; and
No part of his or her or their compensation was, is, or will be directly or indirectly related to the specific recommendations or views expressed in this research report.
Important Disclosures
This research report has been prepared by JM Financial Institutional Securities Limited (JM Financial Institutional Securities) to provide information about the
company(ies) and sector(s), if any, covered in the report and may be distributed by it and/or its associates solely for the purpose of information of the select
recipient of this report. This report and/or any part thereof, may not be duplicated in any form and/or reproduced or redistributed without the prior written
consent of JM Financial Institutional Securities. This report has been prepared independent of the companies covered herein.
JM Financial Institutional Securities is registered with the Securities and Exchange Board of India (SEBI) as a Research Analyst and a Stock Broker having trading
memberships of the BSE Ltd. (BSE), National Stock Exchange of India Ltd. (NSE) and Metropolitan Stock Exchange of India Ltd. (MSEI). No material disciplinary
action has been taken by SEBI against JM Financial Institutional Securities in the past two financial years which may impact the investment decision making of the
investor.
JM Financial Institutional Securities renders stock broking services primarily to institutional investors and provides the research services to its institutional
clients/investors. JM Financial Institutional Securities and its associates are part of a multi-service, integrated investment banking, investment management,
brokerage and financing group. JM Financial Institutional Securities and/or its associates might have provided or may provide services in respect of managing
offerings of securities, corporate finance, investment banking, mergers & acquisitions, broking, financing or any other advisory services to the company(ies)
covered herein. JM Financial Institutional Securities and/or its associates might have received during the past twelve months or may receive compensation from
the company(ies) mentioned in this report for rendering any of the above services.
JM Financial Institutional Securities and/or its associates, their directors and employees may; (a) from time to time, have a long or short position in, and buy or sell
the securities of the company(ies) mentioned herein or (b) be engaged in any other transaction involving such securities and earn brokerage or other
compensation or act as a market maker in the financial instruments of the company(ies) covered under this report or (c) act as an advisor or lender/borrower to,
or may have any financial interest in, such company(ies) or (d) considering the nature of business/activities that JM Financial Institutional Securities is engaged in,
it may have potential conflict of interest at the time of publication of this report on the subject company(ies).
Neither JM Financial Institutional Securities nor its associates or the Research Analyst(s) named in this report or his/her relatives individually own one per cent or
more securities of the company(ies) covered under this report, at the relevant date as specified in the SEBI (Research Analysts) Regulations, 2014.
The Research Analyst(s) principally responsible for the preparation of this research report and members of their household are prohibited from buying or selling
debt or equity securities, including but not limited to any option, right, warrant, future, long or short position issued by company(ies) covered under this report.
The Research Analyst(s) principally responsible for the preparation of this research report or their relatives (as defined under SEBI (Research Analysts) Regulations,
2014); (a) do not have any financial interest in the company(ies) covered under this report or (b) did not receive any compensation from the company(ies) covered
under this report, or from any third party, in connection with this report or (c) do not have any other material conflict of interest at the time of publication of this
report. Research Analyst(s) are not serving as an officer, director or employee of the company(ies) covered under this report.
While reasonable care has been taken in the preparation of this report, it does not purport to be a complete description of the securities, markets or
developments referred to herein, and JM Financial Institutional Securities does not warrant its accuracy or completeness. JM Financial Institutional Securities may
not be in any way responsible for any loss or damage that may arise to any person from any inadvertent error in the information contained in this report. This
report is provided for information only and is not an investment advice and must not alone be taken as the basis for an investment decision.
Crompton Greaves Consumer Electricals 1 April 2019
JM Financial Institutional Securities Limited Page 39
The investment discussed or views expressed or recommendations/opinions given herein may not be suitable for all investors. The user assumes the entire risk of
any use made of this information. The information contained herein may be changed without notice and JM Financial Institutional Securities reserves the right to
make modifications and alterations to this statement as they may deem fit from time to time.
This report is neither an offer nor solicitation of an offer to buy and/or sell any securities mentioned herein and/or not an official confirmation of any transaction.
This report is not directed or intended for distribution to, or use by any person or entity who is a citizen or resident of or located in any locality, state, country or
other jurisdiction, where such distribution, publication, availability or use would be contrary to law, regulation or which would subject JM Financial Institutional
Securities and/or its affiliated company(ies) to any registration or licensing requirement within such jurisdiction. The securities described herein may or may not be
eligible for sale in all jurisdictions or to a certain category of investors. Persons in whose possession this report may come, are required to inform themselves of
and to observe such restrictions.
Persons who receive this report from JM Financial Singapore Pte Ltd may contact Mr. Ruchir Jhunjhunwala ([email protected]) on +65 6422 1888 in
respect of any matters arising from, or in connection with, this report.
Additional disclosure only for U.S. persons: JM Financial Institutional Securities has entered into an agreement with JM Financial Securities, Inc. ("JM Financial
Securities"), a U.S. registered broker-dealer and member of the Financial Industry Regulatory Authority ("FINRA") in order to conduct certain business in the
United States in reliance on the exemption from U.S. broker-dealer registration provided by Rule 15a-6, promulgated under the U.S. Securities Exchange Act of
1934 (the "Exchange Act"), as amended, and as interpreted by the staff of the U.S. Securities and Exchange Commission ("SEC") (together "Rule 15a-6").
This research report is distributed in the United States by JM Financial Securities in compliance with Rule 15a-6, and as a "third party research report" for
purposes of FINRA Rule 2241. In compliance with Rule 15a-6(a)(3) this research report is distributed only to "major U.S. institutional investors" as defined in Rule
15a-6 and is not intended for use by any person or entity that is not a major U.S. institutional investor. If you have received a copy of this research report and are
not a major U.S. institutional investor, you are instructed not to read, rely on, or reproduce the contents hereof, and to destroy this research or return it to JM
Financial Institutional Securities or to JM Financial Securities.
This research report is a product of JM Financial Institutional Securities, which is the employer of the research analyst(s) solely responsible for its content. The
research analyst(s) preparing this research report is/are resident outside the United States and are not associated persons or employees of any U.S. registered
broker-dealer. Therefore, the analyst(s) are not subject to supervision by a U.S. broker-dealer, or otherwise required to satisfy the regulatory licensing
requirements of FINRA and may not be subject to the Rule 2241 restrictions on communications with a subject company, public appearances and trading
securities held by a research analyst account.
JM Financial Institutional Securities only accepts orders from major U.S. institutional investors. Pursuant to its agreement with JM Financial Institutional Securities,
JM Financial Securities effects the transactions for major U.S. institutional investors. Major U.S. institutional investors may place orders with JM Financial
Institutional Securities directly, or through JM Financial Securities, in the securities discussed in this research report.
Additional disclosure only for U.K. persons: Neither JM Financial Institutional Securities nor any of its affiliates is authorised in the United Kingdom (U.K.) by the
Financial Conduct Authority. As a result, this report is for distribution only to persons who (i) have professional experience in matters relating to investments
falling within Article 19(5) of the Financial Services and Markets Act 2000 (Financial Promotion) Order 2005 (as amended, the "Financial Promotion Order"), (ii)
are persons falling within Article 49(2)(a) to (d) ("high net worth companies, unincorporated associations etc.") of the Financial Promotion Order, (iii) are outside
the United Kingdom, or (iv) are persons to whom an invitation or inducement to engage in investment activity (within the meaning of section 21 of the Financial
Services and Markets Act 2000) in connection with the matters to which this report relates may otherwise lawfully be communicated or caused to be
communicated (all such persons together being referred to as "relevant persons"). This report is directed only at relevant persons and must not be acted on or
relied on by persons who are not relevant persons. Any investment or investment activity to which this report relates is available only to relevant persons and will
be engaged in only with relevant persons.
Additional disclosure only for Canadian persons: This report is not, and under no circumstances is to be construed as, an advertisement or a public offering of the
securities described herein in Canada or any province or territory thereof. Under no circumstances is this report to be construed as an offer to sell securities or as
a solicitation of an offer to buy securities in any jurisdiction of Canada. Any offer or sale of the securities described herein in Canada will be made only under an
exemption from the requirements to file a prospectus with the relevant Canadian securities regulators and only by a dealer properly registered under applicable
securities laws or, alternatively, pursuant to an exemption from the registration requirement in the relevant province or territory of Canada in which such offer or
sale is made. This report is not, and under no circumstances is it to be construed as, a prospectus or an offering memorandum. No securities commission or
similar regulatory authority in Canada has reviewed or in any way passed upon these materials, the information contained herein or the merits of the securities
described herein and any representation to the contrary is an offence. If you are located in Canada, this report has been made available to you based on your
representation that you are an “accredited investor” as such term is defined in National Instrument 45-106 Prospectus Exemptions and a “permitted client” as
such term is defined in National Instrument 31-103 Registration Requirements, Exemptions and Ongoing Registrant Obligations. Under no circumstances is the
information contained herein to be construed as investment advice in any province or territory of Canada nor should it be construed as being tailored to the
needs of the recipient. Canadian recipients are advised that JM Financial Securities, Inc., JM Financial Institutional Securities Limited, their affiliates and authorized
agents are not responsible for, nor do they accept, any liability whatsoever for any direct or consequential loss arising from any use of this research report or the
information contained herein.