Embed Size (px)
Citation preview
Cronfa - Swansea University Open Access Repository
_____________________________________________________________
This is an author produced version of a paper published in :
Journal of Clinical Epidemiology
Cronfa URL for this paper:
http://cronfa.swan.ac.uk/Record/cronfa23014
_____________________________________________________________
Paper:
Hutchings, H., Thorne, K., Jerzembek, G., Cheung, W., Cohen, ., Rapport , F., Seagrove, ., Williams, J. & Russell, I.
(in press). Method for Aggregating The Reporting of Interventions in Complex Studies (MATRICS): successful
development and testing. Journal of Clinical Epidemiology. Journal of Clinical Epidemiology
_____________________________________________________________ This article is brought to you by Swansea University. Any person downloading material is agreeing to abide by the
terms of the repository licence. Authors are personally responsible for adhering to publisher restrictions or conditions.
When uploading content they are required to comply with their publisher agreement and the SHERPA RoMEO
database to judge whether or not it is copyright safe to add this version of the paper to this repository.
http://www.swansea.ac.uk/iss/researchsupport/cronfa-support/
1
Method for Aggregating The Reporting of Interventions in Complex Studies
(MATRICS): successful development and testing
Hayley A Hutchings1*
, Associate Professor in Health Services Research,
Kymberley Thorne1, Research Officer, [email protected]
Gabi S Jerzembek2, Senior Research Fellow, [email protected]
chemnitz.de
Wai-Yee Cheung1, Senior Lecturer, [email protected]
David Cohen3, Professor of Health Economics, [email protected]
Durai4, Consultant Gastroenterologist, [email protected]
Frances L Rapport1, Professor of Qualitative Health Research, [email protected]
Anne C Seagrove1, Research Officer/ Trial Manager, [email protected]
John G Williams
1, Professor of Health Services Research, [email protected]
Ian T Russell
1, Professor of Clinical Trials, [email protected]
* Corresponding author
1Patient and Population Health and Informatics Research (PPHI),
Swansea University Medical School,
Institute of Life Sciences 2,
Swansea University,
2
Singleton Park,
Swansea, SA2 8PP,
UK
Tel: +44 (0)1792 513412; Fax: +44 (0)1792 606599
Hayley Anne Hutchings, Associate Professor in Health Services Research
2 Institute of Health Service Effectiveness (IHSE), Aston University Business School, Aston
Triangle, Birmingham, B4 7ET.
3 Faculty of Health Sport and Science, University of South Wales, Pontypridd, UK CF37
1DL.
4 Department of Medicine, University Hospital of Wales, Heath Park, Cardiff, UK CF4 4XW.
Dharmaraj Durai, Consultant Gastroenterologist
Journal of Clinical Epidemiology 2015
DOI: http://dx.doi.org/10.1016/j.jclinepi.2015.08.006
3
Method for Aggregating The Reporting of Interventions in Complex Studies
(MATRICS): successful development and testing
ABSTRACT
Objective: To develop a tool for the accurate reporting and aggregation of findings from each
of the multiple methods used in a complex evaluation in an unbiased way.
Study Design and Setting: We developed a Method for Aggregating The Reporting of
Interventions in Complex Studies (MATRICS) within a gastroenterology study (ENIGMA).
We subsequently tested it on a different gastroenterology trial (MINuET). We created three
layers to define the effects, methods, and findings from ENIGMA. We assigned numbers to
each effect in layer 1 and letters to each method in layer 2. We used an alphanumeric code
based on layer 1 and layer 2 to every finding in layer 3 to link the aims, methods, and
findings. We illustrated analogous findings by assigning more than one alphanumeric code to
a finding. We also showed that more than one effect or method could report the same finding.
We presented contradictory findings by listing them in adjacent rows of the MATRICS.
Results: MATRICS was useful for the effective synthesis, and presentation of findings of the
multiple methods from ENIGMA. We subsequently successfully tested it by applying it to
the MINuET trial.
Conclusion: MATRICS is effective for synthesising the findings of complex, multiple-
method studies.
(200)
Key words: evaluation methods, evaluation studies as topic, research design, data reporting,
complex interventions, multiple methods

4
Running title
Development and testing of MATRICS

5
What is new?
Key Findings
We successfully developed and tested a Method for Aggregating The Reporting of
Interventions in Complex Studies (MATRICS) in two complex, multiple method
gastroenterology studies
What this study adds to what is known
The synthesis of numerous findings from multiple-methods in complex studies can be
difficult. Reporting findings separately may cause a lack of integration of results
which may not yield valid findings. MATRICS facilitates the useful synthesis and
presentation of findings from multiple method studies.
What is the implication? What should change now?
MATRICS presents easily understandable results, without the need to study complex
figures and tables. As both quantitative and qualitative results can be synthesised into
one finding, it does not inadvertently bias the findings towards one paradigm but
instead illustrates the different methodologies and balances the effects of findings.
MATRICS can be applied to any complex study design using multiple methods to
facilitate synthesis and interpretation of findings.

6
1. BACKGROUND
Using complex, multiple-methods in health services research has the potential to yield high-
quality research, especially in the case of studies which utilise the strengths of both
quantitative and qualitative approaches. Whether used sequentially or concurrently, multiple
methods can provide a wealth of information, synthesise complementary findings, highlight
underlying issues and generate more comprehensive and general conclusions than single
methods used alone. A recent survey of 75 multiple-method studies found that “combining
methods yielded confirmation, complementarities, development and expansion”[1]. The
triangulation of methods following the use of differing techniques to explain the same
dependent variable supports the validity of conclusions drawn, where mutual confirmation of
results can be shown[2].
The synthesis of numerous findings from multiple-methods in complex studies can be
difficult. Many articles report results separately and in parallel, with little or no
integration[3]. Although there are validated strategies for aggregating quantitative and
qualitative results separately[4,5,6,7], combining and synthesising findings from multiple-
method studies can be more difficult[8]. Reporting such findings separately may not yield
valid findings. In particular conclusions may disproportionally represent one aspect of the
design rather than present a balanced and rigorous synthesis of all the methods used in the
study[8].
The main reason for this lack of rigour is that there is no agreed framework for synthesising
the findings from multiple-method studies or studies investigating complex interventions[9].
It is important to depict comparable results in a format that highlights that different facets of a
7
study are complementary in their findings, and that each facet adds to the others, since this is
the major strength of multiple-method studies[10,11].
Tools do exist to aggregate findings from multiple-method studies[11,12,13], but we decided
that these were not suitable for the ENIGMA study because they were unable to convey: the
outcomes of the complex interventions without disproportionally representing one facet of the
study design; or whether the findings from each method were complementary or contrasting
in a reader-friendly format. To address this, we developed the Method for Aggregating The
Reporting of Interventions in Complex Studies (MATRICS) tool.
We believe the MATRICS tool can offer the user the ability to juxtapose findings visually. It
can be applied to any study design (e.g. cohort study, RCT, or any multiple-method study) but
is best for studies investigating complex interventions, usually using multiple methods. We
originally developed this approach to synthesise numerous findings from our complex,
multiple-method evaluation of the modernisation of endoscopy services in the National
Health Service (NHS) in England – the ENIGMA study[14]. We have since applied it to a
complex multiple-method Randomised Controlled Trial (RCT) of nurse endoscopists –
MINuET[15] to test its generalisability.
8
2. METHODS
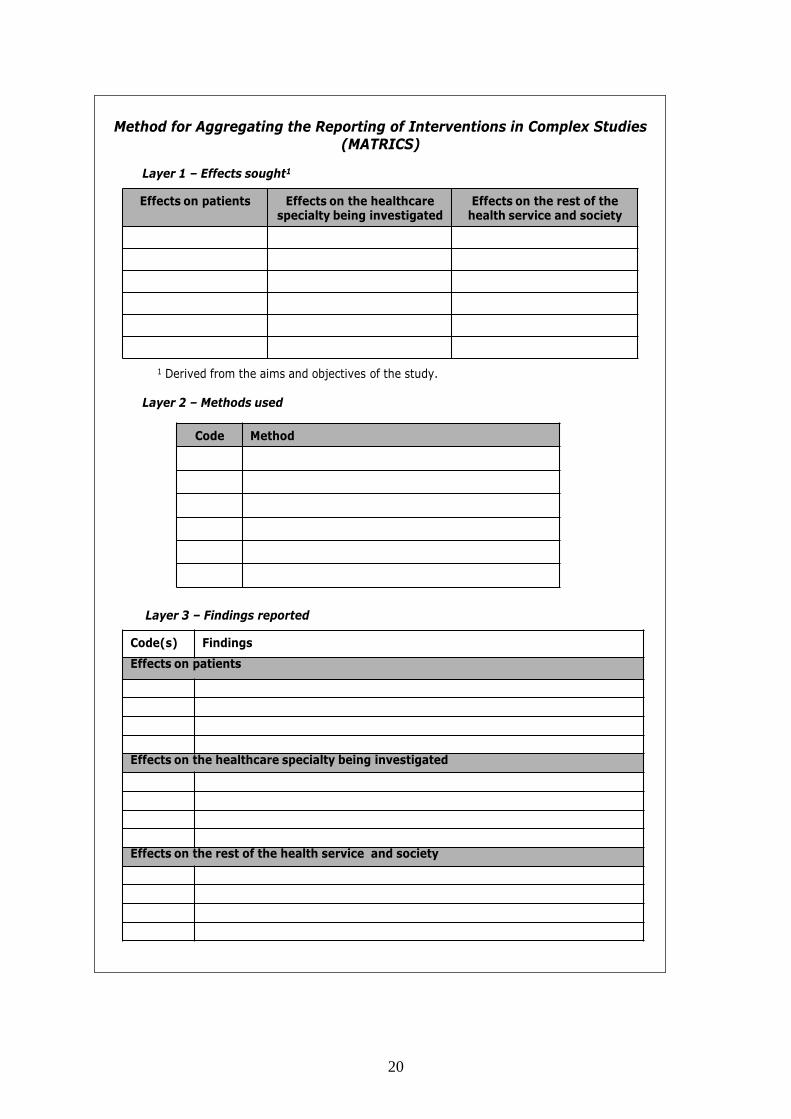
We developed the MATRICS proforma in Figure 1which requires the user to identify:
1. all potential effects of the intervention(s) under evaluation (derived from the aims and
objectives of the study) – layer 1
2. all methods used in that evaluation – layer 2
3. all research findings – layer 3
[Insert Figure 1 here]
Layer 1 has headings in each column which are customised for the study where necessary.
We investigated patients and NHS endoscopy services in the ENIGMA case study.
The completion of the MATRICS proforma is undertaken as follows:
2.1 Step 1 – Identify, categorise and code all effects sought by each component of the study
The effects are defined by the aims and objectives of the study, but also permit unexpected
effects to emerge over the course of the evaluation.
Firstly, all effects are categorised into three groups (termed “effect categories”):
Effects on the sample population (can be altered to be more specific);
Effects on the specialty being investigated (can be altered to be more specific);
Effects on the rest of the organisation and society (can be altered to make it more
appropriate to a larger study context).

9
Secondly, layer 1 on the MATRICS proforma is completed with a list of effects to be
evaluated by the study using one cell per effect (under the appropriate effect category
column). Each effect is assigned a unique number, starting at “1”. Any effects subsequently
identified are included as they arise, and assigned the next available number.
2.2 Step 2 – Identify and code all methods used by each component of the study
Each method (or instrument) employed by the study is listed in layer 2 of the MATRICS
proforma (e.g. questionnaires, case report forms, interviews, routine data, etc.). Each method
is assigned a unique letter, starting with “A”.
2.3 Step 3 – Create an alphanumeric code
All numbered effects in layer 1 are assigned letters according to how those effects are
investigated. The letters are derived from the method to which they correspond. For
example, if patient satisfaction is effect 1 and it is investigated using a patient satisfaction
questionnaire which is assigned method A, we record [A] alongside effect 1 in layer 1.
In layer 2, the appropriate number from layer 1 is assigned to each method to illustrate all the
effects they are investigating. For example, patient satisfaction (method A) has effect 1
recorded alongside it in layer 2.
As each effect is likely to be investigated by more than one method, more than one letter can
be associated with each number (effect) in layer 1. The same principle applies for one method
being used to investigate more than one effect. For example, patient interviews [B] may also
determine patient satisfaction so we would enter [1] after method [B], and alter effect [1] to
have [A, B] investigating patient satisfaction.
10
2.4 Step 4 – Identify and code all research findings reported by the study
The individual findings from each component of the study are listed in layer 3 of the
MATRICS proforma. Findings are primarily textual but in the case of some quantitative
findings, they can also include summary statistics to provide more detail where necessary.
The degree of detail in the findings is at the discretion of the user but if the findings are too
detailed, the chances of merging analogous findings are reduced.
Each finding in layer 3 is then labelled using an alphanumeric code derived from layers 1 and
2 (detailed in step 3 above) to help the reader identify which effects are being investigated and
which method(s) are being used to produce that finding.
2.5 Step 5 – Refine Layer 3 by synthesising all complementary research findings and
reordering contrasting findings
All comparable findings, irrespective of which effects are investigated or which methods are
used, are merged into one composite statement. Care is taken to ensure that the final
statement is still representative of the original individual findings.
All alphanumeric codes associated with each finding making up a final statement are reported
separately alongside the statement. For example, on synthesising the finding that patient
satisfaction (effect1) is poor, from both patient questionnaires (method A) and interviews
(method D) into one accurate statement, one row in layer 3 is used but two alphanumeric
codes are assigned. This illustrates that more than one effect or method are reporting the
same outcome. This allows the reader tquickly to identify the common findings of the study

11
and how they are identified, and to appreciate how many facets of the study produced
consistent findings.
Where findings are not comparable or even opposing, they remain separate in layer 3, but are
placed adjacent to each other in the list to make them more visually obvious. We classified
findings as discordant if the effects being investigated produced conflicting findings when
different methods addressed the same objective.
We designed the MATRICS tool to illustrate whether there was any agreement or discordance
in the effects evaluated by different methods, not to examine the degree of this agreement or
discordance. We developed the tool with the intention of applying it to existing results and
data without more detailed scrutiny of individual findings. Where significance or otherwise is
clear we include this in the assimilation of findings to illustrate agreement or discordance, but
we exclude judgements regarding the scale of the difference or effect size.
Although we illustrate comparability and discordance of findings initially within specific
domains, for example ‘effects on patients’, or ‘effects on services’, the final discussion of
MATRICS findings should draw out agreement and discordance both within and across
domains.
3. RESULTS
We present two examples: the ENIGMA study[14] which initiated the development of
MATRICS, and the MINuET study,[15] which we used to test and illustrate the application
and potential of MATRICS in practice.
12
3.1 CASE STUDY 1 - ENIGMA
The study of ‘Evaluating New Innovations in (the delivery and organisation of)
Gastrointestinal (GI) endoscopy services by the NHS Modernisation Agency’ (ENIGMA)
[16] was a complex intervention study designed to evaluate the Modernising Endoscopy
Services (MES) Programme in England with particular reference to GI endoscopy, using ten
different research methods including focus groups[17,18] and routinely collected data[16].
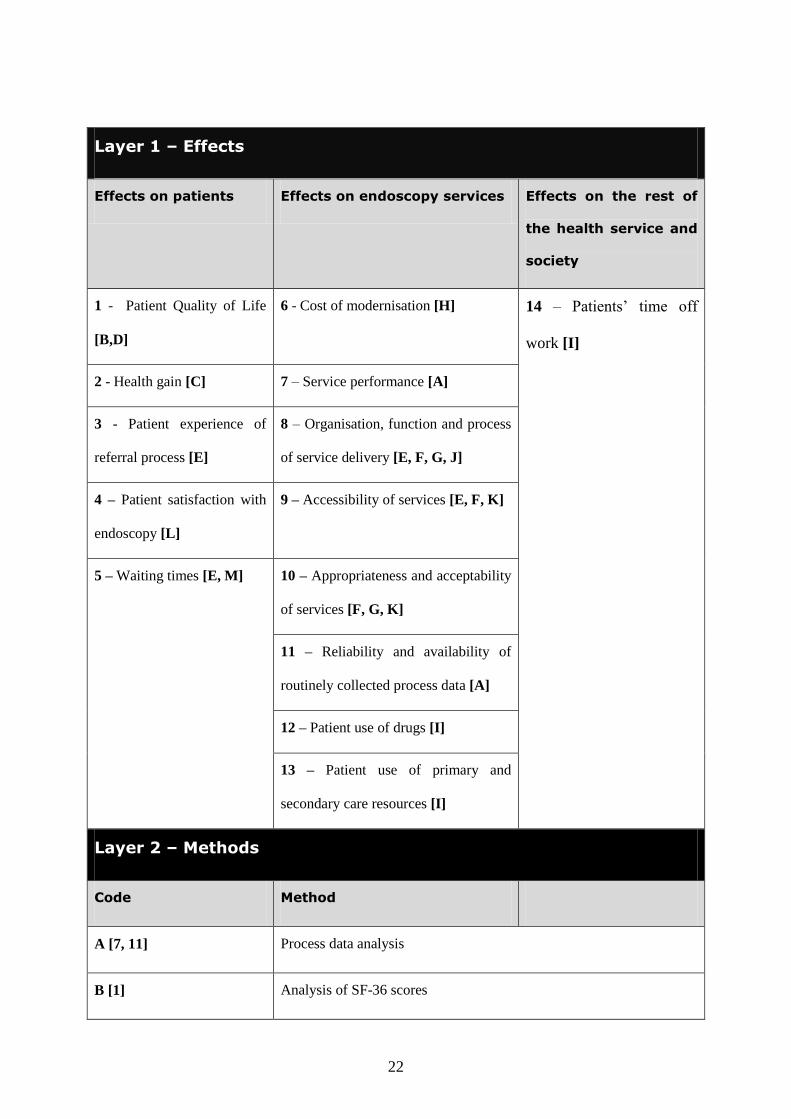
Appendices 1 and 2 depict layers 1-3 of the ENIGMA MATRICS published in the final
report[14]. In layer 1 we illustrate the effects being investigated in consecutive numerical
order from 1 to 14, which we broke down into effects on patients, effects on endoscopy
services, and effects on other health services and society. We placed a letter alongside each
effect which relates to the specific methods we used to investigate the effect (Appendix 1). In
layer 2, we list the specific methods employed in the study. We assigned each method a letter
code from A to M, which we referenced back to layer 1. We similarly documented the
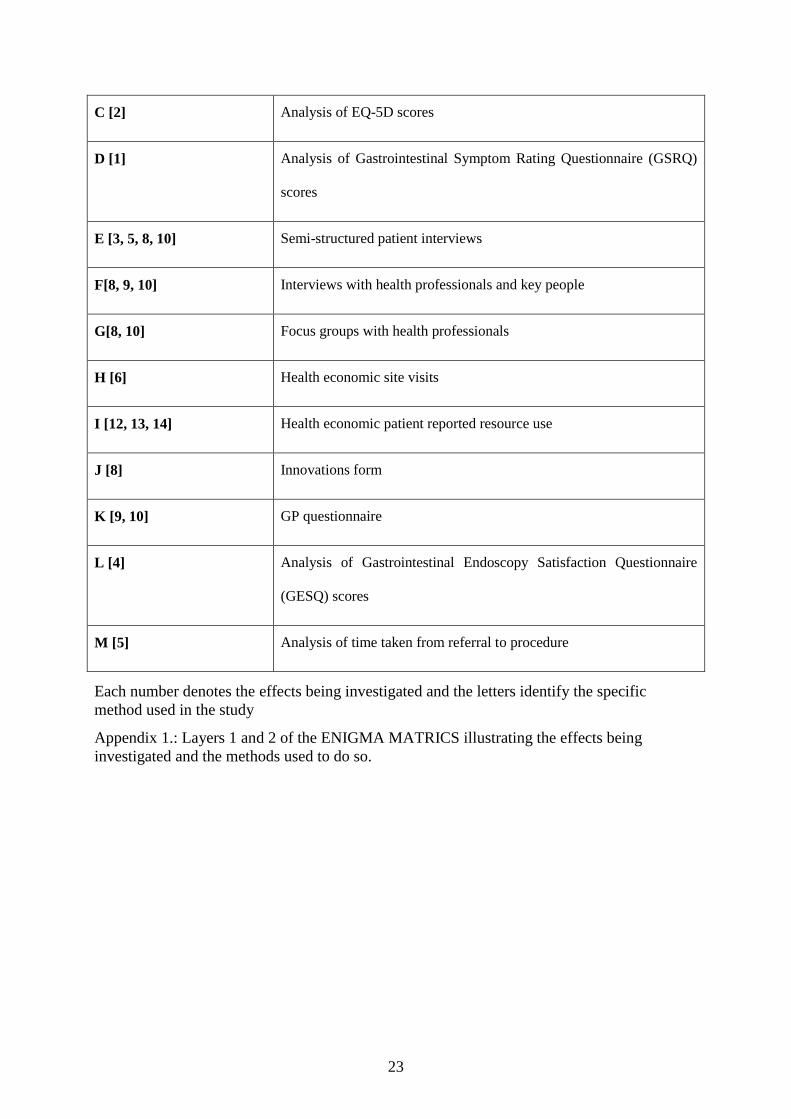
numerical effect code alongside the method code in layer 2. In Appendix 2 we illustrate the
findings from the study (broken down into effects on patients, effects on endoscopy services
and effects on the health service and society) using the alphanumeric code built in layers 1
and 2. For example, the first row, related to effects on patients shows that: “3E, 5E, 5M, 8E,
9E, 9F, - access to and acceptability of endoscopy services have improved with shorter
waiting times, greater throughput, more patient information, more responsiveness to patient
views, and better communication between reception staff and patients”. This means that to
examine four different effects: 3- patient experience of the referral process; 5- waiting times;
8- organisation, function and process of service delivery; and 9- accessibility of services, we
used three different methods: E- semi-structured patient interviews; F- interviews with health
13
professionals and key people; and M- analysis of time taken from referral to procedure. We
generated comparable findings regarding the access to, and acceptability of, endoscopy
services.
3.2 CASE STUDY 2 – MINuET
The findings from the Multi-Institutional Nurse Endoscopy Trial (MINuET) [15] on the
clinical effectiveness and cost-effectiveness of nurse endoscopists were published as a Health
Technology Assessment (HTA) monograph[15] and in the British Medical Journal as two
separate articles[19,20].
The MINuET study was an RCT comparing the clinical and cost-effectiveness of doctors and
nurses undertaking upper and lower gastrointestinal endoscopy in 23 endoscopy units in
England, Scotland and Wales. We used this trial to test the MATRICS approach in practice
because the ENIGMA team had access to both the raw data and the detailed findings.
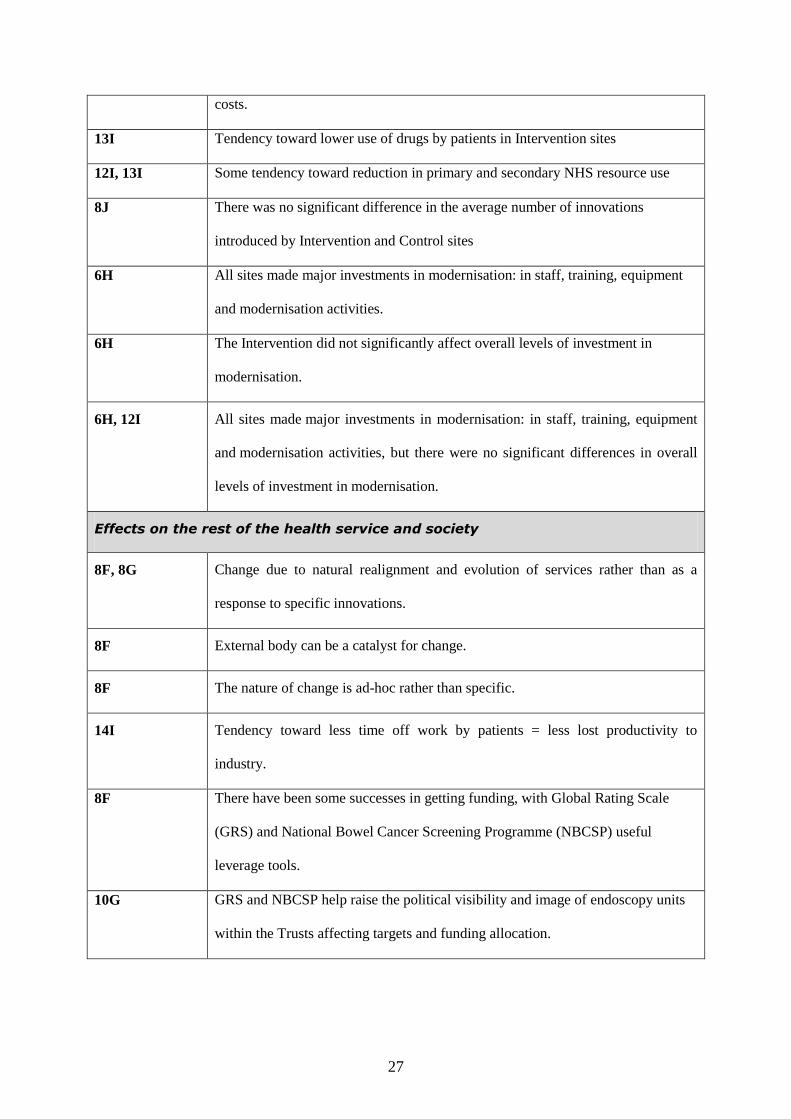
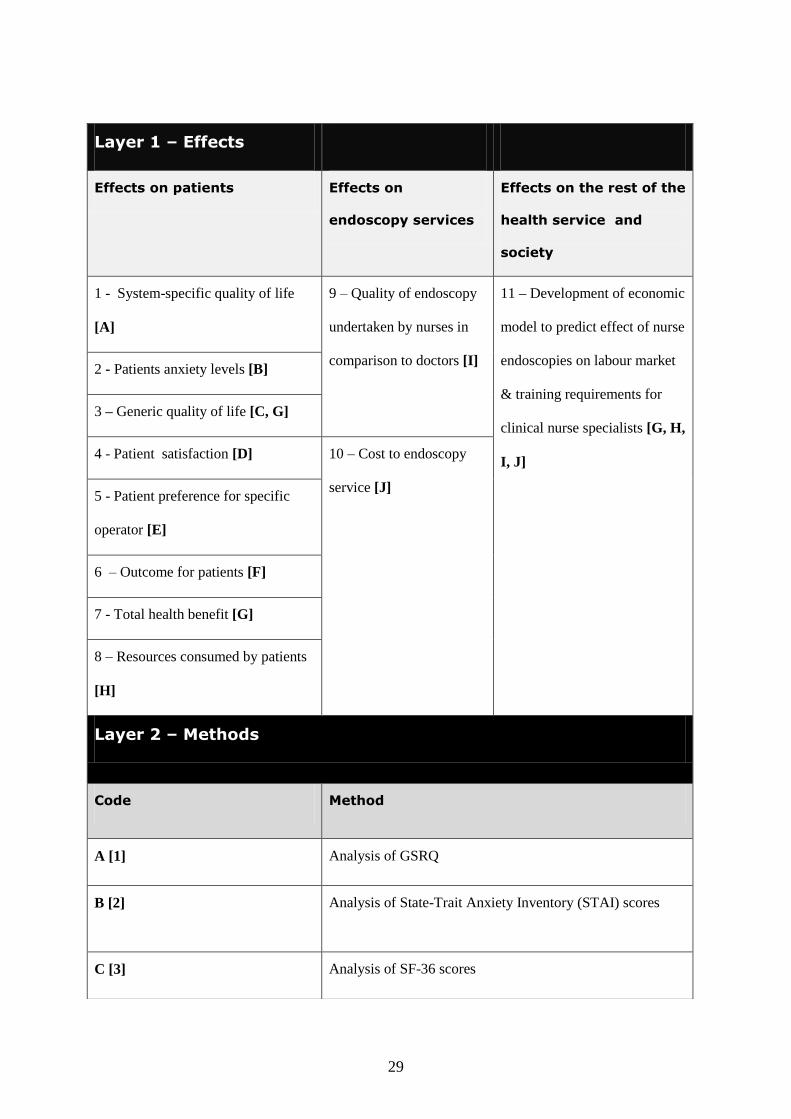
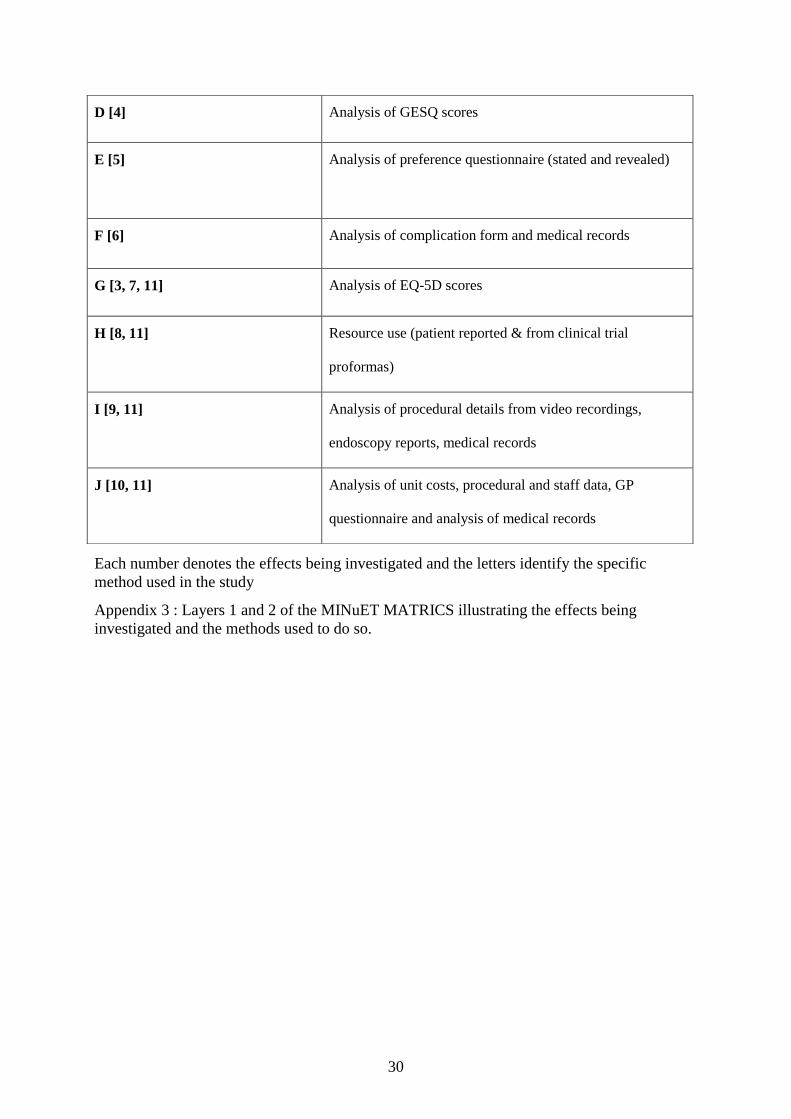
Appendix 3 and 4 summarise layers 1-3 of the MINuET MATRICS. We present the findings
again related to effects on patients, effects on endoscopy services, and effects on the rest of
society. In layer 1 (Appendix 3) of tMATRICS we illustrate that 11 effects were investigated
in the MINuET trial. In layer 2 we list the 10 specific methods (from A to J) that we used to
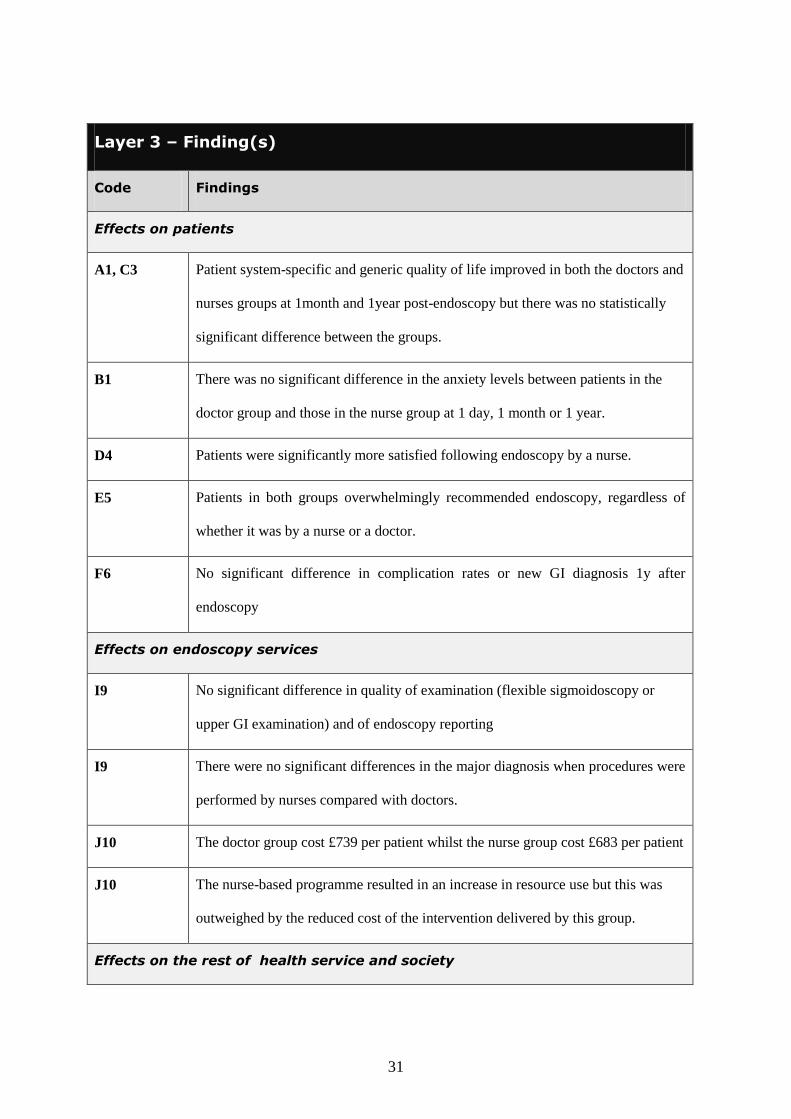
explore these effects. We illustrate the findings from the MINuET trial in layer 3 (Appendix
4 ). We show, for example, that we measured the effect on patient quality of life (system-
specific [1] and generic [3]) using the Gastrointestinal Symptom Rating Questionnaire
(GSRQ) [A] and the Short-Form 36 (SF-36) [C] tools. Our findings concluded that “1A, 3C -
system-specific and generic quality of life improved in both the doctors and nurses groups at
14
one month and one year post endoscopy but there we found no statistically significant
difference between the groups”.
4. DISCUSSION
Our experience with the ENIGMA study illustrates that the MATRICS approach can facilitate
the synthesis of findings from complex studies and is particularly useful when the study uses
multiple methods. We also tested MATRICS on the findings reported by the MINuET study.
Whilst this RCT was not as complex as the ENIGMA study, we successfully applied
MATRICS to synthesise the findings from MINuET to produce clear statements that did not
disproportionately represent just aspect of the trial.
The MATRICS tool has four main strengths. First it makes users consider whether study
findings can be combined in a coherent statement. Second, it clarifies which components of
the study generate complementary findings by providing a simple synthesis of those results
with easy identification of their origins. Third it helps present opposing findings by listing
incongruent results separately but adjacent to one another. Finally its completion does not
require formal meta-analysis of quantitative data to produce a common finding; instead it
uses sentences which summarise the findings of each facet of the study and, where findings
are consistent or even repetitious, it facilitates their synthesis. The summative presentation of
findings and clustering also draws out and clarifies discrepancies.
By reporting results in one or two summary sentences, MATRICS presents easily
understandable results, without requiring readers to study complex figures and tables. As
both quantitative and qualitative results can be synthesised into one finding, it does not
inadvertently bias the findings towards one paradigm but instead clearly illustrates the
15
different methodologies and balances the effects of findings. We present this balancing of the
findings as a strength of MATRICS but it may also be considered as a weakness. It may be
that results from some methods are presented with less certainty than others and users should
bear this in mind when discussing their MATRICS findings.
In economic terms, MATRICS can be regarded as a visual presentation of Cost-Consequence
Analysis (CCA). Although the more powerful technique of Cost Utility Analysis (CUA)
provides clearer conclusions by identifying the incremental cost of producing an additional
unit of health benefit (usually a quality-adjusted life year), it does not take account of non-
health benefits or differences in process utility from different approaches to service delivery,
– both of which may be valued and thus important to decision makers.
We believe that the MATRICS proforma in Figure 1 would be suitable for many types of
study. It is also feasible to use MATRICS to classify prior hypotheses as a yardstick for
future outcomes. Nevertheless, we recommend further testing across different study designs
and in fields like public health and health promotion to ensure that the tool is equally useful
there. User should edit the column headings in layers 1 and 3 to reflect the service or
specialty that they are studying, so long as they honour the principles to be applied to those
layers. In our case studies, we evaluated the impact of two interventions on endoscopy
services and altered those column titles accordingly. Users may also find it helpful to replace
the letters that define individual methods by short abbreviations like IV for interviews and FG
for focus groups.
16
5. CONCLUSION
We have shown that the MATRICS tool provides a useful structure for reporting the results
of complex or multiple-method studies. We expect further application of this methodology to
confirm that this reporting tool improves a readers’ understanding of studies and their
findings.
Main text word count (excluding abstract, tables and references)= 2555
6. STATEMENT OF COMPETING INTERESTS
None of the authors has any competing interests.
7. AUTHORS’ CONTRIBUTIONS
HH led thewriting of the paper. ITR conceived the MATRICS; ITR and GSJ developed and
applied the MATRICS for the ENIGMA study; KT compiled the MATRICS in the ENIGMA
final report; KT and DD applied the MATRICS to the MINuET study; JGW was the chief
investigator of both ENIGMA and MINuET studies; all other authors contributed their
ENIGMA study results to the MATRICS and commented on all drafts of the paper.
8. DETAILS OF FUNDING
The ENGIMA study was supported by the National Institute for Health Research Service
Delivery and Organisation programme [Grant number: NETSCC ref 08/1304/46]. The
MINuET study was supported by the National Institute for Health Research Health
Technology Asssessment Programme [Grant number NETSCC ref 97/37/09].
17
9. DEPARTMENT OF HEALTH DISCLAIMER
The views and opinions expressed herein are those of the authors and do not necessarily
reflect those of the Department of Health.
10. REFERENCES
1. O'Cathain A, Murphy E, Nicholl J (2007) Why, and how, mixed methods research is
undertaken in health services research in England: a mixed methods study. BMC
Health Services Research: 85.
2. Gray J, Densten I (1998) Integrating quantitative and qualitative analysis using latent and
manifest variables. Quality and Quantity 32: 419-431.
3. Bryman A (2007) Barriers to integrating quantitative and qualitative research. J Mix
Methods Res 1: 8-22.
4. Mays N, Pope C, Popay J (2005) Systematically reviewing qualitative and quantitative
evidence to inform management and policy-making in the health field. J Health Serv
Res Policy 10: 6-20.
5. Moher D, Cook DJ, Eastwood S, Olkin I, Rennie D, et al. (1999) Improving the quality of
reports of meta-analyses of randomised controlled trials: the QUOROM statement.
Quality of Reporting of Meta-analyses. Lancet 354: 1896-1900.
6. Sandelowski M, Barroso J (2003) Creating metasummaries of qualitative findings. Nurs
Res 52: 226-233.
7. Finlayson KW, Dixon A (2008) Qualitative meta-synthesis: a guide for the novice. Nurse
Res 15: 59-71.
18
8. O'Cathain A, Murphy E, Nicholl J (2008) The quality of mixed methods studies in health
services research. J Health Serv Res Policy 13: 92-98.
9. Craig P, Dieppe P, Macintyre S, Michie S, Nazareth I, et al. (2008) Developing and
evaluating complex interventions: the new Medical Research Council guidance. Bmj
337: a1655.
10. Rapport F, Doel MA, P. W (2008) The Doctor's Tale: Enacted Workspace and the General
Practitioner. Forum: Qualitative Social Research 9: Article 2.
11. Happ MB, Dabbs AD, Tate J, Hricik A, Erlen J (2006) Exemplars of mixed methods data
combination and analysis. Nurs Res 55: S43-49.
12. Moffatt S, White M, Mackintosh J, Howel D (2006) Using quantitative and qualitative
data in health services research - what happens when mixed method findings conflict?
[ISRCTN61522618]. BMC Health Serv Res 6: 28.
13. O'Cathain A, Murphy E, Nicholl J (2010) Three techniques for integrating data in mixed
methods studies. Bmj 341: c4587.
14. Williams JG, Cheung WY, Cohen D, Hutchings H, Jerzembek G, et al. (2008) Evaluating
innovations in the delivery and organisation of gastroenterology services initiated
directly or indirectly by the Modernising Endoscopy Services programme of the NHS
Modernisation Agency: (ENIGMA). Southamptom: National Institute for Health
Research Service Delivery and Organisation.
15. Williams J, Russell I, Durai D, Cheung WY, Farrin A, et al. (2006) What are the clinical
outcome and cost-effectiveness of endoscopy undertaken by nurses when compared
with doctors? A Multi-Institution Nurse Endoscopy Trial (MINuET). Health Technol
Assess.

19
16. Thorne K, Hutchings HA, Elwyn G (2010) An independent evaluation of the
modernization of NHS endoscopy services in England: data poverty and no
improvement. J Eval Clin Pract 16: 693-699.
17. Rapport F, Jerzembek G, Seagrove A, Hutchings H, Russell I, et al. (2010) Evaluating
innovations in the delivery and organization of endoscopy services in England and
Wales. Qual Health Res 20: 922-930.
18. Rapport F, Seagrove AC, Hutchings HA, Russell IT, Cheung I, et al. (2012) Barriers and
facilitators to change in the organisation and delivery of endoscopy services in
England and Wales: a focus group study. BMJ Open 2012;2:e001009. doi:10.1136/
bmjopen-2012-001009
19. Richardson G, Bloor K, Williams J, Russell I, Durai D, et al. (2009) Cost effectiveness of
nurse delivered endoscopy: findings from randomised multi-institution nurse
endoscopy trial (MINuET). Bmj 338: b270.
20. Williams J, Russell I, Durai D, Cheung WY, Farrin A, et al. (2009) Effectiveness of nurse
delivered endoscopy: findings from randomised multi-institution nurse endoscopy trial
(MINuET). Bmj 338: b231.
20
Layer 1 – Effects sought1
Effects on patients Effects on the healthcare specialty being investigated
Effects on the rest of the health service and society
1 Derived from the aims and objectives of the study.
Layer 2 – Methods used
Code Method
Layer 3 – Findings reported
Code(s) Findings
Effects on patients
Effects on the healthcare specialty being investigated
Effects on the rest of the health service and society
Method for Aggregating the Reporting of Interventions in Complex Studies (MATRICS)

21
Figure 1: The MATRICS proforma. The “Effects on the healthcare specialty being
investigated” can be adapted to suit the particular needs of the study using it e.g.
diabetes clinic or emergency department..
22
Layer 1 – Effects
Effects on patients Effects on endoscopy services Effects on the rest of
the health service and
society
1 - Patient Quality of Life
[B,D]
6 - Cost of modernisation [H] 14 – Patients’ time off
work [I]
2 - Health gain [C] 7 – Service performance [A]
3 - Patient experience of
referral process [E]
8 – Organisation, function and process
of service delivery [E, F, G, J]
4 – Patient satisfaction with
endoscopy [L]
9 – Accessibility of services [E, F, K]
5 – Waiting times [E, M] 10 – Appropriateness and acceptability
of services [F, G, K]
11 – Reliability and availability of
routinely collected process data [A]
12 – Patient use of drugs [I]
13 – Patient use of primary and
secondary care resources [I]
Layer 2 – Methods
Code Method
A [7, 11] Process data analysis
B [1] Analysis of SF-36 scores
23
C [2] Analysis of EQ-5D scores
D [1] Analysis of Gastrointestinal Symptom Rating Questionnaire (GSRQ)
scores
E [3, 5, 8, 10] Semi-structured patient interviews
F[8, 9, 10] Interviews with health professionals and key people
G[8, 10] Focus groups with health professionals
H [6] Health economic site visits
I [12, 13, 14] Health economic patient reported resource use
J [8] Innovations form
K [9, 10] GP questionnaire
L [4] Analysis of Gastrointestinal Endoscopy Satisfaction Questionnaire
(GESQ) scores
M [5] Analysis of time taken from referral to procedure
Each number denotes the effects being investigated and the letters identify the specific
method used in the study
Appendix 1.: Layers 1 and 2 of the ENIGMA MATRICS illustrating the effects being
investigated and the methods used to do so.

24
Layer 3 – Findings (as reported in ENIGMA final report)
Code Finding(s)
Effects on patients
3E, 5E, 5M, 8E,
9E, 9F
Access to and acceptability of endoscopy services have improved greater
throughput, more patient information, more responsiveness to patient views and
better communication between reception staff and patients.
1B Patients had improved SF-36 PCS and MCS 12m following endoscopy but there
was no significant difference between Intervention and Control groups (SF36
PCS, p = 0.92; MCS, p = 0.42)
5M There was a significant difference in overall waiting times between Intervention
and Control sites (60.04 days Vs. 66.96 days, p = 0.002).
3E ‘Urgent’ patients satisfied with waiting time. Majority of non-urgent patients
satisfied with waiting time. Fewer patients saying they would like procedure
sooner.
3E No change in experience for patients who had had previous endoscopy
9F, 10F There is greater commitment to patient satisfaction and involvement.
10F Difficult to assess if patients are at the centre of ‘quality agenda’ or benefit as
units strive to reach targets.
10G External/government targets implemented through Trusts and management force
clinicians to concentrate predominantly on meeting targets rather than focussing
on patient care.
4L There were no differences between Intervention and Control groups in patient
satisfaction as measured by the GESQ following endoscopy
5M There were significant differences in patient waiting times between Intervention
and Control groups. These favoured the Intervention group for the first four
25
waves of recruitment and the Control group for Wave 5.
1D Patients had fewer GI symptoms as measured by GSRQ 12m following
endoscopy but there were no significant differences between Intervention and
Control groups for any of the GSRQ measures (GSRQ1, p = 0.74; GRSQ2, p =
0.52; GSRQ3, p = 0.46; GSRQ4, p = 0.99).
2C Patients had improved EQ-5D 12m following endoscopy but there were no
significant differences between Intervention and Control groups.
Effects on endoscopy services
10F MES Programme training offered too early by ill prepared teachers and project
staff lacked credibility.
9F Some Government targets helped put endoscopy in spotlight. Others impact
negatively on some patients
10F Working relationships of staff sharing endoscopy improving but still some
resistance from clinicians
10F Strong leadership, communication, staff ownership important in introducing
change
8F Training important to update staff and ensure appropriate skill mix but time,
sparse financial resources and insufficient staff impede this
10F Staff respond positively, are supportive and co-operative and welcome the
challenge of new ways of working
9K There was no significant difference between GPs who referred patients to
Intervention and Control sites regarding perception of accessibility to services
10K There was no significant difference between the GPs who referred to the
Intervention and Control sites regarding appropriateness and acceptability of
services
8F Ongoing financial constraints that lead to crisis management, ad hoc change, and
make forward planning difficult

26
9F Lack of resources impacts on staffing, equipment, information technology and
facilities
8F Some change processes are cost neutral
8G Discord between members of staff from various specialties using endoscopy units.
8G, 10G Welsh units see themselves as lagging behind their English counterparts, but are
learning from the successes and mistakes.
8G Changes to improve processes, such as pooled lists, did not require additional
resources.
8G Lack of recognition and appreciation of professionals by management and Trusts
lead to disillusionment amongst senior clinicians; an erosion of professional self-
identity.
8G, 10G Resource deficits and allocation of funds based on poorly informed decisions.
8G, 10G Lack of management involvement and/ or interest in clinical processes and patient
care
7A There was no statistically significant improvement in the delivery of endoscopy
services in Intervention sites
7A There was no statistically significant improvement in the delivery of endoscopy
services in Control sites
7A There was no significant difference between the endoscopy services of the
Intervention and Control sites at any time
11A Process data was not routinely collected by many endoscopy units, but especially
not by the Intervention sites
11A The majority of routinely collected process data from endoscopy units and Trusts
was highly comparable with the equivalent Hospital Episode Statistics (HES)
datasets
12I Overall resource investments in modernisation in terms of one-off costs,
investments which produce a flow of benefits and increase in annual revenue
27
costs.
13I Tendency toward lower use of drugs by patients in Intervention sites
12I, 13I Some tendency toward reduction in primary and secondary NHS resource use
8J There was no significant difference in the average number of innovations
introduced by Intervention and Control sites
6H All sites made major investments in modernisation: in staff, training, equipment
and modernisation activities.
6H The Intervention did not significantly affect overall levels of investment in
modernisation.
6H, 12I All sites made major investments in modernisation: in staff, training, equipment
and modernisation activities, but there were no significant differences in overall
levels of investment in modernisation.
Effects on the rest of the health service and society
8F, 8G Change due to natural realignment and evolution of services rather than as a
response to specific innovations.
8F External body can be a catalyst for change.
8F The nature of change is ad-hoc rather than specific.
14I Tendency toward less time off work by patients = less lost productivity to
industry.
8F There have been some successes in getting funding, with Global Rating Scale
(GRS) and National Bowel Cancer Screening Programme (NBCSP) useful
leverage tools.
10G GRS and NBCSP help raise the political visibility and image of endoscopy units
within the Trusts affecting targets and funding allocation.

28
Appendix 2: Layer 3 of the ENIGMA MATRICS illustrating the findings of the study. All
analogous findings are synthesised into one row which has a general statement of the findings
and the alphanumeric codes applied to those results when they were individual findings. All
contradictory or dissimilar findings are reported adjacent to each other.
29
Layer 1 – Effects
Effects on patients Effects on
endoscopy services
Effects on the rest of the
health service and
society
1 - System-specific quality of life
[A]
9 – Quality of endoscopy
undertaken by nurses in
comparison to doctors [I]
11 – Development of economic
model to predict effect of nurse
endoscopies on labour market
& training requirements for
clinical nurse specialists [G, H,
I, J]
2 - Patients anxiety levels [B]
3 – Generic quality of life [C, G]
4 - Patient satisfaction [D] 10 – Cost to endoscopy
service [J] 5 - Patient preference for specific
operator [E]
6 – Outcome for patients [F]
7 - Total health benefit [G]
8 – Resources consumed by patients
[H]
Layer 2 – Methods
Code Method
A [1] Analysis of GSRQ
B [2] Analysis of State-Trait Anxiety Inventory (STAI) scores
C [3] Analysis of SF-36 scores
30
Each number denotes the effects being investigated and the letters identify the specific
method used in the study
Appendix 3 : Layers 1 and 2 of the MINuET MATRICS illustrating the effects being
investigated and the methods used to do so.
D [4] Analysis of GESQ scores
E [5] Analysis of preference questionnaire (stated and revealed)
F [6] Analysis of complication form and medical records
G [3, 7, 11] Analysis of EQ-5D scores
H [8, 11] Resource use (patient reported & from clinical trial
proformas)
I [9, 11] Analysis of procedural details from video recordings,
endoscopy reports, medical records
J [10, 11] Analysis of unit costs, procedural and staff data, GP
questionnaire and analysis of medical records
31
Layer 3 – Finding(s)
Code Findings
Effects on patients
A1, C3 Patient system-specific and generic quality of life improved in both the doctors and
nurses groups at 1month and 1year post-endoscopy but there was no statistically
significant difference between the groups.
B1 There was no significant difference in the anxiety levels between patients in the
doctor group and those in the nurse group at 1 day, 1 month or 1 year.
D4 Patients were significantly more satisfied following endoscopy by a nurse.
E5 Patients in both groups overwhelmingly recommended endoscopy, regardless of
whether it was by a nurse or a doctor.
F6 No significant difference in complication rates or new GI diagnosis 1y after
endoscopy
Effects on endoscopy services
I9 No significant difference in quality of examination (flexible sigmoidoscopy or
upper GI examination) and of endoscopy reporting
I9 There were no significant differences in the major diagnosis when procedures were
performed by nurses compared with doctors.
J10 The doctor group cost £739 per patient whilst the nurse group cost £683 per patient
J10 The nurse-based programme resulted in an increase in resource use but this was
outweighed by the reduced cost of the intervention delivered by this group.
Effects on the rest of health service and society

32
Appendix 4: Layer 3 of the MINuET MATRICS illustrating the findings of the study. All
analogous findings are synthesised into one row which has a general statement of the findings
and the alphanumeric codes applied to those results when they were individual findings. All
contradictory or dissimilar findings are reported adjacent to each other.
G11, H11,
I11, J11
An economic model to predict effect of nurse endoscopies on labour market &
training requirements for clinical nurse specialists