Embed Size (px)
Citation preview
CroniconO P E N A C C E S S NEUROLOGY
Research Article
Albert Maarek1*, Pratiksha G Gandhi2 and Pr Gundu HR Rao3
1Research and development LD Technology, USA2Cardiologist, India3University of Minnesota, USA
Received: July 15, 2015; Published: September 30, 2015
*Corresponding Author: Albert Maarek, Research and development LD Technology, USA.
Identifying Autonomic Neuropathy and Endothelial Dysfunction in Type II Diabetic Patients
Abstract
Objectives: Previous studies of TM-Oxi and SudoPath systems have presented methods measuring autonomic nervous system and endothelial functions, and how the impairment of those functions were associated with type 2 diabetes Mellitus (T2DM) and Coro-nary Artery Disease (CAD).
This study aims to complement previous studies performed at the University of Miami, (Florida, USA) and IPC Heart Care Centers in Mumbai (India) with a larger sample population and further analysis of each markers used. Our previous studies using TM-Oxi and SudoPath devices showed high specificity and sensitivity markers comparing a group of healthy people versus a T2DMand CAD peo-ple, and if this current study with a cohort of patients confirms the same findings, then the markers of these devices will be needed for the early detection of diabetes and its complications.
The SudoPath system uses a galvanic skin response technology to assess sudomotor function. Also, the TM-Oxi and SudoPath sys-tems calculate risk scores for cardiovascular autonomic neuropathy (CAN), sudomotor function, endothelial function and cardio metabolic.
Conclusion: TM-Oxi and SudoPath markers and score used are very reliable and distinguish diabetic populations from non-diabetic populations.
Results: The TM-Oxi and SudoPath markers and scores used to distinguish T2DM groups from control groups returned significantly high sensitivities and specificities in the previous studies, and maintained high sensitivities and specificities from our current and larger sample population.
Keywords: TM-Oxi; SudoPath; Type 2 Diabetes Mellitus; Coronary Artery Disease
Citation: Albert Maarek., et al. “Identifying Autonomic Neuropathy and Endothelial Dysfunction in Type II Diabetic Patients”. EC Neu-rology 2.2 (2015): 63-78.
Study Design and methods: One thousand and one (1096) patients were included in this double-blind study, and were grouped by diagnosis of T2DM. Patients in group 1 had been positively diagnosed with T2DM, whereas patients in group 2 had never previously been diagnosed with T2DM. All patients underwent the same experimental protocol. 743 patients were in group 1 (545 male) with a mean age of 54 and undergoing a diabetic treatment. 353 patients were in group 2 (194 male) with a mean age of 41. The 2 groups of patients underwent examination with the TM-Oxi and SudoPath system (LD Technology LLC). The TM-Oxi system provides markers of homeostasis based onA. The second derivative of the oximeter waveform (Photoplethysmography or PTG signal)B. The Fast Fourier Transform harmonic components of the PTG signalC. RR intervals (Time between each heart beat) at rest using the heart rate variability (HRV) analysisD. RR intervals and change in blood pressure during Ewing Tests (Valsalva maneuver, Deep breathing and change in Posture).
Identifying Autonomic Neuropathy and Endothelial Dysfunction in Type II Diabetic Patients64
Citation: Albert Maarek., et al. “Identifying Autonomic Neuropathy and Endothelial Dysfunction in Type II Diabetic Patients”. EC Neu-rology 2.2 (2015): 63-78.
Current Type 2 Diabetes Mellitus (T2DM) diagnostic standards discriminate diabetics at a point that is too late to account for the damage already caused by insulin resistance and progressive beta cell dysfunction. While current treatments demonstrate effectiveness in preventing microcirculatory complications (retinopathy and nephropathy), these treatments do not prevent underlying diabetic con-ditions that lead to cardiovascular diseases [1].
As of March 2013, about 26 million people in the United States had been diagnosed with diabetes [2]. The diabetic population has grown exponentially since the mid-to-late 1990s, and this trend is expected to continue as an estimated 79 million Americans are pre-diabetic [2]. Currently, estimates of health care and productivity costs of the diabetic population are around $245 billion [2]. Costs will only continue to rise with the growth of the diabetic population. These statistics are not exclusive to the United States either. An esti-mated 382 million people worldwide are diabetic, and this number is expected to rise to 590 million by 2035 [2].
Estimates of health care and productivity costs in the US alone are $245 billion per year, which is expected to increase as over 70 mil-lion Americans are pre-diabetic, roughly 20% of the total American population. Additionally, the American Diabetes Association reports 65% of the diabetic population will die from a heart-related disease [3].
Clearly, these diagnostic standards and treatment strategies have not been able to combat the number of incidences of T2DM as pre-dictive models show T2DM populations will continue to grow, increasing the economic burden on health care systems worldwide.
In this study we propose additional pathogenic manifestations in the autonomic nervous system (ANS) and endothelial layers of peripheral vasculature temporally parallel manifestations of insulin resistance and beta cell dysfunction. Non-invasive and cost-effective examinations could identify ANS and endothelial dysfunction prior to diagnosis of T2DM and to monitoring its treatment using the cur-rent standards in order to ultimately counteract the T2DM pandemic occurring globally.
Standards such as glycated hemoglobin (HbA1c), fasting plasma glucose (FPG), and Oral glucose tolerance tests (OGTT) aid in iden-tifying irregular blood-glucose content and metabolism and are currently the standard for determining the presence of T2DM [4]. How-ever, not only is reliability of these measurements somewhat questionable, a correct diagnosis of T2DM using these markers would result only in management and palliative treatment of the disease and its symptoms, as the damage is often irreversible [5]. In addition, management of hyperglycemia often requires a combination of pharmaceutical therapies to achieve a target HbA1c, FPG, or other value. Target values are highly variable per patient and can be compromised due to compounding pathogenic expressions. Therefore, there is a clear need for reliable detection of damage prior to the onset of glucose-insulin imbalances observed through blood tests.
In this study we present several methods for identifying autonomic and endothelial dysfunctions in a diabetic population versus con-trol group. These methods are non-invasive, present minimal cost, and take only a few minutes to complete. Our goal is to demonstrate the difference in autonomic and endothelial function between diabetic with or without complications and non-diabetic groups using our methods from a sample population of one-thousand-and-ninety-six patients from the IPC health care centers in Borivali, Parel and Kaly-an India participated. While further longitudinal studies are necessary to understand the full capacity of these methods, previous studies showed high specificity and sensitivity between the 2 populations, [5,6], if implemented on a large scale, patient care can be adapted to suit a more individualized treatment regimen and perhaps assuage high mortality rates and economic burdens of the T2DM pandemic.
Given this information, current institutional strategies to approach diagnosis and treatment management or monitoring of diabetes are not effective.
Introduction
Methods and Materials
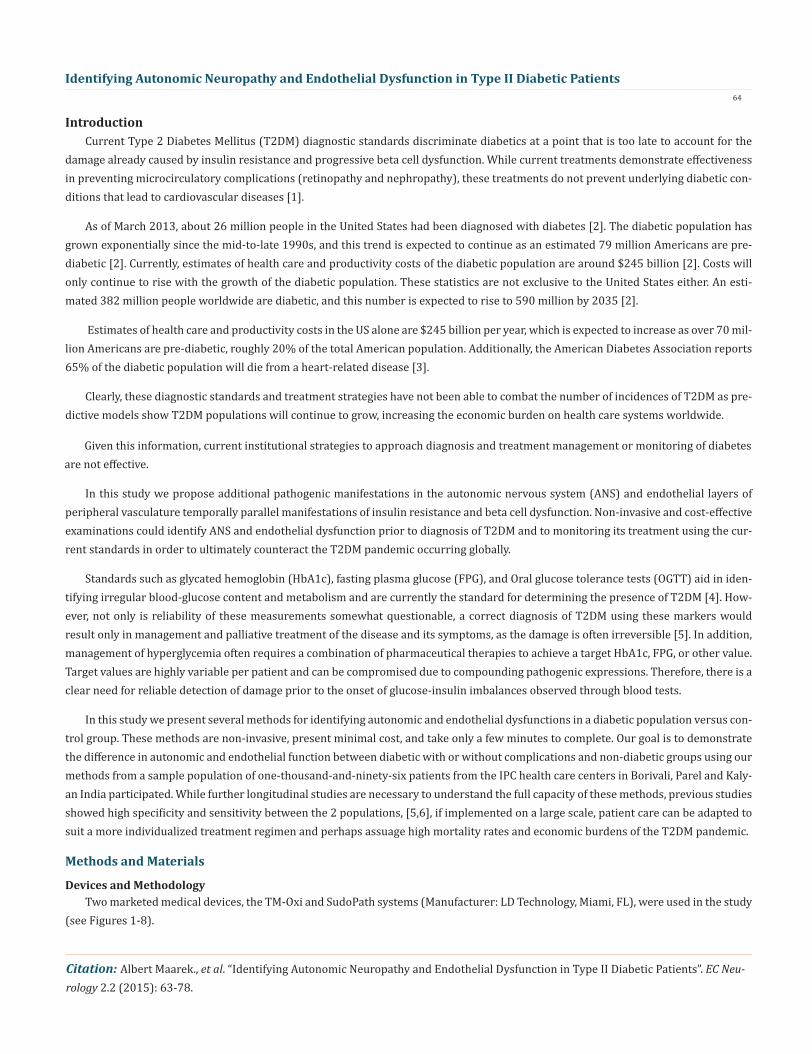
Devices and MethodologyTwo marketed medical devices, the TM-Oxi and SudoPath systems (Manufacturer: LD Technology, Miami, FL), were used in the study
(see Figures 1-8).
Identifying Autonomic Neuropathy and Endothelial Dysfunction in Type II Diabetic Patients65
Citation: Albert Maarek., et al. “Identifying Autonomic Neuropathy and Endothelial Dysfunction in Type II Diabetic Patients”. EC Neu-rology 2.2 (2015): 63-78.
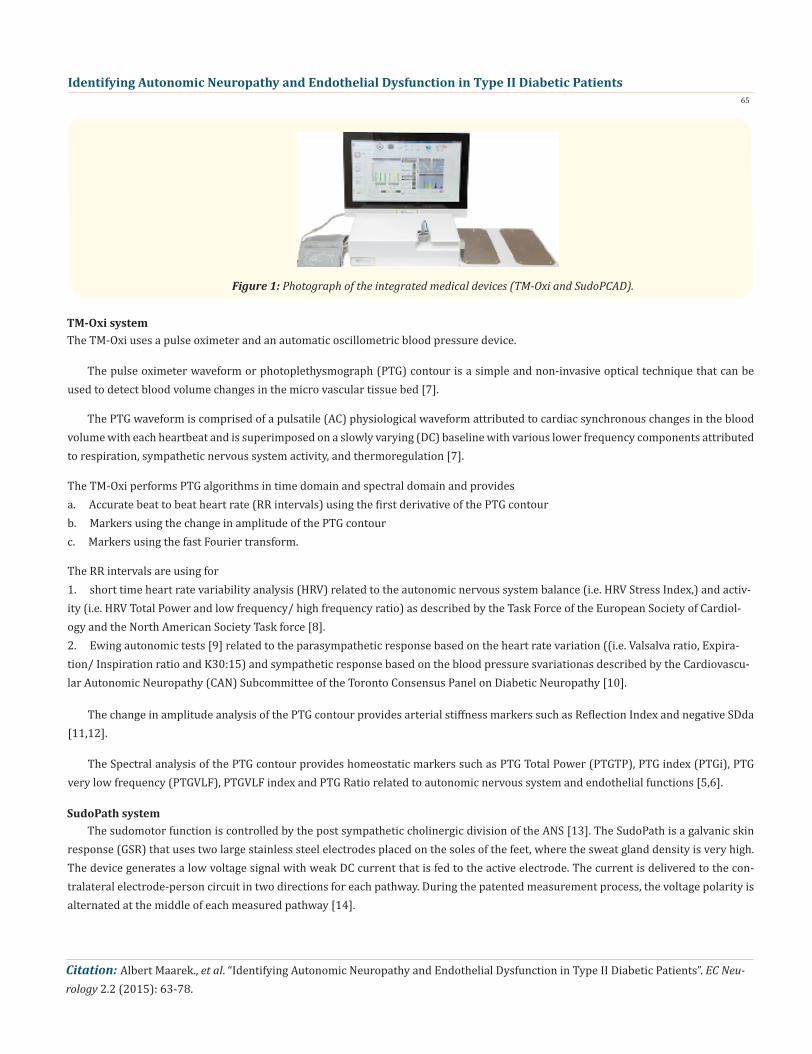
Figure 1: Photograph of the integrated medical devices (TM-Oxi and SudoPCAD).
The TM-Oxi uses a pulse oximeter and an automatic oscillometric blood pressure device.
The pulse oximeter waveform or photoplethysmograph (PTG) contour is a simple and non-invasive optical technique that can be used to detect blood volume changes in the micro vascular tissue bed [7].
The PTG waveform is comprised of a pulsatile (AC) physiological waveform attributed to cardiac synchronous changes in the blood volume with each heartbeat and is superimposed on a slowly varying (DC) baseline with various lower frequency components attributed to respiration, sympathetic nervous system activity, and thermoregulation [7].
TM-Oxi system
The TM-Oxi performs PTG algorithms in time domain and spectral domain and provides a. Accurate beat to beat heart rate (RR intervals) using the first derivative of the PTG contour b. Markers using the change in amplitude of the PTG contour c. Markers using the fast Fourier transform.
The RR intervals are using for 1. short time heart rate variability analysis (HRV) related to the autonomic nervous system balance (i.e. HRV Stress Index,) and activ-ity (i.e. HRV Total Power and low frequency/ high frequency ratio) as described by the Task Force of the European Society of Cardiol-ogy and the North American Society Task force [8]. 2. Ewing autonomic tests [9] related to the parasympathetic response based on the heart rate variation ((i.e. Valsalva ratio, Expira-tion/ Inspiration ratio and K30:15) and sympathetic response based on the blood pressure svariationas described by the Cardiovascu-lar Autonomic Neuropathy (CAN) Subcommittee of the Toronto Consensus Panel on Diabetic Neuropathy [10].
The change in amplitude analysis of the PTG contour provides arterial stiffness markers such as Reflection Index and negative SDda [11,12].
The Spectral analysis of the PTG contour provides homeostatic markers such as PTG Total Power (PTGTP), PTG index (PTGi), PTG very low frequency (PTGVLF), PTGVLF index and PTG Ratio related to autonomic nervous system and endothelial functions [5,6].
SudoPath systemThe sudomotor function is controlled by the post sympathetic cholinergic division of the ANS [13]. The SudoPath is a galvanic skin
response (GSR) that uses two large stainless steel electrodes placed on the soles of the feet, where the sweat gland density is very high. The device generates a low voltage signal with weak DC current that is fed to the active electrode. The current is delivered to the con-tralateral electrode-person circuit in two directions for each pathway. During the patented measurement process, the voltage polarity is alternated at the middle of each measured pathway [14].

Identifying Autonomic Neuropathy and Endothelial Dysfunction in Type II Diabetic Patients66
Citation: Albert Maarek., et al. “Identifying Autonomic Neuropathy and Endothelial Dysfunction in Type II Diabetic Patients”. EC Neurology 2.2 (2015): 63-78.
Process of measurement
Initial calibration
Baseline recording
Valsalva maneuver recording
Deep breathing recording
K30/15 Recording
During testing, two surface electrodes are attached to the patient’s feet. Additionally, the pulse oximeter is attached to the index finger of the patient and a blood pressure cuff is put on the patient’s arm contralateral to that of the pulse oximeter. When the recording is started, the software collects signals from these three devices and saves the recordings for further interpretation.
The initial calibration ensures the blood pressure measurements are synchronized with the recordings of the PTG waveform.
Throughout the baseline recording, the patient is sitting. The PTG wave form and GSR are recorded over roughly two minutes. Su-domotor test values as well the RR intervals are displayed in real time.
Unlike the sympathetic skin response method which can measures the emotions of the patient, the SudoPath provides a quantita-tive evaluation of the sudomotor function by measuring the induced sweat output following a controlled and constant electrical stimu-lus of the skin small autonomic unmyelinated nerve (C-fiber) and microcirculation. The sweat output response is expressed in voltage or micro Siemens [14,15].
The microcirculation marker is named Electro Skin Response nitric oxide (ESRNO) and cholinergic fiber (C-Fiber) density markers are the Electro Skin Response latency (ESR L) and the Peak Conductance (Peak C)[14].
Immediately before beginning the Valsalva recording, the patient is asked to blow up in a manometer with a pressure of 40 mmHg for 15 seconds. During this time, the PTG waveform is recorded. Shortly after this initial 15 seconds, an oscillometric blood pressure measurement is made. The exhalation causes a pressure increase in the chest and forces blood into the left atrium. This reduces blood flow returning to the heart while also reducing cardiac output. To compensate, the heart rate should increase. Following pressure re-lease, aortic blood volume and cardiac output increases as heart rate returns to more normal values.
Throughout the Deep Breathing recording, the patient is asked to alternate inhaling for 5 seconds and exhaling for 5 seconds over a total of 60 seconds. In this recording, only the PTG measurements are made. From this measurement, respiratory induced control over heart rate can be monitored and taken into consideration when developing markers for autonomic function.
Immediately before beginning the K30/15 recording, the patient is asked to stand up. While standing, the PTG waveform is record-ed and an oscillometric blood pressure measurement is made. By standing up, the parasympathetic system would respond by altering the heart rate and the sympathetic system would responding by maintaining or increased the blood pressure. Measurements of this change can be analyzed to make inferences concerning autonomic function in response to posture changes.
Design of the Study
Inclusion criteria One thousand and nine six patients were included in this double-blind study and were grouped by diagnosis of T2DM. Patients in
group 1 had been positively diagnosed with T2DM, whereas patients in group 2 had never previously been diagnosed with T2DM. All patients underwent the same experimental protocol.
743 patients were in group 1 (545 male) with a mean age of 54 and undergoing a diabetic treatment. 353 patients were in group 2 (194 male) with a mean age of 41.

Identifying Autonomic Neuropathy and Endothelial Dysfunction in Type II Diabetic Patients67
Citation: Albert Maarek., et al. “Identifying Autonomic Neuropathy and Endothelial Dysfunction in Type II Diabetic Patients”. EC Neurology 2.2 (2015): 63-78.
All the patients have physical exams, medical history and symptoms, reflex tests and clinical context comprising known diagnosis, current treatment and underwent examination with the TM-Oxi and SudoPath systems at IPC health care centers in Borivali, Parel, and Kalyan (India) for assessing autonomic nervous system and endothelial function. Between each examination, all hardware attached to the patient was disinfected according to the manufacturer guidelines. Each patient underwent a TM-Oxi and SudoPath exam performed by trained technician with a good knowledge of the autonomic nervous system tests. The patients were measured at any time of the day without taking the fasting state into consideration. The study was conducted according to the ethical principles of the Declaration of Helsinki. All of the subjects provided written informed consent, and confidentiality was maintained for all subjects.
Exclusion Criteria
Software analysis to obtain markers
Only patients who were older than 18 years of age, could provide written informed consent, and presented no contraindications with the use of the experimental setup were included in this study. Contraindications included: use of an automatic external defibrilla-tor device; had erratic, accelerated, or mechanically-controlled irregular heart rhythms; had arterial fibrillation/flutter; had atrioven-tricular block; or had any implanted electronic device.
Once all recordings are completed, the software can analyze the collected data to compute risk scores, which are based off certain markers and calculations. The markers used in this study will stem from the HRV analysis, PTG contour, spectral analysis of the PTG contour, Ewing tests results, and the GSR.
General Demographic Table Diabetic group N = 757 Healthy subject N = 315 P valueMen/Women 545/212 154/90 NSAge (years) range 54 (+ 11) 41 (+ 13) P < 0.0001BMI (Kgm2) range 28.2 (+ 5.3) 24.4 (+ 3.8) P < 0.0001Systolic pressure (mmHg) 141.8 (+ 20.5) 127.0 (+ 14.8) P < 0.0001Diastolic pressure (mmHg) 80.0 (+ 13.6) 75.6 (+ 11.0) P < 0.0001
Table 1: Demographic information of sample population.
Duration of Diabetes and complications Percent of patientsDuration of diabetes > = 10 years 35 % Duration of diabetes > 5 years and < 10 years 45%Duration of diabetes < 5 years 20%Atherosclerosis associated to the Diabetes 25%Symptoms of small fiber neuropathy 23%Symptoms of cardiac autonomic neuropathy 18%Treatment of diabetic patients Metformin 78%Secretagogue 47%Insulin 38%Antihypertensive agents 65%Antilipidemic agents 65%Antiplatelet agents 35%
Table 2: Statistics of the T2DM group.

Identifying Autonomic Neuropathy and Endothelial Dysfunction in Type II Diabetic Patients68
Citation: Albert Maarek., et al. “Identifying Autonomic Neuropathy and Endothelial Dysfunction in Type II Diabetic Patients”. EC Neurology 2.2 (2015): 63-78.
Table 3: TM-Oxi and SudoPath analyzed markers.
Marker DescriptionPTGi The sum of the ‘very low frequency’, ‘low frequency’, and ‘high fre-
quency’ peak amplitudes from the FFT of the PPG waveform.PTGr The ratio of the ‘very low frequency’ peak amplitude to PTGi.PTGVLFi A marker normalizing the ‘very low frequency’ peak amplitude to
galvanic skin response measurements at the negative electrode.HRV Total Power Sum of all the 3 frequencies resulting from the spectral analysis of
the RR intervals Reflection Index (RI) Amplitude of the dicrotic notch and the maximum high of the wave. ESRNO The conductance measured from GSR at the negative electrode.CMR Score A score assigned to a patient’s examination, evaluating thecardio
metabolic risk.SMR Score A score assigned to a patient’s examination, evaluating thesmall
fiber neuropathy risk. PTG CVD A score assigned to a patient’s examination, evaluating the endothe-
lial dysfunction risk. CAN Score A score assigned to a patient’s examination, evaluating cardiac auto-
nomic neuropathy.
Scoring systemCMR (Cardio-metabolic Risk) score: The CMRScore is calculated using the following variables from the TM-Oxi: 1. Systolic 2. Diastolic blood pressure3. Body mass index (BMI)4. Arterial stiffness marker (RI)5. HRV markers (Stress Index, Total Power and LF/HF) 6. PTG spectral analysis marker (PTGTP).
Each variable is scored as 0 = normal, 1 = borderline, or 2 = abnormal to calculate the CMR score.SMR (SudoMotor Response) Score: The SMRScore is calculated using the following variables from the SudoPath: ESRNO, Peak C and ESR L.Each variable is scored as 0 = normal, 1 = borderline, or 2 = abnormal to calculate the SMR score.CAN (Cardiac autonomic neuropathy) Score: The CAN Score is calculated through the changes detected in the RR intervals during the 3 Ewing tests which provide 3 markers: Valsalva Ratio, E/I Ratio and K30/15. Each item is scored 0 = normal, 1 = borderline and 2 = abnormal to calculate the CAN score.
PTG CVD (PTG Cardiovascular disease) ScoreThe PTG spectral analysis provides 3 homeostatic markers: The sum of the amplitudes of all peaks is the PTG Index (PTGi). The
adjusted PTGVLF with ESRNO is the PTGVLF Index (PTGVLFi), and the Ratio of the amplitude PTGVLF / PTGi defined as PTG Ratio (PTG R)
Each item is scored 0 = normal, 1 = borderline and 2 = abnormal to calculate the PTG CVD score.
Results of Previous studies [5,6,14].

Identifying Autonomic Neuropathy and Endothelial Dysfunction in Type II Diabetic Patients69
Citation: Albert Maarek., et al. “Identifying Autonomic Neuropathy and Endothelial Dysfunction in Type II Diabetic Patients”. EC Neurology 2.2 (2015): 63-78.
Lewis., et al. Study [5] comparing diabetic and healthy groups (n = 49) using Receiver operating characteristic curves (ROC) showed the following:
The CMRScore had a sensitivity of 92% and specificity of 83% (cut-off score > 4) with an area under the curve = 0.94 (SE = 0.04; 95% CI = 0.87, 1.0) and an asymptotic significance < 0.001.
The PTGVLFi had a sensitivity of 92% and specificity of 87% (cut-off score > 25.5) with the area under the curve = 0.91 (SE = 0.05; 95% CI = 0.81, 1.0) and an asymptotic significance < 0.001.
Gandhi and Rao study [6] comparing atherosclerotic and healthy groups (n = 137) using Receiver operating characteristic curves (ROC) showed the results in table 3 and 4
PTG spectral analysis Markers Sensitivity % Specificity % Cutoff P value AUCPTGi 86.1 87.3 ≤ 40.8 0.0001 0.926PTGVLFi 86.1 93.6 > 27 0.0001 0.963PTGr 73.8 93.6 >2 0.0001 0.895PTGCVD Score 82.5 96.8 >2 0.0001 0.967
Table 4: photoplethysmography (PTG) spectral analysis markers results (data gathered from MedCalc Statistical Software) for detecting atherosclerosis.
PTG spectral analysis Markers RI HRV TP CAN AgePTGi coefficient r 0.87 0.76 0.56 0.54PTGVLFi coefficient r 0.76 0.51 0.64 0.47PTGr coefficient r 0.70 0.50 0.41 0.32
Table 5: Coefficient of Correlation r for photoplethysmography (PTG) spectral analysis markers and endothelial/ autonomic nervous system function markers (data gathered from MedCalc Statistical Software).
Gandhi and Rao study [6] comparing a diabetic group with diabetic neuropathy symptom (DNS) score, and a diabetic group without such symptoms (n = 133) showed that the Sudomotor response (SMR) Score had a sensitivity of 91.4% and specificity of 79.1% (cutoff number > 3) to detect DNS > =1 (P = 0.0001). Area under the ROC curve (AUC) = 0.893. A correlation analysis of the CAN score and SMR score returned a coefficient of correlation r = 0.68 (P < 0.0001).
Statistical analysis was performed using MedCalc Statistical Software’s Receiver Operating Characteristic (ROC) curves with associ-ated area under the curve (AUC) to portray the specificity and sensitivity of each marker and score to correctly identify the presence or absence of T2DM. A comparison of the means of control and T2DM groups for these datasets were performed using t-tests. In addition, the correlation between markers used the coefficient of Correlation r.
Study statistical Methods
ResultsResults to identify the presence or absence of T2DMFast-Fourier Transform Markers

Identifying Autonomic Neuropathy and Endothelial Dysfunction in Type II Diabetic Patients70
Citation: Albert Maarek., et al. “Identifying Autonomic Neuropathy and Endothelial Dysfunction in Type II Diabetic Patients”. EC Neurology 2.2 (2015): 63-78.
Marker Cutoff Values Sensitivity Specificity AUC P-ValuePTGi 40.6 78.5% 90.2% 0.92 P < 0.0001PTGr 2.4 72.4% 89.3% 0.77 P < 0.0001Total Power 803 71.9% 85.2% 0.87 P < 0.0001PTGVLFi 29 84.1% 89.3% 0.87 P < 0.0001
Table 6: Statistical information regarding the ability to detect T2DM groups for fast-Fourier transform markers.
Figure 2: ROC curves outlining the distribution of data from the markers PTGi, PTGr, Total power, and PTGVLFi.
Seemingly, within this sample population, these values can distinguish between diabetic and non-diabetic groups. In order to prove differences within these subgroups exist, t-tests comparing the means of each marker were performed.
Significance tests show that with an α-value of 0.01, differences in means between control and T2DM groups for all fast-Fourier transform markers were statistically significant (P < 0.0001). Thus, these markers based on the harmonic components of the PTG sig-nal were able to segregate the T2DM group within the context of our sample population. Furthermore, based on current statistics, a subgroup of the control group in this study could be pre-diabetic without a confirmed diagnosis and subgroups within the T2DM group could have been misdiagnosed with T2DM. These factors would contribute to decreased sensitivity and specificity of our markers.
Photoplethysmograph Reflection Index Marker
Marker Cutoff Values Sensitivity Specificity AUC P-ValueRI > 40 85.4% 73.7% 0.854 P = 0.0001
Table 7: Statistical information regarding the ability to detect T2DM and control groups for second derivative markers.
Reflection Index (RI), aimed to detect arterial stiffness, ranged in their ability to detect T2DM.

Identifying Autonomic Neuropathy and Endothelial Dysfunction in Type II Diabetic Patients71
Citation: Albert Maarek., et al. “Identifying Autonomic Neuropathy and Endothelial Dysfunction in Type II Diabetic Patients”. EC Neurology 2.2 (2015): 63-78.
Figure 3: ROC curves outlining the distribution of data from the markers SDba and SDda.
Figure 4: ROC curve outlining the distribution of data for ESRNOmarker.
Statistical tests were performed to further elucidate the differences between T2DM and control groups.
With an α-value of 0.01, RI presents high discrepancies between the T2DM and control groups (P < 0.0001). However, arterial stiff-ness is not only a symptom of T2DM, but also of atherosclerosis. Additionally, arterial stiffness has been shown to increase in aging populations.
Marker Cutoff Sensitivity Specificity AUC P-ValueESRNO 49 68.7% 84.3% 0.85 P < 0.0001
Table 8: Statistical informationregarding the ability to detect T2DM and control groups for the ESRNO GSR marker.
Galvanic skin response markers, aimed to detect microcirculation (ESRNO), produced fair ability to detect T2DM. The t-test com-paring data between the T2DM and control groups also returned a high significance level denoting discrepancy between the two datasets (P < 0.0001).
Because ESRNO is a measure of microcirculation, which has been linked to changes in cardiovascular sympathetic tone, ESRNO is used in the calculation of PTGVLFi in order to strongly discriminate patients with both peripheral and cardiovascular neuropathy.

Identifying Autonomic Neuropathy and Endothelial Dysfunction in Type II Diabetic Patients72
Citation: Albert Maarek., et al. “Identifying Autonomic Neuropathy and Endothelial Dysfunction in Type II Diabetic Patients”. EC Neurology 2.2 (2015): 63-78.
Table 9: Statistical information regarding the ability to detect T2DM and control groups for the CAN, CMR, SMR, and EndoT scores.
Score Cutoff Value Sensitivity Specificity AUC P-ValueCMR 4 81.6% 90.2% 0.92 P < 0.0001SMR 1 67.2% 81.0% 0.77 P < 0.0001PTG CVD 2 65.8% 97.5% 0.87 P < 0.0001CAN 5 74.6% 90.6% 0.87 P < 0.0001
Risk scores are assigned to patient examinations and are based off of various markers and demographic information, associated with each facet of pathological complications.
Risk Scores
Figure 5: ROC curves outlining the distribution of data for CAN, CMR, SMR, and EndoT scores.
Figure 6: Correlation between PTGVLFi and RI (left, r = 0.53) and between PTGi and RI (right, r = -0.70).
Results of markers correlation

Identifying Autonomic Neuropathy and Endothelial Dysfunction in Type II Diabetic Patients73
Citation: Albert Maarek., et al. “Identifying Autonomic Neuropathy and Endothelial Dysfunction in Type II Diabetic Patients”. EC Neurology 2.2 (2015): 63-78.
Table 10: Statistical correlation between CAN score and respectively PTGi, PTGVLFi and ESRNO and between RI and the same markers.
The correlations between markers of autonomic nervous system and endothelial functions measured by different methods (Gal-vanic skin response, PTG spectral analysis and Ewing tests) demonstrate that there is a close interrelationship between vascular and autonomic nervous system functions.
Statistical analyses of our data from autonomic and vascular markers clearly showed significant differences between the T2DM and control groups, and confirm the results of the previous studies using TM-Oxi and SudoPath systems in diabetic population.
These markers are easy to obtain (2 minutes time) and provides a good picture of the vascular and autonomic nervous systems.
Discussion
Items CAN score RI P-ValuePTGi r = 0.58 r = 0.69 P < 0.0001PTGVLFi r = 0.69 r = 0.51 P < 0.0001SMR r = 0.64 r = 0.44 P < 0.0001ESRNO r = 0.64 r = 0.52 P < 0.0001
Figure 7: Correlation between PTGVLFi and CAN score (left, r = 0.691) and between PTGi and CAN score (right, r = -0.582).
Figure 8: Correlation between ESRNO and RI (up right, r = -0.51) and between ESRNO and CAN score(down right,r = 0.64).
Identifying Autonomic Neuropathy and Endothelial Dysfunction in Type II Diabetic Patients74
Citation: Albert Maarek., et al. “Identifying Autonomic Neuropathy and Endothelial Dysfunction in Type II Diabetic Patients”. EC Neurology 2.2 (2015): 63-78.
In order to clarify how these markers are indicative of autonomic and endothelial function, we must analyze the derivations of these markers developed in this study.
The Fourier-transform of the PTG signal contains components affected by ANS activity. The first ‘very low frequency’ peak of the Fourier-transformed signal is derived from the average heart rate over the two-minute recording and generally ranges from 0.5 Hz to 1.7 Hz. Heart rate variability would decrease the power of the first peak and increase the power of neighboring frequency bins. The second ‘low frequency’ peak is derived from the diastolic blood flow phase and ranges from 2.0 Hz to 3.3 Hz. For example, if the diastolic peak was to occur roughly 400 ms (left-ventricular ejection time) following the systolic peak, the characteristic frequency of the second peak in the frequency domain would be around 2.5 Hz. Variability in left-ventricular ejection time would create effects similar to that of heart rate variability in the frequency domain. The third ‘high frequency’ peak ranges from 3.3 Hz to 5.5 Hz. This peak, along with higher frequency peaks, could be characteristic of several components in the PTG signal. One component could be due to peripheral cutaneous arteries contracting and dilating.
Calculations of PTGVLFi are based on the ‘very low frequency’ peak amplitude and ESRNO, a measurement of conductance associ-ated with skin microcirculation. Patients with cardiovascular autonomic neuropathy, who often present denervation of fibers in the extremities, can also experience changes in cardiovascular sympathetic tone, suggesting peripheral neuropathy and systemic cardiac neuropathy are linked. Since PTGVLFi could contain information regarding the cardiovascular autonomic function and peripheral fi-ber density, the autonomic and sympathetic cholinergic functions are distinct in the diabetic population as PTGVLFi was found to be significantly higher and ESRNO was found to be significantly lower in the diabetic group of this study. This would denote the very low frequency amplitude is larger and measurements of conductance lower in the diabetic group when compared to the control group. The larger ‘very low frequency’ amplitude could be due to limited variability in the heart rate, which may point to lack of autonomic control. Additionally, lower conductance measurements could point to c-fiber denervation from the sweat glands. Together, the limited heart rate variability and c-fiber denervation could be indicative of diabetic neuropathy. As neuropathic conditions worsen through different stages of diabetes, PTGVLFi could portray the diabetic/pre-diabetic state of the patient and if treatments are improving the patient’s health, though these conceivable associations were not tested in this study.
Additional calculation from the Fourier-transform of the PTG waveform also presented significant differences between the T2DM and control groups. PTGi, the sum of peak amplitudes from the three frequency bands, was found to be significantly lower in the T2DM
While the sample population only consisted of diagnosed diabetics and non-diabetics, the sensitivity and specificity of markers such as PTGVLFi were high enough to suggest the suspected autonomic damage could be part of the underlying dysfunction causing T2DM pathogenesis.
Previous studies showed that endothelial markersare highly correlated with autonomic nervous system function markers [16-19]. It is logical, that there is a close interrelationship between endothelial and autonomic nervous system functions, for example, in hypertension, endothelial dysfunction affects the pathologic process through autonomic nervous pathways and the pathophysiological process of autonomic neuropathy in diabetes mellitus is closely related with vascular function [18].
Moreover, endothelial dysfunction and ANS imbalance often co-exist in the development of various cardiovascular disease pro-cesses, suggesting that there are complex interactions between these two systems. Several studies suggested a potential association between heart rate variability and endothelial function [17].
Other groups also suggested a relationship between markers of endothelial function and sympathetic activity in healthy subjects. In a study of 314 healthy subjects, endothelial function in the brachial artery was inversely related to neither plasma nor epinephrine level [19].
Additionally, our data shows measurements of endothelial function, such as RI or PTGi also have relatively high specificity and sensitivity when diagnosing T2DM and suggests endothelial dysfunction is prevalent in the diabetic population.

Identifying Autonomic Neuropathy and Endothelial Dysfunction in Type II Diabetic Patients75
Citation: Albert Maarek., et al. “Identifying Autonomic Neuropathy and Endothelial Dysfunction in Type II Diabetic Patients”. EC Neurology 2.2 (2015): 63-78.
group. Because PTGr and PTGVLFi were significantly higher in the T2DM group, ‘very low frequency’ amplitudes cannot be contribut-ing as much to the lower PTGi measurements in the diabetic population. Therefore, ‘low frequency’ and ‘high frequency’ peaks must be much lower in the T2DM groups. This may be because the PTG variability exists in higher frequency components such as left-ventric-ular ejection time and arterial dilation. A correlation analysis between PTGi and RI indicates a high inversely proportional correlation between the two markers (r = -0.6906). So, variability in the higher frequency components could be associated with arterial stiffness. PTGr, the ratio of the ‘very low frequency’ peak amplitude to PTGi, was found to be significantly higher in the T2DM group. Similar to the reasoning behind higher PTGVLFi measurements, higher PTGr measurements may be due to higher ‘very low frequency’ peak am-plitudes of patients in the T2DM group in comparison to that of the ‘low frequency’ and ‘high frequency’ peak amplitudes. Like PTGi, lower peak amplitudes from the ‘low frequency’ and ‘high frequency’ bands would point to higher variability in left-ventricular ejection time and arterial dilation.
The RI marker is calculated from averages of many PTG waveforms throughout the two minute recording. This gives us a sense of the typical blood movement patterns through the cutaneous arteries. RI represents the ratio of the dicrotic notch amplitude and the maximum amplitude of the waveform and is derived from the fluctuations in blood volume from systolic and diastolic blood flow, af-fected by arterial dilation and contraction. If elasticity of the blood vessel is reduced, the blood volume between systolic and diastolic phases will exhibit a delay in the temporal profile. The marker RI aim to measure the change in the temporal blood volume profile. RI was found to be significantly higher in diabetic populations, which could point to arterial stiffness. Arterial stiffness could stem from sympathetic denervation or by hyperglycemic and hypoglycemic conditions. Since RI had a high correlation with PTGVLFi, suggesting arterial stiffness could be at least partially caused by decreased sympathetic tone, either systemically or peripherally. While vasodila-tion can be achieved through several pathways, studies have acknowledged acetylcholine release from peripheral c-fibers and subse-quent mechanisms account for an estimated one-third of these pathways. [20-24]. conceivably denervation of the c-fibers could lead to a decreased ability for the vasculature to dilate.
These markers from the Fourier-transform, original waveform and GSR are used in the determination of risk scores in the TM-Oxi and SudoPath software. Risk scores are used to convey the degree in which signs and symptoms are detected, while taking into con-sideration a patient’s demographic information. All of these scores were able to significantly distinguish between T2DM and control groups. Since these scores are derived from methods used to assess cardio metabolic risk, endothelial function or cardiovascular risk, cardiovascular autonomic neuropathy, and sudomotor response, diabetic complications must be prevalent in each of these facets.
As traditional tests for cardiovascular autonomic neuropathy are difficult to perform, time-consuming and therefore rarely per-formed in daily practice [25]. Independent markers with high specificity and sensitivity would be extremely useful to allow for better management of patients with T2DM and help in avoiding the development and progression of life-threatening complications. Pre-vious studies have shown hyperglycemic medication can cause hypoglycemic unawareness, and increase mortality because of this [26]. Markers, potentially stemming from a two minute Fourier-transformed PTG recording (e.g.PTGi, PTGVLFi, PTGr), could indicate whether a diabetic patient has cardiovascular autonomic neuropathy risk or cardiovascular risk and serve as a cautionary measure when considering treatment options for hyperglycemia.
In this study, we aimed to reaffirm data collected from a separate, smaller sample population. When comparing the data collected in this study and the data from the previous study, we see no drastic changes in metrics used to measure the strength of correlation of some markers or score and marker to detect T2DM. While, in some instances, the optimal sensitivity and/or specificity and coef-ficient of correlation were slightly different (except for the correlation of the spectral analysis markers and RI),some variability in these metrics was expected due to larger sample population sizes. However, all the markers and scores maintained high specificity and sensitivity.
Additional Remarks

Identifying Autonomic Neuropathy and Endothelial Dysfunction in Type II Diabetic Patients76
Citation: Albert Maarek., et al. “Identifying Autonomic Neuropathy and Endothelial Dysfunction in Type II Diabetic Patients”. EC Neurology 2.2 (2015): 63-78.
Score Cutoff Value Sensitivity Specificity AUC P-ValuePr Current Pr Current Pr Current Pr Current Pr Current
CMR 4 4 91.2% 81.6% 90.0% 90.2% 0.96 0.92 < 0.0001 < 0.0001SMR 3 3 91.4% 67.2% 79.1% 81.0% 0.89 0.77 < 0.0001 < 0.0001EndoT 2 2 88.2% 65.8% 88.6% 97.5% 0.90 0.87 < 0.0001 < 0.0001CAN 4 5 79.0% 74.6% 88.5% 90.6% 0.90 0.87 < 0.0001 < 0.0001PTGi 44.9 44.6 91.0% 78.5% 80.9% 90.2% 0.93 0.92 < 0.0001 < 0.0001PTGVLFi 26 29 96.0% 84.1% 93.6% 89.3% 0.99 0.87 < 0.0001 < 0.0001ESRNO 49 49 68.6% 68.7% 87.1% 84.4.3% 0.86 0.85 < 0.0001 < 0.0001
Table 11: Comparison of marker and score metrics between previous (Pr) and current studies.
Table 12: Comparison of correlations between previous (Pr) and current studies.
Items Coefficient of correlation P valuesPr Current Pr Current
PTGi /CAN score 0.56 0.58 < 0.0001 < 0.0001PTGi/ RI 0.87 0.70 < 0.0001 < 0.0001PTGVLFi / CAN score 0.64 0.69 < 0.0001 < 0.0001PTGVLFi / RI 0.76 0.52 < 0.0001 < 0.0001SMR/CAN score 0.68 0.64 < 0.0001 < 0.0001SMR/RI NA 0.44 < 0.0001 < 0.0001ESRNO/ CAN score NA 0.64 < 0.0001 < 0.0001ESRNO/ RI NA 0.51 < 0.0001 < 0.0001
Conclusion
Limitations
Markers and scores used to identify autonomic, sudomotor and endothelial dysfunction reliably distinguish diabetic populations from non-diabetic populations. The markers proposed could be used to produce highly reliable risk scores to reinforce diagnoses of T2DM from hyperglycemic markers. If these neuropathic or vascular conditions also started to manifest in early-stage diabetic patho-genesis, paralleling insulin resistance and beta-cell dysfunction, these markers could indicate pre-diabetic states. Additionally, with a full understanding of the state of a patient’s neural, vascular, hepatic, and pancreatic systems, treatment strategies could be individual-ized and take into account the totality of the pathological conditions. Granted, the relationship between insulin resistance, autonomic function and T2DM pathogenesis cannot be entirely elucidated with the knowledge base we have today. Additional longitudinal studies need to be performed alongside current standards for detecting insulin resistance and glucose metabolism.
When assessing the ability of these variables to distinguish between the two groups in this dataset, we should note that there may have been patients who were misplaced into the groups. No preliminary screening was performed prior to group assignment. There-fore, the assignment was based completely on previous diagnoses and could present bias in the data. Patients who have not been diag-nosed with diabetes but present data that is aligned with that of a patient with T2DM could have presented bias in our control group. Conversely, patients who were incorrectly diagnosed with T2DM could have presented bias in our T2DM group.

Identifying Autonomic Neuropathy and Endothelial Dysfunction in Type II Diabetic Patients77
Citation: Albert Maarek., et al. “Identifying Autonomic Neuropathy and Endothelial Dysfunction in Type II Diabetic Patients”. EC Neurology 2.2 (2015): 63-78.
Bibliography
1. Dluhy RG., et al. “Intensive Glycemic Control in the ACCORD and ADVANCE Trials”. The New England Journal of Medicine 358.24 (2008): 2630-2633.2. Boyle., et al. “Projection of the year 2050 burden of diabetes in the US adult population: dynamic modeling of incidence, mortal- ity, and prediabetes prevalence”. Population Health Metrics 8.1 (2010): 29.3. Alqahtani., et al. “Use of Glycated Hemoglobin in the Diagnosis of Diabetes Mellitus and Pre-diabetes and Role of Fasting Plasma Glucose, Oral Glucose Tolerance Test”. Inter National Journal of Preventive Medicine 4.9 (2013): 1025-1029.4. Higgins T. “HbA1c for screening and diagnosis of diabetes mellitus”. Endocrine 43.2 (2013): 266-273.5. Lewis., et al. “A cross-sectional assessment to detect Type 2 Diabetes with endothelial and autonomic nervous system markers using a novel system”. Journal of Diabetes & metabolic disorders 13.1 (2014): 118.6. Gandhi PG and Rao GH. “The spectral analysis of the photoplethysmography to evaluate an independent cardiovascular risk”. International Journal of General Medicine 7 (2014): 539-547.7. Allen J. “Photoplethysmography and its application in clinical physiological measurement”. Physiological Measurement 28.3 (2007): R1-R39.8. Task Force of the European Society of Cardiology and the North American Society of Pacing and Electrophysiology: Heart rate variability. Standards of measurement, physiological interpretation, and clinical use. European Heart Journal 17 (1996): 354-381.9. Ewing DJ., et al. “The value of cardiovascular autonomic function tests: 10 years experience in diabetes”. Diabetes Care 8.5 (1985): 491-498.10. Spallone V., et al. “Cardiovascular autonomic neuropathy in diabetes: clinical impact, assessment, diagnosis, and management”. Diabetes Metabolism Research and Reviews 27.7 (2011): 639-653.11. Takazawa K., et al. “Assessment of vasoactive agents and vascular aging by the second derivative of photoplethysmogram wave- form”. Hypertension 32.2 (1998): 365-370.12. Nousou N., et al. “Classification of Acceleration Plethysmogram Using Self-Organizing Map”. (2006): 681-684.13. Gibbons CH., et al. “Quantification of sweat gland innervation: a clinical-pathologic correlation”. Neurology 72.17 (2009): 1479-1486.14. Gandhi PG and Rao GH. “Detection of neuropathy using a sudomotor test in type 2 Diabetes”. Degenerative Neurological and Neuromuscular Disease 5 (2015): 1-7.15. Hamdy O., et al. “Contribution of nerve-axon reflex-related vasodilation to the total skin vasodilation in diabetic patients with and without neuropathy”. Diabetes Care 24.2 (2001): 344-349.16. Watanabe S., et al. “Simultaneous heart rate variability monitoring enhances the predictive value of flow-mediated dilation in ischemic heart disease”. Circulation Journal 77.4 (2013): 1018-1025.17. Kaplon RE., et al. “Plasma norepinephrine is an independent predictor of vascular endothelial function with aging in healthy women”. Journal of Applied Physiology 111.5 (2011): 1416-14121.18. Grassi G. “Assessment of sympathetic cardiovascular drive in human hypertension: achievements and perspectives”. Hypertension 54.4 (2009): 690-697.19. Bruno RM., et al. “Sympathetic regulation of vascular function in health and disease”. Frontiers Physiology 3 (2012): 284.20. Stanley EF. “Single calcium channels and acetylcholine release at a presynaptic nerve terminal”. Neuron 11.6 (1993): 1007-1011.21. Hamdy O., et al. “Contribution of nerve-axon reflex-related vasodilation to the total skin vasodilation in diabetic patients with and without neuropathy”. Diabetes Care 24.2 (2001): 344-349.22. Lee K and GW. “Role of nitric oxide in methacholine-induced sweating and vasodilation in human skin”. Journal of Applied Physiol- ogy 100.4 (1985): 1355-1360.23. Girach A D Manner and M Porta. “Diabetic micro vascular complications: can patients at risk be identified? A review”. Interna- tional Journal of Clinical Practice 60.11 (2006): 1471-1483.24. Gibbons CH., et al. “Quantification of sweat gland innervation: a clinical-pathologic correlation”. Neurology 72.17 (2009): 1479-1486.

Identifying Autonomic Neuropathy and Endothelial Dysfunction in Type II Diabetic Patients78
Citation: Albert Maarek., et al. “Identifying Autonomic Neuropathy and Endothelial Dysfunction in Type II Diabetic Patients”. EC Neurology 2.2 (2015): 63-78.
25. Pop-Busui R. “Cardiac Autonomic Neuropathy in Diabetes: A clinical perspective”. Diabetes Care 33.2 (2010): 434-441.26. Inzucchi SE., et al. “Management of hyperglycemia in type 2 diabetes: A patient-centered approach: position statement of the American Diabetes Association (ADA); European Association for the Study of Diabetes (EASD). Management of hyperglycemia in type 2 diabetes: A patient-centered approach”. Diabetes Care 38.1 (2015): 2414-2441.
Volume 2 Issue 2 September 2015© All rights are reserved by Albert Maarek., et al.