Embed Size (px)
Citation preview

THE FEDERAL DEMOCRATIC REPUBLIC OF ETHIOPIA
CENTRAL STATISTICAL AGENCY
AGRICULTURAL SAMPLE SURVEY
2011/2012 (2004 E.C.)
(September – January 2011/2012)
VOLUME VII
REPORT ON
CROP AND LIVESTOCK PRODUCT UTILIZATION
(PRIVATE PEASANT HOLDINGS, MEHER SEASON)
ADDIS ABABA
August, 2012 ______________________________________________________________________
532 STATISTICAL BULLETIN 532
______________________________________________________________________

TABLE OF CONTENTS
Page
PART I INTRODUCTION AND OBJECTIVES OF THE SURVEY………… 1
1.1 Introduction ………………………………………………… 1
1.2 Objectives of the Survey …………………………………… 2
PART II SURVEY METHODOLOGY, DATA COLLECTION AND PROCESSING 3
2.1 Scope and Coverage of the Survey………………………….. 3
2.2 Sampling Frame……………………………………………... 3
2.3 Sample Design………………………………………………. 4
2.4 Selection Scheme……………………………………………. 4
2.5 Organization of Field Work…………………………………. 5
2.6 Training of Field Staff………………………………………. 5
2.7 Method of Data Collection………………………………….. 6
2.8 Data Processing……………………………………………… 6
a) Editing, Coding and Verification……………………........ 6
b) Data Entry, Cleaning and Tabulation………………......... 7
2.9 Concepts and Definition……………………………………. 7
PART III SUMMARY OF SURVEY REULTS………………………………… 11
3.1 Crop Utilization …………………………………………….... 11
Tables 1 – 1.10 Crop production and percent of Utilization……… 17
3.2 Utilization of Livestock Products…………………………...... 95
Tables 2.1 – 2.10 Livestock Product Utilization…………………. 97
APPENDIX I Estimation Procedures of Totals, Ratios and Sampling Errors …….. 137 APENDIX II Questionnaire……..…………………………………………………. 143
PART I
INTRODUCTION AND OBJECTIVES OF THE SURVEY
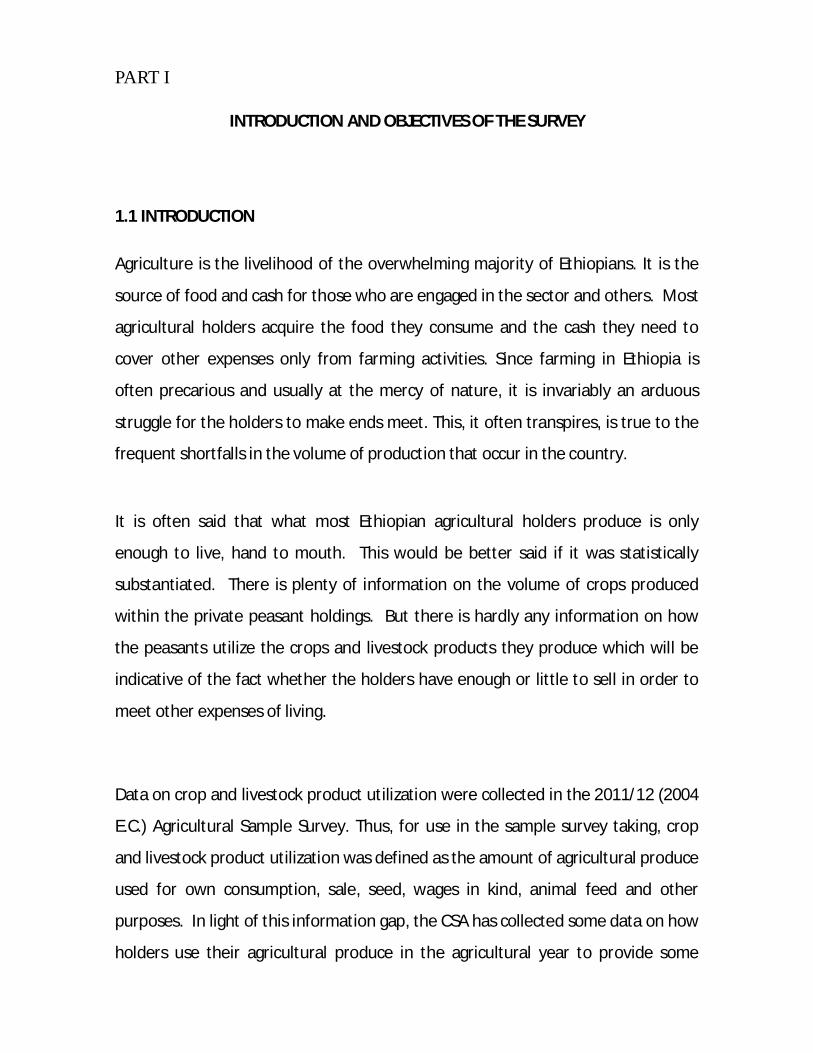
1.1 INTRODUCTION
Agriculture is the livelihood of the overwhelming majority of Ethiopians. It is the
source of food and cash for those who are engaged in the sector and others. Most
agricultural holders acquire the food they consume and the cash they need to
cover other expenses only from farming activities. Since farming in Ethiopia is
often precarious and usually at the mercy of nature, it is invariably an arduous
struggle for the holders to make ends meet. This, it often transpires, is true to the
frequent shortfalls in the volume of production that occur in the country.
It is often said that what most Ethiopian agricultural holders produce is only
enough to live, hand to mouth. This would be better said if it was statistically
substantiated. There is plenty of information on the volume of crops produced
within the private peasant holdings. But there is hardly any information on how
the peasants utilize the crops and livestock products they produce which will be
indicative of the fact whether the holders have enough or little to sell in order to
meet other expenses of living.
Data on crop and livestock product utilization were collected in the 2011/12 (2004
E.C.) Agricultural Sample Survey. Thus, for use in the sample survey taking, crop
and livestock product utilization was defined as the amount of agricultural produce
used for own consumption, sale, seed, wages in kind, animal feed and other
purposes. In light of this information gap, the CSA has collected some data on how
holders use their agricultural produce in the agricultural year to provide some
information on the subject. The data were collected by interviewing the holders.
They were asked to quantify their yearly crop and livestock product utilization
experience in percent based on common practice.
1.2. OBJECTIVES OF THE SURVEY
The general objective of Central Statistical Agency’s (CSA’s) Agricultural Sample
Survey (AgSS) is to collect basic quantitative information on the country’s
agriculture that is essential for planning, policy formulation, monitoring and
evaluation of mainly food security and other agricultural activities. The AgSS is
composed of four components: Crop Production Forecast Survey, Meher Season
Post Harvest Survey, Livestock Survey and Belg Season Survey.
The specific objectives of Meher Season Post Harvest Survey are to estimate the
crop and livestock product utilization for Meher Season agriculture in Ethiopia. The
report is based on private peasant holdings in rural sedentary areas of the country
and part of companion reports on the performance of agriculture in the country.
The report is compiled at national, regional and zonal level.
PART II
SURVEY METHODOLOGY, DATA COLLECTION AND PROCESSING
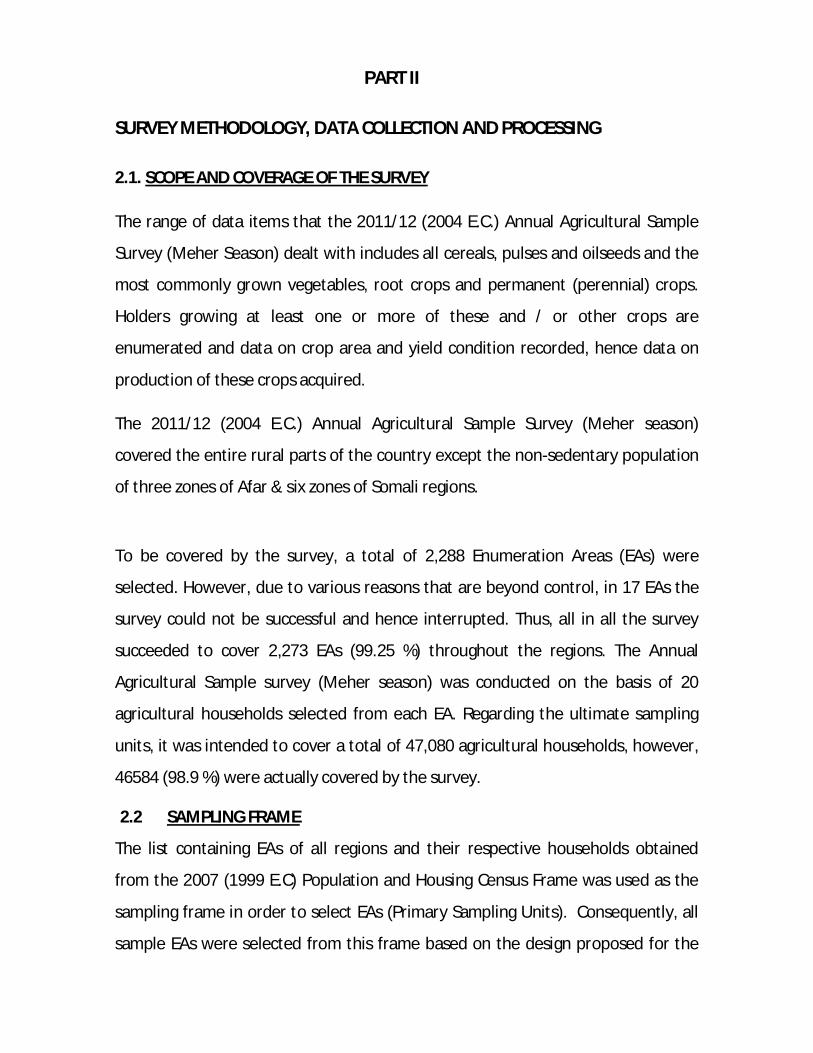
2.1. SCOPE AND COVERAGE OF THE SURVEY
The range of data items that the 2011/12 (2004 E.C.) Annual Agricultural Sample
Survey (Meher Season) dealt with includes all cereals, pulses and oilseeds and the
most commonly grown vegetables, root crops and permanent (perennial) crops.
Holders growing at least one or more of these and / or other crops are
enumerated and data on crop area and yield condition recorded, hence data on
production of these crops acquired.
The 2011/12 (2004 E.C.) Annual Agricultural Sample Survey (Meher season)
covered the entire rural parts of the country except the non-sedentary population
of three zones of Afar & six zones of Somali regions.
To be covered by the survey, a total of 2,288 Enumeration Areas (EAs) were
selected. However, due to various reasons that are beyond control, in 17 EAs the
survey could not be successful and hence interrupted. Thus, all in all the survey
succeeded to cover 2,273 EAs (99.25 %) throughout the regions. The Annual
Agricultural Sample survey (Meher season) was conducted on the basis of 20
agricultural households selected from each EA. Regarding the ultimate sampling
units, it was intended to cover a total of 47,080 agricultural households, however,
46584 (98.9 %) were actually covered by the survey.
2.2 SAMPLING FRAME
The list containing EAs of all regions and their respective households obtained
from the 2007 (1999 E.C) Population and Housing Census Frame was used as the
sampling frame in order to select EAs (Primary Sampling Units). Consequently, all
sample EAs were selected from this frame based on the design proposed for the
survey. The second stage sampling units, households, were selected from a fresh
list of households that were prepared for each EA at the beginning of the survey.
2.3 SAMPLE DESIGN
In order to select the sample a stratified two-stage cluster sample design was
implemented. Enumeration areas (EAs) were taken to be the primary sampling
units (PSUs) and the secondary sampling units (SSUs) were agricultural households.
The sample size for the 2011/12 (2004 E.C.) agricultural sample survey was
determined by taking into account of both the required level of precision for the
most important estimates within each domain and the amount of resources
allocated to the survey. In order to reduce non-sampling errors, manageability of
the survey in terms of quality and operational control was also considered.
All regions were taken to be the domain of estimation for which major findings of
the survey are reported.
2.4 SELECTION SCHEME
Enumeration areas from each stratum were selected systematically using
probability proportional to size sampling technique; size being number of
agricultural households. The sizes for EAs were obtained from the 2007 (1999 E.C)
Population and Housing Census Frame. From the fresh list of households prepared
at the beginning of the survey 30 agricultural households within each sample EA
were selected systematically.
Estimation procedure of totals, ratios, sampling error and the measurement of
precision of estimates (CV) are given in Appendix-I and II respectively. Distribution
of sampling units (sampled and covered EAs and households) by stratum is also
presented in Appendix-III.
. 2.5. ORGANIZATION OF FIELD WORK
The conduct of a survey cannot be executed without the arrangement of
fieldwork. In recognition of this, the organization of fieldwork has been entrusted
to the Branch Offices and at head office Branch Office Desk that liaises between
the Head Office and the 25 Branch Statistical Offices spread across the regions. All
Branch Offices took part in the survey execution especially in recruiting the
enumerators, organizing the 2nd stage training, assigning the field staff to their
sites of enumeration, supervising the data collection and retrieving completed
questionnaires and submitting them to the Head Office for data processing.
The Branch Offices were also responsible for administering the financial and
logistic aspects of the survey within their areas of operation. A total of 2394
enumerators, 529 field supervisors, and 66 statisticians were involved in the data
collection where on the average one supervisor was assigned to four enumeration
areas for supervision of data collection. All the enumerators were supplied with
the necessary survey equipment after the completion of the training to ensure the
smooth operation of the survey. To facilitate the data collection activities, a total
of 194 four-wheel drive vehicles were used.
2.6. TRAINING OF FIELD STAFF
The execution of a survey and quality of data acquired from the survey highly
depend on the type of training given to the enumerators and supervisors and the
consequent understanding of the tasks to be performed and the standard
procedures to be followed by the enumerators and supervisors in the survey
undertaking. The quality and completeness of data are ensured when the training
meets its objective of producing responsible and fervent enumerators and
supervisors.

In light of this point, the training was given to the field staff in two stages. The first
stage training, which took place at the Ambo town arranged by Head Office of CSA
and lasted 6 days targeted staff from the Branch Statistical Office (head,
statisticians and senior field supervisors). The staff that took part in the first stage
training was then assigned to conduct similar training for the enumerators and
other supervisors for 15 days in all the twenty- five Branch Statistical Offices
distributed across the country.
In the training the field staffs was given detailed classroom instruction on how to
collect data, method of area measurement, interviewing procedures, etc. The
training also included field practice to reinforce the understanding of concepts,
definitions and theories discussed in the classroom with regard to field
measurement, crop cutting, GPS reading and interviewing methods.
2.7. METHOD OF DATA COLLECTION
Crop and livestock product utilization data for the year 2011/12 (2004 E.C.) was
collected from sedentary rural peasant households by interviewing the selected
agricultural holders.
2.8. DATA PROCESSING
a) Editing, Coding and Verification
Statistical data editing plays an important role in ensuring the quality of the
collected survey data. It minimizes the effects of errors introduced while collecting
data in the field, hence the need for data editing, coding and verification. Although
coding and editing are done by the enumerators and supervisors in the field,
respectively, verification of this task is done at the Head Office.

An editing, coding and verification instruction manual was prepared and
reproduced for this purpose. Then 21 editors-coders and verifiers were trained for
one day in editing, coding and verification using the aforementioned manual as a
reference and teaching aid. The completed questionnaires were edited, coded and
later verified on a 100 % basis before the questionnaires were passed over to the
data entry unit. The editing, coding and verification exercise of all questionnaires
took 13 days.
b) Data Entry, Cleaning and Tabulation
Before data entry, the Agriculture, Natural Resources and Environment Statistics
Directorate of the CSA prepared edit specification for the survey for use on
personal computers for data consistency checking purposes. The data on the
edited and coded questionnaires were then entered into personal computers. The
data were then checked and cleaned using the edit specifications prepared earlier
for this purpose. The data entry operation involved about 56 data encoders, 4 data
encoder supervisors, 12 data cleaning operators and 55 personal computers. The
data entered into the computers using the entry module of the CSPRO (Census and
Survey Processing System) software, which is a software package developed by the
United States Bureau of the Census. Following the data entry operations, the data
was further reviewed for data inconsistencies, missing data … etc. by the regular
professional staff from Agriculture, Natural Resources and Environment Statistics
Directorate. The final stage of the data processing was to summarizing the cleaned
data and produce statistical tables that present the results of the survey using the
tabulation component of the PC based CSPRO software produced by professional
staff from Agriculture, Natural Resources and Environment Statistics Directorate.
2.9. CONCEPTS AND DEFINITIONS
Data items of agriculture have to be distinctly defined and identified, so that the
information about the items becomes useful. The correct way of stating data items

and related terms is a prerequisite for making standards and definitions for the
collection and compilation of agricultural data. The purpose of using standard
concepts and definitions is not only to provide quality data but also to ensure that
the right items are enumerated and measured accurately to reflect the agricultural
situation.
Standard concepts and definitions used in the survey help to maintain consistent
enumeration and measurement of variables of interest. To achieve this, CSA
communicates concepts and definitions to the field staff through training and
instruction manuals. The concepts and definitions used in the survey included the
following.
Enumeration Area (E.A): an enumeration area in the rural parts of the country is a
locality that is, in most of the cases less than, and only in some cases equal to a
farmers’ association in geographical area and usually consists of 150-200
households.
Household: a household may be either:
a) a one person household, that is a person who makes provisions for his own
living without combining with any other person to form part of a multi- person
household or
b) a multi-person household, that is, a group of two or more persons who live
together and make common provisions for food and other essentials of living. The
persons in the group may pool their incomes and have a common budget to a
greater or lesser extent. They may be related or unrelated persons or a
combination of both. These persons are taken as members of the household.
Agriculture: - The growing of crops and/or raising of animals for own consumption
and /or sale.

Agricultural Household: - a household is considered an agricultural household
when at least one member of the household is engaged in growing crops and/or
raising livestock in private or in combination with others.
Holding: - a holding is all the land and /or livestock kept, which is used wholly or
partly for agricultural production and is operated as one legal entity by one person
alone, or with others with out regard to management, organization, size or
location.
Holder: - a holder is a person who exercises management control over the
operation of the agricultural holding and makes the major decision regarding the
utilization of the available resources. He/she has primary technical and economic
responsibility for the holding. He/she may operate the holding directly as an owner
or a manager. Under conditions of traditional agricultural holding the holder may
be regarded as the person, who with or with out the help of others, operates land
and/or raises livestock in his/ her own right, i.e. the person who decides on which,
where, when, and how to grow crops or raise livestock or both and has the right to
determine the utilization of the products.
Parcel: - a parcel of holding is any piece of land entirely surrounded by land and/or
water and/or road and/or forest etc., which is not part of the holding. It may
consist of one or more cadastral units, plots or fields adjacent to each other.
Field: - a field is defined as any plot of land which is a parcel or part of a parcel
under the same or mixed crops or any other form of land use (private holding).
Crop: includes cereals, pulses, oilseeds, vegetables, root crops, fruits, coffee, Enset,
Chat, hops, sugarcane, cotton, tobacco, etc produced for food, making drinks,
stimulation and making fabrics or clothing.

Crop production: - the process of growing and harvesting of the above crops for
own consumption and/or sale.
Temporary/Annual Crops: - Annual/temporary crops are crops, which are grown in
less than a year’s time, sometimes only a few months with an objective to sow or
replant again for additional production following the current harvest. Continuously
grown crops planted in rotation are also considered as temporary crops since each
is harvested and destroyed by ploughing in preparation for each successive crop.
Permanent (Perennial) Crops: - Crops, which are grown and occupy land for a long
period of time, not requiring replanting for several years after each harvest, are
considered as permanent crops. All fruit trees (i.e. oranges, mandarin, bananas,
etc) and trees for beverages (i.e. coffee, tea, hops (Gesho), etc) are considered
permanent crops but meadows and pastures are excluded.
Meher (Main) Season Crop: - any temporary crop harvested between the months
of Meskerm (September) and Yekatit (February) is considered as meher season
crop.
Belg Season Crop: - any temporary crop harvested between the months of Megabit
(March) and Pagume (August) is considered to be Belg Season Crop.
Crop Utilization:- The amount of agricultural produce used for own consumption,
sale, seed, wages in kind, animal feed and other purposes.

PART III
SUMMARY OF SURVEY RESULTS
3.1 CROP UTILIZATION
Crop and livestock product utilization data for the year 2011/12 (2004 E.C.) was
collected from sedentary rural peasant households by interviewing the selected
agricultural holders
Summary Table 1 conveys the information to shed some light on how holders
utilize their crop produces. Information was sought for each crop type produced
during the survey year. The resulting data may help users to have some idea about
crop usages by agricultural holders. In order to detect the differences in utilization
of the various crops, it is better to look into the data by group of crops as
categorized in the summary table for simplicity and analogy.
Needless to say, as Summary Table 1 points out, most of the cereal crops produced
were used for household consumption. In Ethiopia 67 percent of the cereals
produced were used for household consumption. Nearly 14 percent and 15
percent were used for seed and sale, respectively. The remaining 4 per cent of the
cereals produced was used for other purposes like wages, animal feed, etc. When
the utilization is considered by type of crops, it is easy to realize that between 55
percent and 76 per cent of the crops in the cereals group were used for own
consumption and between 10 per cent and 26 per cent of these crops were used
for sale. Moreover, between 10 per cent and 28 per cent of the same crops in the
same group were used for seed.
As shown in Summary Table 1, about 60 per cent of pulses were used for
household consumption, nearly 16 per cent for seed and about 21 per cent for
sale. The remaining 3 per cent of pulses were used for wages, animal feed and
others. Considering utilization by crop type within the pulses group, between 30
per cent and 68 per cent of the crops were utilized for household consumption and
between 17 per cent and 53 per cent of crop were utilized for sale in the same
crops in the same group were sold in 2011/12 (2004 E.C.). Moreover, between 12
per cent and 21 per cent of these crops in the pulses group were also used for seed
in the same year. The distribution of the utilization of pulses by region is shown in
the statistical tables and it is more or less the same as the country level
The pattern of oilseeds utilization is distinctly different from that of cereals and
pulses as portrayed in Summary Table 1. The data shows that 35 percent, 13
percent and nearly 50 percent were used for household consumption, seed, and
sale, respectively. Taking utilization by crop type into account, between 19 per
cent and nearly 66 percent of each crop type in the oilseeds category were used
for household consumption, between 20 percent and nearly 67 percent for sale
and about 9-17 per cent for seed. It may reasonably be summed up that more of
the oilseeds produced are used for sale or as cash crops. Most of the regions show
the same picture as the country and few regions consumed more of the oilseeds as
indicated in the statistical tables.
The percentage of vegetables consumed at home at country level is even more
than that of cereals and pulses. The data reveals that about 79 percent, 18 per
cent and nearly 1 per cent of the vegetables produced were used for household
consumption, sale, and seed, respectively. The remaining about 2 percent of the
vegetables were used for wages, animal feed and others. The percent used by
crop type within the vegetables group were 65 percent – about 86 percent for
household consumption, nearly 12 percent – 31 percent for sale and about 1 –2
percent for seed. For details, refer to Summary Table 1. The regional pattern of
vegetable utilization is found out to be about the same as the country level in most
of the regions demonstrated in the statistical tables, except in Somali, Harari and
Dire Dawa.
The utilization of root crops is not much different from that of cereals as indicated
in the Summary Table 1. More than 72 percent of the root crops were used for
household consumption, about 16 percent for sale and 10 per cent for seed. The
ranges of percent utilized by crop type within the root crops category fall between
59 per cent – 82 percent for consumption, 5 percent – 33 percent for sale and
about 0.4 -20 percent for seed. The statistical table shows that root crop utilization
in most of the regions is not different from that of the country level.
The survey data reveals that more than half of the permanent crops produced in
the country were used for household consumption and the remaining for sale and
other purposes. Summary Table 1 reveals that 56 percent of the permanent crops
were used for consumption at home and about 39 percent for sale. The utilization
by crop type within the permanent crop group ranges between about 31 percent
and 85 percent for household consumption and between about 8 percent and 63
percent for sale. Permanent crops are also used as cash crops like oilseeds. In
general, it is rational to conclude by looking at Summary Table 1 that the peasant
farmers consume most of what they produce leaving little to sell. (For utilization of
grain crops by purpose see Figure 1).
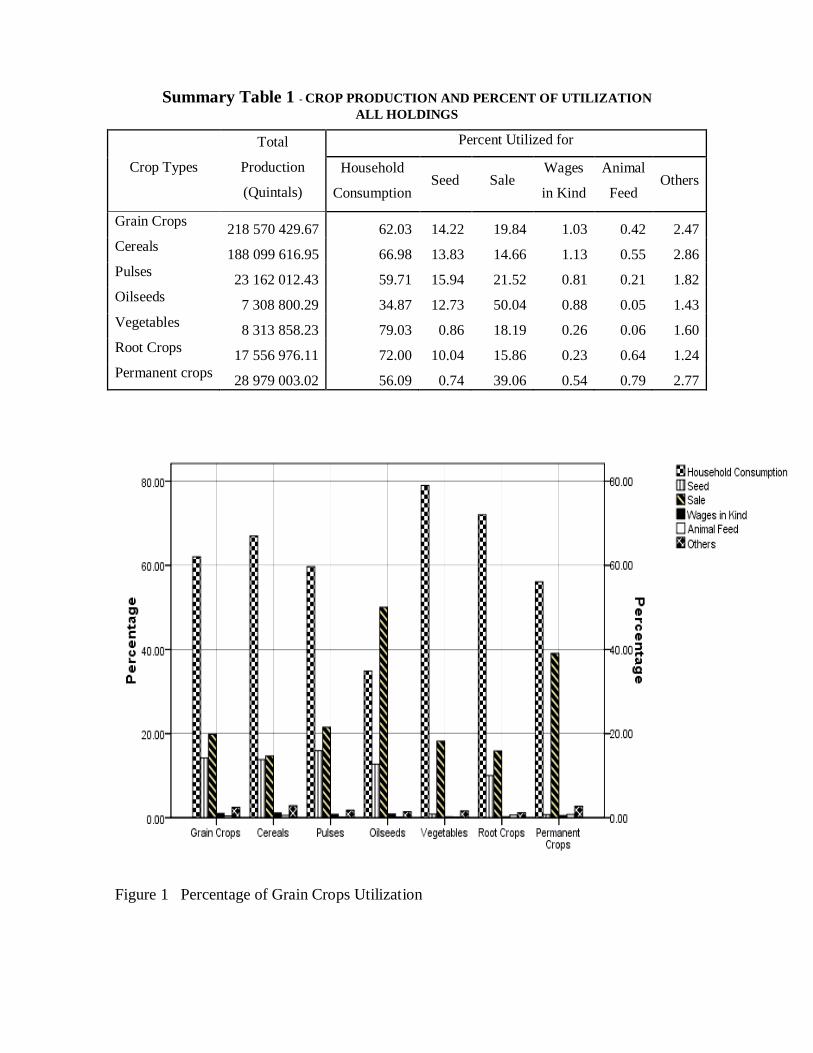
Summary Table 1 - CROP PRODUCTION AND PERCENT OF UTILIZATION
ALL HOLDINGS
Crop Types
Total
Production
(Quintals)
Percent Utilized for
Household
Consumption Seed Sale
Wages
in Kind
Animal
Feed Others
Grain Crops 218 570 429.67 62.03 14.22 19.84 1.03 0.42 2.47 Cereals 188 099 616.95 66.98 13.83 14.66 1.13 0.55 2.86 Pulses 23 162 012.43 59.71 15.94 21.52 0.81 0.21 1.82 Oilseeds 7 308 800.29 34.87 12.73 50.04 0.88 0.05 1.43 Vegetables 8 313 858.23 79.03 0.86 18.19 0.26 0.06 1.60 Root Crops 17 556 976.11 72.00 10.04 15.86 0.23 0.64 1.24 Permanent crops 28 979 003.02 56.09 0.74 39.06 0.54 0.79 2.77
Figure 1 Percentage of Grain Crops Utilization

STATISTICAL TABLES PRESENTING
RESULTS AT
COUNTRY, REGIONAL AND ZONAL LEVELS
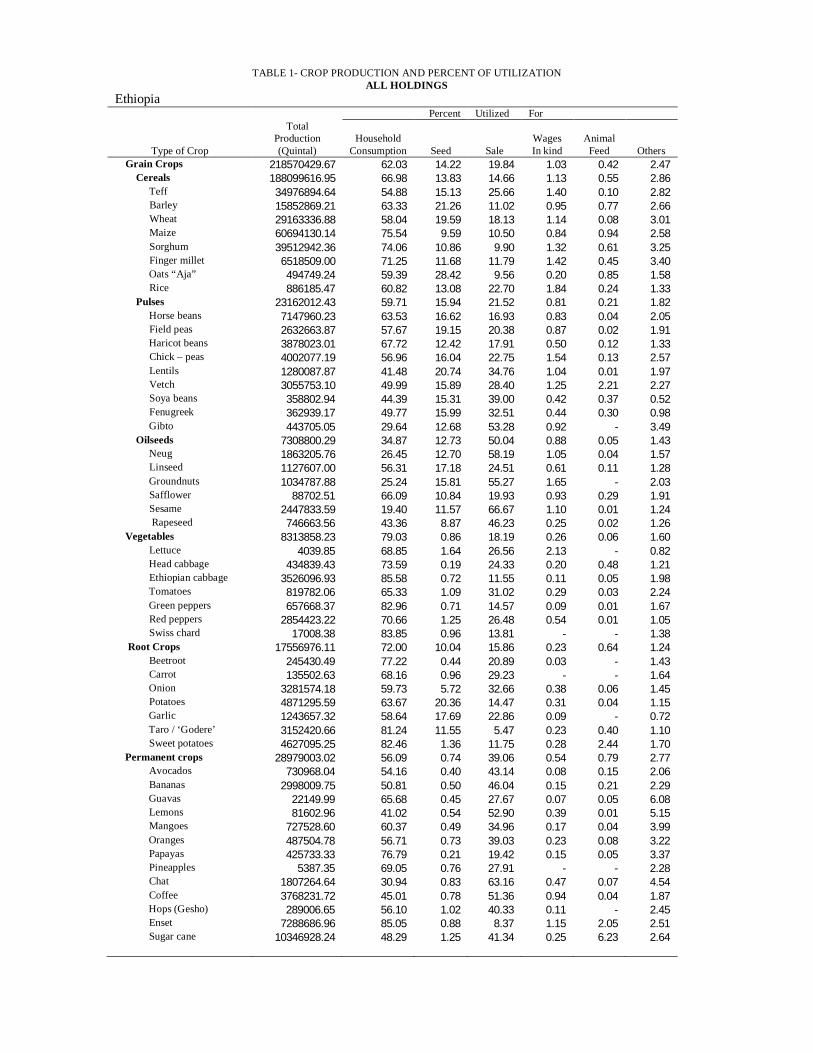
TABLE 1- CROP PRODUCTION AND PERCENT OF UTILIZATION ALL HOLDINGS
Ethiopia Percent Utilized For Total Production Household Wages Animal
Type of Crop (Quintal) Consumption Seed Sale In kind Feed Others Grain Crops 218570429.67 62.03 14.22 19.84 1.03 0.42 2.47 Cereals 188099616.95 66.98 13.83 14.66 1.13 0.55 2.86 Teff 34976894.64 54.88 15.13 25.66 1.40 0.10 2.82 Barley 15852869.21 63.33 21.26 11.02 0.95 0.77 2.66 Wheat 29163336.88 58.04 19.59 18.13 1.14 0.08 3.01 Maize 60694130.14 75.54 9.59 10.50 0.84 0.94 2.58 Sorghum 39512942.36 74.06 10.86 9.90 1.32 0.61 3.25 Finger millet 6518509.00 71.25 11.68 11.79 1.42 0.45 3.40 Oats “Aja” 494749.24 59.39 28.42 9.56 0.20 0.85 1.58 Rice 886185.47 60.82 13.08 22.70 1.84 0.24 1.33 Pulses 23162012.43 59.71 15.94 21.52 0.81 0.21 1.82 Horse beans 7147960.23 63.53 16.62 16.93 0.83 0.04 2.05 Field peas 2632663.87 57.67 19.15 20.38 0.87 0.02 1.91 Haricot beans 3878023.01 67.72 12.42 17.91 0.50 0.12 1.33 Chick – peas 4002077.19 56.96 16.04 22.75 1.54 0.13 2.57 Lentils 1280087.87 41.48 20.74 34.76 1.04 0.01 1.97 Vetch 3055753.10 49.99 15.89 28.40 1.25 2.21 2.27 Soya beans 358802.94 44.39 15.31 39.00 0.42 0.37 0.52 Fenugreek 362939.17 49.77 15.99 32.51 0.44 0.30 0.98 Gibto 443705.05 29.64 12.68 53.28 0.92 - 3.49 Oilseeds 7308800.29 34.87 12.73 50.04 0.88 0.05 1.43 Neug 1863205.76 26.45 12.70 58.19 1.05 0.04 1.57 Linseed 1127607.00 56.31 17.18 24.51 0.61 0.11 1.28 Groundnuts 1034787.88 25.24 15.81 55.27 1.65 - 2.03 Safflower 88702.51 66.09 10.84 19.93 0.93 0.29 1.91 Sesame 2447833.59 19.40 11.57 66.67 1.10 0.01 1.24 Rapeseed 746663.56 43.36 8.87 46.23 0.25 0.02 1.26 Vegetables 8313858.23 79.03 0.86 18.19 0.26 0.06 1.60 Lettuce 4039.85 68.85 1.64 26.56 2.13 - 0.82 Head cabbage 434839.43 73.59 0.19 24.33 0.20 0.48 1.21 Ethiopian cabbage 3526096.93 85.58 0.72 11.55 0.11 0.05 1.98 Tomatoes 819782.06 65.33 1.09 31.02 0.29 0.03 2.24 Green peppers 657668.37 82.96 0.71 14.57 0.09 0.01 1.67 Red peppers 2854423.22 70.66 1.25 26.48 0.54 0.01 1.05 Swiss chard 17008.38 83.85 0.96 13.81 - - 1.38 Root Crops 17556976.11 72.00 10.04 15.86 0.23 0.64 1.24 Beetroot 245430.49 77.22 0.44 20.89 0.03 - 1.43 Carrot 135502.63 68.16 0.96 29.23 - - 1.64 Onion 3281574.18 59.73 5.72 32.66 0.38 0.06 1.45 Potatoes 4871295.59 63.67 20.36 14.47 0.31 0.04 1.15 Garlic 1243657.32 58.64 17.69 22.86 0.09 - 0.72 Taro / ‘Godere’ 3152420.66 81.24 11.55 5.47 0.23 0.40 1.10 Sweet potatoes 4627095.25 82.46 1.36 11.75 0.28 2.44 1.70 Permanent crops 28979003.02 56.09 0.74 39.06 0.54 0.79 2.77 Avocados 730968.04 54.16 0.40 43.14 0.08 0.15 2.06 Bananas 2998009.75 50.81 0.50 46.04 0.15 0.21 2.29 Guavas 22149.99 65.68 0.45 27.67 0.07 0.05 6.08 Lemons 81602.96 41.02 0.54 52.90 0.39 0.01 5.15 Mangoes 727528.60 60.37 0.49 34.96 0.17 0.04 3.99 Oranges 487504.78 56.71 0.73 39.03 0.23 0.08 3.22 Papayas 425733.33 76.79 0.21 19.42 0.15 0.05 3.37 Pineapples 5387.35 69.05 0.76 27.91 - - 2.28 Chat 1807264.64 30.94 0.83 63.16 0.47 0.07 4.54 Coffee 3768231.72 45.01 0.78 51.36 0.94 0.04 1.87 Hops (Gesho) 289006.65 56.10 1.02 40.33 0.11 - 2.45 Enset 7288686.96 85.05 0.88 8.37 1.15 2.05 2.51 Sugar cane 10346928.24 48.29 1.25 41.34 0.25 6.23 2.64

TABLE 1.1: CROP PRODUCTION AND PERCENT OF UTILIZATION ALL HOLDINGS
Tigray Percent Utilized For Total Production Household Wages Animal
Type of Crop (Quintal) Consumption Seed Sale In kind Feed Others Grain Crops 14898420.68 68.82 13.01 14.29 0.56 0.50 2.82 Cereals 13254244.72 73.41 13.21 8.94 0.65 0.63 3.16 Teff 1938456.90 68.88 14.53 12.98 0.40 0.02 3.20 Barley 1640038.91 70.41 18.05 7.72 0.60 0.06 3.15 Wheat 2001695.78 69.14 17.36 8.44 0.77 0.05 4.24 Maize 1536108.00 81.62 9.74 4.05 0.71 1.70 2.18 Sorghum 4736781.77 74.46 11.27 9.10 0.86 0.98 3.32 Finger millet 1337897.07 70.66 12.01 12.91 0.54 0.08 3.79 Oats “Aja” 4369.56 46.25 16.25 37.50 - - - Rice 58896.75 50.72 15.94 32.50 0.28 0.28 0.28 Pulses 779842.37 71.52 12.78 13.80 0.19 0.02 1.69 Horse beans 275170.97 74.22 12.38 10.91 0.29 0.02 2.17 Field peas 67829.62 77.40 15.06 5.63 0.37 - 1.54 Haricot beans 43621.42 83.49 9.90 6.03 0.10 - 0.48 Chick – peas 98854.11 70.06 11.32 16.00 0.08 0.08 2.45 Lentils 102399.90 64.63 14.59 19.79 0.09 - 0.90 Vetch 179348.70 67.28 15.11 16.00 0.12 - 1.49 Soya beans 183.79 44.17 20.83 35.00 - - - Fenugreek 12433.85 60.48 11.40 26.49 - - 1.63 Gibto - - - - - - - Oilseeds 864333.59 25.61 11.72 60.55 0.35 0.15 1.62 Neug 76916.82 47.00 11.85 38.05 0.14 0.05 2.93 Linseed 86256.03 58.40 11.45 25.96 0.33 0.63 3.23 Groundnuts 206.97 23.33 15.67 61.00 - - - Safflower 638.63 75.43 17.79 6.79 - - - Sesame 700259.63 5.55 11.50 81.80 0.43 - 0.73 Rapeseed 55.52 40.00 35.00 25.00 - - - Vegetables 167933.06 84.84 1.44 12.57 0.15 - 1.01 Lettuce 671.32 70.00 25.00 5.00 - - - Head cabbage 22004.80 33.89 8.33 57.78 - - - Ethiopian cabbage 1296.59 100.00 - - - - - Tomatoes 41817.32 77.32 - 20.84 0.48 - 1.35 Green peppers 48298.83 77.31 - 21.81 - - 0.88 Red peppers 52389.97 89.64 1.48 7.68 0.16 - 1.04 Swiss chard 1454.22 54.17 - 44.17 - - 1.67 Root Crops 252871.09 50.10 8.33 39.31 0.27 - 2.00 Beetroot 280.48 50.00 - 50.00 - - - Carrot 9496.06 6.11 - 93.89 - - - Onion 100413.45 48.69 2.72 48.38 - - 0.21 Potatoes 53762.79 66.35 2.39 27.02 1.20 - 3.04 Garlic 88918.30 47.16 16.09 33.87 - - 2.89 Taro / ‘Godere’ - - - - - - - Sweet potatoes - - - - - - - Permanent crops 77890.44 47.52 1.52 47.54 0.49 - 2.93 Avocados - - - - - - - Bananas 3772.39 16.67 - 80.00 - - 3.33 Guavas 1014.19 58.00 - 40.77 - - 1.23 Lemons 3599.84 53.15 0.08 39.69 - - 7.08 Mangoes 4132.24 15.67 - 70.00 - - 14.33 Oranges 3230.86 45.20 - 46.47 - - 8.33 Papayas 13343.96 55.80 0.10 38.60 - - 5.50 Pineapples - - - - - - - Chat - - - - - - - Coffee - - - - - - - Hops (Gesho) 48796.97 47.43 2.68 47.50 0.87 - 1.52 Enset - - - - - - - Sugar cane - - - - - - -
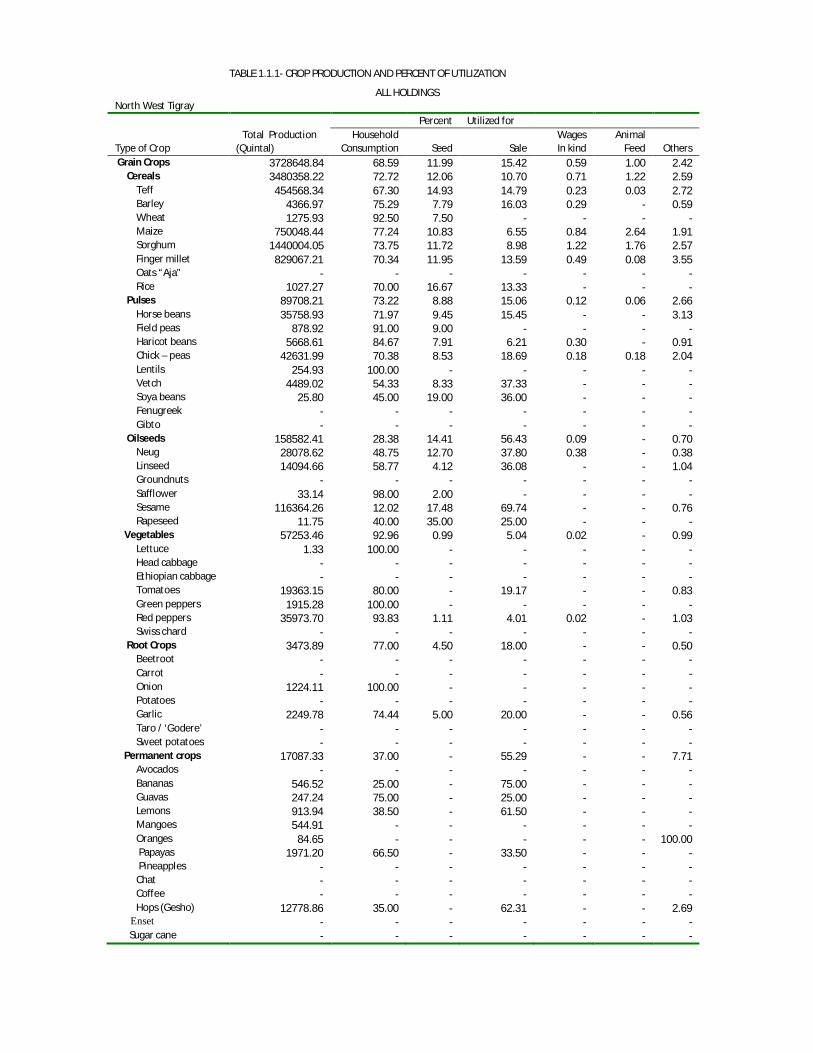
TABLE 1.1.1- CROP PRODUCTION AND PERCENT OF UTILIZATION
ALL HOLDINGS North West Tigray Percent Utilized for Total Production Household Wages Animal Type of Crop (Quintal) Consumption Seed Sale In kind Feed Others Grain Crops 3728648.84 68.59 11.99 15.42 0.59 1.00 2.42 Cereals 3480358.22 72.72 12.06 10.70 0.71 1.22 2.59 Teff 454568.34 67.30 14.93 14.79 0.23 0.03 2.72 Barley 4366.97 75.29 7.79 16.03 0.29 - 0.59 Wheat 1275.93 92.50 7.50 - - - - Maize 750048.44 77.24 10.83 6.55 0.84 2.64 1.91 Sorghum 1440004.05 73.75 11.72 8.98 1.22 1.76 2.57 Finger millet 829067.21 70.34 11.95 13.59 0.49 0.08 3.55 Oats “Aja” - - - - - - - Rice 1027.27 70.00 16.67 13.33 - - - Pulses 89708.21 73.22 8.88 15.06 0.12 0.06 2.66 Horse beans 35758.93 71.97 9.45 15.45 - - 3.13 Field peas 878.92 91.00 9.00 - - - - Haricot beans 5668.61 84.67 7.91 6.21 0.30 - 0.91 Chick – peas 42631.99 70.38 8.53 18.69 0.18 0.18 2.04 Lentils 254.93 100.00 - - - - - Vetch 4489.02 54.33 8.33 37.33 - - - Soya beans 25.80 45.00 19.00 36.00 - - - Fenugreek - - - - - - - Gibto - - - - - - - Oilseeds 158582.41 28.38 14.41 56.43 0.09 - 0.70 Neug 28078.62 48.75 12.70 37.80 0.38 - 0.38 Linseed 14094.66 58.77 4.12 36.08 - - 1.04 Groundnuts - - - - - - - Safflower 33.14 98.00 2.00 - - - - Sesame 116364.26 12.02 17.48 69.74 - - 0.76 Rapeseed 11.75 40.00 35.00 25.00 - - - Vegetables 57253.46 92.96 0.99 5.04 0.02 - 0.99 Lettuce 1.33 100.00 - - - - - Head cabbage - - - - - - - Ethiopian cabbage - - - - - - - Tomatoes 19363.15 80.00 - 19.17 - - 0.83 Green peppers 1915.28 100.00 - - - - - Red peppers 35973.70 93.83 1.11 4.01 0.02 - 1.03 Swiss chard - - - - - - - Root Crops 3473.89 77.00 4.50 18.00 - - 0.50 Beetroot - - - - - - - Carrot - - - - - - - Onion 1224.11 100.00 - - - - - Potatoes - - - - - - - Garlic 2249.78 74.44 5.00 20.00 - - 0.56 Taro / ‘Godere’ - - - - - - - Sweet potatoes - - - - - - - Permanent crops 17087.33 37.00 - 55.29 - - 7.71 Avocados - - - - - - - Bananas 546.52 25.00 - 75.00 - - - Guavas 247.24 75.00 - 25.00 - - - Lemons 913.94 38.50 - 61.50 - - - Mangoes 544.91 - - - - - - Oranges 84.65 - - - - - 100.00 Papayas 1971.20 66.50 - 33.50 - - - Pineapples - - - - - - - Chat - - - - - - - Coffee - - - - - - - Hops (Gesho) 12778.86 35.00 - 62.31 - - 2.69 Enset - - - - - - - Sugar cane - - - - - - -
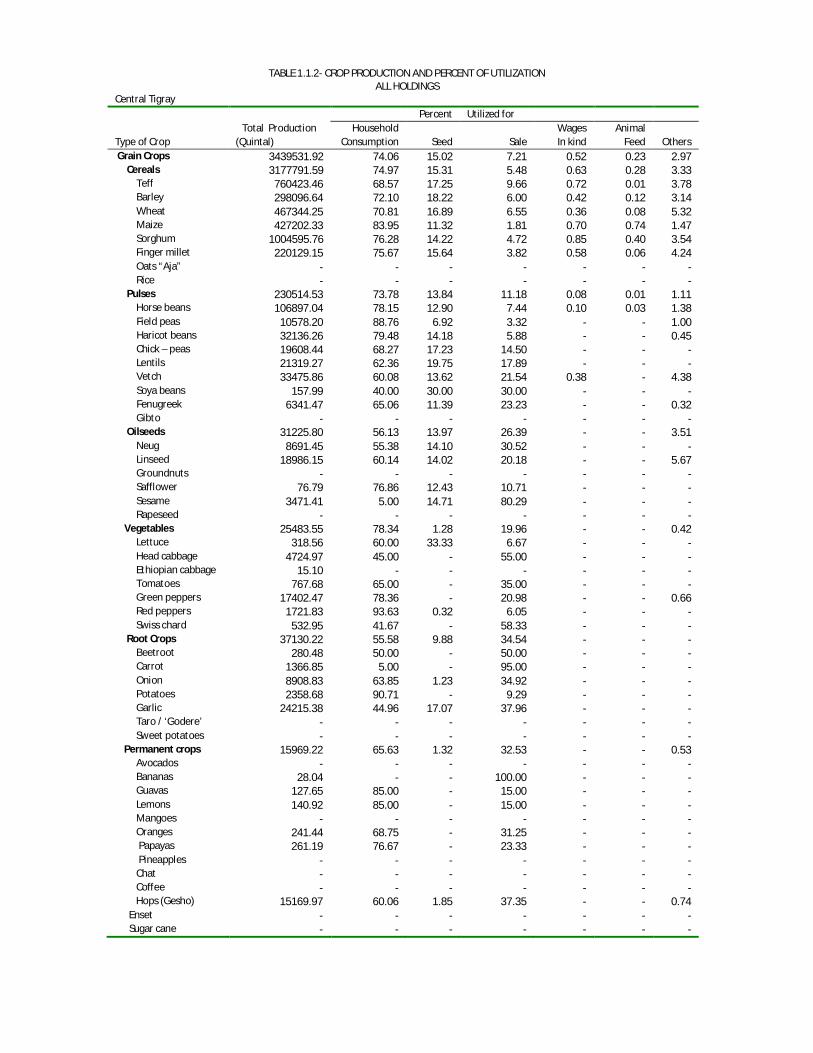
TABLE 1.1.2- CROP PRODUCTION AND PERCENT OF UTILIZATION ALL HOLDINGS
Central Tigray Percent Utilized for Total Production Household Wages Animal Type of Crop (Quintal) Consumption Seed Sale In kind Feed Others Grain Crops 3439531.92 74.06 15.02 7.21 0.52 0.23 2.97 Cereals 3177791.59 74.97 15.31 5.48 0.63 0.28 3.33 Teff 760423.46 68.57 17.25 9.66 0.72 0.01 3.78 Barley 298096.64 72.10 18.22 6.00 0.42 0.12 3.14 Wheat 467344.25 70.81 16.89 6.55 0.36 0.08 5.32 Maize 427202.33 83.95 11.32 1.81 0.70 0.74 1.47 Sorghum 1004595.76 76.28 14.22 4.72 0.85 0.40 3.54 Finger millet 220129.15 75.67 15.64 3.82 0.58 0.06 4.24 Oats “Aja” - - - - - - - Rice - - - - - - - Pulses 230514.53 73.78 13.84 11.18 0.08 0.01 1.11 Horse beans 106897.04 78.15 12.90 7.44 0.10 0.03 1.38 Field peas 10578.20 88.76 6.92 3.32 - - 1.00 Haricot beans 32136.26 79.48 14.18 5.88 - - 0.45 Chick – peas 19608.44 68.27 17.23 14.50 - - - Lentils 21319.27 62.36 19.75 17.89 - - - Vetch 33475.86 60.08 13.62 21.54 0.38 - 4.38 Soya beans 157.99 40.00 30.00 30.00 - - - Fenugreek 6341.47 65.06 11.39 23.23 - - 0.32 Gibto - - - - - - - Oilseeds 31225.80 56.13 13.97 26.39 - - 3.51 Neug 8691.45 55.38 14.10 30.52 - - - Linseed 18986.15 60.14 14.02 20.18 - - 5.67 Groundnuts - - - - - - - Safflower 76.79 76.86 12.43 10.71 - - - Sesame 3471.41 5.00 14.71 80.29 - - - Rapeseed - - - - - - - Vegetables 25483.55 78.34 1.28 19.96 - - 0.42 Lettuce 318.56 60.00 33.33 6.67 - - - Head cabbage 4724.97 45.00 - 55.00 - - - Ethiopian cabbage 15.10 - - - - - - Tomatoes 767.68 65.00 - 35.00 - - - Green peppers 17402.47 78.36 - 20.98 - - 0.66 Red peppers 1721.83 93.63 0.32 6.05 - - - Swiss chard 532.95 41.67 - 58.33 - - - Root Crops 37130.22 55.58 9.88 34.54 - - - Beetroot 280.48 50.00 - 50.00 - - - Carrot 1366.85 5.00 - 95.00 - - - Onion 8908.83 63.85 1.23 34.92 - - - Potatoes 2358.68 90.71 - 9.29 - - - Garlic 24215.38 44.96 17.07 37.96 - - - Taro / ‘Godere’ - - - - - - - Sweet potatoes - - - - - - - Permanent crops 15969.22 65.63 1.32 32.53 - - 0.53 Avocados - - - - - - - Bananas 28.04 - - 100.00 - - - Guavas 127.65 85.00 - 15.00 - - - Lemons 140.92 85.00 - 15.00 - - - Mangoes - - - - - - - Oranges 241.44 68.75 - 31.25 - - - Papayas 261.19 76.67 - 23.33 - - - Pineapples - - - - - - - Chat - - - - - - - Coffee - - - - - - - Hops (Gesho) 15169.97 60.06 1.85 37.35 - - 0.74 Enset - - - - - - - Sugar cane - - - - - - -
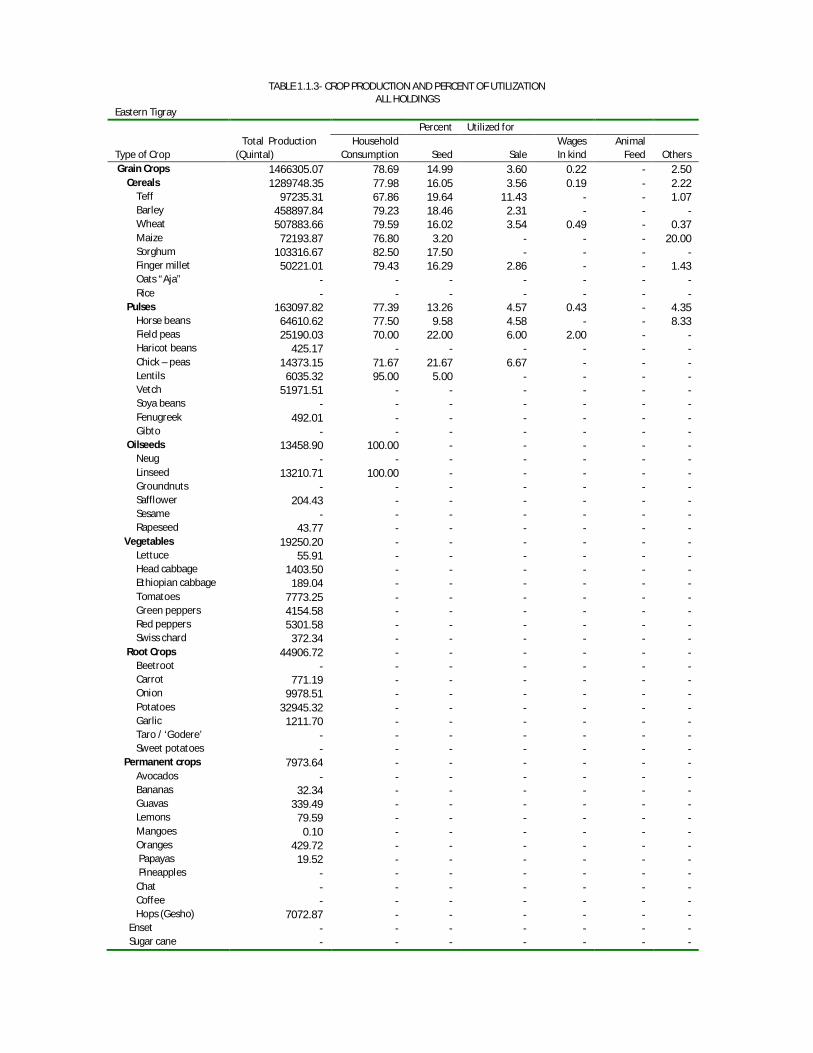
TABLE 1.1.3- CROP PRODUCTION AND PERCENT OF UTILIZATION
ALL HOLDINGS Eastern Tigray Percent Utilized for Total Production Household Wages Animal Type of Crop (Quintal) Consumption Seed Sale In kind Feed Others Grain Crops 1466305.07 78.69 14.99 3.60 0.22 - 2.50 Cereals 1289748.35 77.98 16.05 3.56 0.19 - 2.22 Teff 97235.31 67.86 19.64 11.43 - - 1.07 Barley 458897.84 79.23 18.46 2.31 - - - Wheat 507883.66 79.59 16.02 3.54 0.49 - 0.37 Maize 72193.87 76.80 3.20 - - - 20.00 Sorghum 103316.67 82.50 17.50 - - - - Finger millet 50221.01 79.43 16.29 2.86 - - 1.43 Oats “Aja” - - - - - - - Rice - - - - - - - Pulses 163097.82 77.39 13.26 4.57 0.43 - 4.35 Horse beans 64610.62 77.50 9.58 4.58 - - 8.33 Field peas 25190.03 70.00 22.00 6.00 2.00 - - Haricot beans 425.17 - - - - - - Chick – peas 14373.15 71.67 21.67 6.67 - - - Lentils 6035.32 95.00 5.00 - - - - Vetch 51971.51 - - - - - - Soya beans - - - - - - - Fenugreek 492.01 - - - - - - Gibto - - - - - - - Oilseeds 13458.90 100.00 - - - - - Neug - - - - - - - Linseed 13210.71 100.00 - - - - - Groundnuts - - - - - - - Safflower 204.43 - - - - - - Sesame - - - - - - - Rapeseed 43.77 - - - - - - Vegetables 19250.20 - - - - - - Lettuce 55.91 - - - - - - Head cabbage 1403.50 - - - - - - Ethiopian cabbage 189.04 - - - - - - Tomatoes 7773.25 - - - - - - Green peppers 4154.58 - - - - - - Red peppers 5301.58 - - - - - - Swiss chard 372.34 - - - - - - Root Crops 44906.72 - - - - - - Beetroot - - - - - - - Carrot 771.19 - - - - - - Onion 9978.51 - - - - - - Potatoes 32945.32 - - - - - - Garlic 1211.70 - - - - - - Taro / ‘Godere’ - - - - - - - Sweet potatoes - - - - - - - Permanent crops 7973.64 - - - - - - Avocados - - - - - - - Bananas 32.34 - - - - - - Guavas 339.49 - - - - - - Lemons 79.59 - - - - - - Mangoes 0.10 - - - - - - Oranges 429.72 - - - - - - Papayas 19.52 - - - - - - Pineapples - - - - - - - Chat - - - - - - - Coffee - - - - - - - Hops (Gesho) 7072.87 - - - - - - Enset - - - - - - - Sugar cane - - - - - - -

TABLE 1.1.4- CROP PRODUCTION AND PERCENT OF UTILIZATION
ALL HOLDINGS Southern Tigray Percent Utilized for Total Production Household Wages Animal Type of Crop (Quintal) Consumption Seed Sale In kind Feed Others Grain Crops 3741708.35 69.79 14.40 11.85 0.58 0.12 3.25 Cereals 3428405.30 71.41 14.24 10.00 0.63 0.09 3.63 Teff 533932.30 71.61 11.84 13.25 0.17 - 3.14 Barley 865990.79 68.55 18.68 8.46 0.84 - 3.48 Wheat 1023125.61 66.94 17.82 10.08 1.09 0.03 4.04 Maize 114874.31 84.35 8.67 4.01 0.61 0.47 1.88 Sorghum 874670.53 71.91 9.62 12.57 0.30 0.12 5.49 Finger millet 11442.21 69.62 17.46 10.77 0.38 - 1.77 Oats “Aja” 4369.56 46.25 16.25 37.50 - - - Rice - - - - - - - Pulses 268219.22 67.21 15.18 15.58 0.36 - 1.67 Horse beans 54407.49 72.82 15.39 8.57 1.08 - 2.13 Field peas 27530.88 70.90 21.05 5.98 0.37 - 1.71 Haricot beans 4647.78 81.87 13.47 4.67 - - - Chick – peas 20525.77 64.91 13.61 14.30 - - 7.17 Lentils 66094.60 59.61 14.37 24.26 0.17 - 1.59 Vetch 89412.31 71.32 16.16 12.29 - - 0.23 Soya beans - - - - - - - Fenugreek 5600.37 58.90 11.63 28.94 - - 0.52 Gibto - - - - - - - Oilseeds 45083.84 50.53 14.06 30.71 0.62 1.18 2.91 Neug 815.84 61.25 31.25 6.25 - - 1.25 Linseed 37861.86 54.14 12.91 27.95 0.83 1.56 2.61 Groundnuts 90.05 - 25.00 75.00 - - - Safflower 324.28 70.00 26.67 3.33 - - - Sesame 5991.81 16.50 5.90 70.10 - - 7.50 Rapeseed - - - - - - - Vegetables 45749.58 57.74 5.48 36.31 - - 0.48 Lettuce 295.34 - - - - - - Head cabbage 15860.49 28.33 12.50 59.17 - - - Ethiopian cabbage 1022.77 100.00 - - - - - Tomatoes 11179.23 83.33 - 16.67 - - - Green peppers 13315.26 59.50 - 40.50 - - - Red peppers 3527.55 55.14 11.07 33.07 - - 0.71 Swiss chard 548.94 66.67 - 30.00 - - 3.33 Root Crops 160235.43 44.76 7.83 45.34 0.46 - 1.61 Beetroot - - - - - - - Carrot 7358.02 6.25 - 93.75 - - - Onion 79959.41 40.49 2.91 56.33 - - 0.28 Potatoes 18445.88 61.86 3.06 31.33 1.53 - 2.22 Garlic 54472.11 40.88 21.78 34.22 - - 3.13 Taro / ‘Godere’ - - - - - - - Sweet potatoes - - - - - - - Permanent crops 16929.43 43.11 2.03 53.15 0.89 - 0.82 Avocados - - - - - - - Bananas 3126.54 35.00 - 65.00 - - - Guavas 183.91 49.22 - 50.78 - - - Lemons 77.71 - - - - - - Mangoes 548.23 - - - - - - Oranges 709.44 41.11 - 58.33 - - 0.56 Papayas 1852.40 76.43 - 23.57 - - - Pineapples - - - - - - - Chat - - - - - - - Coffee - - - - - - - Hops (Gesho) 10431.22 43.61 4.46 48.28 1.96 - 1.70 Enset - - - - - - - Sugar cane - - - - - - -
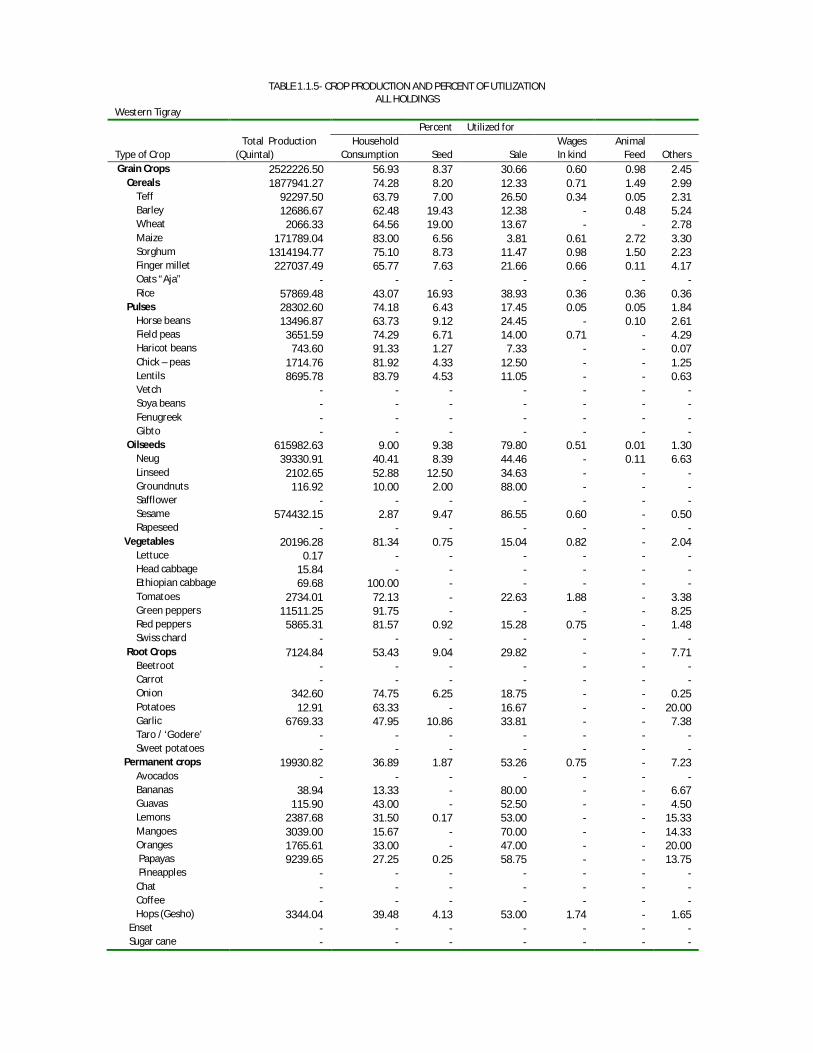
TABLE 1.1.5- CROP PRODUCTION AND PERCENT OF UTILIZATION
ALL HOLDINGS Western Tigray Percent Utilized for Total Production Household Wages Animal Type of Crop (Quintal) Consumption Seed Sale In kind Feed Others Grain Crops 2522226.50 56.93 8.37 30.66 0.60 0.98 2.45 Cereals 1877941.27 74.28 8.20 12.33 0.71 1.49 2.99 Teff 92297.50 63.79 7.00 26.50 0.34 0.05 2.31 Barley 12686.67 62.48 19.43 12.38 - 0.48 5.24 Wheat 2066.33 64.56 19.00 13.67 - - 2.78 Maize 171789.04 83.00 6.56 3.81 0.61 2.72 3.30 Sorghum 1314194.77 75.10 8.73 11.47 0.98 1.50 2.23 Finger millet 227037.49 65.77 7.63 21.66 0.66 0.11 4.17 Oats “Aja” - - - - - - - Rice 57869.48 43.07 16.93 38.93 0.36 0.36 0.36 Pulses 28302.60 74.18 6.43 17.45 0.05 0.05 1.84 Horse beans 13496.87 63.73 9.12 24.45 - 0.10 2.61 Field peas 3651.59 74.29 6.71 14.00 0.71 - 4.29 Haricot beans 743.60 91.33 1.27 7.33 - - 0.07 Chick – peas 1714.76 81.92 4.33 12.50 - - 1.25 Lentils 8695.78 83.79 4.53 11.05 - - 0.63 Vetch - - - - - - - Soya beans - - - - - - - Fenugreek - - - - - - - Gibto - - - - - - - Oilseeds 615982.63 9.00 9.38 79.80 0.51 0.01 1.30 Neug 39330.91 40.41 8.39 44.46 - 0.11 6.63 Linseed 2102.65 52.88 12.50 34.63 - - - Groundnuts 116.92 10.00 2.00 88.00 - - - Safflower - - - - - - - Sesame 574432.15 2.87 9.47 86.55 0.60 - 0.50 Rapeseed - - - - - - - Vegetables 20196.28 81.34 0.75 15.04 0.82 - 2.04 Lettuce 0.17 - - - - - - Head cabbage 15.84 - - - - - - Ethiopian cabbage 69.68 100.00 - - - - - Tomatoes 2734.01 72.13 - 22.63 1.88 - 3.38 Green peppers 11511.25 91.75 - - - - 8.25 Red peppers 5865.31 81.57 0.92 15.28 0.75 - 1.48 Swiss chard - - - - - - - Root Crops 7124.84 53.43 9.04 29.82 - - 7.71 Beetroot - - - - - - - Carrot - - - - - - - Onion 342.60 74.75 6.25 18.75 - - 0.25 Potatoes 12.91 63.33 - 16.67 - - 20.00 Garlic 6769.33 47.95 10.86 33.81 - - 7.38 Taro / ‘Godere’ - - - - - - - Sweet potatoes - - - - - - - Permanent crops 19930.82 36.89 1.87 53.26 0.75 - 7.23 Avocados - - - - - - - Bananas 38.94 13.33 - 80.00 - - 6.67 Guavas 115.90 43.00 - 52.50 - - 4.50 Lemons 2387.68 31.50 0.17 53.00 - - 15.33 Mangoes 3039.00 15.67 - 70.00 - - 14.33 Oranges 1765.61 33.00 - 47.00 - - 20.00 Papayas 9239.65 27.25 0.25 58.75 - - 13.75 Pineapples - - - - - - - Chat - - - - - - - Coffee - - - - - - - Hops (Gesho) 3344.04 39.48 4.13 53.00 1.74 - 1.65 Enset - - - - - - - Sugar cane - - - - - - -
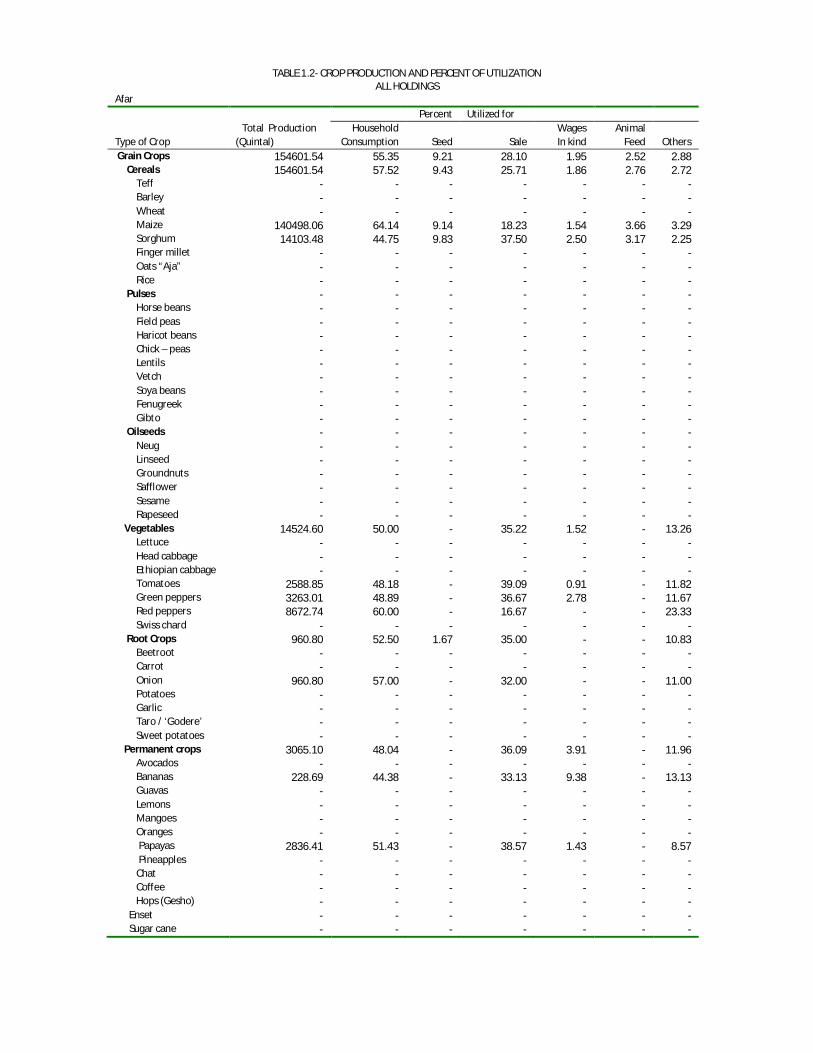
TABLE 1.2- CROP PRODUCTION AND PERCENT OF UTILIZATION ALL HOLDINGS
Afar Percent Utilized for Total Production Household Wages Animal Type of Crop (Quintal) Consumption Seed Sale In kind Feed Others Grain Crops 154601.54 55.35 9.21 28.10 1.95 2.52 2.88 Cereals 154601.54 57.52 9.43 25.71 1.86 2.76 2.72 Teff - - - - - - - Barley - - - - - - - Wheat - - - - - - - Maize 140498.06 64.14 9.14 18.23 1.54 3.66 3.29 Sorghum 14103.48 44.75 9.83 37.50 2.50 3.17 2.25 Finger millet - - - - - - - Oats “Aja” - - - - - - - Rice - - - - - - - Pulses - - - - - - - Horse beans - - - - - - - Field peas - - - - - - - Haricot beans - - - - - - - Chick – peas - - - - - - - Lentils - - - - - - - Vetch - - - - - - - Soya beans - - - - - - - Fenugreek - - - - - - - Gibto - - - - - - - Oilseeds - - - - - - - Neug - - - - - - - Linseed - - - - - - - Groundnuts - - - - - - - Safflower - - - - - - - Sesame - - - - - - - Rapeseed - - - - - - - Vegetables 14524.60 50.00 - 35.22 1.52 - 13.26 Lettuce - - - - - - - Head cabbage - - - - - - - Ethiopian cabbage - - - - - - - Tomatoes 2588.85 48.18 - 39.09 0.91 - 11.82 Green peppers 3263.01 48.89 - 36.67 2.78 - 11.67 Red peppers 8672.74 60.00 - 16.67 - - 23.33 Swiss chard - - - - - - - Root Crops 960.80 52.50 1.67 35.00 - - 10.83 Beetroot - - - - - - - Carrot - - - - - - - Onion 960.80 57.00 - 32.00 - - 11.00 Potatoes - - - - - - - Garlic - - - - - - - Taro / ‘Godere’ - - - - - - - Sweet potatoes - - - - - - - Permanent crops 3065.10 48.04 - 36.09 3.91 - 11.96 Avocados - - - - - - - Bananas 228.69 44.38 - 33.13 9.38 - 13.13 Guavas - - - - - - - Lemons - - - - - - - Mangoes - - - - - - - Oranges - - - - - - - Papayas 2836.41 51.43 - 38.57 1.43 - 8.57 Pineapples - - - - - - - Chat - - - - - - - Coffee - - - - - - - Hops (Gesho) - - - - - - - Enset - - - - - - - Sugar cane - - - - - - -
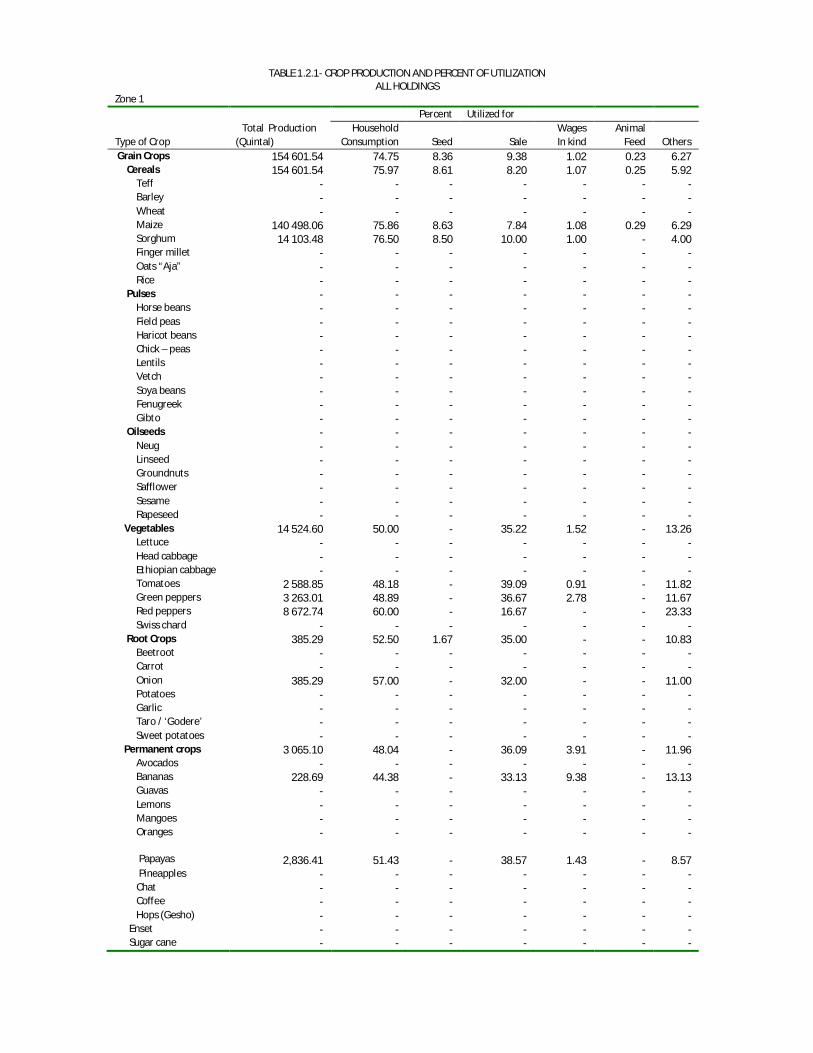
TABLE 1.2.1- CROP PRODUCTION AND PERCENT OF UTILIZATION ALL HOLDINGS
Zone 1 Percent Utilized for Total Production Household Wages Animal Type of Crop (Quintal) Consumption Seed Sale In kind Feed Others Grain Crops 154 601.54 74.75 8.36 9.38 1.02 0.23 6.27 Cereals 154 601.54 75.97 8.61 8.20 1.07 0.25 5.92 Teff - - - - - - - Barley - - - - - - - Wheat - - - - - - - Maize 140 498.06 75.86 8.63 7.84 1.08 0.29 6.29 Sorghum 14 103.48 76.50 8.50 10.00 1.00 - 4.00 Finger millet - - - - - - - Oats “Aja” - - - - - - - Rice - - - - - - - Pulses - - - - - - - Horse beans - - - - - - - Field peas - - - - - - - Haricot beans - - - - - - - Chick – peas - - - - - - - Lentils - - - - - - - Vetch - - - - - - - Soya beans - - - - - - - Fenugreek - - - - - - - Gibto - - - - - - - Oilseeds - - - - - - - Neug - - - - - - - Linseed - - - - - - - Groundnuts - - - - - - - Safflower - - - - - - - Sesame - - - - - - - Rapeseed - - - - - - - Vegetables 14 524.60 50.00 - 35.22 1.52 - 13.26 Lettuce - - - - - - - Head cabbage - - - - - - - Ethiopian cabbage - - - - - - - Tomatoes 2 588.85 48.18 - 39.09 0.91 - 11.82 Green peppers 3 263.01 48.89 - 36.67 2.78 - 11.67 Red peppers 8 672.74 60.00 - 16.67 - - 23.33 Swiss chard - - - - - - - Root Crops 385.29 52.50 1.67 35.00 - - 10.83 Beetroot - - - - - - - Carrot - - - - - - - Onion 385.29 57.00 - 32.00 - - 11.00 Potatoes - - - - - - - Garlic - - - - - - - Taro / ‘Godere’ - - - - - - - Sweet potatoes - - - - - - - Permanent crops 3 065.10 48.04 - 36.09 3.91 - 11.96 Avocados - - - - - - - Bananas 228.69 44.38 - 33.13 9.38 - 13.13 Guavas - - - - - - - Lemons - - - - - - - Mangoes - - - - - - - Oranges - - - - - - - Papayas
2,836.41
51.43 -
38.57
1.43 -
8.57
Pineapples - - - - - - - Chat - - - - - - - Coffee - - - - - - - Hops (Gesho) - - - - - - - Enset - - - - - - - Sugar cane - - - - - - -

TABLE 1.2.2- CROP PRODUCTION AND PERCENT OF UTILIZATION ALL HOLDINGS
Zone 3 Percent Utilized for
Total Production Household Wages Animal
Type of Crop (Quintal) Consumption Seed Sale In kind Feed Others
Grain Crops - - - - - - - Cereals - - - - - - - Teff - - - - - - - Barley - - - - - - - Wheat - - - - - - - Maize - - - - - - - Sorghum - - - - - - - Finger millet - - - - - - - Oats “Aja” - - - - - - - Rice - - - - - - - Pulses - - - - - - - Horse beans - - - - - - - Field peas - - - - - - - Haricot beans - - - - - - - Chick – peas - - - - - - - Lentils - - - - - - - Vetch - - - - - - - Soya beans - - - - - - - Fenugreek - - - - - - - Gibto - - - - - - - Oilseeds - - - - - - - Neug - - - - - - - Linseed - - - - - - - Groundnuts - - - - - - - Safflower - - - - - - - Sesame - - - - - - - Rapeseed - - - - - - - Vegetables - - - - - - - Lettuce - - - - - - - Head cabbage - - - - - - - Ethiopian cabbage - - - - - - - Tomatoes - - - - - - - Green peppers - - - - - - - Red peppers - - - - - - - Swiss chard - - - - - - - Root Crops
575.51 - - - - - -
Beetroot - - - - - - - Carrot - - - - - - - Onion
575.51 - - - - - -
Potatoes - - - - - - - Permanent crops - - - - - - - Avocados - - - - - - - Bananas - - - - - - - Guavas - - - - - - - Lemons - - - - - - - Mangoes - - - - - - - Oranges - - - - - - - Papayas - - - - - - - Pineapples - - - - - - - Chat - - - - - - - Coffee - - - - - - - Hops (Gesho) - - - - - - - Enset - - - - - - - Sugar cane - - - - - - -
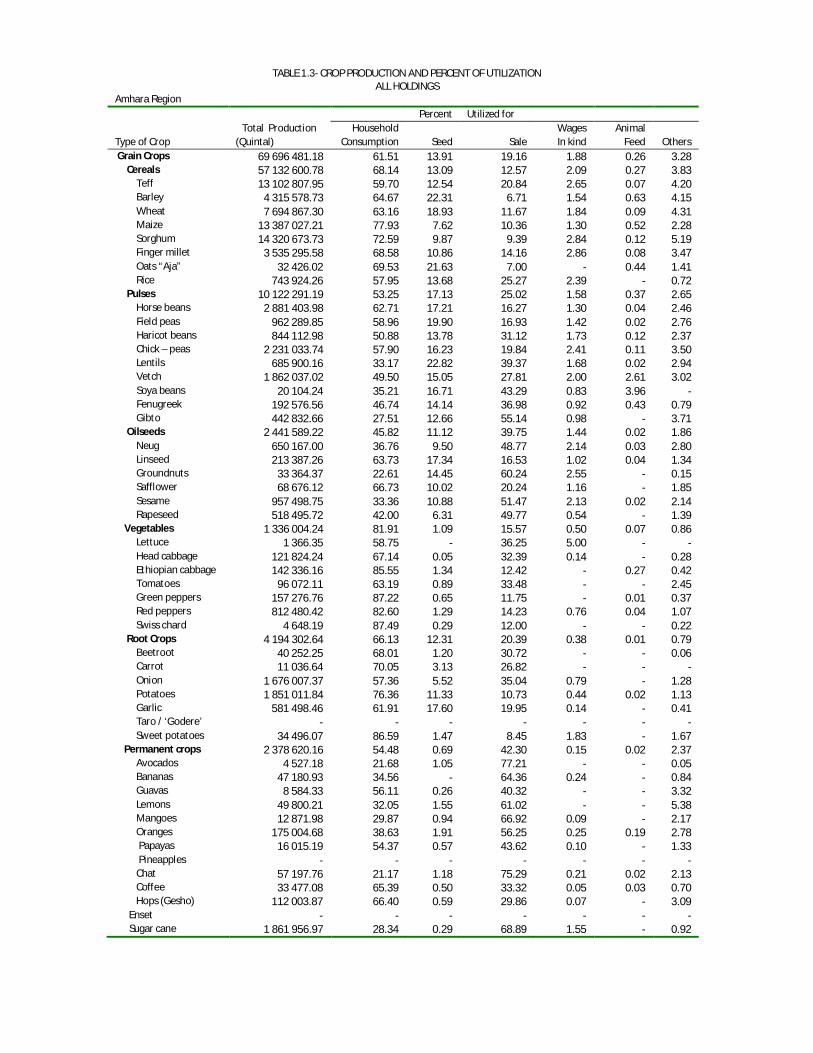
TABLE 1.3- CROP PRODUCTION AND PERCENT OF UTILIZATION ALL HOLDINGS
Amhara Region Percent Utilized for Total Production Household Wages Animal Type of Crop (Quintal) Consumption Seed Sale In kind Feed Others Grain Crops 69 696 481.18 61.51 13.91 19.16 1.88 0.26 3.28 Cereals 57 132 600.78 68.14 13.09 12.57 2.09 0.27 3.83 Teff 13 102 807.95 59.70 12.54 20.84 2.65 0.07 4.20 Barley 4 315 578.73 64.67 22.31 6.71 1.54 0.63 4.15 Wheat 7 694 867.30 63.16 18.93 11.67 1.84 0.09 4.31 Maize 13 387 027.21 77.93 7.62 10.36 1.30 0.52 2.28 Sorghum 14 320 673.73 72.59 9.87 9.39 2.84 0.12 5.19 Finger millet 3 535 295.58 68.58 10.86 14.16 2.86 0.08 3.47 Oats “Aja” 32 426.02 69.53 21.63 7.00 - 0.44 1.41 Rice 743 924.26 57.95 13.68 25.27 2.39 - 0.72 Pulses 10 122 291.19 53.25 17.13 25.02 1.58 0.37 2.65 Horse beans 2 881 403.98 62.71 17.21 16.27 1.30 0.04 2.46 Field peas 962 289.85 58.96 19.90 16.93 1.42 0.02 2.76 Haricot beans 844 112.98 50.88 13.78 31.12 1.73 0.12 2.37 Chick – peas 2 231 033.74 57.90 16.23 19.84 2.41 0.11 3.50 Lentils 685 900.16 33.17 22.82 39.37 1.68 0.02 2.94 Vetch 1 862 037.02 49.50 15.05 27.81 2.00 2.61 3.02 Soya beans 20 104.24 35.21 16.71 43.29 0.83 3.96 - Fenugreek 192 576.56 46.74 14.14 36.98 0.92 0.43 0.79 Gibto 442 832.66 27.51 12.66 55.14 0.98 - 3.71 Oilseeds 2 441 589.22 45.82 11.12 39.75 1.44 0.02 1.86 Neug 650 167.00 36.76 9.50 48.77 2.14 0.03 2.80 Linseed 213 387.26 63.73 17.34 16.53 1.02 0.04 1.34 Groundnuts 33 364.37 22.61 14.45 60.24 2.55 - 0.15 Safflower 68 676.12 66.73 10.02 20.24 1.16 - 1.85 Sesame 957 498.75 33.36 10.88 51.47 2.13 0.02 2.14 Rapeseed 518 495.72 42.00 6.31 49.77 0.54 - 1.39 Vegetables 1 336 004.24 81.91 1.09 15.57 0.50 0.07 0.86 Lettuce 1 366.35 58.75 - 36.25 5.00 - - Head cabbage 121 824.24 67.14 0.05 32.39 0.14 - 0.28 Ethiopian cabbage 142 336.16 85.55 1.34 12.42 - 0.27 0.42 Tomatoes 96 072.11 63.19 0.89 33.48 - - 2.45 Green peppers 157 276.76 87.22 0.65 11.75 - 0.01 0.37 Red peppers 812 480.42 82.60 1.29 14.23 0.76 0.04 1.07 Swiss chard 4 648.19 87.49 0.29 12.00 - - 0.22 Root Crops 4 194 302.64 66.13 12.31 20.39 0.38 0.01 0.79 Beetroot 40 252.25 68.01 1.20 30.72 - - 0.06 Carrot 11 036.64 70.05 3.13 26.82 - - - Onion 1 676 007.37 57.36 5.52 35.04 0.79 - 1.28 Potatoes 1 851 011.84 76.36 11.33 10.73 0.44 0.02 1.13 Garlic 581 498.46 61.91 17.60 19.95 0.14 - 0.41 Taro / ‘Godere’ - - - - - - - Sweet potatoes 34 496.07 86.59 1.47 8.45 1.83 - 1.67 Permanent crops 2 378 620.16 54.48 0.69 42.30 0.15 0.02 2.37 Avocados 4 527.18 21.68 1.05 77.21 - - 0.05 Bananas 47 180.93 34.56 - 64.36 0.24 - 0.84 Guavas 8 584.33 56.11 0.26 40.32 - - 3.32 Lemons 49 800.21 32.05 1.55 61.02 - - 5.38 Mangoes 12 871.98 29.87 0.94 66.92 0.09 - 2.17 Oranges 175 004.68 38.63 1.91 56.25 0.25 0.19 2.78 Papayas 16 015.19 54.37 0.57 43.62 0.10 - 1.33 Pineapples - - - - - - - Chat 57 197.76 21.17 1.18 75.29 0.21 0.02 2.13 Coffee 33 477.08 65.39 0.50 33.32 0.05 0.03 0.70 Hops (Gesho) 112 003.87 66.40 0.59 29.86 0.07 - 3.09 Enset - - - - - - - Sugar cane 1 861 956.97 28.34 0.29 68.89 1.55 - 0.92

TABLE 1.3.1- CROP PRODUCTION AND PERCENT OF UTILIZATION ALL HOLDINGS
North Gonder Percent Utilized for Total Production Household Wages Animal Type of Crop (Quintal) Consumption Seed Sale In kind Feed Others Grain Crops 14 098 056.39 61.58 13.28 20.24 2.86 0.57 1.48 Cereals 11 541 076.54 67.89 13.40 13.11 3.20 0.28 2.13 Teff 1 681 334.30 56.49 14.27 22.68 4.54 0.25 1.78 Barley 882 674.80 64.14 21.83 8.66 2.14 0.31 2.93 Wheat 1 407 545.68 65.24 19.34 11.57 1.45 - 2.40 Maize 1 738 975.49 76.86 9.56 9.79 1.67 0.41 1.72 Sorghum 4 555 362.27 69.19 11.69 11.89 4.56 0.42 2.26 Finger millet 1 251 193.13 70.26 10.27 13.14 3.97 - 2.37 Oats “Aja” 4 226.33 56.88 12.50 30.63 - - - Rice 19 764.53 64.82 16.73 9.55 8.91 - - Pulses 1 714 046.24 55.62 15.15 24.63 2.55 1.91 0.13 Horse beans 434 649.67 60.36 15.18 23.20 1.18 - 0.08 Field peas 146 620.58 67.72 13.56 16.09 2.23 0.25 0.15 Haricot beans 18 715.59 67.75 17.50 8.00 2.25 3.00 1.50 Chick – peas 821 012.77 61.68 17.02 15.33 5.37 0.57 0.03 Lentils 109 998.66 25.98 16.48 56.02 1.11 0.24 0.16 Vetch 146 604.82 37.68 12.57 24.47 3.96 21.32 - Soya beans - - - - - - - Fenugreek 36 444.14 35.87 11.87 52.16 0.11 - - Gibto - - - - - - - Oilseeds 842 933.61 41.98 10.27 45.46 1.82 0.04 0.43 Neug 148 088.54 27.34 9.61 60.33 2.43 0.19 0.09 Linseed 54 177.70 73.75 12.95 12.22 0.78 - 0.30 Groundnuts - - - - - - - Safflower 14 615.75 69.39 8.58 20.67 1.36 - - Sesame 603 724.55 15.19 11.01 70.45 2.50 0.01 0.84 Rapeseed 22 327.07 75.27 5.95 17.75 0.82 - 0.21 Vegetables 167 633.07 79.57 2.56 17.01 0.55 - 0.31 Lettuce - - - - - - - Head cabbage 507.64 100.00 - - - - - Ethiopian cabbage 17 085.57 100.00 - - - - - Tomatoes 3 551.11 46.67 - 53.33 - - - Green peppers 32 423.99 84.05 - 15.95 - - - Red peppers 113 959.05 78.56 3.02 17.41 0.65 - 0.36 Swiss chard 105.70 97.00 3.00 - - - - Root Crops 641 738.12 69.41 9.34 20.46 0.60 - 0.20 Beetroot - - - - - - - Carrot - - - - - - - Onion 203 480.87 31.70 3.00 62.60 2.70 - - Potatoes 269 046.42 86.94 6.77 6.02 0.09 - 0.18 Garlic 162 422.00 62.35 13.51 23.34 0.53 - 0.27 Taro / ‘Godere’ - - - - - - - Sweet potatoes 6 788.83 - - - - - - Permanent crops 55 095.63 61.45 0.18 36.42 0.07 - 1.88 Avocados - - - - - - - Bananas 2 788.41 10.00 - 90.00 - - - Guavas 26.39 75.00 - - - - 25.00 Lemons 27 216.68 20.80 - 79.20 - - - Mangoes 182.83 25.00 - 50.00 - - 25.00 Oranges 2 758.54 11.67 - 88.33 - - - Papayas 2 370.64 56.79 - 43.21 - - - Pineapples - - - - - - - Chat - - - - - - - Coffee 3 774.85 57.65 - 41.76 - - 0.59 Hops (Gesho) 15 977.28 70.18 0.27 27.24 0.11 - 2.20 Enset - - - - - - - Sugar cane - - - - - - -

TABLE 1.3.2- CROP PRODUCTION AND PERCENT OF UTILIZATION ALL HOLDINGS
South Gonder Percent Utilized for Total Production Household Wages Animal Type of Crop (Quintal) Consumption Seed Sale In kind Feed Others Grain Crops 7 804 747.91 61.19 13.31 21.59 1.44 0.05 2.43 Cereals 6 046 592.29 68.40 13.72 13.54 1.67 0.04 2.63 Teff 1 714 219.97 63.47 14.19 17.53 1.69 0.16 2.96 Barley 361 919.99 63.76 20.60 10.56 1.77 - 3.31 Wheat 1 234 166.15 63.63 17.15 13.70 1.67 - 3.84 Maize 948 285.80 79.81 9.71 8.59 0.78 - 1.11 Sorghum 675 026.52 72.99 10.30 10.80 2.01 - 3.90 Finger millet 395 487.72 67.92 10.61 16.45 3.51 - 1.51 Oats “Aja” 924.89 62.00 13.00 17.86 - - 7.14 Rice 716 561.25 55.85 13.49 28.73 1.65 - 0.27 Pulses 1 495 120.26 53.07 14.49 28.75 1.04 0.11 2.54 Horse beans 170 795.62 61.85 13.37 21.28 1.80 - 1.70 Field peas 137 891.25 56.91 20.10 19.97 0.95 - 2.06 Haricot beans 124 619.34 45.68 12.47 40.44 0.38 - 1.03 Chick – peas 275 354.96 59.62 13.75 21.42 1.09 - 4.11 Lentils 54 734.25 22.05 18.05 57.95 - - 1.95 Vetch 548 946.06 53.07 14.49 27.03 1.07 0.48 3.87 Soya beans - - - - - - - Fenugreek 2 045.67 60.79 8.58 28.63 - - 2.00 Gibto 180 733.11 32.36 11.71 55.38 0.39 - 0.15 Oilseeds 263 035.36 45.99 9.29 42.17 1.19 - 1.36 Neug 156 366.91 22.19 9.50 63.02 2.39 - 2.90 Linseed 39 980.43 61.92 13.15 22.50 1.33 - 1.09 Groundnuts - - - - - - - Safflower 2 857.67 49.25 15.19 34.94 - - 0.63 Sesame 2 442.98 94.25 5.75 - - - - Rapeseed 61 387.36 50.13 5.49 43.74 0.22 - 0.43 Vegetables 49 053.14 80.57 0.76 18.09 - - 0.58 Lettuce - - - - - - - Head cabbage 131.40 30.00 - 70.00 - - - Ethiopian cabbage 1 168.48 100.00 - - - - - Tomatoes 57.19 12.50 - 87.50 - - - Green peppers 555.57 22.50 7.50 70.00 - - - Red peppers 46 930.82 82.85 0.71 15.79 - - 0.64 Swiss chard 209.66 50.00 - 50.00 - - - Root Crops 627 813.75 68.10 12.37 18.99 0.03 - 0.50 Beetroot 75.94 7.50 - 92.50 - - - Carrot - - - - - - - Onion 101 426.54 40.36 3.07 55.86 - - 0.71 Potatoes 442 970.56 82.08 11.12 5.75 0.08 - 0.97 Garlic 82 922.40 61.26 14.08 24.46 - - 0.20 Taro / ‘Godere’ - - - - - - - Sweet potatoes 418.31 100.00 - - - - - Permanent crops 33 034.88 64.22 0.72 33.82 - - 1.23 Avocados - - - - - - - Bananas 19 581.93 6.43 - 93.57 - - - Guavas 390.48 33.00 - 67.00 - - - Lemons 251.97 33.33 - 66.67 - - - Mangoes 510.10 - - - - - - Oranges 924.00 8.33 - 91.67 - - - Papayas 888.65 2.50 - 97.50 - - - Pineapples - - - - - - - Chat 917.29 25.00 - 75.00 - - - Coffee 143.71 84.09 - 15.45 - - 0.45 Hops (Gesho) 5 967.43 70.53 0.86 27.16 - - 1.44 Enset - - - - - - - Sugar cane 3 459.32 20.00 - 80.00 - - -
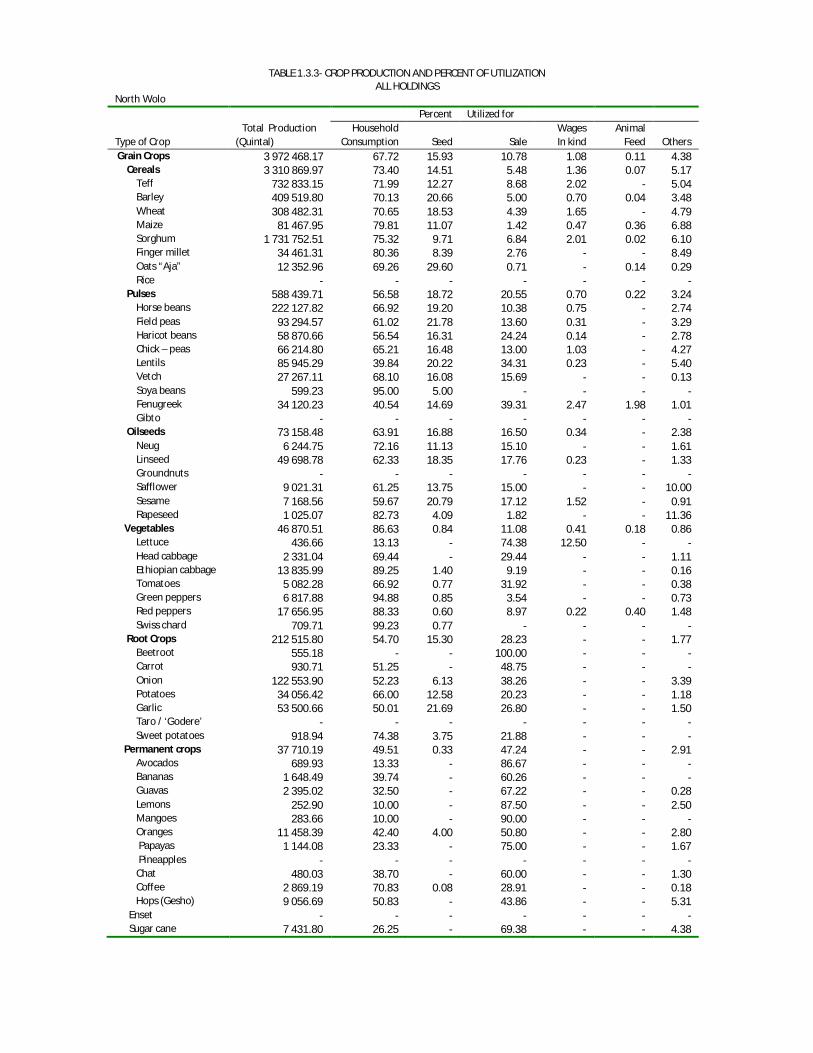
TABLE 1.3.3- CROP PRODUCTION AND PERCENT OF UTILIZATION ALL HOLDINGS
North Wolo Percent Utilized for Total Production Household Wages Animal Type of Crop (Quintal) Consumption Seed Sale In kind Feed Others Grain Crops 3 972 468.17 67.72 15.93 10.78 1.08 0.11 4.38 Cereals 3 310 869.97 73.40 14.51 5.48 1.36 0.07 5.17 Teff 732 833.15 71.99 12.27 8.68 2.02 - 5.04 Barley 409 519.80 70.13 20.66 5.00 0.70 0.04 3.48 Wheat 308 482.31 70.65 18.53 4.39 1.65 - 4.79 Maize 81 467.95 79.81 11.07 1.42 0.47 0.36 6.88 Sorghum 1 731 752.51 75.32 9.71 6.84 2.01 0.02 6.10 Finger millet 34 461.31 80.36 8.39 2.76 - - 8.49 Oats “Aja” 12 352.96 69.26 29.60 0.71 - 0.14 0.29 Rice - - - - - - - Pulses 588 439.71 56.58 18.72 20.55 0.70 0.22 3.24 Horse beans 222 127.82 66.92 19.20 10.38 0.75 - 2.74 Field peas 93 294.57 61.02 21.78 13.60 0.31 - 3.29 Haricot beans 58 870.66 56.54 16.31 24.24 0.14 - 2.78 Chick – peas 66 214.80 65.21 16.48 13.00 1.03 - 4.27 Lentils 85 945.29 39.84 20.22 34.31 0.23 - 5.40 Vetch 27 267.11 68.10 16.08 15.69 - - 0.13 Soya beans 599.23 95.00 5.00 - - - - Fenugreek 34 120.23 40.54 14.69 39.31 2.47 1.98 1.01 Gibto - - - - - - - Oilseeds 73 158.48 63.91 16.88 16.50 0.34 - 2.38 Neug 6 244.75 72.16 11.13 15.10 - - 1.61 Linseed 49 698.78 62.33 18.35 17.76 0.23 - 1.33 Groundnuts - - - - - - - Safflower 9 021.31 61.25 13.75 15.00 - - 10.00 Sesame 7 168.56 59.67 20.79 17.12 1.52 - 0.91 Rapeseed 1 025.07 82.73 4.09 1.82 - - 11.36 Vegetables 46 870.51 86.63 0.84 11.08 0.41 0.18 0.86 Lettuce 436.66 13.13 - 74.38 12.50 - - Head cabbage 2 331.04 69.44 - 29.44 - - 1.11 Ethiopian cabbage 13 835.99 89.25 1.40 9.19 - - 0.16 Tomatoes 5 082.28 66.92 0.77 31.92 - - 0.38 Green peppers 6 817.88 94.88 0.85 3.54 - - 0.73 Red peppers 17 656.95 88.33 0.60 8.97 0.22 0.40 1.48 Swiss chard 709.71 99.23 0.77 - - - - Root Crops 212 515.80 54.70 15.30 28.23 - - 1.77 Beetroot 555.18 - - 100.00 - - - Carrot 930.71 51.25 - 48.75 - - - Onion 122 553.90 52.23 6.13 38.26 - - 3.39 Potatoes 34 056.42 66.00 12.58 20.23 - - 1.18 Garlic 53 500.66 50.01 21.69 26.80 - - 1.50 Taro / ‘Godere’ - - - - - - - Sweet potatoes 918.94 74.38 3.75 21.88 - - - Permanent crops 37 710.19 49.51 0.33 47.24 - - 2.91 Avocados 689.93 13.33 - 86.67 - - - Bananas 1 648.49 39.74 - 60.26 - - - Guavas 2 395.02 32.50 - 67.22 - - 0.28 Lemons 252.90 10.00 - 87.50 - - 2.50 Mangoes 283.66 10.00 - 90.00 - - - Oranges 11 458.39 42.40 4.00 50.80 - - 2.80 Papayas 1 144.08 23.33 - 75.00 - - 1.67 Pineapples - - - - - - - Chat 480.03 38.70 - 60.00 - - 1.30 Coffee 2 869.19 70.83 0.08 28.91 - - 0.18 Hops (Gesho) 9 056.69 50.83 - 43.86 - - 5.31 Enset - - - - - - - Sugar cane 7 431.80 26.25 - 69.38 - - 4.38

TABLE 1.3.4- CROP PRODUCTION AND PERCENT OF UTILIZATION ALL HOLDINGS
South Wolo Percent Utilized for Total Production Household Wages Animal Type of Crop (Quintal) Consumption Seed Sale In kind Feed Others Grain Crops 7 053 617.88 63.70 16.05 15.59 1.67 0.15 2.85 Cereals 5 561 742.67 73.72 13.83 7.40 1.67 0.13 3.25 Teff 1 250 802.08 73.58 10.20 10.53 2.85 - 2.84 Barley 497 966.12 67.17 21.63 5.51 1.13 0.14 4.42 Wheat 1 125 730.56 66.12 19.01 9.34 1.69 0.17 3.67 Maize 434 984.29 84.55 9.70 3.53 0.65 0.27 1.30 Sorghum 2 194 966.48 77.58 8.63 7.30 1.96 0.02 4.51 Finger millet 48 492.60 83.11 10.41 5.23 0.57 - 0.68 Oats “Aja” 8 800.53 74.00 19.89 4.44 - 1.67 - Rice - - - - - - - Pulses 1 429 153.09 49.14 19.88 27.06 1.61 0.22 2.10 Horse beans 365 667.72 64.84 18.57 14.47 0.64 - 1.48 Field peas 203 177.32 51.64 23.93 22.13 1.46 - 0.84 Haricot beans 116 754.34 38.14 14.69 39.16 3.02 - 4.98 Chick – peas 255 006.21 55.65 17.04 19.11 3.37 0.04 4.79 Lentils 158 685.30 34.53 27.74 34.84 0.82 - 2.07 Vetch 278 457.31 44.78 19.93 28.58 3.32 1.59 1.80 Soya beans - - - - - - - Fenugreek 51 404.90 33.38 14.12 52.32 - - 0.18 Gibto - - - - - - - Oilseeds 62 722.12 61.09 13.63 19.80 1.90 - 3.59 Neug 33 776.45 69.82 7.81 13.46 2.99 - 5.93 Linseed 20 269.65 56.27 21.72 17.52 1.12 - 3.37 Groundnuts - - - - - - - Safflower 2 976.69 63.21 6.79 28.95 1.05 - - Sesame 3 988.53 50.76 6.00 31.18 5.88 - 6.18 Rapeseed 1 710.81 61.81 9.00 28.87 0.32 - - Vegetables 125 759.35 87.89 0.64 10.05 - - 1.42 Lettuce 833.71 91.67 - 8.33 - - - Head cabbage 5 769.39 67.56 - 32.44 - - - Ethiopian cabbage 14 957.17 93.99 0.33 4.71 - - 0.97 Tomatoes 25 680.98 74.55 3.41 20.91 - - 1.14 Green peppers 31 361.45 95.66 - 4.34 - - - Red peppers 44 954.15 87.74 0.70 8.88 - - 2.68 Swiss chard 2 202.50 74.00 - 26.00 - - - Root Crops 176 309.28 60.48 16.89 21.10 0.39 0.06 1.08 Beetroot 1 335.05 69.29 - 30.00 - - 0.71 Carrot 2 507.02 62.00 - 38.00 - - - Onion 66 652.44 59.12 4.70 33.78 - - 2.40 Potatoes 44 121.28 69.51 11.04 18.00 - 0.33 1.11 Garlic 55 442.98 57.53 25.41 15.99 0.36 - 0.71 Taro / ‘Godere’ - - - - - - - Sweet potatoes 6 250.52 60.00 - 23.33 16.67 - - Permanent crops 210 485.52 46.53 1.49 48.63 0.26 0.12 2.99 Avocados 1 674.05 100.00 - - - - - Bananas 1 386.85 49.17 - 50.83 - - - Guavas 2 899.43 56.67 - 39.17 - - 4.17 Lemons 1 620.01 36.60 - 53.40 - - 10.00 Mangoes 1 833.70 40.00 - 60.00 - - - Oranges 110 386.60 43.70 1.96 52.07 - 0.65 1.63 Papayas 3 403.54 67.80 - 32.20 - - - Pineapples - - - - - - - Chat 36 826.81 35.64 1.65 59.89 - 0.05 2.77 Coffee 12 497.35 59.93 0.11 39.27 - 0.11 0.57 Hops (Gesho) 7 583.21 44.30 3.14 46.24 - - 6.31 Enset - - - - - - - Sugar cane 30 373.96 25.00 - 65.91 9.09 - -
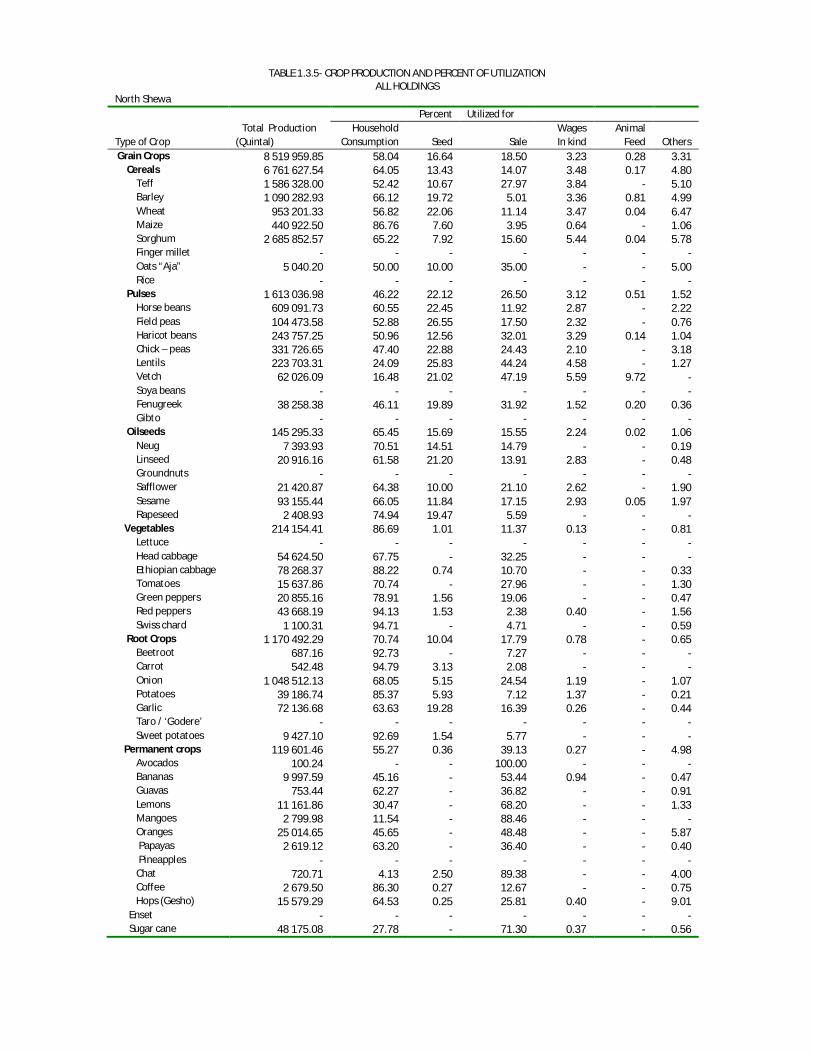
TABLE 1.3.5- CROP PRODUCTION AND PERCENT OF UTILIZATION ALL HOLDINGS
North Shewa Percent Utilized for Total Production Household Wages Animal Type of Crop (Quintal) Consumption Seed Sale In kind Feed Others Grain Crops 8 519 959.85 58.04 16.64 18.50 3.23 0.28 3.31 Cereals 6 761 627.54 64.05 13.43 14.07 3.48 0.17 4.80 Teff 1 586 328.00 52.42 10.67 27.97 3.84 - 5.10 Barley 1 090 282.93 66.12 19.72 5.01 3.36 0.81 4.99 Wheat 953 201.33 56.82 22.06 11.14 3.47 0.04 6.47 Maize 440 922.50 86.76 7.60 3.95 0.64 - 1.06 Sorghum 2 685 852.57 65.22 7.92 15.60 5.44 0.04 5.78 Finger millet - - - - - - - Oats “Aja” 5 040.20 50.00 10.00 35.00 - - 5.00 Rice - - - - - - - Pulses 1 613 036.98 46.22 22.12 26.50 3.12 0.51 1.52 Horse beans 609 091.73 60.55 22.45 11.92 2.87 - 2.22 Field peas 104 473.58 52.88 26.55 17.50 2.32 - 0.76 Haricot beans 243 757.25 50.96 12.56 32.01 3.29 0.14 1.04 Chick – peas 331 726.65 47.40 22.88 24.43 2.10 - 3.18 Lentils 223 703.31 24.09 25.83 44.24 4.58 - 1.27 Vetch 62 026.09 16.48 21.02 47.19 5.59 9.72 - Soya beans - - - - - - - Fenugreek 38 258.38 46.11 19.89 31.92 1.52 0.20 0.36 Gibto - - - - - - - Oilseeds 145 295.33 65.45 15.69 15.55 2.24 0.02 1.06 Neug 7 393.93 70.51 14.51 14.79 - - 0.19 Linseed 20 916.16 61.58 21.20 13.91 2.83 - 0.48 Groundnuts - - - - - - - Safflower 21 420.87 64.38 10.00 21.10 2.62 - 1.90 Sesame 93 155.44 66.05 11.84 17.15 2.93 0.05 1.97 Rapeseed 2 408.93 74.94 19.47 5.59 - - - Vegetables 214 154.41 86.69 1.01 11.37 0.13 - 0.81 Lettuce - - - - - - - Head cabbage 54 624.50 67.75 - 32.25 - - - Ethiopian cabbage 78 268.37 88.22 0.74 10.70 - - 0.33 Tomatoes 15 637.86 70.74 - 27.96 - - 1.30 Green peppers 20 855.16 78.91 1.56 19.06 - - 0.47 Red peppers 43 668.19 94.13 1.53 2.38 0.40 - 1.56 Swiss chard 1 100.31 94.71 - 4.71 - - 0.59 Root Crops 1 170 492.29 70.74 10.04 17.79 0.78 - 0.65 Beetroot 687.16 92.73 - 7.27 - - - Carrot 542.48 94.79 3.13 2.08 - - - Onion 1 048 512.13 68.05 5.15 24.54 1.19 - 1.07 Potatoes 39 186.74 85.37 5.93 7.12 1.37 - 0.21 Garlic 72 136.68 63.63 19.28 16.39 0.26 - 0.44 Taro / ‘Godere’ - - - - - - - Sweet potatoes 9 427.10 92.69 1.54 5.77 - - - Permanent crops 119 601.46 55.27 0.36 39.13 0.27 - 4.98 Avocados 100.24 - - 100.00 - - - Bananas 9 997.59 45.16 - 53.44 0.94 - 0.47 Guavas 753.44 62.27 - 36.82 - - 0.91 Lemons 11 161.86 30.47 - 68.20 - - 1.33 Mangoes 2 799.98 11.54 - 88.46 - - - Oranges 25 014.65 45.65 - 48.48 - - 5.87 Papayas 2 619.12 63.20 - 36.40 - - 0.40 Pineapples - - - - - - - Chat 720.71 4.13 2.50 89.38 - - 4.00 Coffee 2 679.50 86.30 0.27 12.67 - - 0.75 Hops (Gesho) 15 579.29 64.53 0.25 25.81 0.40 - 9.01 Enset - - - - - - - Sugar cane 48 175.08 27.78 - 71.30 0.37 - 0.56
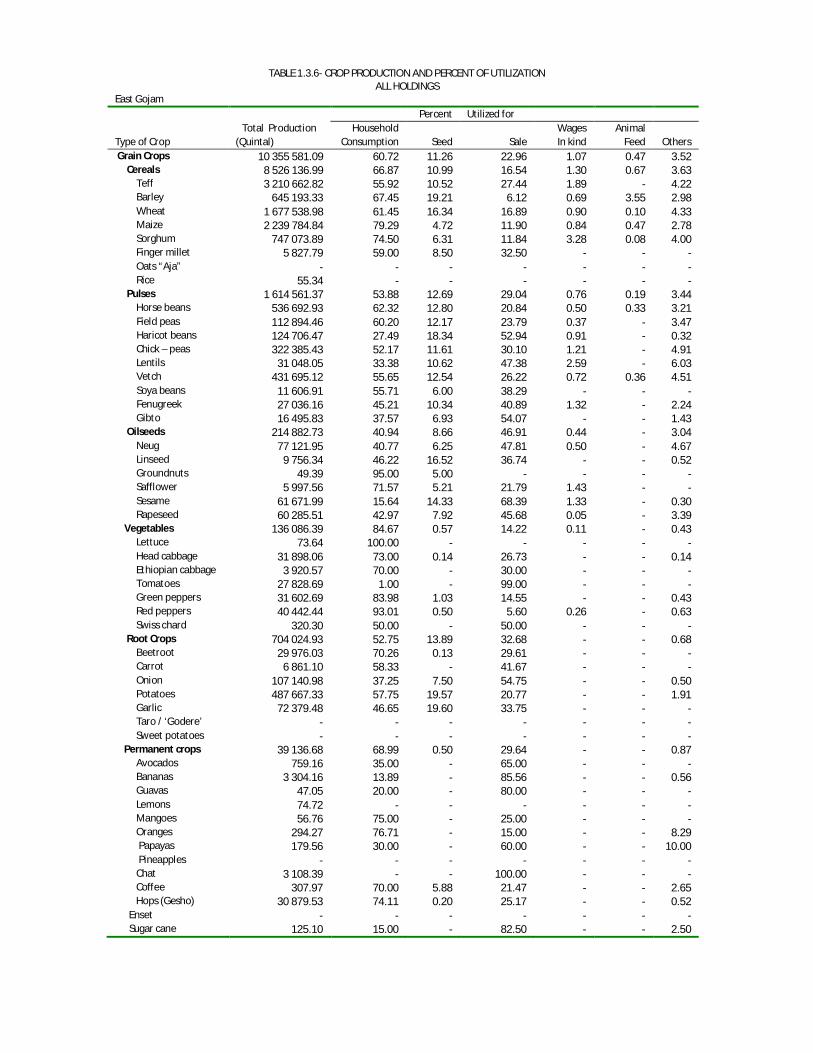
TABLE 1.3.6- CROP PRODUCTION AND PERCENT OF UTILIZATION ALL HOLDINGS
East Gojam Percent Utilized for Total Production Household Wages Animal Type of Crop (Quintal) Consumption Seed Sale In kind Feed Others Grain Crops 10 355 581.09 60.72 11.26 22.96 1.07 0.47 3.52 Cereals 8 526 136.99 66.87 10.99 16.54 1.30 0.67 3.63 Teff 3 210 662.82 55.92 10.52 27.44 1.89 - 4.22 Barley 645 193.33 67.45 19.21 6.12 0.69 3.55 2.98 Wheat 1 677 538.98 61.45 16.34 16.89 0.90 0.10 4.33 Maize 2 239 784.84 79.29 4.72 11.90 0.84 0.47 2.78 Sorghum 747 073.89 74.50 6.31 11.84 3.28 0.08 4.00 Finger millet 5 827.79 59.00 8.50 32.50 - - - Oats “Aja” - - - - - - - Rice 55.34 - - - - - - Pulses 1 614 561.37 53.88 12.69 29.04 0.76 0.19 3.44 Horse beans 536 692.93 62.32 12.80 20.84 0.50 0.33 3.21 Field peas 112 894.46 60.20 12.17 23.79 0.37 - 3.47 Haricot beans 124 706.47 27.49 18.34 52.94 0.91 - 0.32 Chick – peas 322 385.43 52.17 11.61 30.10 1.21 - 4.91 Lentils 31 048.05 33.38 10.62 47.38 2.59 - 6.03 Vetch 431 695.12 55.65 12.54 26.22 0.72 0.36 4.51 Soya beans 11 606.91 55.71 6.00 38.29 - - - Fenugreek 27 036.16 45.21 10.34 40.89 1.32 - 2.24 Gibto 16 495.83 37.57 6.93 54.07 - - 1.43 Oilseeds 214 882.73 40.94 8.66 46.91 0.44 - 3.04 Neug 77 121.95 40.77 6.25 47.81 0.50 - 4.67 Linseed 9 756.34 46.22 16.52 36.74 - - 0.52 Groundnuts 49.39 95.00 5.00 - - - - Safflower 5 997.56 71.57 5.21 21.79 1.43 - - Sesame 61 671.99 15.64 14.33 68.39 1.33 - 0.30 Rapeseed 60 285.51 42.97 7.92 45.68 0.05 - 3.39 Vegetables 136 086.39 84.67 0.57 14.22 0.11 - 0.43 Lettuce 73.64 100.00 - - - - - Head cabbage 31 898.06 73.00 0.14 26.73 - - 0.14 Ethiopian cabbage 3 920.57 70.00 - 30.00 - - - Tomatoes 27 828.69 1.00 - 99.00 - - - Green peppers 31 602.69 83.98 1.03 14.55 - - 0.43 Red peppers 40 442.44 93.01 0.50 5.60 0.26 - 0.63 Swiss chard 320.30 50.00 - 50.00 - - - Root Crops 704 024.93 52.75 13.89 32.68 - - 0.68 Beetroot 29 976.03 70.26 0.13 29.61 - - - Carrot 6 861.10 58.33 - 41.67 - - - Onion 107 140.98 37.25 7.50 54.75 - - 0.50 Potatoes 487 667.33 57.75 19.57 20.77 - - 1.91 Garlic 72 379.48 46.65 19.60 33.75 - - - Taro / ‘Godere’ - - - - - - - Sweet potatoes - - - - - - - Permanent crops 39 136.68 68.99 0.50 29.64 - - 0.87 Avocados 759.16 35.00 - 65.00 - - - Bananas 3 304.16 13.89 - 85.56 - - 0.56 Guavas 47.05 20.00 - 80.00 - - - Lemons 74.72 - - - - - - Mangoes 56.76 75.00 - 25.00 - - - Oranges 294.27 76.71 - 15.00 - - 8.29 Papayas 179.56 30.00 - 60.00 - - 10.00 Pineapples - - - - - - - Chat 3 108.39 - - 100.00 - - - Coffee 307.97 70.00 5.88 21.47 - - 2.65 Hops (Gesho) 30 879.53 74.11 0.20 25.17 - - 0.52 Enset - - - - - - - Sugar cane 125.10 15.00 - 82.50 - - 2.50
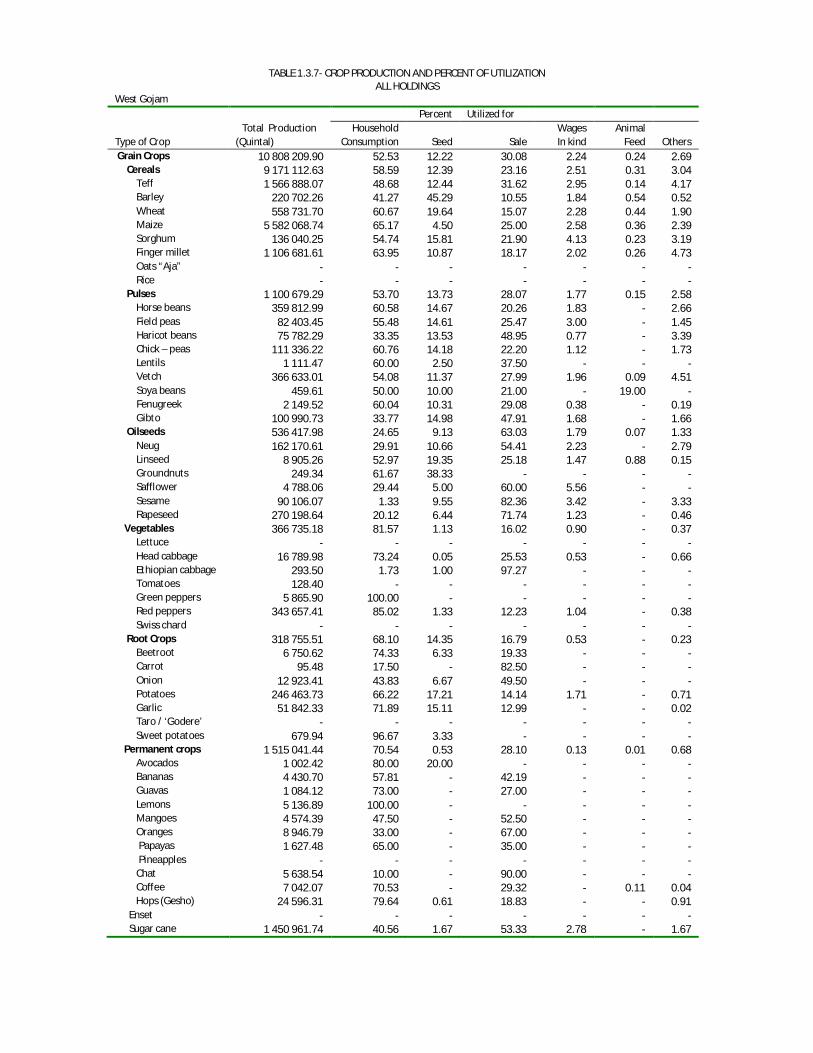
TABLE 1.3.7- CROP PRODUCTION AND PERCENT OF UTILIZATION ALL HOLDINGS
West Gojam Percent Utilized for Total Production Household Wages Animal Type of Crop (Quintal) Consumption Seed Sale In kind Feed Others Grain Crops 10 808 209.90 52.53 12.22 30.08 2.24 0.24 2.69 Cereals 9 171 112.63 58.59 12.39 23.16 2.51 0.31 3.04 Teff 1 566 888.07 48.68 12.44 31.62 2.95 0.14 4.17 Barley 220 702.26 41.27 45.29 10.55 1.84 0.54 0.52 Wheat 558 731.70 60.67 19.64 15.07 2.28 0.44 1.90 Maize 5 582 068.74 65.17 4.50 25.00 2.58 0.36 2.39 Sorghum 136 040.25 54.74 15.81 21.90 4.13 0.23 3.19 Finger millet 1 106 681.61 63.95 10.87 18.17 2.02 0.26 4.73 Oats “Aja” - - - - - - - Rice - - - - - - - Pulses 1 100 679.29 53.70 13.73 28.07 1.77 0.15 2.58 Horse beans 359 812.99 60.58 14.67 20.26 1.83 - 2.66 Field peas 82 403.45 55.48 14.61 25.47 3.00 - 1.45 Haricot beans 75 782.29 33.35 13.53 48.95 0.77 - 3.39 Chick – peas 111 336.22 60.76 14.18 22.20 1.12 - 1.73 Lentils 1 111.47 60.00 2.50 37.50 - - - Vetch 366 633.01 54.08 11.37 27.99 1.96 0.09 4.51 Soya beans 459.61 50.00 10.00 21.00 - 19.00 - Fenugreek 2 149.52 60.04 10.31 29.08 0.38 - 0.19 Gibto 100 990.73 33.77 14.98 47.91 1.68 - 1.66 Oilseeds 536 417.98 24.65 9.13 63.03 1.79 0.07 1.33 Neug 162 170.61 29.91 10.66 54.41 2.23 - 2.79 Linseed 8 905.26 52.97 19.35 25.18 1.47 0.88 0.15 Groundnuts 249.34 61.67 38.33 - - - - Safflower 4 788.06 29.44 5.00 60.00 5.56 - - Sesame 90 106.07 1.33 9.55 82.36 3.42 - 3.33 Rapeseed 270 198.64 20.12 6.44 71.74 1.23 - 0.46 Vegetables 366 735.18 81.57 1.13 16.02 0.90 - 0.37 Lettuce - - - - - - - Head cabbage 16 789.98 73.24 0.05 25.53 0.53 - 0.66 Ethiopian cabbage 293.50 1.73 1.00 97.27 - - - Tomatoes 128.40 - - - - - - Green peppers 5 865.90 100.00 - - - - - Red peppers 343 657.41 85.02 1.33 12.23 1.04 - 0.38 Swiss chard - - - - - - - Root Crops 318 755.51 68.10 14.35 16.79 0.53 - 0.23 Beetroot 6 750.62 74.33 6.33 19.33 - - - Carrot 95.48 17.50 - 82.50 - - - Onion 12 923.41 43.83 6.67 49.50 - - - Potatoes 246 463.73 66.22 17.21 14.14 1.71 - 0.71 Garlic 51 842.33 71.89 15.11 12.99 - - 0.02 Taro / ‘Godere’ - - - - - - - Sweet potatoes 679.94 96.67 3.33 - - - - Permanent crops 1 515 041.44 70.54 0.53 28.10 0.13 0.01 0.68 Avocados 1 002.42 80.00 20.00 - - - - Bananas 4 430.70 57.81 - 42.19 - - - Guavas 1 084.12 73.00 - 27.00 - - - Lemons 5 136.89 100.00 - - - - - Mangoes 4 574.39 47.50 - 52.50 - - - Oranges 8 946.79 33.00 - 67.00 - - - Papayas 1 627.48 65.00 - 35.00 - - - Pineapples - - - - - - - Chat 5 638.54 10.00 - 90.00 - - - Coffee 7 042.07 70.53 - 29.32 - 0.11 0.04 Hops (Gesho) 24 596.31 79.64 0.61 18.83 - - 0.91 Enset - - - - - - - Sugar cane 1 450 961.74 40.56 1.67 53.33 2.78 - 1.67

TABLE 1.3.8- CROP PRODUCTION AND PERCENT OF UTILIZATION ALL HOLDINGS
Waghmera Percent Utilized for Total Production Household Wages Animal Type of Crop (Quintal) Consumption Seed Sale In kind Feed Others Grain Crops 1 474 667.13 65.40 17.75 9.00 0.88 0.06 6.92 Cereals 1 233 473.79 70.21 16.82 4.36 0.87 0.09 7.64 Teff 293 567.13 67.70 17.00 5.62 0.79 0.08 8.81 Barley 117 880.10 59.79 25.41 4.17 1.04 0.02 9.57 Wheat 61 719.58 63.14 25.20 3.43 0.36 0.11 7.75 Maize 47 000.27 83.60 11.79 1.66 0.31 0.08 2.56 Sorghum 712 309.38 72.07 11.23 5.91 1.46 0.15 9.19 Finger millet 997.33 86.63 10.63 1.25 - - 1.50 Oats “Aja” - - - - - - - Rice - - - - - - - Pulses 189 264.54 60.56 21.96 9.66 0.91 - 6.91 Horse beans 73 424.41 60.13 23.11 8.90 0.43 - 7.42 Field peas 46 792.88 58.44 23.57 6.63 1.60 - 9.77 Haricot beans 43 180.44 68.87 16.63 7.58 1.32 - 5.60 Chick – peas 6 145.32 65.35 23.77 3.27 - - 7.62 Lentils 18 930.49 41.58 27.77 23.96 0.99 - 5.70 Vetch 185.92 80.00 20.00 - - - - Soya beans - - - - - - - Fenugreek 605.10 84.21 12.61 2.73 - - 0.45 Gibto - - - - - - - Oilseeds 51 928.79 50.57 14.14 31.19 0.80 - 3.30 Neug 1 798.86 60.39 11.75 23.11 1.79 - 2.96 Linseed 6 638.19 68.96 18.86 9.39 0.62 - 2.17 Groundnuts 16.43 - - - - - - Safflower 3 197.52 68.02 15.15 13.43 0.43 - 2.98 Sesame 40 277.79 26.34 10.53 57.85 0.87 - 4.41 Rapeseed - - - - - - - Vegetables 18 684.09 69.20 0.20 29.92 - - 0.68 Lettuce - - - - - - - Head cabbage 362.70 49.86 - 50.14 - - - Ethiopian cabbage 3 362.46 59.38 1.88 38.75 - - - Tomatoes 7 103.28 53.64 - 46.36 - - - Green peppers 7 439.33 75.97 - 23.27 - - 0.76 Red peppers 416.31 80.00 - 18.33 - - 1.67 Swiss chard - - - - - - - Root Crops 43 413.41 79.50 9.83 9.86 - - 0.81 Beetroot 596.98 40.00 - 60.00 - - - Carrot 31.76 50.00 - 50.00 - - - Onion 6 953.06 49.63 9.38 41.00 - - - Potatoes 28 989.26 86.22 8.28 3.50 - - 2.00 Garlic 6 809.49 80.00 12.41 7.59 - - - Taro / ‘Godere’ - - - - - - - Sweet potatoes 32.86 100.00 - - - - - Permanent crops 22 598.40 32.83 - 66.05 - - 1.13 Avocados 6.31 - - - - - - Bananas 808.95 15.71 - 84.29 - - - Guavas 13.81 1.00 - 99.00 - - - Lemons 153.53 15.00 - 80.00 - - 5.00 Mangoes 5.73 - - - - - - Oranges 101.91 10.00 - 90.00 - - - Papayas 59.98 65.00 - 35.00 - - - Pineapples - - - - - - - Chat 30.75 - - 100.00 - - - Coffee 12.66 78.33 - 21.67 - - - Hops (Gesho) 57.32 40.17 - 57.75 - - 2.08 Enset - - - - - - - Sugar cane 21 347.46 10.00 - 90.00 - - -

TABLE 1.3.9- CROP PRODUCTION AND PERCENT OF UTILIZATION
ALL HOLDINGS Awi Percent Utilized for Total Production Household Wages Animal Type of Crop (Quintal) Consumption Seed Sale In kind Feed Others Grain Crops 4 492 816.86 59.56 10.32 23.50 3.08 0.22 3.31 Cereals 3 956 619.11 68.55 10.41 14.25 3.22 0.31 3.27 Teff 983 174.98 61.77 12.82 17.11 4.07 - 4.23 Barley 84 531.22 69.97 16.80 8.36 1.35 1.09 2.42 Wheat 345 318.80 61.28 16.23 14.69 3.42 0.02 4.37 Maize 1 789 004.13 77.00 4.41 13.58 2.47 0.60 1.94 Sorghum 54 849.69 59.44 7.72 20.69 8.94 0.42 2.78 Finger millet 692 086.58 66.59 12.40 13.38 3.43 0.02 4.18 Oats “Aja” 110.58 75.00 25.00 - - - - Rice 7 543.14 75.40 15.20 - - - 9.40 Pulses 334 575.24 53.01 12.89 27.79 2.28 - 4.03 Horse beans 108 431.29 70.57 13.81 12.86 1.28 - 1.47 Field peas 28 626.15 79.18 9.49 6.73 1.42 - 3.18 Haricot beans 14 633.89 64.82 15.88 3.12 14.71 - 1.47 Chick – peas 30 350.23 47.73 11.27 29.00 9.73 - 2.27 Lentils - - - - - - - Vetch - - - - - - - Soya beans 7 425.41 - 28.43 68.71 2.86 - - Fenugreek 495.28 68.33 11.67 15.24 - - 4.76 Gibto 144 612.98 17.04 12.71 61.04 1.07 - 8.13 Oilseeds 201 622.51 22.93 7.17 63.87 3.29 - 2.74 Neug 57 010.34 11.18 9.04 72.57 5.13 - 2.08 Linseed 754.64 54.00 31.00 - - - 15.00 Groundnuts 22 612.83 4.57 15.61 72.52 7.30 - - Safflower - - - - - - - Sesame 23 684.62 4.61 6.32 78.00 8.46 - 2.61 Rapeseed 97 560.07 36.73 4.10 55.83 0.19 - 3.15 Vegetables 178 514.90 59.41 1.09 36.58 2.51 0.01 0.39 Lettuce 22.34 - - - - - - Head cabbage 9 409.53 34.17 - 65.83 - - - Ethiopian cabbage 8 295.24 100.00 - - - - - Tomatoes 20.58 - - 100.00 - - - Green peppers 5 269.98 94.52 0.38 5.00 - 0.10 - Red peppers 155 497.24 55.37 1.33 39.64 3.17 - 0.49 Swiss chard - - - - - - - Root Crops 297 792.15 72.69 10.83 14.48 0.61 - 1.39 Beetroot 256.53 35.00 - 65.00 - - - Carrot 55.49 - 50.00 50.00 - - - Onion 6 049.06 32.19 10.00 57.19 0.63 - - Potatoes 258 501.05 77.71 10.51 9.15 0.64 - 1.99 Garlic 23 399.87 74.84 13.94 11.21 - - - Taro / ‘Godere’ - - - - - - - Sweet potatoes 9 530.14 87.47 1.32 3.68 2.95 - 4.58 Permanent crops 207 038.07 58.40 0.78 40.49 - - 0.32 Avocados 80.74 100.00 - - - - - Bananas 1 334.93 50.23 - 49.77 - - - Guavas 6.56 100.00 - - - - - Lemons 3 366.13 72.00 18.00 5.00 - - 5.00 Mangoes 624.35 62.50 - 37.50 - - - Oranges 6 935.15 28.89 - 70.56 - - 0.56 Papayas 1 572.03 44.80 13.40 41.80 - - - Pineapples - - - - - - - Chat 1 307.04 - - 100.00 - - - Coffee 1 431.18 81.45 0.18 18.36 - - - Hops (Gesho) 2 304.37 57.86 0.21 41.52 - - 0.42 Enset - - - - - - - Sugar cane 188 075.57 36.55 - 63.45 - - -
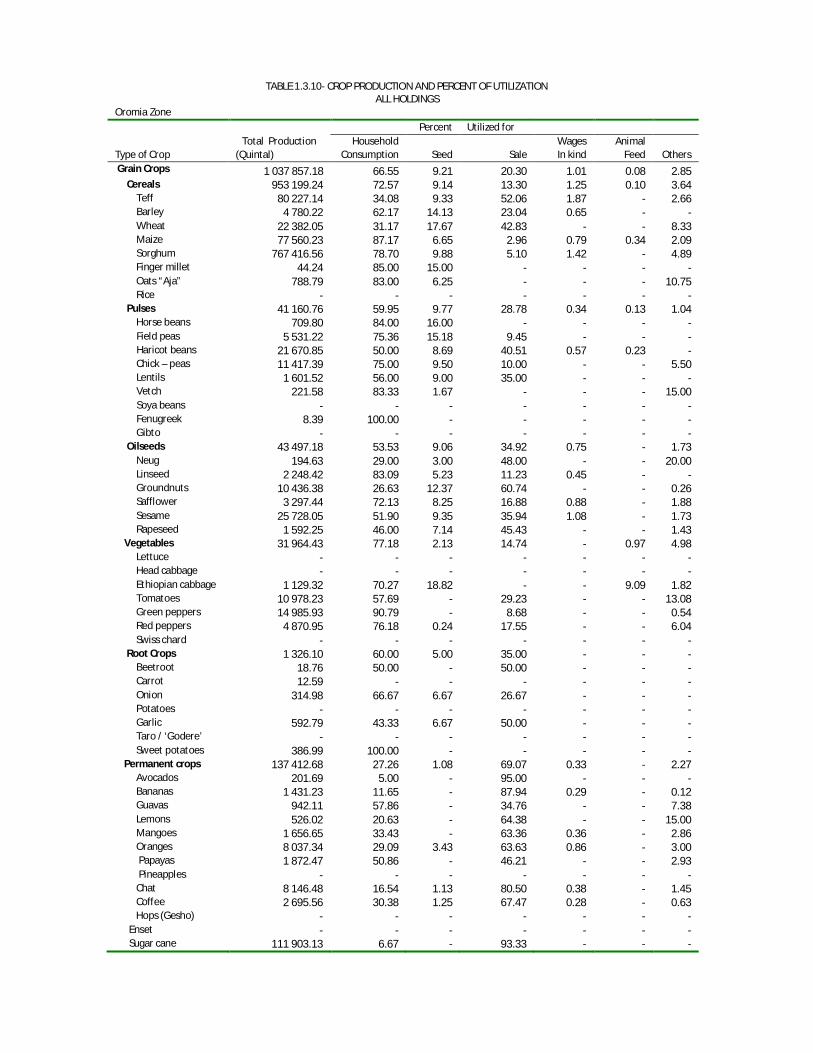
TABLE 1.3.10- CROP PRODUCTION AND PERCENT OF UTILIZATION
ALL HOLDINGS Oromia Zone Percent Utilized for Total Production Household Wages Animal Type of Crop (Quintal) Consumption Seed Sale In kind Feed Others Grain Crops 1 037 857.18 66.55 9.21 20.30 1.01 0.08 2.85 Cereals 953 199.24 72.57 9.14 13.30 1.25 0.10 3.64 Teff 80 227.14 34.08 9.33 52.06 1.87 - 2.66 Barley 4 780.22 62.17 14.13 23.04 0.65 - - Wheat 22 382.05 31.17 17.67 42.83 - - 8.33 Maize 77 560.23 87.17 6.65 2.96 0.79 0.34 2.09 Sorghum 767 416.56 78.70 9.88 5.10 1.42 - 4.89 Finger millet 44.24 85.00 15.00 - - - - Oats “Aja” 788.79 83.00 6.25 - - - 10.75 Rice - - - - - - - Pulses 41 160.76 59.95 9.77 28.78 0.34 0.13 1.04 Horse beans 709.80 84.00 16.00 - - - - Field peas 5 531.22 75.36 15.18 9.45 - - - Haricot beans 21 670.85 50.00 8.69 40.51 0.57 0.23 - Chick – peas 11 417.39 75.00 9.50 10.00 - - 5.50 Lentils 1 601.52 56.00 9.00 35.00 - - - Vetch 221.58 83.33 1.67 - - - 15.00 Soya beans - - - - - - - Fenugreek 8.39 100.00 - - - - - Gibto - - - - - - - Oilseeds 43 497.18 53.53 9.06 34.92 0.75 - 1.73 Neug 194.63 29.00 3.00 48.00 - - 20.00 Linseed 2 248.42 83.09 5.23 11.23 0.45 - - Groundnuts 10 436.38 26.63 12.37 60.74 - - 0.26 Safflower 3 297.44 72.13 8.25 16.88 0.88 - 1.88 Sesame 25 728.05 51.90 9.35 35.94 1.08 - 1.73 Rapeseed 1 592.25 46.00 7.14 45.43 - - 1.43 Vegetables 31 964.43 77.18 2.13 14.74 - 0.97 4.98 Lettuce - - - - - - - Head cabbage - - - - - - - Ethiopian cabbage 1 129.32 70.27 18.82 - - 9.09 1.82 Tomatoes 10 978.23 57.69 - 29.23 - - 13.08 Green peppers 14 985.93 90.79 - 8.68 - - 0.54 Red peppers 4 870.95 76.18 0.24 17.55 - - 6.04 Swiss chard - - - - - - - Root Crops 1 326.10 60.00 5.00 35.00 - - - Beetroot 18.76 50.00 - 50.00 - - - Carrot 12.59 - - - - - - Onion 314.98 66.67 6.67 26.67 - - - Potatoes - - - - - - - Garlic 592.79 43.33 6.67 50.00 - - - Taro / ‘Godere’ - - - - - - - Sweet potatoes 386.99 100.00 - - - - - Permanent crops 137 412.68 27.26 1.08 69.07 0.33 - 2.27 Avocados 201.69 5.00 - 95.00 - - - Bananas 1 431.23 11.65 - 87.94 0.29 - 0.12 Guavas 942.11 57.86 - 34.76 - - 7.38 Lemons 526.02 20.63 - 64.38 - - 15.00 Mangoes 1 656.65 33.43 - 63.36 0.36 - 2.86 Oranges 8 037.34 29.09 3.43 63.63 0.86 - 3.00 Papayas 1 872.47 50.86 - 46.21 - - 2.93 Pineapples - - - - - - - Chat 8 146.48 16.54 1.13 80.50 0.38 - 1.45 Coffee 2 695.56 30.38 1.25 67.47 0.28 - 0.63 Hops (Gesho) - - - - - - - Enset - - - - - - - Sugar cane 111 903.13 6.67 - 93.33 - - -
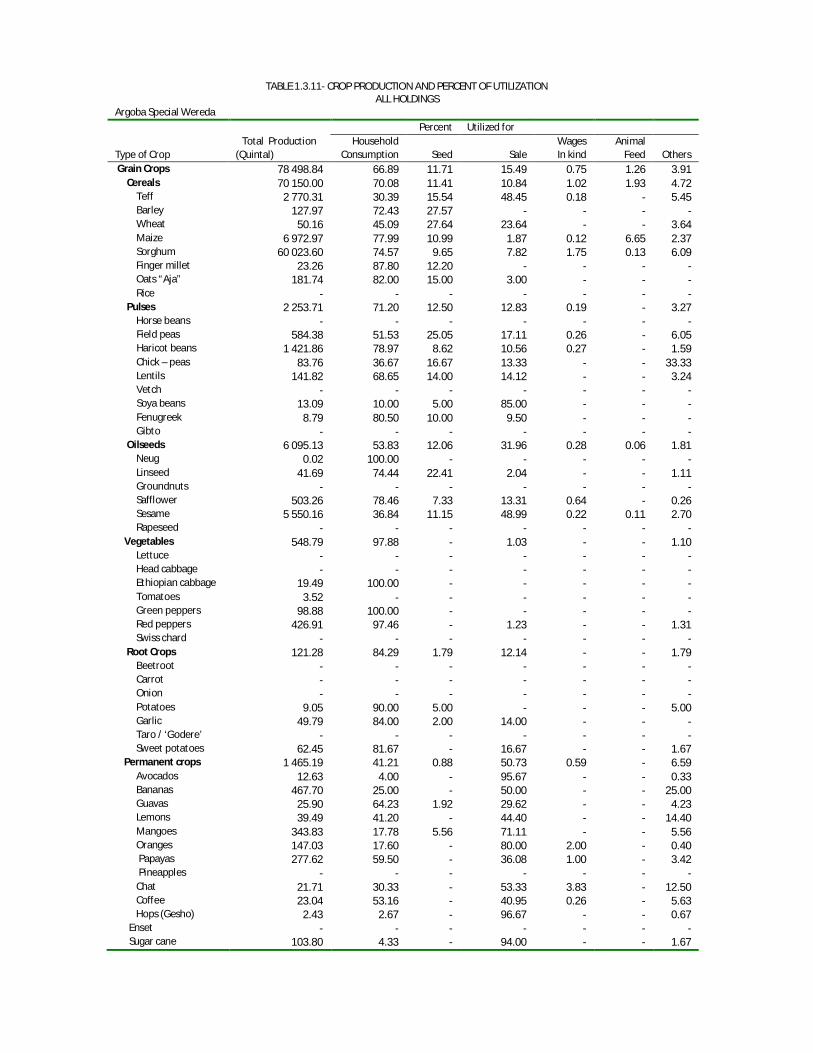
TABLE 1.3.11- CROP PRODUCTION AND PERCENT OF UTILIZATION
ALL HOLDINGS Argoba Special Wereda Percent Utilized for Total Production Household Wages Animal Type of Crop (Quintal) Consumption Seed Sale In kind Feed Others Grain Crops 78 498.84 66.89 11.71 15.49 0.75 1.26 3.91 Cereals 70 150.00 70.08 11.41 10.84 1.02 1.93 4.72 Teff 2 770.31 30.39 15.54 48.45 0.18 - 5.45 Barley 127.97 72.43 27.57 - - - - Wheat 50.16 45.09 27.64 23.64 - - 3.64 Maize 6 972.97 77.99 10.99 1.87 0.12 6.65 2.37 Sorghum 60 023.60 74.57 9.65 7.82 1.75 0.13 6.09 Finger millet 23.26 87.80 12.20 - - - - Oats “Aja” 181.74 82.00 15.00 3.00 - - - Rice - - - - - - - Pulses 2 253.71 71.20 12.50 12.83 0.19 - 3.27 Horse beans - - - - - - - Field peas 584.38 51.53 25.05 17.11 0.26 - 6.05 Haricot beans 1 421.86 78.97 8.62 10.56 0.27 - 1.59 Chick – peas 83.76 36.67 16.67 13.33 - - 33.33 Lentils 141.82 68.65 14.00 14.12 - - 3.24 Vetch - - - - - - - Soya beans 13.09 10.00 5.00 85.00 - - - Fenugreek 8.79 80.50 10.00 9.50 - - - Gibto - - - - - - - Oilseeds 6 095.13 53.83 12.06 31.96 0.28 0.06 1.81 Neug 0.02 100.00 - - - - - Linseed 41.69 74.44 22.41 2.04 - - 1.11 Groundnuts - - - - - - - Safflower 503.26 78.46 7.33 13.31 0.64 - 0.26 Sesame 5 550.16 36.84 11.15 48.99 0.22 0.11 2.70 Rapeseed - - - - - - - Vegetables 548.79 97.88 - 1.03 - - 1.10 Lettuce - - - - - - - Head cabbage - - - - - - - Ethiopian cabbage 19.49 100.00 - - - - - Tomatoes 3.52 - - - - - - Green peppers 98.88 100.00 - - - - - Red peppers 426.91 97.46 - 1.23 - - 1.31 Swiss chard - - - - - - - Root Crops 121.28 84.29 1.79 12.14 - - 1.79 Beetroot - - - - - - - Carrot - - - - - - - Onion - - - - - - - Potatoes 9.05 90.00 5.00 - - - 5.00 Garlic 49.79 84.00 2.00 14.00 - - - Taro / ‘Godere’ - - - - - - - Sweet potatoes 62.45 81.67 - 16.67 - - 1.67 Permanent crops 1 465.19 41.21 0.88 50.73 0.59 - 6.59 Avocados 12.63 4.00 - 95.67 - - 0.33 Bananas 467.70 25.00 - 50.00 - - 25.00 Guavas 25.90 64.23 1.92 29.62 - - 4.23 Lemons 39.49 41.20 - 44.40 - - 14.40 Mangoes 343.83 17.78 5.56 71.11 - - 5.56 Oranges 147.03 17.60 - 80.00 2.00 - 0.40 Papayas 277.62 59.50 - 36.08 1.00 - 3.42 Pineapples - - - - - - - Chat 21.71 30.33 - 53.33 3.83 - 12.50 Coffee 23.04 53.16 - 40.95 0.26 - 5.63 Hops (Gesho) 2.43 2.67 - 96.67 - - 0.67 Enset - - - - - - - Sugar cane 103.80 4.33 - 94.00 - - 1.67
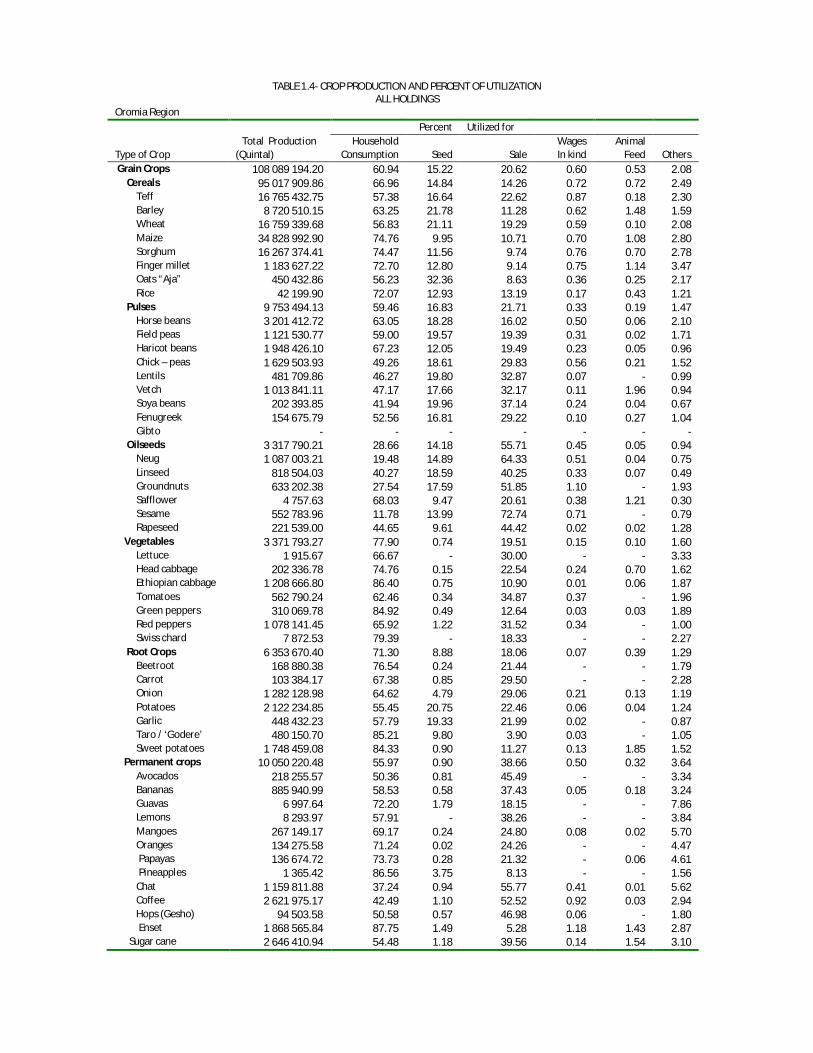
TABLE 1.4- CROP PRODUCTION AND PERCENT OF UTILIZATION
ALL HOLDINGS Oromia Region Percent Utilized for Total Production Household Wages Animal Type of Crop (Quintal) Consumption Seed Sale In kind Feed Others Grain Crops 108 089 194.20 60.94 15.22 20.62 0.60 0.53 2.08 Cereals 95 017 909.86 66.96 14.84 14.26 0.72 0.72 2.49 Teff 16 765 432.75 57.38 16.64 22.62 0.87 0.18 2.30 Barley 8 720 510.15 63.25 21.78 11.28 0.62 1.48 1.59 Wheat 16 759 339.68 56.83 21.11 19.29 0.59 0.10 2.08 Maize 34 828 992.90 74.76 9.95 10.71 0.70 1.08 2.80 Sorghum 16 267 374.41 74.47 11.56 9.74 0.76 0.70 2.78 Finger millet 1 183 627.22 72.70 12.80 9.14 0.75 1.14 3.47 Oats “Aja” 450 432.86 56.23 32.36 8.63 0.36 0.25 2.17 Rice 42 199.90 72.07 12.93 13.19 0.17 0.43 1.21 Pulses 9 753 494.13 59.46 16.83 21.71 0.33 0.19 1.47 Horse beans 3 201 412.72 63.05 18.28 16.02 0.50 0.06 2.10 Field peas 1 121 530.77 59.00 19.57 19.39 0.31 0.02 1.71 Haricot beans 1 948 426.10 67.23 12.05 19.49 0.23 0.05 0.96 Chick – peas 1 629 503.93 49.26 18.61 29.83 0.56 0.21 1.52 Lentils 481 709.86 46.27 19.80 32.87 0.07 - 0.99 Vetch 1 013 841.11 47.17 17.66 32.17 0.11 1.96 0.94 Soya beans 202 393.85 41.94 19.96 37.14 0.24 0.04 0.67 Fenugreek 154 675.79 52.56 16.81 29.22 0.10 0.27 1.04 Gibto - - - - - - - Oilseeds 3 317 790.21 28.66 14.18 55.71 0.45 0.05 0.94 Neug 1 087 003.21 19.48 14.89 64.33 0.51 0.04 0.75 Linseed 818 504.03 40.27 18.59 40.25 0.33 0.07 0.49 Groundnuts 633 202.38 27.54 17.59 51.85 1.10 - 1.93 Safflower 4 757.63 68.03 9.47 20.61 0.38 1.21 0.30 Sesame 552 783.96 11.78 13.99 72.74 0.71 - 0.79 Rapeseed 221 539.00 44.65 9.61 44.42 0.02 0.02 1.28 Vegetables 3 371 793.27 77.90 0.74 19.51 0.15 0.10 1.60 Lettuce 1 915.67 66.67 - 30.00 - - 3.33 Head cabbage 202 336.78 74.76 0.15 22.54 0.24 0.70 1.62 Ethiopian cabbage 1 208 666.80 86.40 0.75 10.90 0.01 0.06 1.87 Tomatoes 562 790.24 62.46 0.34 34.87 0.37 - 1.96 Green peppers 310 069.78 84.92 0.49 12.64 0.03 0.03 1.89 Red peppers 1 078 141.45 65.92 1.22 31.52 0.34 - 1.00 Swiss chard 7 872.53 79.39 - 18.33 - - 2.27 Root Crops 6 353 670.40 71.30 8.88 18.06 0.07 0.39 1.29 Beetroot 168 880.38 76.54 0.24 21.44 - - 1.79 Carrot 103 384.17 67.38 0.85 29.50 - - 2.28 Onion 1 282 128.98 64.62 4.79 29.06 0.21 0.13 1.19 Potatoes 2 122 234.85 55.45 20.75 22.46 0.06 0.04 1.24 Garlic 448 432.23 57.79 19.33 21.99 0.02 - 0.87 Taro / ‘Godere’ 480 150.70 85.21 9.80 3.90 0.03 - 1.05 Sweet potatoes 1 748 459.08 84.33 0.90 11.27 0.13 1.85 1.52 Permanent crops 10 050 220.48 55.97 0.90 38.66 0.50 0.32 3.64 Avocados 218 255.57 50.36 0.81 45.49 - - 3.34 Bananas 885 940.99 58.53 0.58 37.43 0.05 0.18 3.24 Guavas 6 997.64 72.20 1.79 18.15 - - 7.86 Lemons 8 293.97 57.91 - 38.26 - - 3.84 Mangoes 267 149.17 69.17 0.24 24.80 0.08 0.02 5.70 Oranges 134 275.58 71.24 0.02 24.26 - - 4.47 Papayas 136 674.72 73.73 0.28 21.32 - 0.06 4.61 Pineapples 1 365.42 86.56 3.75 8.13 - - 1.56 Chat 1 159 811.88 37.24 0.94 55.77 0.41 0.01 5.62 Coffee 2 621 975.17 42.49 1.10 52.52 0.92 0.03 2.94 Hops (Gesho) 94 503.58 50.58 0.57 46.98 0.06 - 1.80 Enset 1 868 565.84 87.75 1.49 5.28 1.18 1.43 2.87 Sugar cane 2 646 410.94 54.48 1.18 39.56 0.14 1.54 3.10
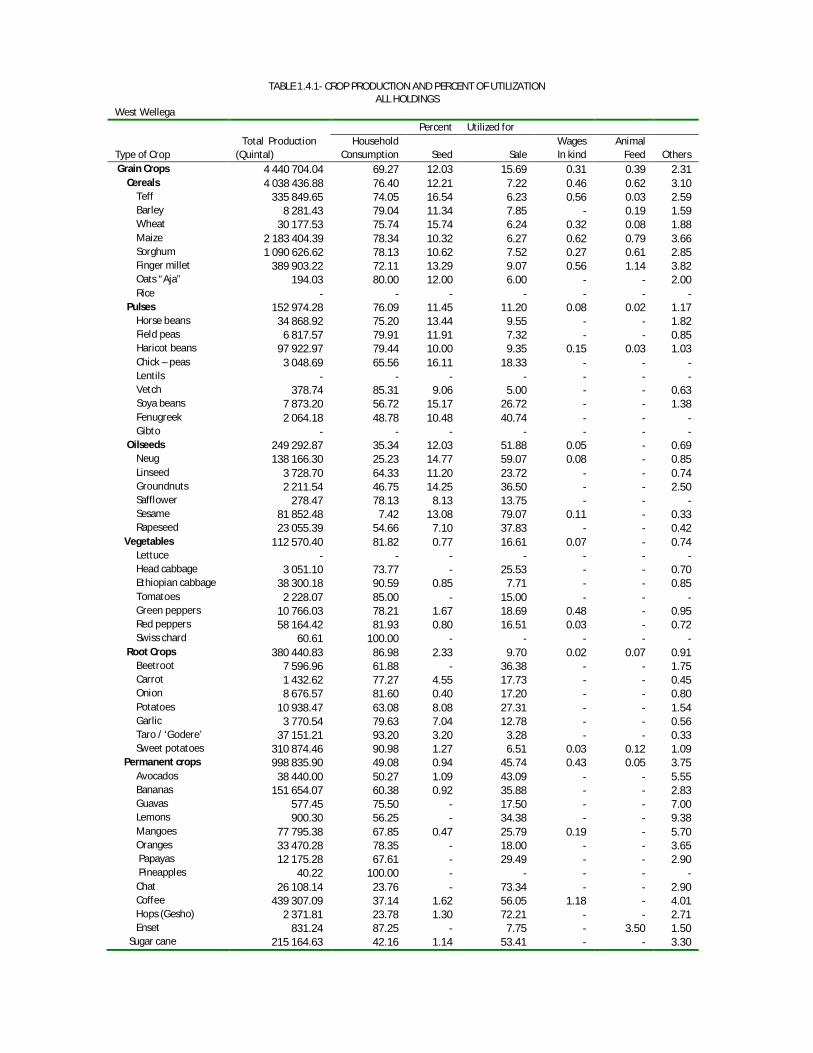
TABLE 1.4.1- CROP PRODUCTION AND PERCENT OF UTILIZATION
ALL HOLDINGS West Wellega Percent Utilized for Total Production Household Wages Animal Type of Crop (Quintal) Consumption Seed Sale In kind Feed Others Grain Crops 4 440 704.04 69.27 12.03 15.69 0.31 0.39 2.31 Cereals 4 038 436.88 76.40 12.21 7.22 0.46 0.62 3.10 Teff 335 849.65 74.05 16.54 6.23 0.56 0.03 2.59 Barley 8 281.43 79.04 11.34 7.85 - 0.19 1.59 Wheat 30 177.53 75.74 15.74 6.24 0.32 0.08 1.88 Maize 2 183 404.39 78.34 10.32 6.27 0.62 0.79 3.66 Sorghum 1 090 626.62 78.13 10.62 7.52 0.27 0.61 2.85 Finger millet 389 903.22 72.11 13.29 9.07 0.56 1.14 3.82 Oats “Aja” 194.03 80.00 12.00 6.00 - - 2.00 Rice - - - - - - - Pulses 152 974.28 76.09 11.45 11.20 0.08 0.02 1.17 Horse beans 34 868.92 75.20 13.44 9.55 - - 1.82 Field peas 6 817.57 79.91 11.91 7.32 - - 0.85 Haricot beans 97 922.97 79.44 10.00 9.35 0.15 0.03 1.03 Chick – peas 3 048.69 65.56 16.11 18.33 - - - Lentils - - - - - - - Vetch 378.74 85.31 9.06 5.00 - - 0.63 Soya beans 7 873.20 56.72 15.17 26.72 - - 1.38 Fenugreek 2 064.18 48.78 10.48 40.74 - - - Gibto - - - - - - - Oilseeds 249 292.87 35.34 12.03 51.88 0.05 - 0.69 Neug 138 166.30 25.23 14.77 59.07 0.08 - 0.85 Linseed 3 728.70 64.33 11.20 23.72 - - 0.74 Groundnuts 2 211.54 46.75 14.25 36.50 - - 2.50 Safflower 278.47 78.13 8.13 13.75 - - - Sesame 81 852.48 7.42 13.08 79.07 0.11 - 0.33 Rapeseed 23 055.39 54.66 7.10 37.83 - - 0.42 Vegetables 112 570.40 81.82 0.77 16.61 0.07 - 0.74 Lettuce - - - - - - - Head cabbage 3 051.10 73.77 - 25.53 - - 0.70 Ethiopian cabbage 38 300.18 90.59 0.85 7.71 - - 0.85 Tomatoes 2 228.07 85.00 - 15.00 - - - Green peppers 10 766.03 78.21 1.67 18.69 0.48 - 0.95 Red peppers 58 164.42 81.93 0.80 16.51 0.03 - 0.72 Swiss chard 60.61 100.00 - - - - - Root Crops 380 440.83 86.98 2.33 9.70 0.02 0.07 0.91 Beetroot 7 596.96 61.88 - 36.38 - - 1.75 Carrot 1 432.62 77.27 4.55 17.73 - - 0.45 Onion 8 676.57 81.60 0.40 17.20 - - 0.80 Potatoes 10 938.47 63.08 8.08 27.31 - - 1.54 Garlic 3 770.54 79.63 7.04 12.78 - - 0.56 Taro / ‘Godere’ 37 151.21 93.20 3.20 3.28 - - 0.33 Sweet potatoes 310 874.46 90.98 1.27 6.51 0.03 0.12 1.09 Permanent crops 998 835.90 49.08 0.94 45.74 0.43 0.05 3.75 Avocados 38 440.00 50.27 1.09 43.09 - - 5.55 Bananas 151 654.07 60.38 0.92 35.88 - - 2.83 Guavas 577.45 75.50 - 17.50 - - 7.00 Lemons 900.30 56.25 - 34.38 - - 9.38 Mangoes 77 795.38 67.85 0.47 25.79 0.19 - 5.70 Oranges 33 470.28 78.35 - 18.00 - - 3.65 Papayas 12 175.28 67.61 - 29.49 - - 2.90 Pineapples 40.22 100.00 - - - - - Chat 26 108.14 23.76 - 73.34 - - 2.90 Coffee 439 307.09 37.14 1.62 56.05 1.18 - 4.01 Hops (Gesho) 2 371.81 23.78 1.30 72.21 - - 2.71 Enset 831.24 87.25 - 7.75 - 3.50 1.50 Sugar cane 215 164.63 42.16 1.14 53.41 - - 3.30
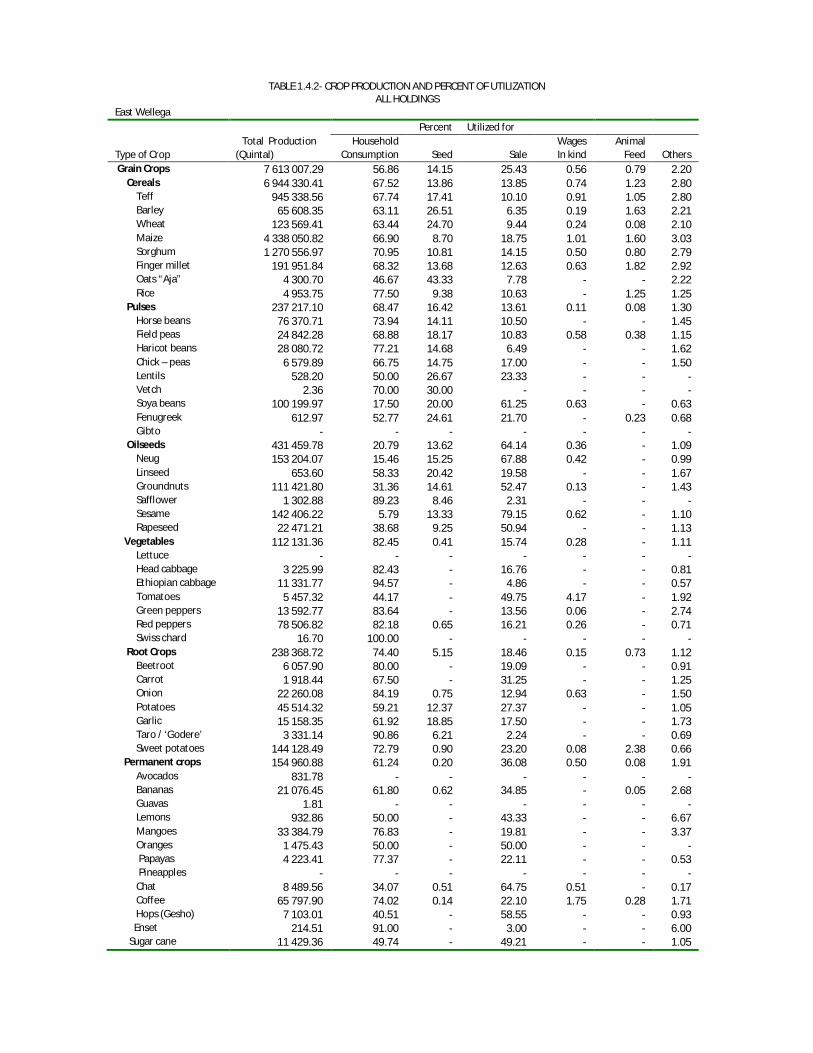
TABLE 1.4.2- CROP PRODUCTION AND PERCENT OF UTILIZATION
ALL HOLDINGS East Wellega Percent Utilized for Total Production Household Wages Animal Type of Crop (Quintal) Consumption Seed Sale In kind Feed Others Grain Crops 7 613 007.29 56.86 14.15 25.43 0.56 0.79 2.20 Cereals 6 944 330.41 67.52 13.86 13.85 0.74 1.23 2.80 Teff 945 338.56 67.74 17.41 10.10 0.91 1.05 2.80 Barley 65 608.35 63.11 26.51 6.35 0.19 1.63 2.21 Wheat 123 569.41 63.44 24.70 9.44 0.24 0.08 2.10 Maize 4 338 050.82 66.90 8.70 18.75 1.01 1.60 3.03 Sorghum 1 270 556.97 70.95 10.81 14.15 0.50 0.80 2.79 Finger millet 191 951.84 68.32 13.68 12.63 0.63 1.82 2.92 Oats “Aja” 4 300.70 46.67 43.33 7.78 - - 2.22 Rice 4 953.75 77.50 9.38 10.63 - 1.25 1.25 Pulses 237 217.10 68.47 16.42 13.61 0.11 0.08 1.30 Horse beans 76 370.71 73.94 14.11 10.50 - - 1.45 Field peas 24 842.28 68.88 18.17 10.83 0.58 0.38 1.15 Haricot beans 28 080.72 77.21 14.68 6.49 - - 1.62 Chick – peas 6 579.89 66.75 14.75 17.00 - - 1.50 Lentils 528.20 50.00 26.67 23.33 - - - Vetch 2.36 70.00 30.00 - - - - Soya beans 100 199.97 17.50 20.00 61.25 0.63 - 0.63 Fenugreek 612.97 52.77 24.61 21.70 - 0.23 0.68 Gibto - - - - - - - Oilseeds 431 459.78 20.79 13.62 64.14 0.36 - 1.09 Neug 153 204.07 15.46 15.25 67.88 0.42 - 0.99 Linseed 653.60 58.33 20.42 19.58 - - 1.67 Groundnuts 111 421.80 31.36 14.61 52.47 0.13 - 1.43 Safflower 1 302.88 89.23 8.46 2.31 - - - Sesame 142 406.22 5.79 13.33 79.15 0.62 - 1.10 Rapeseed 22 471.21 38.68 9.25 50.94 - - 1.13 Vegetables 112 131.36 82.45 0.41 15.74 0.28 - 1.11 Lettuce - - - - - - - Head cabbage 3 225.99 82.43 - 16.76 - - 0.81 Ethiopian cabbage 11 331.77 94.57 - 4.86 - - 0.57 Tomatoes 5 457.32 44.17 - 49.75 4.17 - 1.92 Green peppers 13 592.77 83.64 - 13.56 0.06 - 2.74 Red peppers 78 506.82 82.18 0.65 16.21 0.26 - 0.71 Swiss chard 16.70 100.00 - - - - - Root Crops 238 368.72 74.40 5.15 18.46 0.15 0.73 1.12 Beetroot 6 057.90 80.00 - 19.09 - - 0.91 Carrot 1 918.44 67.50 - 31.25 - - 1.25 Onion 22 260.08 84.19 0.75 12.94 0.63 - 1.50 Potatoes 45 514.32 59.21 12.37 27.37 - - 1.05 Garlic 15 158.35 61.92 18.85 17.50 - - 1.73 Taro / ‘Godere’ 3 331.14 90.86 6.21 2.24 - - 0.69 Sweet potatoes 144 128.49 72.79 0.90 23.20 0.08 2.38 0.66 Permanent crops 154 960.88 61.24 0.20 36.08 0.50 0.08 1.91 Avocados 831.78 - - - - - - Bananas 21 076.45 61.80 0.62 34.85 - 0.05 2.68 Guavas 1.81 - - - - - - Lemons 932.86 50.00 - 43.33 - - 6.67 Mangoes 33 384.79 76.83 - 19.81 - - 3.37 Oranges 1 475.43 50.00 - 50.00 - - - Papayas 4 223.41 77.37 - 22.11 - - 0.53 Pineapples - - - - - - - Chat 8 489.56 34.07 0.51 64.75 0.51 - 0.17 Coffee 65 797.90 74.02 0.14 22.10 1.75 0.28 1.71 Hops (Gesho) 7 103.01 40.51 - 58.55 - - 0.93 Enset 214.51 91.00 - 3.00 - - 6.00 Sugar cane 11 429.36 49.74 - 49.21 - - 1.05

TABLE 1.4.3- CROP PRODUCTION AND PERCENT OF UTILIZATION
ALL HOLDINGS Illubabor Percent Utilized for Total Production Household Wages Animal Type of Crop (Quintal) Consumption Seed Sale In kind Feed Others Grain Crops 5 050 309.78 70.64 12.15 14.17 0.73 0.35 1.96 Cereals 4 675 486.33 73.49 12.20 10.34 0.90 0.51 2.54 Teff 755 544.33 70.89 14.06 12.53 0.58 - 1.95 Barley 43 966.37 69.69 13.44 14.81 0.24 0.10 1.73 Wheat 66 280.74 70.22 15.49 11.57 0.84 - 1.89 Maize 2 707 741.84 74.91 10.80 9.09 1.05 1.05 3.10 Sorghum 951 078.09 75.44 11.52 9.42 0.97 0.46 2.19 Finger millet 123 660.70 75.16 11.04 7.59 1.64 0.48 4.09 Oats “Aja” 309.66 - - - - - - Rice 26 904.60 67.68 16.25 14.64 - - 1.43 Pulses 250 848.70 75.80 11.21 11.81 0.43 0.01 0.74 Horse beans 81 910.75 73.61 12.18 12.68 0.47 - 1.05 Field peas 49 323.15 75.28 12.60 10.35 0.85 - 0.91 Haricot beans 40 898.59 85.75 7.11 6.17 0.38 0.02 0.58 Chick – peas 10 027.71 77.50 14.00 6.50 - - 2.00 Lentils 169.21 67.14 32.86 - - - - Vetch 1 836.59 90.00 10.00 - - - - Soya beans 65 514.48 45.86 21.81 31.38 0.34 - 0.60 Fenugreek 1 168.22 67.57 10.65 21.67 - - 0.11 Gibto - - - - - - - Oilseeds 123 974.75 36.77 14.05 48.24 0.21 - 0.73 Neug 37 674.35 29.89 15.43 53.76 0.05 - 0.86 Linseed 1 150.69 72.63 23.68 3.68 - - - Groundnuts 43 125.42 32.60 15.50 51.17 - - 0.73 Safflower 254.43 20.00 30.00 50.00 - - - Sesame 31 224.15 12.63 17.42 68.93 0.85 - 0.17 Rapeseed 10 545.70 60.98 5.00 32.71 - - 1.30 Vegetables 227 178.29 78.96 0.69 18.15 0.56 - 1.64 Lettuce 0.23 - - - - - - Head cabbage 12 338.62 79.02 - 18.16 1.09 - 1.72 Ethiopian cabbage 85 274.04 92.49 0.35 5.62 - - 1.55 Tomatoes 676.67 68.33 - 31.67 - - - Green peppers 26 301.76 88.73 1.04 7.37 - - 2.86 Red peppers 102 586.47 60.63 1.20 36.20 1.13 - 0.85 Swiss chard 0.49 90.00 - - - - 10.00 Root Crops 178 297.21 82.33 5.71 9.54 0.01 0.73 1.68 Beetroot 9 678.84 82.44 0.77 14.55 - - 2.25 Carrot 627.35 84.44 - 10.00 - - 5.56 Onion 5 803.51 91.83 0.08 6.67 - - 1.43 Potatoes 7 437.43 58.08 5.00 36.15 - - 0.77 Garlic 4 094.29 79.77 7.93 11.56 - - 0.74 Taro / ‘Godere’ 66 515.92 81.88 12.33 4.35 0.02 - 1.42 Sweet potatoes 84 139.87 81.77 0.71 11.60 - 4.13 1.78 Permanent crops 763 270.52 56.97 0.78 37.53 0.94 0.32 3.45 Avocados 4 410.20 62.60 1.60 32.40 - - 3.40 Bananas 52 465.62 54.92 0.04 41.18 0.27 0.12 3.46 Guavas 928.15 71.36 - 14.09 - - 14.55 Lemons 974.27 72.27 - 24.09 - - 3.64 Mangoes 33 538.56 64.62 0.54 28.66 - 0.11 6.08 Oranges 3 056.82 77.92 - 15.00 - - 7.08 Papayas 24 069.54 78.61 1.36 15.76 - - 4.27 Pineapples 97.85 88.33 - 10.00 - - 1.67 Chat 29 229.03 45.32 0.45 50.10 0.07 - 4.06 Coffee 400 050.96 39.46 1.60 55.43 1.33 - 2.18 Hops (Gesho) 732.79 38.00 - 61.85 - - 0.15 Enset 19 161.57 88.90 0.31 3.29 2.83 1.23 3.45 Sugar cane 194 555.16 59.90 0.56 33.95 0.06 1.75 3.78
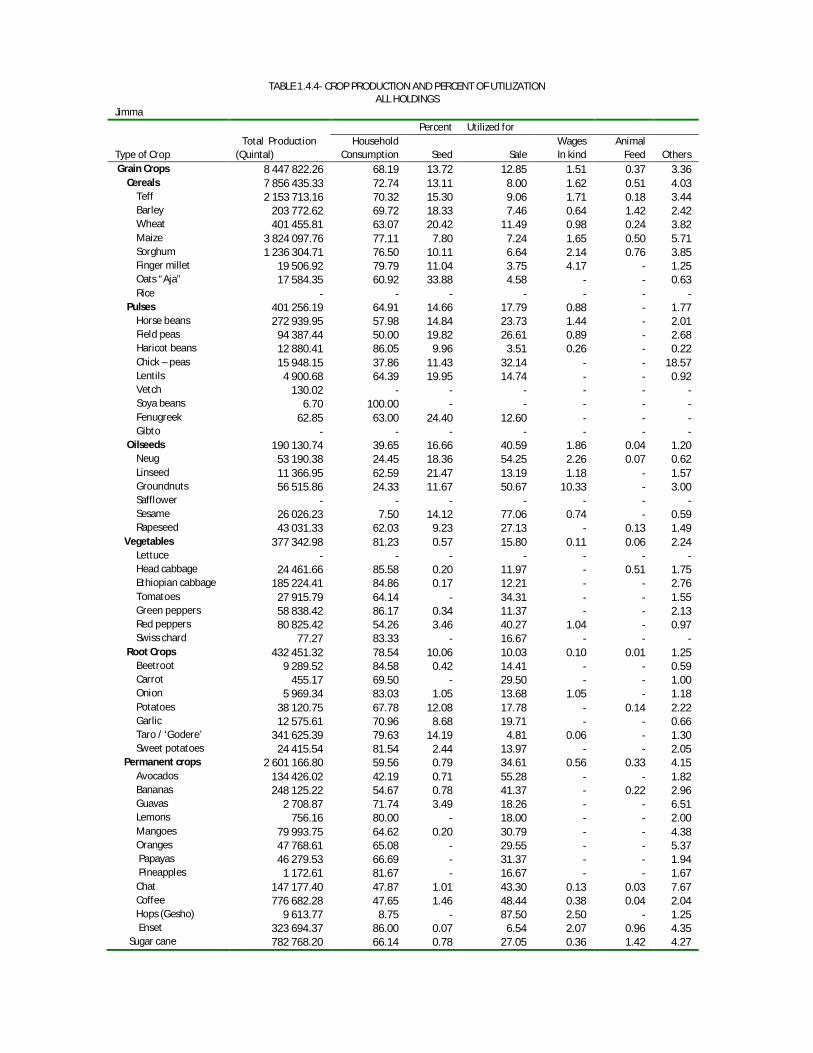
TABLE 1.4.4- CROP PRODUCTION AND PERCENT OF UTILIZATION
ALL HOLDINGS Jimma Percent Utilized for Total Production Household Wages Animal Type of Crop (Quintal) Consumption Seed Sale In kind Feed Others Grain Crops 8 447 822.26 68.19 13.72 12.85 1.51 0.37 3.36 Cereals 7 856 435.33 72.74 13.11 8.00 1.62 0.51 4.03 Teff 2 153 713.16 70.32 15.30 9.06 1.71 0.18 3.44 Barley 203 772.62 69.72 18.33 7.46 0.64 1.42 2.42 Wheat 401 455.81 63.07 20.42 11.49 0.98 0.24 3.82 Maize 3 824 097.76 77.11 7.80 7.24 1.65 0.50 5.71 Sorghum 1 236 304.71 76.50 10.11 6.64 2.14 0.76 3.85 Finger millet 19 506.92 79.79 11.04 3.75 4.17 - 1.25 Oats “Aja” 17 584.35 60.92 33.88 4.58 - - 0.63 Rice - - - - - - - Pulses 401 256.19 64.91 14.66 17.79 0.88 - 1.77 Horse beans 272 939.95 57.98 14.84 23.73 1.44 - 2.01 Field peas 94 387.44 50.00 19.82 26.61 0.89 - 2.68 Haricot beans 12 880.41 86.05 9.96 3.51 0.26 - 0.22 Chick – peas 15 948.15 37.86 11.43 32.14 - - 18.57 Lentils 4 900.68 64.39 19.95 14.74 - - 0.92 Vetch 130.02 - - - - - - Soya beans 6.70 100.00 - - - - - Fenugreek 62.85 63.00 24.40 12.60 - - - Gibto - - - - - - - Oilseeds 190 130.74 39.65 16.66 40.59 1.86 0.04 1.20 Neug 53 190.38 24.45 18.36 54.25 2.26 0.07 0.62 Linseed 11 366.95 62.59 21.47 13.19 1.18 - 1.57 Groundnuts 56 515.86 24.33 11.67 50.67 10.33 - 3.00 Safflower - - - - - - - Sesame 26 026.23 7.50 14.12 77.06 0.74 - 0.59 Rapeseed 43 031.33 62.03 9.23 27.13 - 0.13 1.49 Vegetables 377 342.98 81.23 0.57 15.80 0.11 0.06 2.24 Lettuce - - - - - - - Head cabbage 24 461.66 85.58 0.20 11.97 - 0.51 1.75 Ethiopian cabbage 185 224.41 84.86 0.17 12.21 - - 2.76 Tomatoes 27 915.79 64.14 - 34.31 - - 1.55 Green peppers 58 838.42 86.17 0.34 11.37 - - 2.13 Red peppers 80 825.42 54.26 3.46 40.27 1.04 - 0.97 Swiss chard 77.27 83.33 - 16.67 - - - Root Crops 432 451.32 78.54 10.06 10.03 0.10 0.01 1.25 Beetroot 9 289.52 84.58 0.42 14.41 - - 0.59 Carrot 455.17 69.50 - 29.50 - - 1.00 Onion 5 969.34 83.03 1.05 13.68 1.05 - 1.18 Potatoes 38 120.75 67.78 12.08 17.78 - 0.14 2.22 Garlic 12 575.61 70.96 8.68 19.71 - - 0.66 Taro / ‘Godere’ 341 625.39 79.63 14.19 4.81 0.06 - 1.30 Sweet potatoes 24 415.54 81.54 2.44 13.97 - - 2.05 Permanent crops 2 601 166.80 59.56 0.79 34.61 0.56 0.33 4.15 Avocados 134 426.02 42.19 0.71 55.28 - - 1.82 Bananas 248 125.22 54.67 0.78 41.37 - 0.22 2.96 Guavas 2 708.87 71.74 3.49 18.26 - - 6.51 Lemons 756.16 80.00 - 18.00 - - 2.00 Mangoes 79 993.75 64.62 0.20 30.79 - - 4.38 Oranges 47 768.61 65.08 - 29.55 - - 5.37 Papayas 46 279.53 66.69 - 31.37 - - 1.94 Pineapples 1 172.61 81.67 - 16.67 - - 1.67 Chat 147 177.40 47.87 1.01 43.30 0.13 0.03 7.67 Coffee 776 682.28 47.65 1.46 48.44 0.38 0.04 2.04 Hops (Gesho) 9 613.77 8.75 - 87.50 2.50 - 1.25 Enset 323 694.37 86.00 0.07 6.54 2.07 0.96 4.35 Sugar cane 782 768.20 66.14 0.78 27.05 0.36 1.42 4.27
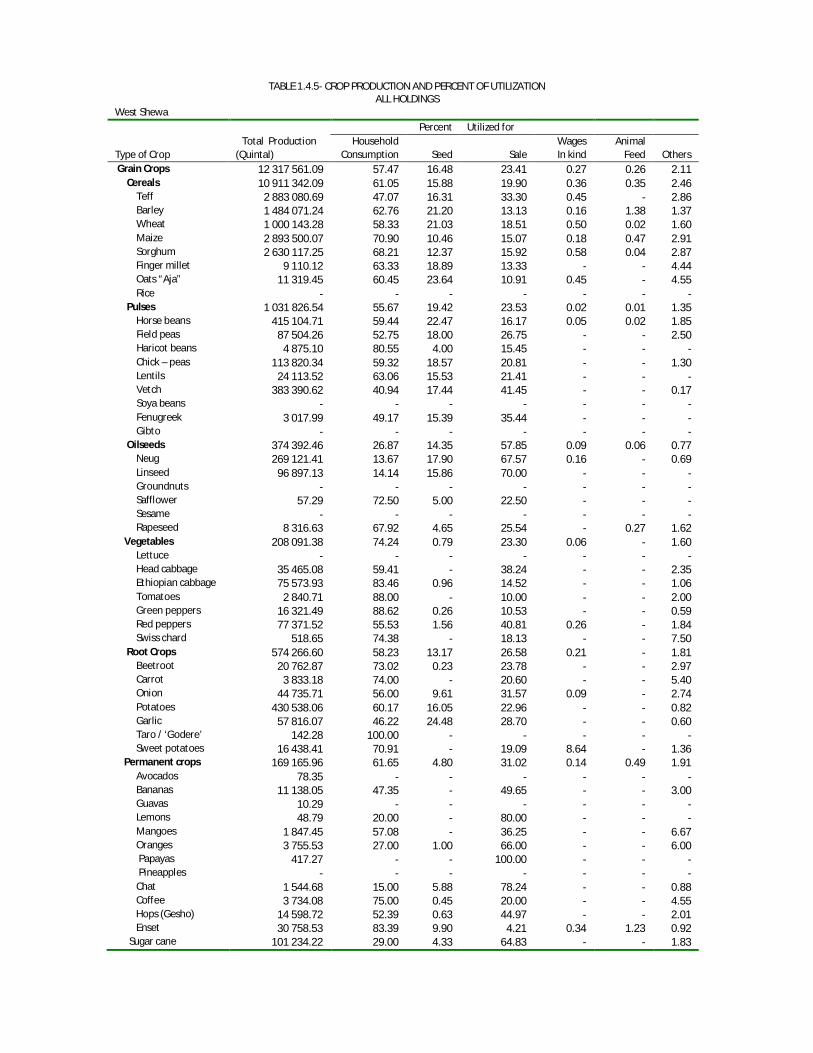
TABLE 1.4.5- CROP PRODUCTION AND PERCENT OF UTILIZATION
ALL HOLDINGS West Shewa Percent Utilized for Total Production Household Wages Animal Type of Crop (Quintal) Consumption Seed Sale In kind Feed Others Grain Crops 12 317 561.09 57.47 16.48 23.41 0.27 0.26 2.11 Cereals 10 911 342.09 61.05 15.88 19.90 0.36 0.35 2.46 Teff 2 883 080.69 47.07 16.31 33.30 0.45 - 2.86 Barley 1 484 071.24 62.76 21.20 13.13 0.16 1.38 1.37 Wheat 1 000 143.28 58.33 21.03 18.51 0.50 0.02 1.60 Maize 2 893 500.07 70.90 10.46 15.07 0.18 0.47 2.91 Sorghum 2 630 117.25 68.21 12.37 15.92 0.58 0.04 2.87 Finger millet 9 110.12 63.33 18.89 13.33 - - 4.44 Oats “Aja” 11 319.45 60.45 23.64 10.91 0.45 - 4.55 Rice - - - - - - - Pulses 1 031 826.54 55.67 19.42 23.53 0.02 0.01 1.35 Horse beans 415 104.71 59.44 22.47 16.17 0.05 0.02 1.85 Field peas 87 504.26 52.75 18.00 26.75 - - 2.50 Haricot beans 4 875.10 80.55 4.00 15.45 - - - Chick – peas 113 820.34 59.32 18.57 20.81 - - 1.30 Lentils 24 113.52 63.06 15.53 21.41 - - - Vetch 383 390.62 40.94 17.44 41.45 - - 0.17 Soya beans - - - - - - - Fenugreek 3 017.99 49.17 15.39 35.44 - - - Gibto - - - - - - - Oilseeds 374 392.46 26.87 14.35 57.85 0.09 0.06 0.77 Neug 269 121.41 13.67 17.90 67.57 0.16 - 0.69 Linseed 96 897.13 14.14 15.86 70.00 - - - Groundnuts - - - - - - - Safflower 57.29 72.50 5.00 22.50 - - - Sesame - - - - - - - Rapeseed 8 316.63 67.92 4.65 25.54 - 0.27 1.62 Vegetables 208 091.38 74.24 0.79 23.30 0.06 - 1.60 Lettuce - - - - - - - Head cabbage 35 465.08 59.41 - 38.24 - - 2.35 Ethiopian cabbage 75 573.93 83.46 0.96 14.52 - - 1.06 Tomatoes 2 840.71 88.00 - 10.00 - - 2.00 Green peppers 16 321.49 88.62 0.26 10.53 - - 0.59 Red peppers 77 371.52 55.53 1.56 40.81 0.26 - 1.84 Swiss chard 518.65 74.38 - 18.13 - - 7.50 Root Crops 574 266.60 58.23 13.17 26.58 0.21 - 1.81 Beetroot 20 762.87 73.02 0.23 23.78 - - 2.97 Carrot 3 833.18 74.00 - 20.60 - - 5.40 Onion 44 735.71 56.00 9.61 31.57 0.09 - 2.74 Potatoes 430 538.06 60.17 16.05 22.96 - - 0.82 Garlic 57 816.07 46.22 24.48 28.70 - - 0.60 Taro / ‘Godere’ 142.28 100.00 - - - - - Sweet potatoes 16 438.41 70.91 - 19.09 8.64 - 1.36 Permanent crops 169 165.96 61.65 4.80 31.02 0.14 0.49 1.91 Avocados 78.35 - - - - - - Bananas 11 138.05 47.35 - 49.65 - - 3.00 Guavas 10.29 - - - - - - Lemons 48.79 20.00 - 80.00 - - - Mangoes 1 847.45 57.08 - 36.25 - - 6.67 Oranges 3 755.53 27.00 1.00 66.00 - - 6.00 Papayas 417.27 - - 100.00 - - - Pineapples - - - - - - - Chat 1 544.68 15.00 5.88 78.24 - - 0.88 Coffee 3 734.08 75.00 0.45 20.00 - - 4.55 Hops (Gesho) 14 598.72 52.39 0.63 44.97 - - 2.01 Enset 30 758.53 83.39 9.90 4.21 0.34 1.23 0.92 Sugar cane 101 234.22 29.00 4.33 64.83 - - 1.83
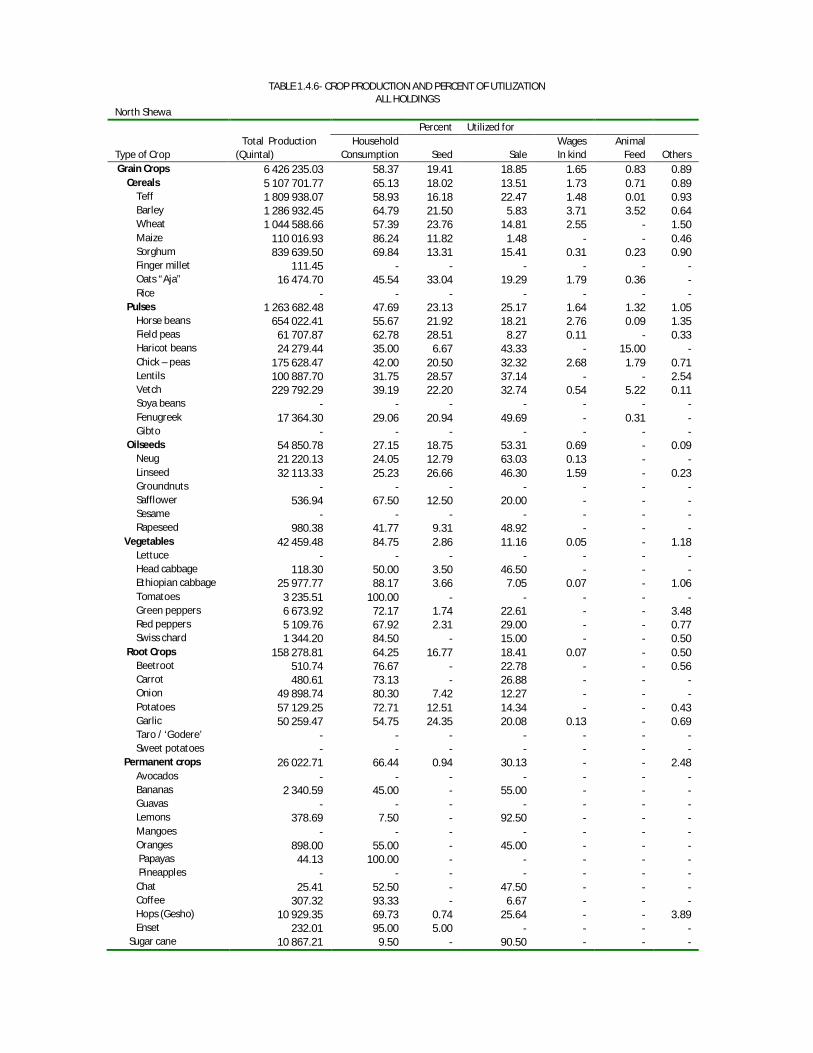
TABLE 1.4.6- CROP PRODUCTION AND PERCENT OF UTILIZATION
ALL HOLDINGS North Shewa Percent Utilized for Total Production Household Wages Animal Type of Crop (Quintal) Consumption Seed Sale In kind Feed Others Grain Crops 6 426 235.03 58.37 19.41 18.85 1.65 0.83 0.89 Cereals 5 107 701.77 65.13 18.02 13.51 1.73 0.71 0.89 Teff 1 809 938.07 58.93 16.18 22.47 1.48 0.01 0.93 Barley 1 286 932.45 64.79 21.50 5.83 3.71 3.52 0.64 Wheat 1 044 588.66 57.39 23.76 14.81 2.55 - 1.50 Maize 110 016.93 86.24 11.82 1.48 - - 0.46 Sorghum 839 639.50 69.84 13.31 15.41 0.31 0.23 0.90 Finger millet 111.45 - - - - - - Oats “Aja” 16 474.70 45.54 33.04 19.29 1.79 0.36 - Rice - - - - - - - Pulses 1 263 682.48 47.69 23.13 25.17 1.64 1.32 1.05 Horse beans 654 022.41 55.67 21.92 18.21 2.76 0.09 1.35 Field peas 61 707.87 62.78 28.51 8.27 0.11 - 0.33 Haricot beans 24 279.44 35.00 6.67 43.33 - 15.00 - Chick – peas 175 628.47 42.00 20.50 32.32 2.68 1.79 0.71 Lentils 100 887.70 31.75 28.57 37.14 - - 2.54 Vetch 229 792.29 39.19 22.20 32.74 0.54 5.22 0.11 Soya beans - - - - - - - Fenugreek 17 364.30 29.06 20.94 49.69 - 0.31 - Gibto - - - - - - - Oilseeds 54 850.78 27.15 18.75 53.31 0.69 - 0.09 Neug 21 220.13 24.05 12.79 63.03 0.13 - - Linseed 32 113.33 25.23 26.66 46.30 1.59 - 0.23 Groundnuts - - - - - - - Safflower 536.94 67.50 12.50 20.00 - - - Sesame - - - - - - - Rapeseed 980.38 41.77 9.31 48.92 - - - Vegetables 42 459.48 84.75 2.86 11.16 0.05 - 1.18 Lettuce - - - - - - - Head cabbage 118.30 50.00 3.50 46.50 - - - Ethiopian cabbage 25 977.77 88.17 3.66 7.05 0.07 - 1.06 Tomatoes 3 235.51 100.00 - - - - - Green peppers 6 673.92 72.17 1.74 22.61 - - 3.48 Red peppers 5 109.76 67.92 2.31 29.00 - - 0.77 Swiss chard 1 344.20 84.50 - 15.00 - - 0.50 Root Crops 158 278.81 64.25 16.77 18.41 0.07 - 0.50 Beetroot 510.74 76.67 - 22.78 - - 0.56 Carrot 480.61 73.13 - 26.88 - - - Onion 49 898.74 80.30 7.42 12.27 - - - Potatoes 57 129.25 72.71 12.51 14.34 - - 0.43 Garlic 50 259.47 54.75 24.35 20.08 0.13 - 0.69 Taro / ‘Godere’ - - - - - - - Sweet potatoes - - - - - - - Permanent crops 26 022.71 66.44 0.94 30.13 - - 2.48 Avocados - - - - - - - Bananas 2 340.59 45.00 - 55.00 - - - Guavas - - - - - - - Lemons 378.69 7.50 - 92.50 - - - Mangoes - - - - - - - Oranges 898.00 55.00 - 45.00 - - - Papayas 44.13 100.00 - - - - - Pineapples - - - - - - - Chat 25.41 52.50 - 47.50 - - - Coffee 307.32 93.33 - 6.67 - - - Hops (Gesho) 10 929.35 69.73 0.74 25.64 - - 3.89 Enset 232.01 95.00 5.00 - - - - Sugar cane 10 867.21 9.50 - 90.50 - - -

TABLE 1.4.7- CROP PRODUCTION AND PERCENT OF UTILIZATION
ALL HOLDINGS East Shewa Percent Utilized for Total Production Household Wages Animal Type of Crop (Quintal) Consumption Seed Sale In kind Feed Others Grain Crops 9 007 982.69 49.75 15.57 33.12 0.48 0.37 0.71 Cereals 7 294 437.19 56.13 15.08 27.09 0.55 0.41 0.74 Teff 2 573 358.31 37.31 14.88 46.15 0.94 0.03 0.68 Barley 209 282.05 67.99 17.71 12.64 0.07 0.90 0.69 Wheat 1 340 232.64 50.40 18.82 29.78 0.56 0.04 0.40 Maize 3 089 003.58 73.71 11.57 12.44 0.35 0.81 1.12 Sorghum 76 478.52 75.43 15.78 7.23 0.14 1.01 0.41 Finger millet 1 481.08 - 50.00 50.00 - - - Oats “Aja” 4 601.01 38.00 28.00 34.00 - - - Rice - - - - - - - Pulses 1 711 230.23 37.14 16.25 45.42 0.37 0.19 0.63 Horse beans 226 145.59 63.78 16.11 19.65 - 0.07 0.38 Field peas 73 632.81 64.58 18.96 15.83 - - 0.63 Haricot beans 622 662.70 24.31 16.83 57.61 0.58 0.04 0.63 Chick – peas 510 926.18 21.91 15.85 59.41 0.98 - 1.85 Lentils 209 878.24 33.60 14.69 51.18 0.22 - 0.31 Vetch 65 085.35 41.67 11.57 44.41 - 2.35 - Soya beans - - - - - - - Fenugreek 2 899.37 34.41 27.06 38.53 - - - Gibto - - - - - - - Oilseeds 2 315.26 67.74 21.13 7.58 - 2.58 0.97 Neug - - - - - - - Linseed 1 673.78 73.64 25.00 1.36 - - - Groundnuts - - - - - - - Safflower 380.64 64.29 11.43 12.86 - 11.43 - Sesame - - - - - - - Rapeseed 260.85 64.62 23.08 10.00 - - 2.31 Vegetables 482 733.07 75.04 0.55 22.83 - - 1.58 Lettuce - - - - - - - Head cabbage 238.10 100.00 - - - - - Ethiopian cabbage 62 016.28 85.13 0.89 12.97 - - 1.01 Tomatoes 323 137.19 55.77 - 39.81 - - 4.42 Green peppers 12 963.35 78.27 0.54 20.56 - - 0.63 Red peppers 84 362.35 38.33 - 61.67 - - - Swiss chard 15.80 100.00 - - - - - Root Crops 233 697.30 49.11 7.92 40.36 0.10 0.94 1.56 Beetroot 457.21 22.50 - 77.50 - - - Carrot 108.29 20.00 - 80.00 - - - Onion 181 582.94 43.37 6.30 47.28 0.22 1.96 0.87 Potatoes 10 148.77 80.83 2.50 15.00 - - 1.67 Garlic 40 886.96 52.93 11.10 33.54 - - 2.44 Taro / ‘Godere’ - - - - - - - Sweet potatoes 513.12 - - - - - - Permanent crops 137 355.85 57.86 0.32 40.39 - - 1.43 Avocados 164.77 - - - - - - Bananas 685.72 42.50 - 57.50 - - - Guavas 91.18 60.00 - 40.00 - - - Lemons 104.57 - - - - - - Mangoes 1 129.51 40.00 - 53.33 - - 6.67 Oranges 457.26 - - - - - - Papayas 1 676.07 77.00 - 17.00 - - 6.00 Pineapples - - - - - - - Chat 56 449.13 - - 100.00 - - - Coffee 104.43 100.00 - - - - - Hops (Gesho) 13 189.88 56.34 0.45 42.14 - - 1.07 Enset 188.31 100.00 - - - - - Sugar cane 63 115.03 5.00 - 95.00 - - -

TABLE 1.4.8- CROP PRODUCTION AND PERCENT OF UTILIZATION
ALL HOLDINGS Arsi Percent Utilized for Total Production Household Wages Animal Type of Crop (Quintal) Consumption Seed Sale In kind Feed Others Grain Crops 12 389 717.56 55.86 19.50 21.10 0.14 1.09 2.31 Cereals 10 914 739.10 61.35 18.89 15.75 0.17 1.36 2.47 Teff 1 182 431.63 53.49 17.92 25.98 0.07 - 2.54 Barley 1 878 043.83 57.19 28.94 9.56 0.09 2.21 2.01 Wheat 4 942 743.65 49.09 23.64 23.86 0.14 0.21 3.06 Maize 1 923 181.04 77.72 10.34 6.76 0.26 2.94 1.98 Sorghum 968 742.45 71.34 9.93 14.97 0.37 0.98 2.41 Finger millet - - - - - - - Oats “Aja” 19 596.51 55.75 35.96 - - 1.14 7.14 Rice - - - - - - - Pulses 1 122 088.12 47.59 21.27 28.24 0.09 0.51 2.29 Horse beans 675 254.40 52.36 23.73 19.93 0.04 0.34 3.59 Field peas 230 167.57 39.32 26.82 31.99 - - 1.87 Haricot beans 175 782.78 39.47 16.95 43.00 - - 0.58 Chick – peas 2 997.33 71.88 15.63 12.50 - - - Lentils 10 013.12 68.63 16.98 13.88 - - 0.51 Vetch 7 982.46 69.43 13.67 9.76 - 6.67 0.48 Soya beans - - - - - - - Fenugreek 19 890.47 23.44 14.69 56.91 0.93 1.72 2.31 Gibto - - - - - - - Oilseeds 352 890.34 25.23 19.76 54.25 - 0.19 0.57 Neug 21 903.00 33.32 11.73 52.91 - - 2.05 Linseed 320 332.61 18.75 21.20 59.61 - 0.28 0.16 Groundnuts 686.32 67.50 17.50 12.50 - - 2.50 Safflower 20.22 - - - - - - Sesame 2 432.00 48.09 22.82 26.82 - - 2.27 Rapeseed 7 516.19 33.87 18.70 47.22 - - 0.22 Vegetables 284 794.29 68.22 1.11 27.30 - 1.20 2.16 Lettuce - - - - - - - Head cabbage 19 033.35 50.00 - 40.21 - 6.17 3.62 Ethiopian cabbage 107 290.93 73.55 1.26 22.91 - 0.78 1.51 Tomatoes 78 189.68 65.00 1.67 30.56 - - 2.78 Green peppers 36 672.96 90.81 0.74 5.88 - - 2.57 Red peppers 43 431.05 46.35 1.98 49.83 - - 1.83 Swiss chard 176.33 70.00 - 30.00 - - - Root Crops 947 165.18 42.47 10.75 44.89 - 0.03 1.86 Beetroot 35 066.21 54.96 - 42.67 - - 2.37 Carrot 73 005.99 41.56 1.72 53.06 - - 3.66 Onion 580 428.16 28.61 6.86 63.38 - - 1.15 Potatoes 146 572.32 57.06 11.72 28.06 - 0.21 2.94 Garlic 82 747.73 27.31 32.81 39.26 - - 0.62 Taro / ‘Godere’ 1 204.64 94.00 - 4.00 - - 2.00 Sweet potatoes 28 140.14 87.67 2.33 7.67 - - 2.33 Permanent crops 166 315.12 38.10 1.07 52.16 1.45 2.07 5.16 Avocados 45.97 - - - - - - Bananas 21 541.88 47.50 5.00 34.72 - 7.78 5.00 Guavas - - - - - - - Lemons - - - - - - - Mangoes 322.57 100.00 - - - - - Oranges 9 431.78 35.00 - 55.00 - - 10.00 Papayas 413.48 90.00 - - - - 10.00 Pineapples - - - - - - - Chat 29 492.62 28.94 0.76 56.88 3.94 - 9.47 Coffee 57 533.42 26.00 0.20 70.00 0.57 0.10 3.13 Hops (Gesho) 11 932.45 77.07 - 22.44 - - 0.49 Enset 4 213.38 54.23 4.23 21.54 - 14.62 5.38 Sugar cane 31 387.56 15.00 10.00 33.33 - 36.67 5.00
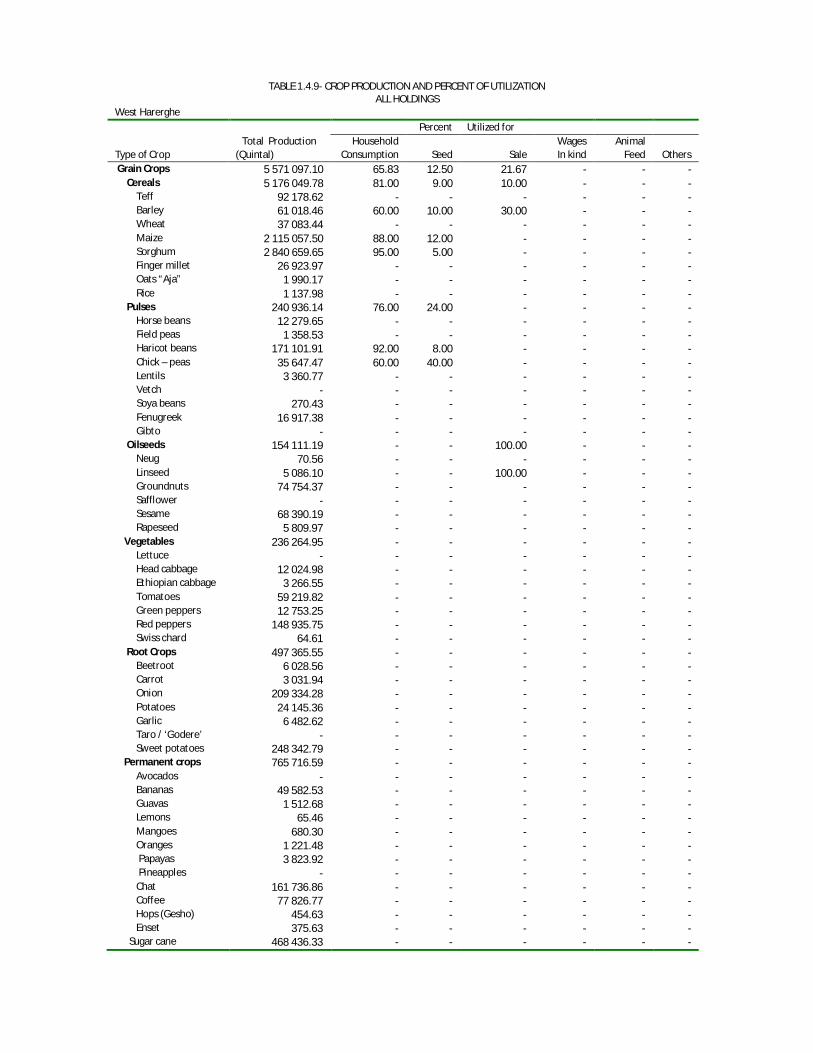
TABLE 1.4.9- CROP PRODUCTION AND PERCENT OF UTILIZATION
ALL HOLDINGS West Harerghe Percent Utilized for Total Production Household Wages Animal Type of Crop (Quintal) Consumption Seed Sale In kind Feed Others Grain Crops 5 571 097.10 65.83 12.50 21.67 - - - Cereals 5 176 049.78 81.00 9.00 10.00 - - - Teff 92 178.62 - - - - - - Barley 61 018.46 60.00 10.00 30.00 - - - Wheat 37 083.44 - - - - - - Maize 2 115 057.50 88.00 12.00 - - - - Sorghum 2 840 659.65 95.00 5.00 - - - - Finger millet 26 923.97 - - - - - - Oats “Aja” 1 990.17 - - - - - - Rice 1 137.98 - - - - - - Pulses 240 936.14 76.00 24.00 - - - - Horse beans 12 279.65 - - - - - - Field peas 1 358.53 - - - - - - Haricot beans 171 101.91 92.00 8.00 - - - - Chick – peas 35 647.47 60.00 40.00 - - - - Lentils 3 360.77 - - - - - - Vetch - - - - - - - Soya beans 270.43 - - - - - - Fenugreek 16 917.38 - - - - - - Gibto - - - - - - - Oilseeds 154 111.19 - - 100.00 - - - Neug 70.56 - - - - - - Linseed 5 086.10 - - 100.00 - - - Groundnuts 74 754.37 - - - - - - Safflower - - - - - - - Sesame 68 390.19 - - - - - - Rapeseed 5 809.97 - - - - - - Vegetables 236 264.95 - - - - - - Lettuce - - - - - - - Head cabbage 12 024.98 - - - - - - Ethiopian cabbage 3 266.55 - - - - - - Tomatoes 59 219.82 - - - - - - Green peppers 12 753.25 - - - - - - Red peppers 148 935.75 - - - - - - Swiss chard 64.61 - - - - - - Root Crops 497 365.55 - - - - - - Beetroot 6 028.56 - - - - - - Carrot 3 031.94 - - - - - - Onion 209 334.28 - - - - - - Potatoes 24 145.36 - - - - - - Garlic 6 482.62 - - - - - - Taro / ‘Godere’ - - - - - - - Sweet potatoes 248 342.79 - - - - - - Permanent crops 765 716.59 - - - - - - Avocados - - - - - - - Bananas 49 582.53 - - - - - - Guavas 1 512.68 - - - - - - Lemons 65.46 - - - - - - Mangoes 680.30 - - - - - - Oranges 1 221.48 - - - - - - Papayas 3 823.92 - - - - - - Pineapples - - - - - - - Chat 161 736.86 - - - - - - Coffee 77 826.77 - - - - - - Hops (Gesho) 454.63 - - - - - - Enset 375.63 - - - - - - Sugar cane 468 436.33 - - - - - -
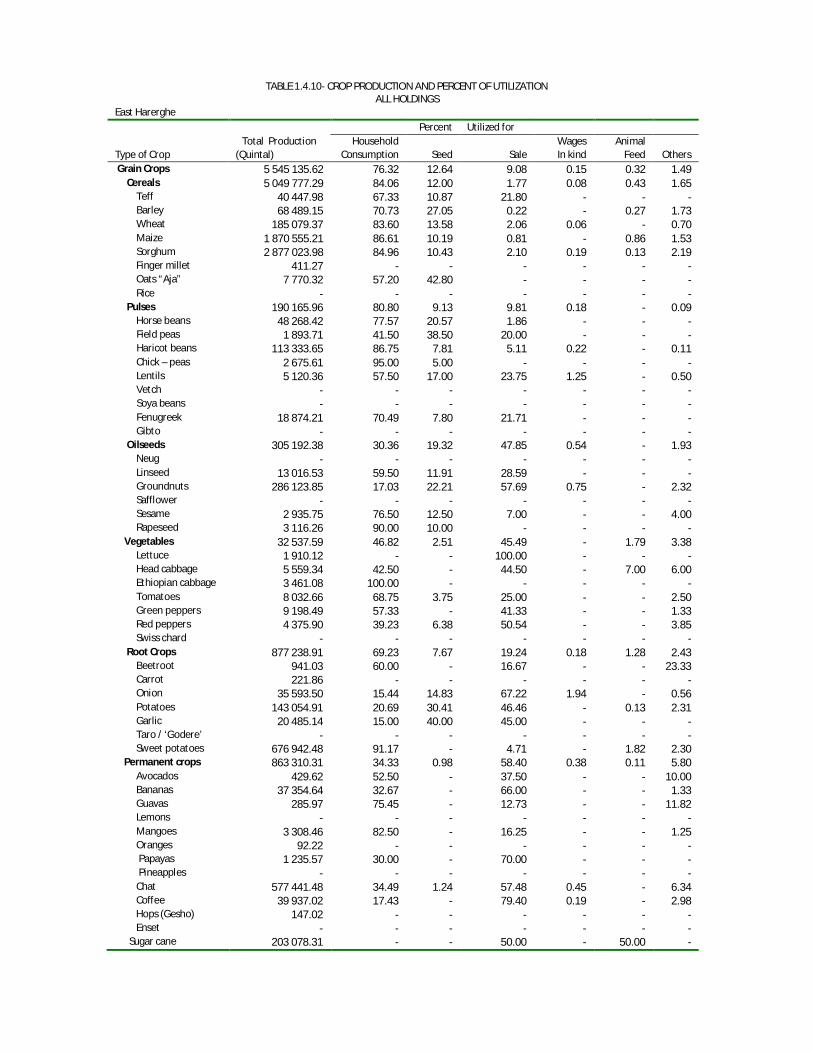
TABLE 1.4.10- CROP PRODUCTION AND PERCENT OF UTILIZATION
ALL HOLDINGS East Harerghe Percent Utilized for Total Production Household Wages Animal Type of Crop (Quintal) Consumption Seed Sale In kind Feed Others Grain Crops 5 545 135.62 76.32 12.64 9.08 0.15 0.32 1.49 Cereals 5 049 777.29 84.06 12.00 1.77 0.08 0.43 1.65 Teff 40 447.98 67.33 10.87 21.80 - - - Barley 68 489.15 70.73 27.05 0.22 - 0.27 1.73 Wheat 185 079.37 83.60 13.58 2.06 0.06 - 0.70 Maize 1 870 555.21 86.61 10.19 0.81 - 0.86 1.53 Sorghum 2 877 023.98 84.96 10.43 2.10 0.19 0.13 2.19 Finger millet 411.27 - - - - - - Oats “Aja” 7 770.32 57.20 42.80 - - - - Rice - - - - - - - Pulses 190 165.96 80.80 9.13 9.81 0.18 - 0.09 Horse beans 48 268.42 77.57 20.57 1.86 - - - Field peas 1 893.71 41.50 38.50 20.00 - - - Haricot beans 113 333.65 86.75 7.81 5.11 0.22 - 0.11 Chick – peas 2 675.61 95.00 5.00 - - - - Lentils 5 120.36 57.50 17.00 23.75 1.25 - 0.50 Vetch - - - - - - - Soya beans - - - - - - - Fenugreek 18 874.21 70.49 7.80 21.71 - - - Gibto - - - - - - - Oilseeds 305 192.38 30.36 19.32 47.85 0.54 - 1.93 Neug - - - - - - - Linseed 13 016.53 59.50 11.91 28.59 - - - Groundnuts 286 123.85 17.03 22.21 57.69 0.75 - 2.32 Safflower - - - - - - - Sesame 2 935.75 76.50 12.50 7.00 - - 4.00 Rapeseed 3 116.26 90.00 10.00 - - - - Vegetables 32 537.59 46.82 2.51 45.49 - 1.79 3.38 Lettuce 1 910.12 - - 100.00 - - - Head cabbage 5 559.34 42.50 - 44.50 - 7.00 6.00 Ethiopian cabbage 3 461.08 100.00 - - - - - Tomatoes 8 032.66 68.75 3.75 25.00 - - 2.50 Green peppers 9 198.49 57.33 - 41.33 - - 1.33 Red peppers 4 375.90 39.23 6.38 50.54 - - 3.85 Swiss chard - - - - - - - Root Crops 877 238.91 69.23 7.67 19.24 0.18 1.28 2.43 Beetroot 941.03 60.00 - 16.67 - - 23.33 Carrot 221.86 - - - - - - Onion 35 593.50 15.44 14.83 67.22 1.94 - 0.56 Potatoes 143 054.91 20.69 30.41 46.46 - 0.13 2.31 Garlic 20 485.14 15.00 40.00 45.00 - - - Taro / ‘Godere’ - - - - - - - Sweet potatoes 676 942.48 91.17 - 4.71 - 1.82 2.30 Permanent crops 863 310.31 34.33 0.98 58.40 0.38 0.11 5.80 Avocados 429.62 52.50 - 37.50 - - 10.00 Bananas 37 354.64 32.67 - 66.00 - - 1.33 Guavas 285.97 75.45 - 12.73 - - 11.82 Lemons - - - - - - - Mangoes 3 308.46 82.50 - 16.25 - - 1.25 Oranges 92.22 - - - - - - Papayas 1 235.57 30.00 - 70.00 - - - Pineapples - - - - - - - Chat 577 441.48 34.49 1.24 57.48 0.45 - 6.34 Coffee 39 937.02 17.43 - 79.40 0.19 - 2.98 Hops (Gesho) 147.02 - - - - - - Enset - - - - - - - Sugar cane 203 078.31 - - 50.00 - 50.00 -
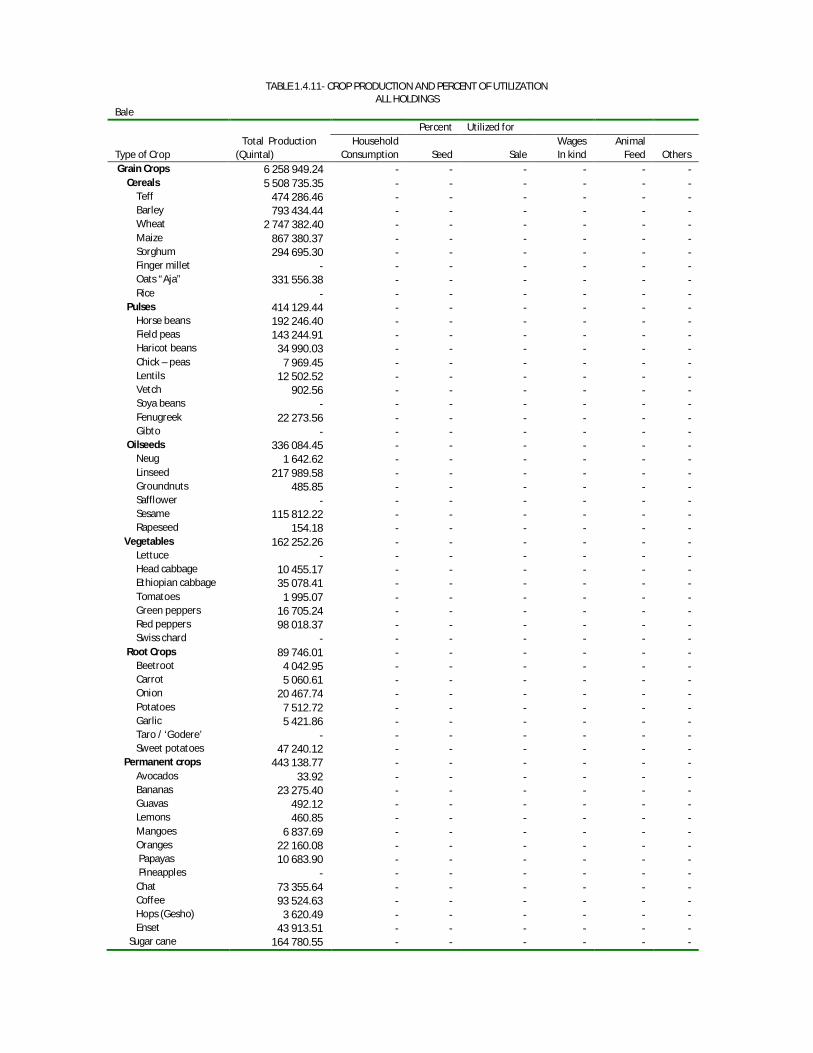
TABLE 1.4.11- CROP PRODUCTION AND PERCENT OF UTILIZATION
ALL HOLDINGS Bale Percent Utilized for Total Production Household Wages Animal Type of Crop (Quintal) Consumption Seed Sale In kind Feed Others Grain Crops 6 258 949.24 - - - - - - Cereals 5 508 735.35 - - - - - - Teff 474 286.46 - - - - - - Barley 793 434.44 - - - - - - Wheat 2 747 382.40 - - - - - - Maize 867 380.37 - - - - - - Sorghum 294 695.30 - - - - - - Finger millet - - - - - - - Oats “Aja” 331 556.38 - - - - - - Rice - - - - - - - Pulses 414 129.44 - - - - - - Horse beans 192 246.40 - - - - - - Field peas 143 244.91 - - - - - - Haricot beans 34 990.03 - - - - - - Chick – peas 7 969.45 - - - - - - Lentils 12 502.52 - - - - - - Vetch 902.56 - - - - - - Soya beans - - - - - - - Fenugreek 22 273.56 - - - - - - Gibto - - - - - - - Oilseeds 336 084.45 - - - - - - Neug 1 642.62 - - - - - - Linseed 217 989.58 - - - - - - Groundnuts 485.85 - - - - - - Safflower - - - - - - - Sesame 115 812.22 - - - - - - Rapeseed 154.18 - - - - - - Vegetables 162 252.26 - - - - - - Lettuce - - - - - - - Head cabbage 10 455.17 - - - - - - Ethiopian cabbage 35 078.41 - - - - - - Tomatoes 1 995.07 - - - - - - Green peppers 16 705.24 - - - - - - Red peppers 98 018.37 - - - - - - Swiss chard - - - - - - - Root Crops 89 746.01 - - - - - - Beetroot 4 042.95 - - - - - - Carrot 5 060.61 - - - - - - Onion 20 467.74 - - - - - - Potatoes 7 512.72 - - - - - - Garlic 5 421.86 - - - - - - Taro / ‘Godere’ - - - - - - - Sweet potatoes 47 240.12 - - - - - - Permanent crops 443 138.77 - - - - - - Avocados 33.92 - - - - - - Bananas 23 275.40 - - - - - - Guavas 492.12 - - - - - - Lemons 460.85 - - - - - - Mangoes 6 837.69 - - - - - - Oranges 22 160.08 - - - - - - Papayas 10 683.90 - - - - - - Pineapples - - - - - - - Chat 73 355.64 - - - - - - Coffee 93 524.63 - - - - - - Hops (Gesho) 3 620.49 - - - - - - Enset 43 913.51 - - - - - - Sugar cane 164 780.55 - - - - - -
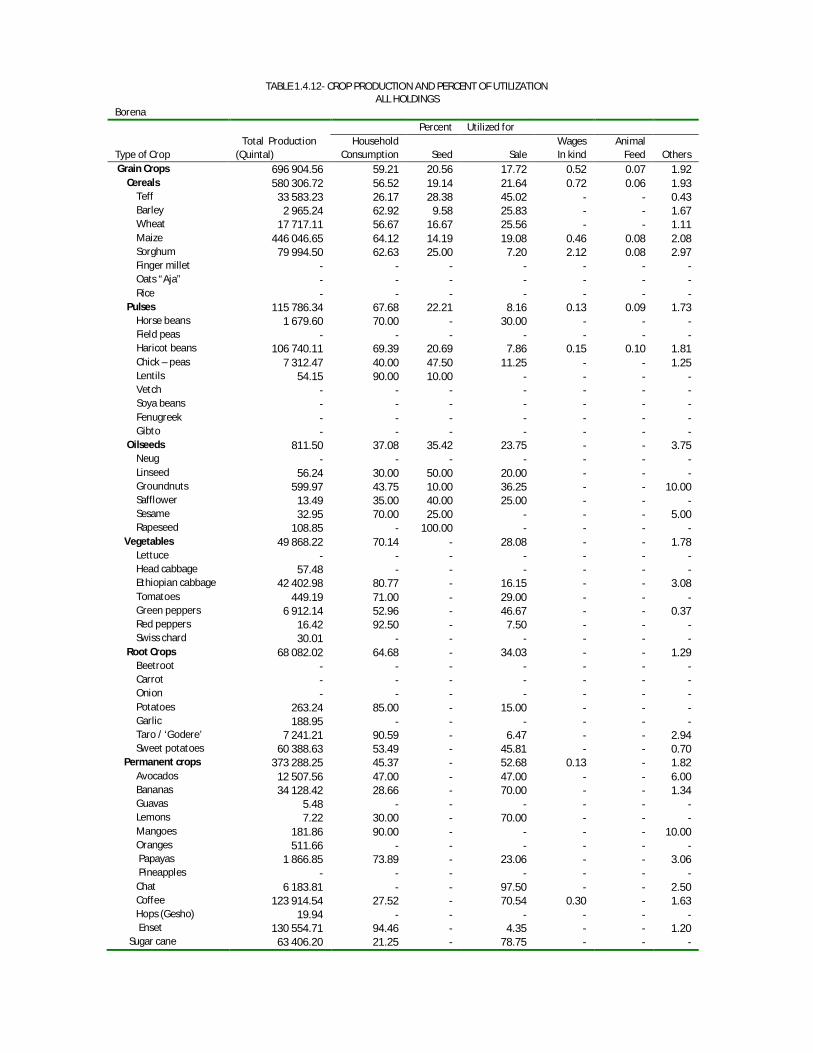
TABLE 1.4.12- CROP PRODUCTION AND PERCENT OF UTILIZATION
ALL HOLDINGS Borena Percent Utilized for Total Production Household Wages Animal Type of Crop (Quintal) Consumption Seed Sale In kind Feed Others Grain Crops 696 904.56 59.21 20.56 17.72 0.52 0.07 1.92 Cereals 580 306.72 56.52 19.14 21.64 0.72 0.06 1.93 Teff 33 583.23 26.17 28.38 45.02 - - 0.43 Barley 2 965.24 62.92 9.58 25.83 - - 1.67 Wheat 17 717.11 56.67 16.67 25.56 - - 1.11 Maize 446 046.65 64.12 14.19 19.08 0.46 0.08 2.08 Sorghum 79 994.50 62.63 25.00 7.20 2.12 0.08 2.97 Finger millet - - - - - - - Oats “Aja” - - - - - - - Rice - - - - - - - Pulses 115 786.34 67.68 22.21 8.16 0.13 0.09 1.73 Horse beans 1 679.60 70.00 - 30.00 - - - Field peas - - - - - - - Haricot beans 106 740.11 69.39 20.69 7.86 0.15 0.10 1.81 Chick – peas 7 312.47 40.00 47.50 11.25 - - 1.25 Lentils 54.15 90.00 10.00 - - - - Vetch - - - - - - - Soya beans - - - - - - - Fenugreek - - - - - - - Gibto - - - - - - - Oilseeds 811.50 37.08 35.42 23.75 - - 3.75 Neug - - - - - - - Linseed 56.24 30.00 50.00 20.00 - - - Groundnuts 599.97 43.75 10.00 36.25 - - 10.00 Safflower 13.49 35.00 40.00 25.00 - - - Sesame 32.95 70.00 25.00 - - - 5.00 Rapeseed 108.85 - 100.00 - - - - Vegetables 49 868.22 70.14 - 28.08 - - 1.78 Lettuce - - - - - - - Head cabbage 57.48 - - - - - - Ethiopian cabbage 42 402.98 80.77 - 16.15 - - 3.08 Tomatoes 449.19 71.00 - 29.00 - - - Green peppers 6 912.14 52.96 - 46.67 - - 0.37 Red peppers 16.42 92.50 - 7.50 - - - Swiss chard 30.01 - - - - - - Root Crops 68 082.02 64.68 - 34.03 - - 1.29 Beetroot - - - - - - - Carrot - - - - - - - Onion - - - - - - - Potatoes 263.24 85.00 - 15.00 - - - Garlic 188.95 - - - - - - Taro / ‘Godere’ 7 241.21 90.59 - 6.47 - - 2.94 Sweet potatoes 60 388.63 53.49 - 45.81 - - 0.70 Permanent crops 373 288.25 45.37 - 52.68 0.13 - 1.82 Avocados 12 507.56 47.00 - 47.00 - - 6.00 Bananas 34 128.42 28.66 - 70.00 - - 1.34 Guavas 5.48 - - - - - - Lemons 7.22 30.00 - 70.00 - - - Mangoes 181.86 90.00 - - - - 10.00 Oranges 511.66 - - - - - - Papayas 1 866.85 73.89 - 23.06 - - 3.06 Pineapples - - - - - - - Chat 6 183.81 - - 97.50 - - 2.50 Coffee 123 914.54 27.52 - 70.54 0.30 - 1.63 Hops (Gesho) 19.94 - - - - - - Enset 130 554.71 94.46 - 4.35 - - 1.20 Sugar cane 63 406.20 21.25 - 78.75 - - -
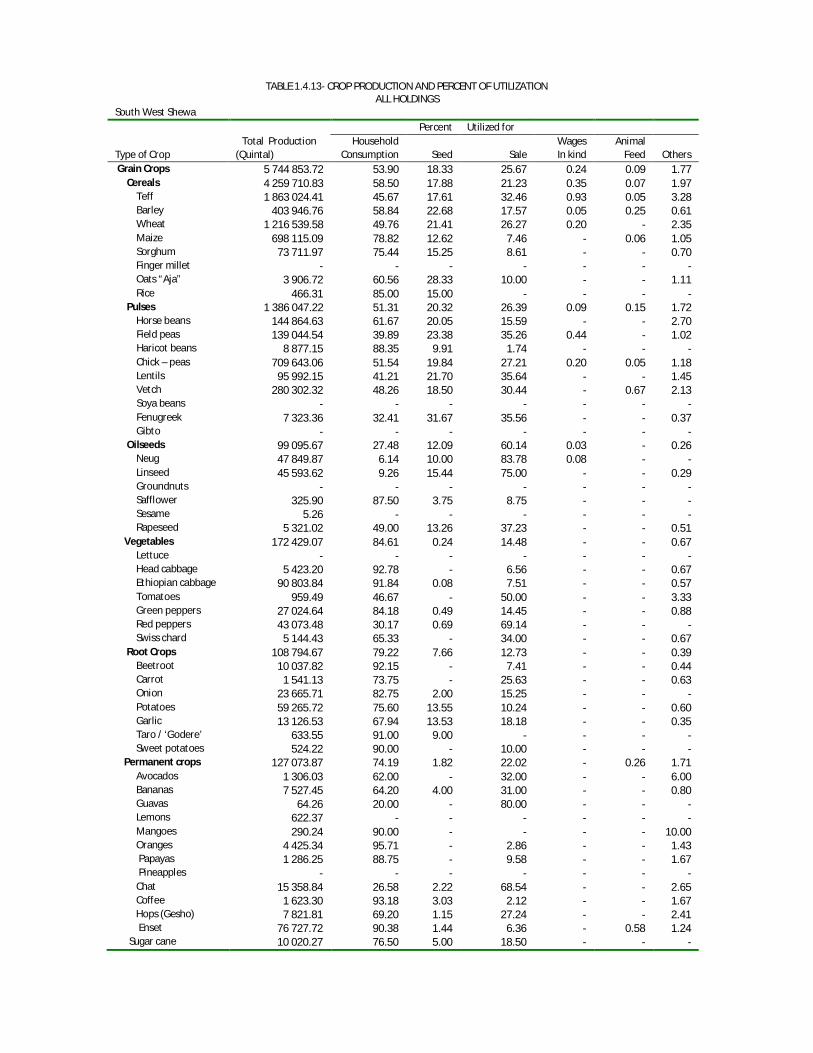
TABLE 1.4.13- CROP PRODUCTION AND PERCENT OF UTILIZATION
ALL HOLDINGS South West Shewa Percent Utilized for Total Production Household Wages Animal Type of Crop (Quintal) Consumption Seed Sale In kind Feed Others Grain Crops 5 744 853.72 53.90 18.33 25.67 0.24 0.09 1.77 Cereals 4 259 710.83 58.50 17.88 21.23 0.35 0.07 1.97 Teff 1 863 024.41 45.67 17.61 32.46 0.93 0.05 3.28 Barley 403 946.76 58.84 22.68 17.57 0.05 0.25 0.61 Wheat 1 216 539.58 49.76 21.41 26.27 0.20 - 2.35 Maize 698 115.09 78.82 12.62 7.46 - 0.06 1.05 Sorghum 73 711.97 75.44 15.25 8.61 - - 0.70 Finger millet - - - - - - - Oats “Aja” 3 906.72 60.56 28.33 10.00 - - 1.11 Rice 466.31 85.00 15.00 - - - - Pulses 1 386 047.22 51.31 20.32 26.39 0.09 0.15 1.72 Horse beans 144 864.63 61.67 20.05 15.59 - - 2.70 Field peas 139 044.54 39.89 23.38 35.26 0.44 - 1.02 Haricot beans 8 877.15 88.35 9.91 1.74 - - - Chick – peas 709 643.06 51.54 19.84 27.21 0.20 0.05 1.18 Lentils 95 992.15 41.21 21.70 35.64 - - 1.45 Vetch 280 302.32 48.26 18.50 30.44 - 0.67 2.13 Soya beans - - - - - - - Fenugreek 7 323.36 32.41 31.67 35.56 - - 0.37 Gibto - - - - - - - Oilseeds 99 095.67 27.48 12.09 60.14 0.03 - 0.26 Neug 47 849.87 6.14 10.00 83.78 0.08 - - Linseed 45 593.62 9.26 15.44 75.00 - - 0.29 Groundnuts - - - - - - - Safflower 325.90 87.50 3.75 8.75 - - - Sesame 5.26 - - - - - - Rapeseed 5 321.02 49.00 13.26 37.23 - - 0.51 Vegetables 172 429.07 84.61 0.24 14.48 - - 0.67 Lettuce - - - - - - - Head cabbage 5 423.20 92.78 - 6.56 - - 0.67 Ethiopian cabbage 90 803.84 91.84 0.08 7.51 - - 0.57 Tomatoes 959.49 46.67 - 50.00 - - 3.33 Green peppers 27 024.64 84.18 0.49 14.45 - - 0.88 Red peppers 43 073.48 30.17 0.69 69.14 - - - Swiss chard 5 144.43 65.33 - 34.00 - - 0.67 Root Crops 108 794.67 79.22 7.66 12.73 - - 0.39 Beetroot 10 037.82 92.15 - 7.41 - - 0.44 Carrot 1 541.13 73.75 - 25.63 - - 0.63 Onion 23 665.71 82.75 2.00 15.25 - - - Potatoes 59 265.72 75.60 13.55 10.24 - - 0.60 Garlic 13 126.53 67.94 13.53 18.18 - - 0.35 Taro / ‘Godere’ 633.55 91.00 9.00 - - - - Sweet potatoes 524.22 90.00 - 10.00 - - - Permanent crops 127 073.87 74.19 1.82 22.02 - 0.26 1.71 Avocados 1 306.03 62.00 - 32.00 - - 6.00 Bananas 7 527.45 64.20 4.00 31.00 - - 0.80 Guavas 64.26 20.00 - 80.00 - - - Lemons 622.37 - - - - - - Mangoes 290.24 90.00 - - - - 10.00 Oranges 4 425.34 95.71 - 2.86 - - 1.43 Papayas 1 286.25 88.75 - 9.58 - - 1.67 Pineapples - - - - - - - Chat 15 358.84 26.58 2.22 68.54 - - 2.65 Coffee 1 623.30 93.18 3.03 2.12 - - 1.67 Hops (Gesho) 7 821.81 69.20 1.15 27.24 - - 2.41 Enset 76 727.72 90.38 1.44 6.36 - 0.58 1.24 Sugar cane 10 020.27 76.50 5.00 18.50 - - -
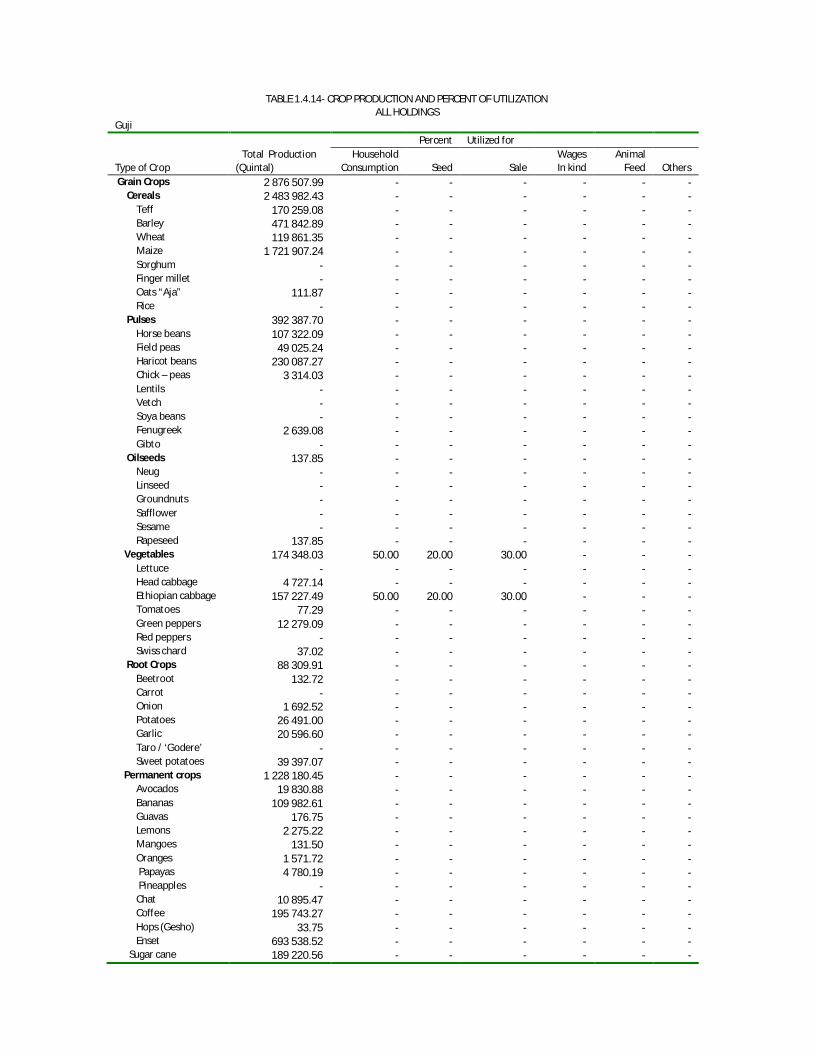
TABLE 1.4.14- CROP PRODUCTION AND PERCENT OF UTILIZATION ALL HOLDINGS
Guji Percent Utilized for Total Production Household Wages Animal Type of Crop (Quintal) Consumption Seed Sale In kind Feed Others Grain Crops 2 876 507.99 - - - - - - Cereals 2 483 982.43 - - - - - - Teff 170 259.08 - - - - - - Barley 471 842.89 - - - - - - Wheat 119 861.35 - - - - - - Maize 1 721 907.24 - - - - - - Sorghum - - - - - - - Finger millet - - - - - - - Oats “Aja” 111.87 - - - - - - Rice - - - - - - - Pulses 392 387.70 - - - - - - Horse beans 107 322.09 - - - - - - Field peas 49 025.24 - - - - - - Haricot beans 230 087.27 - - - - - - Chick – peas 3 314.03 - - - - - - Lentils - - - - - - - Vetch - - - - - - - Soya beans - - - - - - - Fenugreek 2 639.08 - - - - - - Gibto - - - - - - - Oilseeds 137.85 - - - - - - Neug - - - - - - - Linseed - - - - - - - Groundnuts - - - - - - - Safflower - - - - - - - Sesame - - - - - - - Rapeseed 137.85 - - - - - - Vegetables 174 348.03 50.00 20.00 30.00 - - - Lettuce - - - - - - - Head cabbage 4 727.14 - - - - - - Ethiopian cabbage 157 227.49 50.00 20.00 30.00 - - - Tomatoes 77.29 - - - - - - Green peppers 12 279.09 - - - - - - Red peppers - - - - - - - Swiss chard 37.02 - - - - - - Root Crops 88 309.91 - - - - - - Beetroot 132.72 - - - - - - Carrot - - - - - - - Onion 1 692.52 - - - - - - Potatoes 26 491.00 - - - - - - Garlic 20 596.60 - - - - - - Taro / ‘Godere’ - - - - - - - Sweet potatoes 39 397.07 - - - - - - Permanent crops 1 228 180.45 - - - - - - Avocados 19 830.88 - - - - - - Bananas 109 982.61 - - - - - - Guavas 176.75 - - - - - - Lemons 2 275.22 - - - - - - Mangoes 131.50 - - - - - - Oranges 1 571.72 - - - - - - Papayas 4 780.19 - - - - - - Pineapples - - - - - - - Chat 10 895.47 - - - - - - Coffee 195 743.27 - - - - - - Hops (Gesho) 33.75 - - - - - - Enset 693 538.52 - - - - - - Sugar cane 189 220.56 - - - - - -

TABLE 1.4.15- CROP PRODUCTION AND PERCENT OF UTILIZATION
ALL HOLDINGS West Arsi Percen
t Utilized for
Total Production Household Wages Animal Type of Crop (Quintal) Consumption Seed Sale In kind Feed Others Grain Crops 8 186 400.66 61.06 11.51 25.99 0.18 0.03 1.23 Cereals 7 794 483.84 65.29 11.10 22.03 0.21 0.03 1.34 Teff 340 060.06 38.03 9.41 52.43 - - 0.13 Barley 1 566 206.75 52.58 17.54 26.84 0.52 0.09 2.43 Wheat 2 984 073.10 41.64 18.96 38.57 - - 0.84 Maize 2 707 833.24 79.60 5.57 13.02 0.26 0.04 1.50 Sorghum 89 305.37 85.12 11.16 3.02 0.35 - 0.35 Finger millet 80 110.70 84.63 11.42 2.31 - - 1.64 Oats “Aja” 26 894.61 87.50 12.50 - - - - Rice - - - - - - - Pulses 326 000.93 41.92 12.10 45.22 - - 0.76 Horse beans 32 726.95 95.00 5.00 - - - - Field peas 16 437.91 60.00 40.00 - - - - Haricot beans 182 154.25 39.00 11.95 48.24 - - 0.81 Chick – peas 2 804.86 - - - - - - Lentils 13 612.37 - - - - - - Vetch 43 657.94 - - - - - - Soya beans - - - - - - - Fenugreek 34 606.65 100.00 - - - - - Gibto - - - - - - - Oilseeds 65 915.89 17.50 26.14 56.36 - - - Neug - - - - - - - Linseed 64 462.30 - 21.57 78.43 - - - Groundnuts - - - - - - - Safflower - - - - - - - Sesame - - - - - - - Rapeseed 1 453.59 35.00 30.71 34.29 - - - Vegetables 399 879.31 75.67 0.83 19.93 0.07 - 3.50 Lettuce - - - - - - - Head cabbage 56 766.76 47.94 - 50.59 - - 1.47 Ethiopian cabbage 259 406.70 84.59 0.85 10.06 0.09 - 4.42 Tomatoes 45 344.17 7.50 - 92.50 - - - Green peppers 12 316.94 86.02 0.11 11.02 0.11 - 2.73 Red peppers 25 824.56 39.05 3.81 55.00 - - 2.14 Swiss chard 220.18 100.00 - - - - - Root Crops 1 248 166.50 41.45 27.73 29.82 0.17 - 0.83 Beetroot 50 487.58 51.47 - 46.91 - - 1.62 Carrot 10 677.28 41.25 - 58.44 - - 0.31 Onion 9 807.24 56.50 1.00 42.50 - - - Potatoes 1 094 108.80 35.14 41.50 22.29 0.27 - 0.79 Garlic 81 531.34 42.08 37.08 20.83 - - - Taro / ‘Godere’ - - - - - - - Sweet potatoes 1 554.25 84.29 - 14.29 - - 1.43 Permanent crops 697 931.06 84.86 0.14 9.04 0.57 0.57 4.82 Avocados 3 246.04 - - - - - - Bananas 41 385.18 71.43 - 21.43 - - 7.14 Guavas 16.97 100.00 - - - - - Lemons 10.19 - - - - - - Mangoes 769.48 - - - - - - Oranges 1 049.57 - - - - - - Papayas 3 149.46 100.00 - - - - - Pineapples - - - - - - - Chat 2 682.24 66.25 - 22.50 - - 11.25 Coffee 42 781.37 97.78 - - - - 2.22 Hops (Gesho) 313.75 33.33 - 66.67 - - - Enset 539 745.15 87.63 0.18 5.76 0.71 0.71 5.00 Sugar cane 62 781.67 10.00 - 90.00 - - -
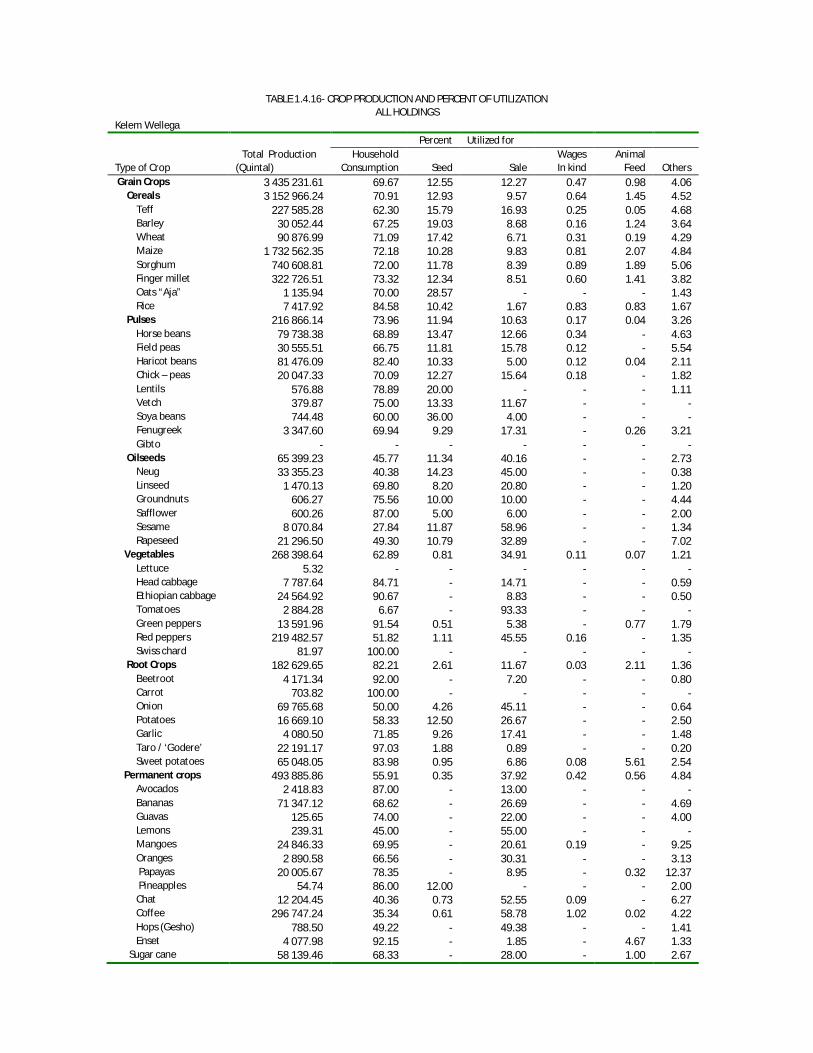
TABLE 1.4.16- CROP PRODUCTION AND PERCENT OF UTILIZATION ALL HOLDINGS
Kelem Wellega Percent Utilized for Total Production Household Wages Animal Type of Crop (Quintal) Consumption Seed Sale In kind Feed Others Grain Crops 3 435 231.61 69.67 12.55 12.27 0.47 0.98 4.06 Cereals 3 152 966.24 70.91 12.93 9.57 0.64 1.45 4.52 Teff 227 585.28 62.30 15.79 16.93 0.25 0.05 4.68 Barley 30 052.44 67.25 19.03 8.68 0.16 1.24 3.64 Wheat 90 876.99 71.09 17.42 6.71 0.31 0.19 4.29 Maize 1 732 562.35 72.18 10.28 9.83 0.81 2.07 4.84 Sorghum 740 608.81 72.00 11.78 8.39 0.89 1.89 5.06 Finger millet 322 726.51 73.32 12.34 8.51 0.60 1.41 3.82 Oats “Aja” 1 135.94 70.00 28.57 - - - 1.43 Rice 7 417.92 84.58 10.42 1.67 0.83 0.83 1.67 Pulses 216 866.14 73.96 11.94 10.63 0.17 0.04 3.26 Horse beans 79 738.38 68.89 13.47 12.66 0.34 - 4.63 Field peas 30 555.51 66.75 11.81 15.78 0.12 - 5.54 Haricot beans 81 476.09 82.40 10.33 5.00 0.12 0.04 2.11 Chick – peas 20 047.33 70.09 12.27 15.64 0.18 - 1.82 Lentils 576.88 78.89 20.00 - - - 1.11 Vetch 379.87 75.00 13.33 11.67 - - - Soya beans 744.48 60.00 36.00 4.00 - - - Fenugreek 3 347.60 69.94 9.29 17.31 - 0.26 3.21 Gibto - - - - - - - Oilseeds 65 399.23 45.77 11.34 40.16 - - 2.73 Neug 33 355.23 40.38 14.23 45.00 - - 0.38 Linseed 1 470.13 69.80 8.20 20.80 - - 1.20 Groundnuts 606.27 75.56 10.00 10.00 - - 4.44 Safflower 600.26 87.00 5.00 6.00 - - 2.00 Sesame 8 070.84 27.84 11.87 58.96 - - 1.34 Rapeseed 21 296.50 49.30 10.79 32.89 - - 7.02 Vegetables 268 398.64 62.89 0.81 34.91 0.11 0.07 1.21 Lettuce 5.32 - - - - - - Head cabbage 7 787.64 84.71 - 14.71 - - 0.59 Ethiopian cabbage 24 564.92 90.67 - 8.83 - - 0.50 Tomatoes 2 884.28 6.67 - 93.33 - - - Green peppers 13 591.96 91.54 0.51 5.38 - 0.77 1.79 Red peppers 219 482.57 51.82 1.11 45.55 0.16 - 1.35 Swiss chard 81.97 100.00 - - - - - Root Crops 182 629.65 82.21 2.61 11.67 0.03 2.11 1.36 Beetroot 4 171.34 92.00 - 7.20 - - 0.80 Carrot 703.82 100.00 - - - - - Onion 69 765.68 50.00 4.26 45.11 - - 0.64 Potatoes 16 669.10 58.33 12.50 26.67 - - 2.50 Garlic 4 080.50 71.85 9.26 17.41 - - 1.48 Taro / ‘Godere’ 22 191.17 97.03 1.88 0.89 - - 0.20 Sweet potatoes 65 048.05 83.98 0.95 6.86 0.08 5.61 2.54 Permanent crops 493 885.86 55.91 0.35 37.92 0.42 0.56 4.84 Avocados 2 418.83 87.00 - 13.00 - - - Bananas 71 347.12 68.62 - 26.69 - - 4.69 Guavas 125.65 74.00 - 22.00 - - 4.00 Lemons 239.31 45.00 - 55.00 - - - Mangoes 24 846.33 69.95 - 20.61 0.19 - 9.25 Oranges 2 890.58 66.56 - 30.31 - - 3.13 Papayas 20 005.67 78.35 - 8.95 - 0.32 12.37 Pineapples 54.74 86.00 12.00 - - - 2.00 Chat 12 204.45 40.36 0.73 52.55 0.09 - 6.27 Coffee 296 747.24 35.34 0.61 58.78 1.02 0.02 4.22 Hops (Gesho) 788.50 49.22 - 49.38 - - 1.41 Enset 4 077.98 92.15 - 1.85 - 4.67 1.33 Sugar cane 58 139.46 68.33 - 28.00 - 1.00 2.67
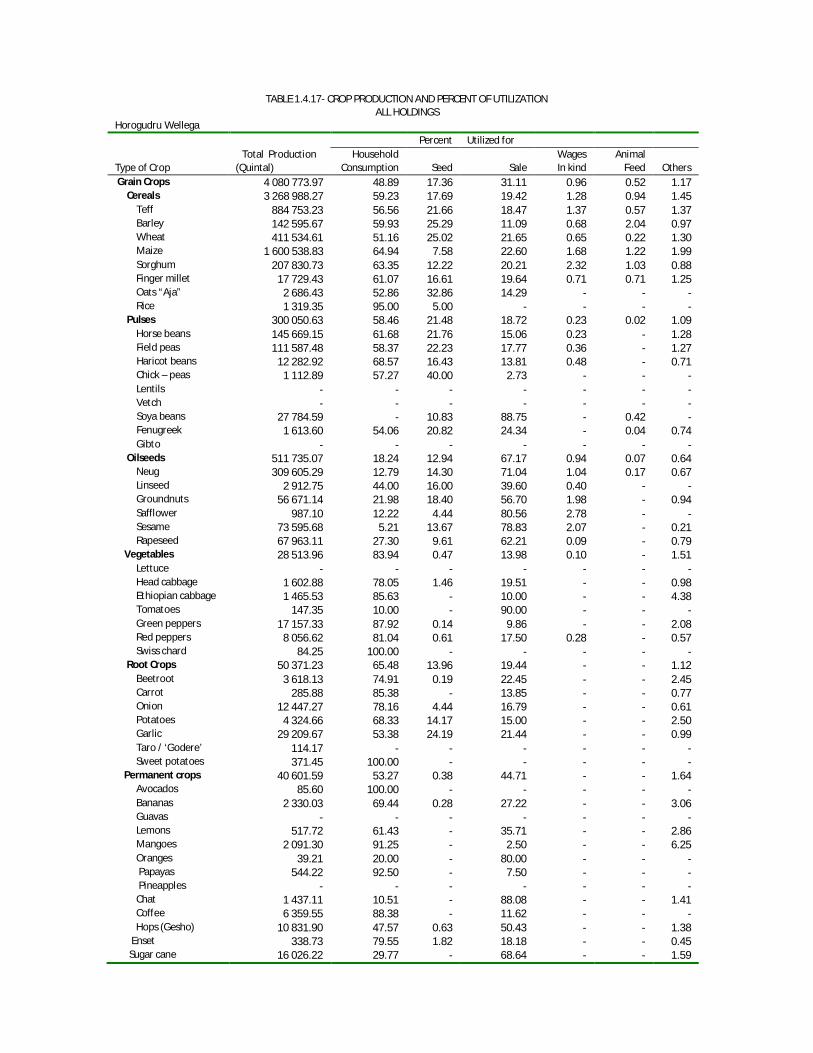
TABLE 1.4.17- CROP PRODUCTION AND PERCENT OF UTILIZATION ALL HOLDINGS
Horogudru Wellega Percent Utilized for Total Production Household Wages Animal Type of Crop (Quintal) Consumption Seed Sale In kind Feed Others Grain Crops 4 080 773.97 48.89 17.36 31.11 0.96 0.52 1.17 Cereals 3 268 988.27 59.23 17.69 19.42 1.28 0.94 1.45 Teff 884 753.23 56.56 21.66 18.47 1.37 0.57 1.37 Barley 142 595.67 59.93 25.29 11.09 0.68 2.04 0.97 Wheat 411 534.61 51.16 25.02 21.65 0.65 0.22 1.30 Maize 1 600 538.83 64.94 7.58 22.60 1.68 1.22 1.99 Sorghum 207 830.73 63.35 12.22 20.21 2.32 1.03 0.88 Finger millet 17 729.43 61.07 16.61 19.64 0.71 0.71 1.25 Oats “Aja” 2 686.43 52.86 32.86 14.29 - - - Rice 1 319.35 95.00 5.00 - - - - Pulses 300 050.63 58.46 21.48 18.72 0.23 0.02 1.09 Horse beans 145 669.15 61.68 21.76 15.06 0.23 - 1.28 Field peas 111 587.48 58.37 22.23 17.77 0.36 - 1.27 Haricot beans 12 282.92 68.57 16.43 13.81 0.48 - 0.71 Chick – peas 1 112.89 57.27 40.00 2.73 - - - Lentils - - - - - - - Vetch - - - - - - - Soya beans 27 784.59 - 10.83 88.75 - 0.42 - Fenugreek 1 613.60 54.06 20.82 24.34 - 0.04 0.74 Gibto - - - - - - - Oilseeds 511 735.07 18.24 12.94 67.17 0.94 0.07 0.64 Neug 309 605.29 12.79 14.30 71.04 1.04 0.17 0.67 Linseed 2 912.75 44.00 16.00 39.60 0.40 - - Groundnuts 56 671.14 21.98 18.40 56.70 1.98 - 0.94 Safflower 987.10 12.22 4.44 80.56 2.78 - - Sesame 73 595.68 5.21 13.67 78.83 2.07 - 0.21 Rapeseed 67 963.11 27.30 9.61 62.21 0.09 - 0.79 Vegetables 28 513.96 83.94 0.47 13.98 0.10 - 1.51 Lettuce - - - - - - - Head cabbage 1 602.88 78.05 1.46 19.51 - - 0.98 Ethiopian cabbage 1 465.53 85.63 - 10.00 - - 4.38 Tomatoes 147.35 10.00 - 90.00 - - - Green peppers 17 157.33 87.92 0.14 9.86 - - 2.08 Red peppers 8 056.62 81.04 0.61 17.50 0.28 - 0.57 Swiss chard 84.25 100.00 - - - - - Root Crops 50 371.23 65.48 13.96 19.44 - - 1.12 Beetroot 3 618.13 74.91 0.19 22.45 - - 2.45 Carrot 285.88 85.38 - 13.85 - - 0.77 Onion 12 447.27 78.16 4.44 16.79 - - 0.61 Potatoes 4 324.66 68.33 14.17 15.00 - - 2.50 Garlic 29 209.67 53.38 24.19 21.44 - - 0.99 Taro / ‘Godere’ 114.17 - - - - - - Sweet potatoes 371.45 100.00 - - - - - Permanent crops 40 601.59 53.27 0.38 44.71 - - 1.64 Avocados 85.60 100.00 - - - - - Bananas 2 330.03 69.44 0.28 27.22 - - 3.06 Guavas - - - - - - - Lemons 517.72 61.43 - 35.71 - - 2.86 Mangoes 2 091.30 91.25 - 2.50 - - 6.25 Oranges 39.21 20.00 - 80.00 - - - Papayas 544.22 92.50 - 7.50 - - - Pineapples - - - - - - - Chat 1 437.11 10.51 - 88.08 - - 1.41 Coffee 6 359.55 88.38 - 11.62 - - - Hops (Gesho) 10 831.90 47.57 0.63 50.43 - - 1.38 Enset 338.73 79.55 1.82 18.18 - - 0.45 Sugar cane 16 026.22 29.77 - 68.64 - - 1.59

TABLE 1.5- CROP PRODUCTION AND PERCENT OF UTILIZATION
ALL HOLDINGS Somale Region Percent Utilized for Total Production Household Wages Animal Type of Crop (Quintal) Consumption Seed Sale In kind Feed Others Grain Crops 1 736 903.70 74.53 9.74 9.89 2.48 0.13 3.24 Cereals 1 643 667.09 76.81 9.75 7.55 2.02 0.15 3.72 Teff - - - - - - - Barley 31 310.87 52.62 11.67 20.48 6.90 - 8.33 Wheat 96 755.57 54.62 12.21 20.00 5.87 0.10 7.21 Maize 758 407.58 81.60 10.36 4.02 0.79 0.33 2.90 Sorghum 757 042.84 79.40 8.53 6.88 1.86 0.02 3.31 Finger millet - - - - - - - Oats “Aja” 150.22 - - - - - - Rice - - - - - - - Pulses 25 448.98 72.09 7.55 17.82 2.36 - 0.18 Horse beans - - - - - - - Field peas 509.27 - - - - - - Haricot beans 22 986.90 74.33 7.98 15.00 2.50 - 0.19 Chick – peas 1 916.98 50.00 - 50.00 - - - Lentils 35.82 - - 100.00 - - - Vetch - - - - - - - Soya beans - - - - - - - Fenugreek - - - - - - - Gibto - - - - - - - Oilseeds 67 787.63 36.07 13.79 38.71 11.43 - - Neug - - - - - - - Linseed 240.12 83.33 16.67 - - - - Groundnuts 67 546.89 31.67 13.96 41.04 13.33 - - Safflower - - - - - - - Sesame 0.62 - 1.00 99.00 - - - Rapeseed - - - - - - - Vegetables 30 848.04 47.54 6.92 39.73 0.38 - 5.42 Lettuce - - - - - - - Head cabbage - - - - - - - Ethiopian cabbage - - - - - - - Tomatoes 29 445.40 42.50 11.25 37.13 0.63 - 8.50 Green peppers 1 402.64 59.33 - 39.83 - - 0.83 Red peppers - - - - - - - Swiss chard - - - - - - - Root Crops 108 061.14 34.34 5.69 51.52 - - 8.45 Beetroot - - - - - - - Carrot - - - - - - - Onion 103 684.71 28.84 6.60 55.96 - - 8.60 Potatoes 1 842.77 60.00 - 20.00 - - 20.00 Garlic 887.78 25.00 - 75.00 - - - Taro / ‘Godere’ - - - - - - - Sweet potatoes 1 645.89 95.00 - - - - 5.00 Permanent crops 93 126.48 29.55 - 64.07 2.49 - 3.89 Avocados - - - - - - - Bananas 5 091.33 3.00 - 96.29 - - 0.71 Guavas 110.27 97.50 - - - - 2.50 Lemons 1 723.10 28.19 - 71.19 - - 0.63 Mangoes 5 623.65 42.47 - 51.53 - - 6.00 Oranges 31 064.70 11.10 - 83.30 4.00 - 1.60 Papayas 3 611.65 50.00 - 50.00 - - - Pineapples - - - - - - - Chat 45 599.60 30.24 - 60.71 3.65 - 5.40 Coffee 120.41 35.67 - 64.33 - - - Hops (Gesho) - - - - - - - Enset - - - - - - - Sugar cane 181.77 - - - - - -

TABLE 1.5.1- CROP PRODUCTION AND PERCENT OF UTILIZATION ALL HOLDINGS
Shinele Percent Utilized for Total Production Household Wages Animal Type of Crop (Quintal) Consumption Seed Sale In kind Feed Others Grain Crops 18 852.66 89.99 4.47 1.00 0.02 - 4.52 Cereals 18 833.85 90.81 4.56 - 0.02 - 4.61 Teff - - - - - - - Barley - - - - - - - Wheat - - - - - - - Maize 4 866.46 94.17 4.23 - - - 1.60 Sorghum 13 967.39 89.15 4.77 - 0.03 - 6.05 Finger millet - - - - - - - Oats “Aja” - - - - - - - Rice - - - - - - - Pulses 18.19 100.00 - - - - - Horse beans - - - - - - - Field peas - - - - - - - Haricot beans 18.19 100.00 - - - - - Chick – peas - - - - - - - Lentils - - - - - - - Vetch - - - - - - - Soya beans - - - - - - - Fenugreek - - - - - - - Gibto - - - - - - - Oilseeds 0.62 - 1.00 99.00 - - - Neug - - - - - - - Linseed - - - - - - - Groundnuts - - - - - - - Safflower - - - - - - - Sesame 0.62 - 1.00 99.00 - - - Rapeseed - - - - - - - Vegetables 2 470.42 62.00 - 36.00 - - 2.00 Lettuce - - - - - - - Head cabbage - - - - - - - Ethiopian cabbage - - - - - - - Tomatoes 1 878.69 64.29 - 32.71 - - 3.00 Green peppers 591.73 59.33 - 39.83 - - 0.83 Red peppers - - - - - - - Swiss chard - - - - - - - Root Crops 2 407.77 57.29 - 41.29 - - 1.43 Beetroot - - - - - - - Carrot - - - - - - - Onion 1 005.41 42.20 - 57.80 - - - Potatoes - - - - - - - Garlic - - - - - - - Taro / ‘Godere’ - - - - - - - Sweet potatoes 1 402.36 95.00 - - - - 5.00 Permanent crops 42 910.80 29.49 - 65.91 0.97 - 3.63 Avocados - - - - - - - Bananas 3 007.81 3.00 - 96.29 - - 0.71 Guavas 14.79 96.67 - - - - 3.33 Lemons 1 208.79 28.19 - 71.19 - - 0.63 Mangoes 3 777.51 42.47 - 51.53 - - 6.00 Oranges 31 064.70 11.10 - 83.30 4.00 - 1.60 Papayas 62.31 50.00 - 50.00 - - - Pineapples - - - - - - - Chat 3 472.71 33.32 - 59.61 0.45 - 6.61 Coffee 120.41 35.67 - 64.33 - - - Hops (Gesho) - - - - - - - Enset - - - - - - - Sugar cane 181.77 - - - - - -
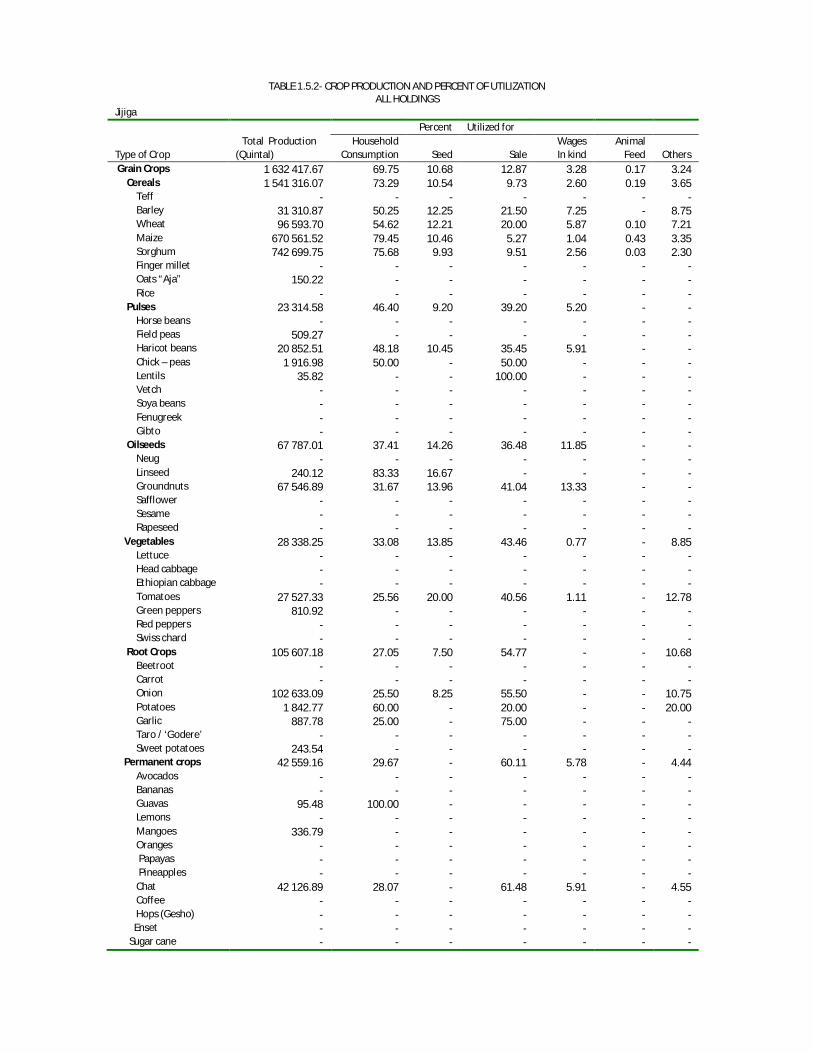
TABLE 1.5.2- CROP PRODUCTION AND PERCENT OF UTILIZATION
ALL HOLDINGS Jijiga Percent Utilized for Total Production Household Wages Animal Type of Crop (Quintal) Consumption Seed Sale In kind Feed Others Grain Crops 1 632 417.67 69.75 10.68 12.87 3.28 0.17 3.24 Cereals 1 541 316.07 73.29 10.54 9.73 2.60 0.19 3.65 Teff - - - - - - - Barley 31 310.87 50.25 12.25 21.50 7.25 - 8.75 Wheat 96 593.70 54.62 12.21 20.00 5.87 0.10 7.21 Maize 670 561.52 79.45 10.46 5.27 1.04 0.43 3.35 Sorghum 742 699.75 75.68 9.93 9.51 2.56 0.03 2.30 Finger millet - - - - - - - Oats “Aja” 150.22 - - - - - - Rice - - - - - - - Pulses 23 314.58 46.40 9.20 39.20 5.20 - - Horse beans - - - - - - - Field peas 509.27 - - - - - - Haricot beans 20 852.51 48.18 10.45 35.45 5.91 - - Chick – peas 1 916.98 50.00 - 50.00 - - - Lentils 35.82 - - 100.00 - - - Vetch - - - - - - - Soya beans - - - - - - - Fenugreek - - - - - - - Gibto - - - - - - - Oilseeds 67 787.01 37.41 14.26 36.48 11.85 - - Neug - - - - - - - Linseed 240.12 83.33 16.67 - - - - Groundnuts 67 546.89 31.67 13.96 41.04 13.33 - - Safflower - - - - - - - Sesame - - - - - - - Rapeseed - - - - - - - Vegetables 28 338.25 33.08 13.85 43.46 0.77 - 8.85 Lettuce - - - - - - - Head cabbage - - - - - - - Ethiopian cabbage - - - - - - - Tomatoes 27 527.33 25.56 20.00 40.56 1.11 - 12.78 Green peppers 810.92 - - - - - - Red peppers - - - - - - - Swiss chard - - - - - - - Root Crops 105 607.18 27.05 7.50 54.77 - - 10.68 Beetroot - - - - - - - Carrot - - - - - - - Onion 102 633.09 25.50 8.25 55.50 - - 10.75 Potatoes 1 842.77 60.00 - 20.00 - - 20.00 Garlic 887.78 25.00 - 75.00 - - - Taro / ‘Godere’ - - - - - - - Sweet potatoes 243.54 - - - - - - Permanent crops 42 559.16 29.67 - 60.11 5.78 - 4.44 Avocados - - - - - - - Bananas - - - - - - - Guavas 95.48 100.00 - - - - - Lemons - - - - - - - Mangoes 336.79 - - - - - - Oranges - - - - - - - Papayas - - - - - - - Pineapples - - - - - - - Chat 42 126.89 28.07 - 61.48 5.91 - 4.55 Coffee - - - - - - - Hops (Gesho) - - - - - - - Enset - - - - - - - Sugar cane - - - - - - -

TABLE 1.5.3- CROP PRODUCTION AND PERCENT OF UTILIZATION
ALL HOLDINGS Liben Percent Utilized for Total Production Household Wages Animal Type of Crop (Quintal) Consumption Seed Sale In kind Feed Others Grain Crops 85 633.37 87.94 11.37 - - - 0.69 Cereals 83 517.17 80.91 17.95 - - - 1.14 Teff - - - - - - - Barley - - - - - - - Wheat 161.87 - - - - - - Maize 82 979.60 80.48 18.33 - - - 1.19 Sorghum 375.70 90.00 10.00 - - - - Finger millet - - - - - - - Oats “Aja” - - - - - - - Rice - - - - - - - Pulses 2 116.21 93.28 6.38 - - - 0.34 Horse beans - - - - - - - Field peas - - - - - - - Haricot beans 2 116.21 93.28 6.38 - - - 0.34 Chick – peas - - - - - - - Lentils - - - - - - - Vetch - - - - - - - Soya beans - - - - - - - Fenugreek - - - - - - - Gibto - - - - - - - Oilseeds - - - - - - - Neug - - - - - - - Linseed - - - - - - - Groundnuts - - - - - - - Safflower - - - - - - - Sesame - - - - - - - Rapeseed - - - - - - - Vegetables 39.37 - - - - - - Lettuce - - - - - - - Head cabbage - - - - - - - Ethiopian cabbage - - - - - - - Tomatoes 39.37 - - - - - - Green peppers - - - - - - - Red peppers - - - - - - - Swiss chard - - - - - - - Root Crops 46.20 - - - - - - Beetroot - - - - - - - Carrot - - - - - - - Onion 46.20 - - - - - - Potatoes - - - - - - - Garlic - - - - - - - Taro / ‘Godere’ - - - - - - - Sweet potatoes - - - - - - - Permanent crops 7 656.52 - - - - - - Avocados - - - - - - - Bananas 2 083.52 - - - - - - Guavas - - - - - - - Lemons 514.31 - - - - - - Mangoes 1 509.35 - - - - - - Oranges - - - - - - - Papayas 3 549.34 - - - - - - Pineapples - - - - - - - Chat - - - - - - - Coffee - - - - - - - Hops (Gesho) - - - - - - - Enset - - - - - - - Sugar cane - - - - - - -

TABLE 1.6- CROP PRODUCTION AND PERCENT OF UTILIZATION ALL HOLDINGS
Benshangul-Gumuz Percent Utilized for Total Production Household Wages Animal Type of Crop (Quintal) Consumption Seed Sale In kind Feed Others Grain Crops 4 018 792.28 60.04 9.65 27.35 1.07 0.43 1.47 Cereals 3 240 300.88 72.82 9.76 14.03 1.18 0.67 1.54 Teff 232 256.63 58.20 11.31 25.90 2.44 - 2.15 Barley 8 539.08 72.26 14.66 9.48 3.15 0.08 0.37 Wheat 28 361.44 60.33 16.30 18.31 4.39 - 0.67 Maize 1 431 870.31 76.80 8.72 11.46 0.87 1.00 1.16 Sorghum 1 108 206.34 74.56 9.75 13.17 0.70 0.79 1.04 Finger millet 410 573.47 71.43 9.91 13.80 1.28 0.15 3.42 Oats “Aja” 692.80 49.67 7.50 42.83 - - - Rice 19 800.81 64.27 12.00 11.93 6.47 1.33 4.00 Pulses 221 864.39 68.45 9.62 20.15 0.62 0.02 1.13 Horse beans 10 671.06 76.81 10.76 10.36 1.00 - 1.07 Field peas 7 545.06 61.42 10.42 27.75 - - 0.42 Haricot beans 57 885.98 77.27 8.19 12.32 0.56 - 1.67 Chick – peas 8 640.72 75.17 9.61 15.11 - - 0.11 Lentils 311.32 55.00 19.00 20.00 5.00 - 1.00 Vetch - - - - - - - Soya beans 136 039.54 40.14 12.18 46.68 0.63 0.08 0.29 Fenugreek 10.57 66.67 1.67 31.67 - - - Gibto 760.14 40.00 10.00 50.00 - - - Oilseeds 556 627.00 25.77 9.41 62.29 1.01 0.05 1.47 Neug 45 864.82 21.57 10.94 64.89 1.05 0.05 1.51 Linseed 2 415.56 68.08 7.22 23.73 - 0.22 0.75 Groundnuts 267 932.09 26.28 12.88 55.71 2.11 0.01 3.00 Safflower 11 161.43 56.04 7.50 31.46 1.88 0.21 2.92 Sesame 227 981.08 15.56 7.90 74.83 0.77 0.03 0.91 Rapeseed 1 272.02 51.66 6.62 40.80 - 0.02 0.90 Vegetables 65 933.85 80.29 0.85 17.61 0.47 - 0.78 Lettuce 86.50 92.00 - 8.00 - - - Head cabbage 2 246.72 79.80 - 19.08 - - 1.12 Ethiopian cabbage 7 294.70 82.65 1.47 15.78 - - 0.10 Tomatoes 5 230.23 86.38 0.14 12.97 - - 0.51 Green peppers 5 892.79 86.65 0.43 11.83 - - 1.10 Red peppers 45 182.92 77.49 1.10 19.85 0.78 - 0.77 Swiss chard - - - - - - - Root Crops 140 004.79 79.49 2.62 16.88 0.12 - 0.89 Beetroot 919.92 80.83 0.42 16.67 - - 2.08 Carrot 216.77 70.00 - 23.75 - - 6.25 Onion 12 573.99 73.80 3.49 21.87 - - 0.84 Potatoes 33 058.97 73.21 9.29 16.55 0.71 - 0.24 Garlic 10 024.19 62.55 8.85 27.56 0.18 - 0.87 Taro / ‘Godere’ 1 545.53 90.00 0.36 9.20 - - 0.43 Sweet potatoes 81 665.43 84.54 0.41 14.09 0.10 - 0.86 Permanent crops 208 104.53 52.92 1.01 44.26 0.25 0.04 1.52 Avocados 81.17 75.00 1.00 22.00 - - 2.00 Bananas 38 370.64 48.84 0.20 49.38 0.45 0.09 1.05 Guavas 785.28 61.47 0.59 35.44 0.59 - 1.91 Lemons 3 532.56 45.27 0.18 49.49 0.09 0.05 4.91 Mangoes 80 224.39 59.67 1.12 36.64 0.33 - 2.24 Oranges 3 518.14 52.55 1.17 44.60 - - 1.68 Papayas 14 769.92 70.67 0.90 27.33 - - 1.10 Pineapples - - - - - - - Chat 8 021.66 28.81 2.35 66.06 0.46 0.20 2.12 Coffee 5 655.12 50.84 1.37 47.26 0.19 - 0.35 Hops (Gesho) 2 096.85 57.16 0.81 41.56 - - 0.47 Enset - - - - - - - Sugar cane 51 048.80 42.17 0.19 57.06 - - 0.58
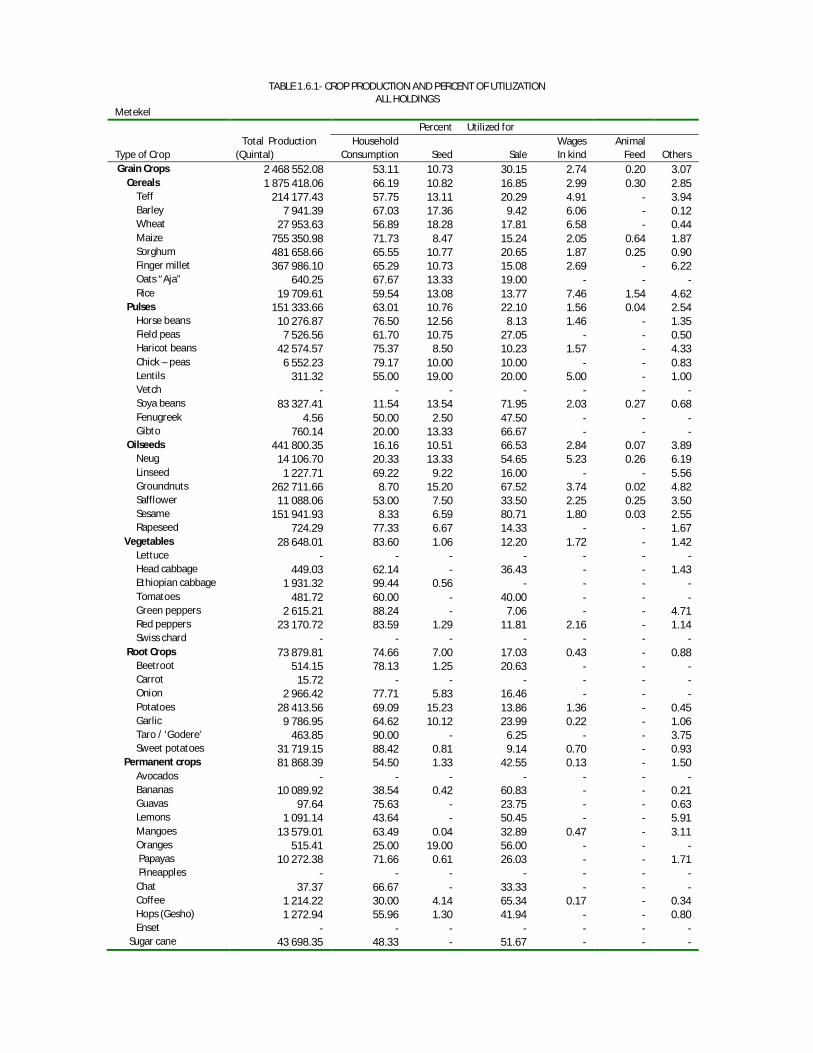
TABLE 1.6.1- CROP PRODUCTION AND PERCENT OF UTILIZATION
ALL HOLDINGS Metekel Percent Utilized for Total Production Household Wages Animal Type of Crop (Quintal) Consumption Seed Sale In kind Feed Others Grain Crops 2 468 552.08 53.11 10.73 30.15 2.74 0.20 3.07 Cereals 1 875 418.06 66.19 10.82 16.85 2.99 0.30 2.85 Teff 214 177.43 57.75 13.11 20.29 4.91 - 3.94 Barley 7 941.39 67.03 17.36 9.42 6.06 - 0.12 Wheat 27 953.63 56.89 18.28 17.81 6.58 - 0.44 Maize 755 350.98 71.73 8.47 15.24 2.05 0.64 1.87 Sorghum 481 658.66 65.55 10.77 20.65 1.87 0.25 0.90 Finger millet 367 986.10 65.29 10.73 15.08 2.69 - 6.22 Oats “Aja” 640.25 67.67 13.33 19.00 - - - Rice 19 709.61 59.54 13.08 13.77 7.46 1.54 4.62 Pulses 151 333.66 63.01 10.76 22.10 1.56 0.04 2.54 Horse beans 10 276.87 76.50 12.56 8.13 1.46 - 1.35 Field peas 7 526.56 61.70 10.75 27.05 - - 0.50 Haricot beans 42 574.57 75.37 8.50 10.23 1.57 - 4.33 Chick – peas 6 552.23 79.17 10.00 10.00 - - 0.83 Lentils 311.32 55.00 19.00 20.00 5.00 - 1.00 Vetch - - - - - - - Soya beans 83 327.41 11.54 13.54 71.95 2.03 0.27 0.68 Fenugreek 4.56 50.00 2.50 47.50 - - - Gibto 760.14 20.00 13.33 66.67 - - - Oilseeds 441 800.35 16.16 10.51 66.53 2.84 0.07 3.89 Neug 14 106.70 20.33 13.33 54.65 5.23 0.26 6.19 Linseed 1 227.71 69.22 9.22 16.00 - - 5.56 Groundnuts 262 711.66 8.70 15.20 67.52 3.74 0.02 4.82 Safflower 11 088.06 53.00 7.50 33.50 2.25 0.25 3.50 Sesame 151 941.93 8.33 6.59 80.71 1.80 0.03 2.55 Rapeseed 724.29 77.33 6.67 14.33 - - 1.67 Vegetables 28 648.01 83.60 1.06 12.20 1.72 - 1.42 Lettuce - - - - - - - Head cabbage 449.03 62.14 - 36.43 - - 1.43 Ethiopian cabbage 1 931.32 99.44 0.56 - - - - Tomatoes 481.72 60.00 - 40.00 - - - Green peppers 2 615.21 88.24 - 7.06 - - 4.71 Red peppers 23 170.72 83.59 1.29 11.81 2.16 - 1.14 Swiss chard - - - - - - - Root Crops 73 879.81 74.66 7.00 17.03 0.43 - 0.88 Beetroot 514.15 78.13 1.25 20.63 - - - Carrot 15.72 - - - - - - Onion 2 966.42 77.71 5.83 16.46 - - - Potatoes 28 413.56 69.09 15.23 13.86 1.36 - 0.45 Garlic 9 786.95 64.62 10.12 23.99 0.22 - 1.06 Taro / ‘Godere’ 463.85 90.00 - 6.25 - - 3.75 Sweet potatoes 31 719.15 88.42 0.81 9.14 0.70 - 0.93 Permanent crops 81 868.39 54.50 1.33 42.55 0.13 - 1.50 Avocados - - - - - - - Bananas 10 089.92 38.54 0.42 60.83 - - 0.21 Guavas 97.64 75.63 - 23.75 - - 0.63 Lemons 1 091.14 43.64 - 50.45 - - 5.91 Mangoes 13 579.01 63.49 0.04 32.89 0.47 - 3.11 Oranges 515.41 25.00 19.00 56.00 - - - Papayas 10 272.38 71.66 0.61 26.03 - - 1.71 Pineapples - - - - - - - Chat 37.37 66.67 - 33.33 - - - Coffee 1 214.22 30.00 4.14 65.34 0.17 - 0.34 Hops (Gesho) 1 272.94 55.96 1.30 41.94 - - 0.80 Enset - - - - - - - Sugar cane 43 698.35 48.33 - 51.67 - - -
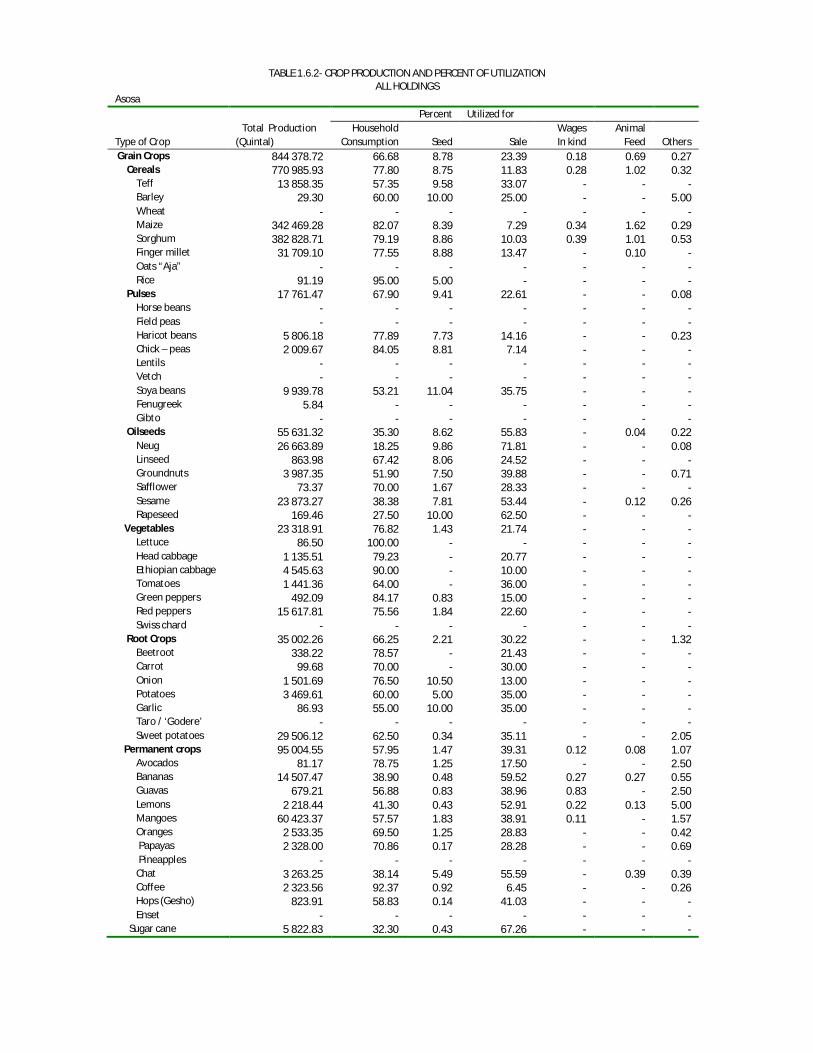
TABLE 1.6.2- CROP PRODUCTION AND PERCENT OF UTILIZATION ALL HOLDINGS
Asosa Percent Utilized for Total Production Household Wages Animal Type of Crop (Quintal) Consumption Seed Sale In kind Feed Others Grain Crops 844 378.72 66.68 8.78 23.39 0.18 0.69 0.27 Cereals 770 985.93 77.80 8.75 11.83 0.28 1.02 0.32 Teff 13 858.35 57.35 9.58 33.07 - - - Barley 29.30 60.00 10.00 25.00 - - 5.00 Wheat - - - - - - - Maize 342 469.28 82.07 8.39 7.29 0.34 1.62 0.29 Sorghum 382 828.71 79.19 8.86 10.03 0.39 1.01 0.53 Finger millet 31 709.10 77.55 8.88 13.47 - 0.10 - Oats “Aja” - - - - - - - Rice 91.19 95.00 5.00 - - - - Pulses 17 761.47 67.90 9.41 22.61 - - 0.08 Horse beans - - - - - - - Field peas - - - - - - - Haricot beans 5 806.18 77.89 7.73 14.16 - - 0.23 Chick – peas 2 009.67 84.05 8.81 7.14 - - - Lentils - - - - - - - Vetch - - - - - - - Soya beans 9 939.78 53.21 11.04 35.75 - - - Fenugreek 5.84 - - - - - - Gibto - - - - - - - Oilseeds 55 631.32 35.30 8.62 55.83 - 0.04 0.22 Neug 26 663.89 18.25 9.86 71.81 - - 0.08 Linseed 863.98 67.42 8.06 24.52 - - - Groundnuts 3 987.35 51.90 7.50 39.88 - - 0.71 Safflower 73.37 70.00 1.67 28.33 - - - Sesame 23 873.27 38.38 7.81 53.44 - 0.12 0.26 Rapeseed 169.46 27.50 10.00 62.50 - - - Vegetables 23 318.91 76.82 1.43 21.74 - - - Lettuce 86.50 100.00 - - - - - Head cabbage 1 135.51 79.23 - 20.77 - - - Ethiopian cabbage 4 545.63 90.00 - 10.00 - - - Tomatoes 1 441.36 64.00 - 36.00 - - - Green peppers 492.09 84.17 0.83 15.00 - - - Red peppers 15 617.81 75.56 1.84 22.60 - - - Swiss chard - - - - - - - Root Crops 35 002.26 66.25 2.21 30.22 - - 1.32 Beetroot 338.22 78.57 - 21.43 - - - Carrot 99.68 70.00 - 30.00 - - - Onion 1 501.69 76.50 10.50 13.00 - - - Potatoes 3 469.61 60.00 5.00 35.00 - - - Garlic 86.93 55.00 10.00 35.00 - - - Taro / ‘Godere’ - - - - - - - Sweet potatoes 29 506.12 62.50 0.34 35.11 - - 2.05 Permanent crops 95 004.55 57.95 1.47 39.31 0.12 0.08 1.07 Avocados 81.17 78.75 1.25 17.50 - - 2.50 Bananas 14 507.47 38.90 0.48 59.52 0.27 0.27 0.55 Guavas 679.21 56.88 0.83 38.96 0.83 - 2.50 Lemons 2 218.44 41.30 0.43 52.91 0.22 0.13 5.00 Mangoes 60 423.37 57.57 1.83 38.91 0.11 - 1.57 Oranges 2 533.35 69.50 1.25 28.83 - - 0.42 Papayas 2 328.00 70.86 0.17 28.28 - - 0.69 Pineapples - - - - - - - Chat 3 263.25 38.14 5.49 55.59 - 0.39 0.39 Coffee 2 323.56 92.37 0.92 6.45 - - 0.26 Hops (Gesho) 823.91 58.83 0.14 41.03 - - - Enset - - - - - - - Sugar cane 5 822.83 32.30 0.43 67.26 - - -
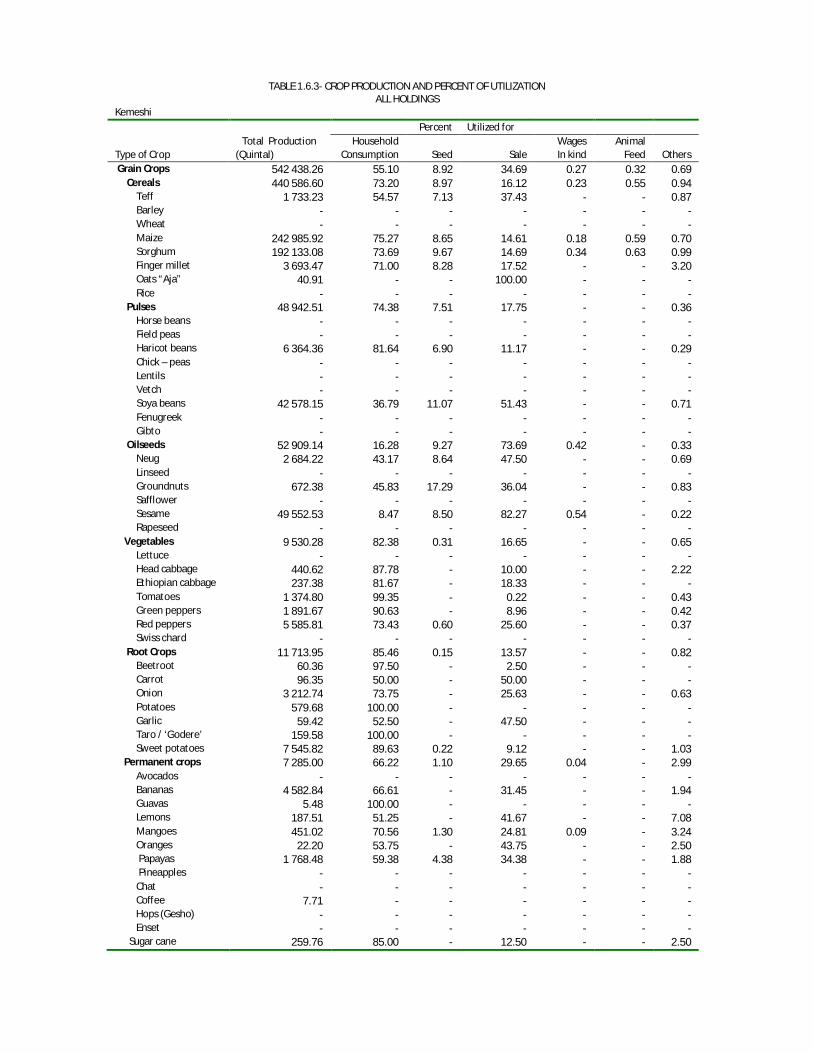
TABLE 1.6.3- CROP PRODUCTION AND PERCENT OF UTILIZATION
ALL HOLDINGS Kemeshi Percent Utilized for Total Production Household Wages Animal Type of Crop (Quintal) Consumption Seed Sale In kind Feed Others Grain Crops 542 438.26 55.10 8.92 34.69 0.27 0.32 0.69 Cereals 440 586.60 73.20 8.97 16.12 0.23 0.55 0.94 Teff 1 733.23 54.57 7.13 37.43 - - 0.87 Barley - - - - - - - Wheat - - - - - - - Maize 242 985.92 75.27 8.65 14.61 0.18 0.59 0.70 Sorghum 192 133.08 73.69 9.67 14.69 0.34 0.63 0.99 Finger millet 3 693.47 71.00 8.28 17.52 - - 3.20 Oats “Aja” 40.91 - - 100.00 - - - Rice - - - - - - - Pulses 48 942.51 74.38 7.51 17.75 - - 0.36 Horse beans - - - - - - - Field peas - - - - - - - Haricot beans 6 364.36 81.64 6.90 11.17 - - 0.29 Chick – peas - - - - - - - Lentils - - - - - - - Vetch - - - - - - - Soya beans 42 578.15 36.79 11.07 51.43 - - 0.71 Fenugreek - - - - - - - Gibto - - - - - - - Oilseeds 52 909.14 16.28 9.27 73.69 0.42 - 0.33 Neug 2 684.22 43.17 8.64 47.50 - - 0.69 Linseed - - - - - - - Groundnuts 672.38 45.83 17.29 36.04 - - 0.83 Safflower - - - - - - - Sesame 49 552.53 8.47 8.50 82.27 0.54 - 0.22 Rapeseed - - - - - - - Vegetables 9 530.28 82.38 0.31 16.65 - - 0.65 Lettuce - - - - - - - Head cabbage 440.62 87.78 - 10.00 - - 2.22 Ethiopian cabbage 237.38 81.67 - 18.33 - - - Tomatoes 1 374.80 99.35 - 0.22 - - 0.43 Green peppers 1 891.67 90.63 - 8.96 - - 0.42 Red peppers 5 585.81 73.43 0.60 25.60 - - 0.37 Swiss chard - - - - - - - Root Crops 11 713.95 85.46 0.15 13.57 - - 0.82 Beetroot 60.36 97.50 - 2.50 - - - Carrot 96.35 50.00 - 50.00 - - - Onion 3 212.74 73.75 - 25.63 - - 0.63 Potatoes 579.68 100.00 - - - - - Garlic 59.42 52.50 - 47.50 - - - Taro / ‘Godere’ 159.58 100.00 - - - - - Sweet potatoes 7 545.82 89.63 0.22 9.12 - - 1.03 Permanent crops 7 285.00 66.22 1.10 29.65 0.04 - 2.99 Avocados - - - - - - - Bananas 4 582.84 66.61 - 31.45 - - 1.94 Guavas 5.48 100.00 - - - - - Lemons 187.51 51.25 - 41.67 - - 7.08 Mangoes 451.02 70.56 1.30 24.81 0.09 - 3.24 Oranges 22.20 53.75 - 43.75 - - 2.50 Papayas 1 768.48 59.38 4.38 34.38 - - 1.88 Pineapples - - - - - - - Chat - - - - - - - Coffee 7.71 - - - - - - Hops (Gesho) - - - - - - - Enset - - - - - - - Sugar cane 259.76 85.00 - 12.50 - - 2.50

TABLE 1.6.4- CROP PRODUCTION AND PERCENT OF UTILIZATION ALL HOLDINGS
Mao Komo Percent Utilized for Total Production Household Wages Animal Type of Crop (Quintal) Consumption Seed Sale In kind Feed Others Grain Crops 163 423.23 66.55 9.59 21.99 0.27 0.54 1.06 Cereals 153 310.29 76.05 10.01 11.12 0.43 0.85 1.53 Teff 2 487.62 61.97 10.50 26.52 0.17 - 0.85 Barley 568.39 78.83 12.00 8.50 0.17 0.17 0.33 Wheat 407.82 67.22 12.33 19.33 - - 1.11 Maize 91 064.12 79.08 9.48 8.16 0.50 1.17 1.61 Sorghum 51 585.89 75.91 10.20 10.44 0.60 1.03 1.82 Finger millet 7 184.80 77.15 9.74 10.95 0.18 0.50 1.47 Oats “Aja” 11.64 95.00 5.00 - - - - Rice - - - - - - - Pulses 3 826.75 73.75 9.20 16.81 0.03 - 0.21 Horse beans 394.20 77.50 6.82 15.23 - - 0.45 Field peas 18.51 60.00 8.75 31.25 - - - Haricot beans 3 140.86 76.20 8.89 14.62 0.05 - 0.24 Chick – peas 78.82 64.11 10.37 25.53 - - - Lentils - - - - - - - Vetch - - - - - - - Soya beans 194.19 65.94 13.75 20.31 - - - Fenugreek 0.16 100.00 - - - - - Gibto - - - - - - - Oilseeds 6 286.19 39.09 8.78 51.65 - 0.09 0.39 Neug 2 410.01 17.22 11.97 70.25 - - 0.56 Linseed 323.87 68.22 6.62 24.34 - 0.34 0.48 Groundnuts 560.70 47.88 7.93 43.70 - - 0.50 Safflower - - - - - - - Sesame 2 613.34 26.73 9.15 64.13 - - - Rapeseed 378.27 40.77 6.03 52.50 - 0.03 0.67 Vegetables 4 436.65 78.36 0.64 20.19 - - 0.81 Lettuce - - - - - - - Head cabbage 221.55 82.75 - 16.00 - - 1.25 Ethiopian cabbage 580.36 76.77 2.26 20.81 - - 0.16 Tomatoes 1 932.36 83.55 0.26 15.53 - - 0.66 Green peppers 893.81 83.57 0.86 15.57 - - - Red peppers 808.57 72.77 0.30 25.54 - - 1.39 Swiss chard - - - - - - - Root Crops 19 408.77 83.89 0.74 14.56 - - 0.80 Beetroot 7.18 75.00 - 15.00 - - 10.00 Carrot 5.02 83.33 - - - - 16.67 Onion 4 893.14 70.15 1.36 26.67 - - 1.82 Potatoes 596.11 75.67 3.00 21.33 - - - Garlic 90.88 52.78 2.78 44.44 - - - Taro / ‘Godere’ 922.10 89.83 0.42 9.75 - - - Sweet potatoes 12 894.35 87.88 0.40 11.35 - - 0.36 Permanent crops 23 946.58 43.64 0.37 53.84 0.49 0.02 1.64 Avocados - - - - - - - Bananas 9 190.41 53.23 - 44.58 0.83 - 1.35 Guavas 2.95 20.00 - 80.00 - - - Lemons 35.48 49.44 - 50.00 - - 0.56 Mangoes 5 770.98 54.16 0.13 42.34 0.91 - 2.47 Oranges 447.18 48.57 - 49.29 - - 2.14 Papayas 401.06 75.96 - 23.85 - - 0.19 Pineapples - - - - - - - Chat 4 721.04 22.73 0.77 72.58 0.72 0.10 3.09 Coffee 2 109.63 27.64 0.95 70.68 0.32 - 0.41 Hops (Gesho) - - - - - - - Enset - - - - - - - Sugar cane 1 267.86 38.50 - 59.50 - - 2.00
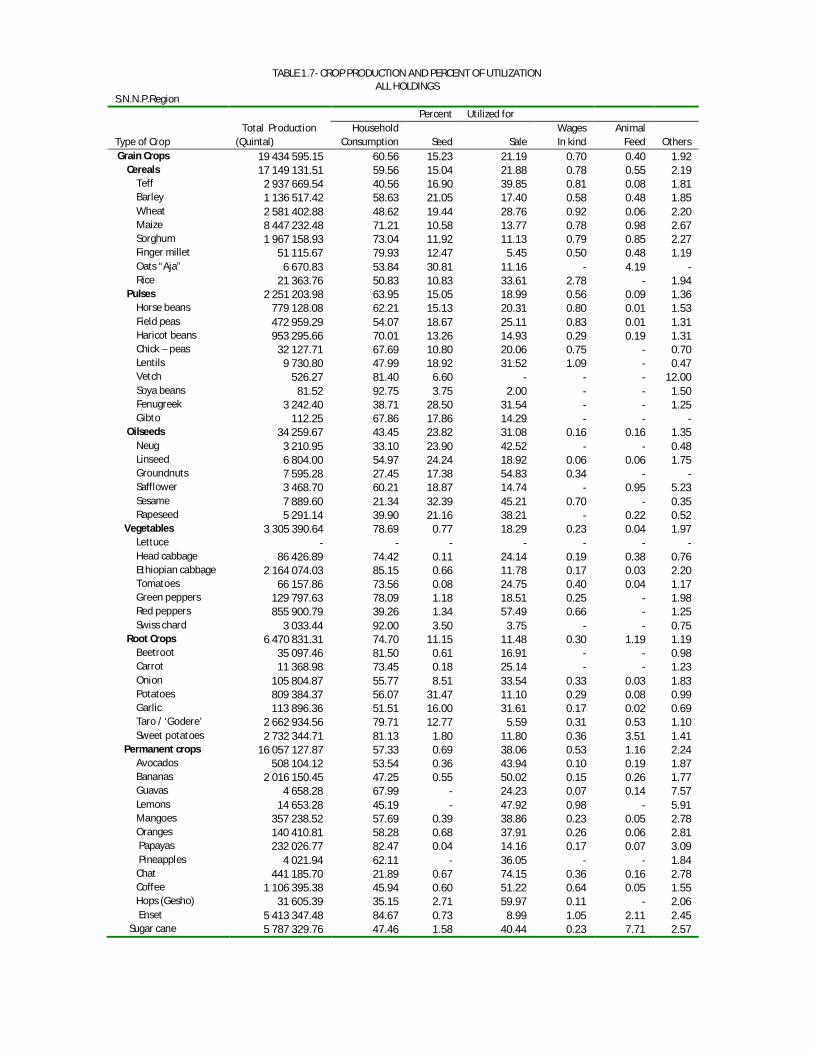
TABLE 1.7- CROP PRODUCTION AND PERCENT OF UTILIZATION ALL HOLDINGS
S.N.N.P.Region Percent Utilized for Total Production Household Wages Animal Type of Crop (Quintal) Consumption Seed Sale In kind Feed Others Grain Crops 19 434 595.15 60.56 15.23 21.19 0.70 0.40 1.92 Cereals 17 149 131.51 59.56 15.04 21.88 0.78 0.55 2.19 Teff 2 937 669.54 40.56 16.90 39.85 0.81 0.08 1.81 Barley 1 136 517.42 58.63 21.05 17.40 0.58 0.48 1.85 Wheat 2 581 402.88 48.62 19.44 28.76 0.92 0.06 2.20 Maize 8 447 232.48 71.21 10.58 13.77 0.78 0.98 2.67 Sorghum 1 967 158.93 73.04 11.92 11.13 0.79 0.85 2.27 Finger millet 51 115.67 79.93 12.47 5.45 0.50 0.48 1.19 Oats “Aja” 6 670.83 53.84 30.81 11.16 - 4.19 - Rice 21 363.76 50.83 10.83 33.61 2.78 - 1.94 Pulses 2 251 203.98 63.95 15.05 18.99 0.56 0.09 1.36 Horse beans 779 128.08 62.21 15.13 20.31 0.80 0.01 1.53 Field peas 472 959.29 54.07 18.67 25.11 0.83 0.01 1.31 Haricot beans 953 295.66 70.01 13.26 14.93 0.29 0.19 1.31 Chick – peas 32 127.71 67.69 10.80 20.06 0.75 - 0.70 Lentils 9 730.80 47.99 18.92 31.52 1.09 - 0.47 Vetch 526.27 81.40 6.60 - - - 12.00 Soya beans 81.52 92.75 3.75 2.00 - - 1.50 Fenugreek 3 242.40 38.71 28.50 31.54 - - 1.25 Gibto 112.25 67.86 17.86 14.29 - - - Oilseeds 34 259.67 43.45 23.82 31.08 0.16 0.16 1.35 Neug 3 210.95 33.10 23.90 42.52 - - 0.48 Linseed 6 804.00 54.97 24.24 18.92 0.06 0.06 1.75 Groundnuts 7 595.28 27.45 17.38 54.83 0.34 - - Safflower 3 468.70 60.21 18.87 14.74 - 0.95 5.23 Sesame 7 889.60 21.34 32.39 45.21 0.70 - 0.35 Rapeseed 5 291.14 39.90 21.16 38.21 - 0.22 0.52 Vegetables 3 305 390.64 78.69 0.77 18.29 0.23 0.04 1.97 Lettuce - - - - - - - Head cabbage 86 426.89 74.42 0.11 24.14 0.19 0.38 0.76 Ethiopian cabbage 2 164 074.03 85.15 0.66 11.78 0.17 0.03 2.20 Tomatoes 66 157.86 73.56 0.08 24.75 0.40 0.04 1.17 Green peppers 129 797.63 78.09 1.18 18.51 0.25 - 1.98 Red peppers 855 900.79 39.26 1.34 57.49 0.66 - 1.25 Swiss chard 3 033.44 92.00 3.50 3.75 - - 0.75 Root Crops 6 470 831.31 74.70 11.15 11.48 0.30 1.19 1.19 Beetroot 35 097.46 81.50 0.61 16.91 - - 0.98 Carrot 11 368.98 73.45 0.18 25.14 - - 1.23 Onion 105 804.87 55.77 8.51 33.54 0.33 0.03 1.83 Potatoes 809 384.37 56.07 31.47 11.10 0.29 0.08 0.99 Garlic 113 896.36 51.51 16.00 31.61 0.17 0.02 0.69 Taro / ‘Godere’ 2 662 934.56 79.71 12.77 5.59 0.31 0.53 1.10 Sweet potatoes 2 732 344.71 81.13 1.80 11.80 0.36 3.51 1.41 Permanent crops 16 057 127.87 57.33 0.69 38.06 0.53 1.16 2.24 Avocados 508 104.12 53.54 0.36 43.94 0.10 0.19 1.87 Bananas 2 016 150.45 47.25 0.55 50.02 0.15 0.26 1.77 Guavas 4 658.28 67.99 - 24.23 0.07 0.14 7.57 Lemons 14 653.28 45.19 - 47.92 0.98 - 5.91 Mangoes 357 238.52 57.69 0.39 38.86 0.23 0.05 2.78 Oranges 140 410.81 58.28 0.68 37.91 0.26 0.06 2.81 Papayas 232 026.77 82.47 0.04 14.16 0.17 0.07 3.09 Pineapples 4 021.94 62.11 - 36.05 - - 1.84 Chat 441 185.70 21.89 0.67 74.15 0.36 0.16 2.78 Coffee 1 106 395.38 45.94 0.60 51.22 0.64 0.05 1.55 Hops (Gesho) 31 605.39 35.15 2.71 59.97 0.11 - 2.06 Enset 5 413 347.48 84.67 0.73 8.99 1.05 2.11 2.45 Sugar cane 5 787 329.76 47.46 1.58 40.44 0.23 7.71 2.57
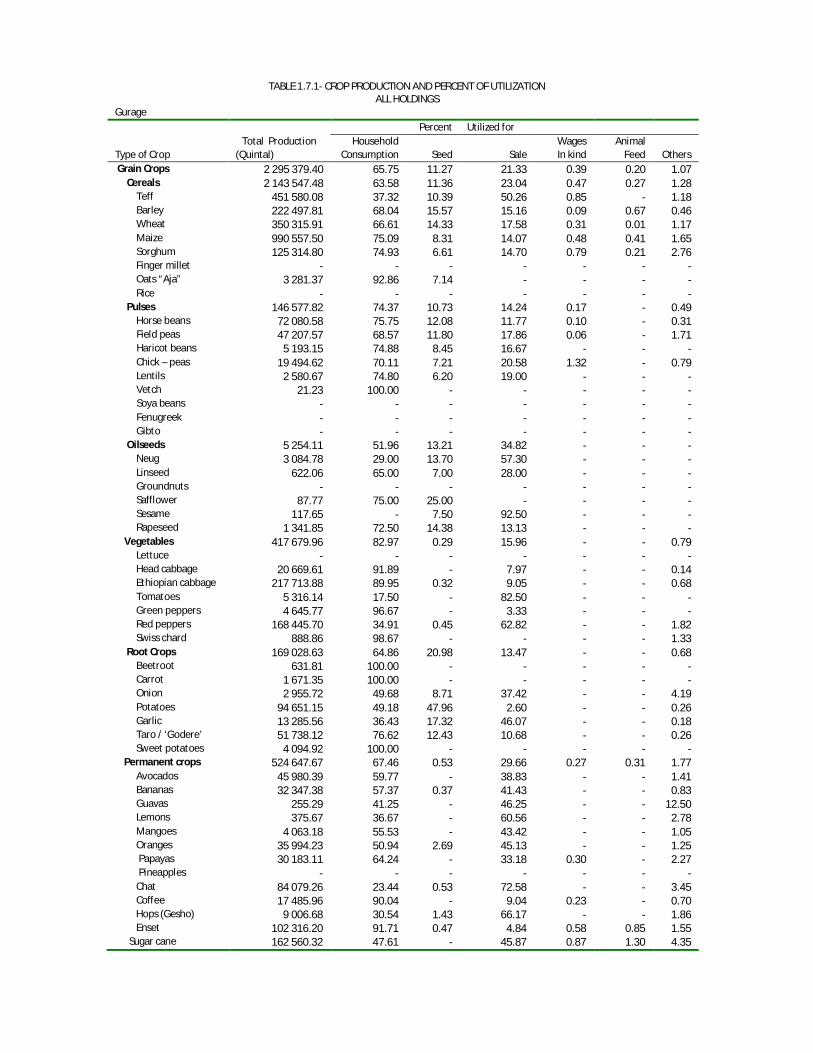
TABLE 1.7.1- CROP PRODUCTION AND PERCENT OF UTILIZATION
ALL HOLDINGS Gurage Percent Utilized for Total Production Household Wages Animal Type of Crop (Quintal) Consumption Seed Sale In kind Feed Others Grain Crops 2 295 379.40 65.75 11.27 21.33 0.39 0.20 1.07 Cereals 2 143 547.48 63.58 11.36 23.04 0.47 0.27 1.28 Teff 451 580.08 37.32 10.39 50.26 0.85 - 1.18 Barley 222 497.81 68.04 15.57 15.16 0.09 0.67 0.46 Wheat 350 315.91 66.61 14.33 17.58 0.31 0.01 1.17 Maize 990 557.50 75.09 8.31 14.07 0.48 0.41 1.65 Sorghum 125 314.80 74.93 6.61 14.70 0.79 0.21 2.76 Finger millet - - - - - - - Oats “Aja” 3 281.37 92.86 7.14 - - - - Rice - - - - - - - Pulses 146 577.82 74.37 10.73 14.24 0.17 - 0.49 Horse beans 72 080.58 75.75 12.08 11.77 0.10 - 0.31 Field peas 47 207.57 68.57 11.80 17.86 0.06 - 1.71 Haricot beans 5 193.15 74.88 8.45 16.67 - - - Chick – peas 19 494.62 70.11 7.21 20.58 1.32 - 0.79 Lentils 2 580.67 74.80 6.20 19.00 - - - Vetch 21.23 100.00 - - - - - Soya beans - - - - - - - Fenugreek - - - - - - - Gibto - - - - - - - Oilseeds 5 254.11 51.96 13.21 34.82 - - - Neug 3 084.78 29.00 13.70 57.30 - - - Linseed 622.06 65.00 7.00 28.00 - - - Groundnuts - - - - - - - Safflower 87.77 75.00 25.00 - - - - Sesame 117.65 - 7.50 92.50 - - - Rapeseed 1 341.85 72.50 14.38 13.13 - - - Vegetables 417 679.96 82.97 0.29 15.96 - - 0.79 Lettuce - - - - - - - Head cabbage 20 669.61 91.89 - 7.97 - - 0.14 Ethiopian cabbage 217 713.88 89.95 0.32 9.05 - - 0.68 Tomatoes 5 316.14 17.50 - 82.50 - - - Green peppers 4 645.77 96.67 - 3.33 - - - Red peppers 168 445.70 34.91 0.45 62.82 - - 1.82 Swiss chard 888.86 98.67 - - - - 1.33 Root Crops 169 028.63 64.86 20.98 13.47 - - 0.68 Beetroot 631.81 100.00 - - - - - Carrot 1 671.35 100.00 - - - - - Onion 2 955.72 49.68 8.71 37.42 - - 4.19 Potatoes 94 651.15 49.18 47.96 2.60 - - 0.26 Garlic 13 285.56 36.43 17.32 46.07 - - 0.18 Taro / ‘Godere’ 51 738.12 76.62 12.43 10.68 - - 0.26 Sweet potatoes 4 094.92 100.00 - - - - - Permanent crops 524 647.67 67.46 0.53 29.66 0.27 0.31 1.77 Avocados 45 980.39 59.77 - 38.83 - - 1.41 Bananas 32 347.38 57.37 0.37 41.43 - - 0.83 Guavas 255.29 41.25 - 46.25 - - 12.50 Lemons 375.67 36.67 - 60.56 - - 2.78 Mangoes 4 063.18 55.53 - 43.42 - - 1.05 Oranges 35 994.23 50.94 2.69 45.13 - - 1.25 Papayas 30 183.11 64.24 - 33.18 0.30 - 2.27 Pineapples - - - - - - - Chat 84 079.26 23.44 0.53 72.58 - - 3.45 Coffee 17 485.96 90.04 - 9.04 0.23 - 0.70 Hops (Gesho) 9 006.68 30.54 1.43 66.17 - - 1.86 Enset 102 316.20 91.71 0.47 4.84 0.58 0.85 1.55 Sugar cane 162 560.32 47.61 - 45.87 0.87 1.30 4.35

TABLE 1.7.2- CROP PRODUCTION AND PERCENT OF UTILIZATION
ALL HOLDINGS Hadiya Percent Utilized for Total Production Household Wages Animal Type of Crop (Quintal) Consumption Seed Sale In kind Feed Others Grain Crops 2 164 498.07 63.17 11.76 22.76 0.34 0.14 1.84 Cereals 2 021 577.14 60.96 12.19 24.35 0.34 0.18 1.98 Teff 438 784.21 43.86 10.37 45.06 0.17 - 0.54 Barley 71 930.16 73.78 17.58 6.99 0.65 0.17 0.83 Wheat 820 853.66 43.27 16.44 35.89 0.88 - 3.52 Maize 552 512.22 80.79 9.18 7.00 0.05 0.55 2.43 Sorghum 131 746.62 78.43 8.38 10.41 - 0.29 2.49 Finger millet 5 399.55 82.14 15.95 1.43 - - 0.48 Oats “Aja” 350.71 100.00 - - - - - Rice - - - - - - - Pulses 139 814.19 70.88 10.18 17.10 0.39 - 1.45 Horse beans 89 824.68 66.34 7.89 22.42 0.83 - 2.52 Field peas 25 776.02 65.59 7.82 25.56 - - 1.03 Haricot beans 23 196.77 76.30 14.26 8.94 0.05 - 0.46 Chick – peas 80.99 100.00 - - - - - Lentils 935.72 98.00 2.00 - - - - Vetch - - - - - - - Soya beans - - - - - - - Fenugreek - - - - - - - Gibto - - - - - - - Oilseeds 3 106.74 56.43 13.91 28.78 - - 0.87 Neug - - - - - - - Linseed 1 656.28 79.29 8.21 11.79 - - 0.71 Groundnuts - - - - - - - Safflower - - - - - - - Sesame - - - - - - - Rapeseed 1 450.46 22.25 20.63 57.13 - - - Vegetables 352 468.38 80.50 1.00 16.39 0.04 0.07 2.00 Lettuce - - - - - - - Head cabbage 6 201.50 98.21 - 1.38 - - 0.42 Ethiopian cabbage 281 899.48 86.37 0.25 10.71 0.03 0.09 2.54 Tomatoes 23 261.10 84.06 - 15.94 - - - Green peppers 23 198.77 70.71 3.33 25.48 - - 0.48 Red peppers 17 281.11 29.13 5.75 63.88 0.25 - 1.00 Swiss chard 626.42 100.00 - - - - - Root Crops 365 624.71 74.86 16.30 7.68 0.03 0.12 1.01 Beetroot 9 622.63 94.60 - 5.13 - - 0.27 Carrot 241.54 100.00 - - - - - Onion 2 006.78 92.50 0.63 6.25 - - 0.63 Potatoes 116 901.33 60.72 28.55 9.04 0.12 - 1.57 Garlic 303.69 70.00 - 26.67 - - 3.33 Taro / ‘Godere’ 172 426.63 74.38 17.01 7.62 - - 0.99 Sweet potatoes 64 122.11 62.88 25.45 9.39 - 1.06 1.21 Permanent crops 1 106 204.10 60.77 0.73 33.84 0.64 2.06 1.97 Avocados 32 840.52 75.00 1.16 23.02 - - 0.81 Bananas 232 434.64 47.98 - 51.23 0.09 - 0.70 Guavas 18.69 73.33 - 21.67 - - 5.00 Lemons 50.06 - - - - - - Mangoes 2 892.70 76.56 - 23.44 - - - Oranges 1 888.60 90.00 - 8.00 - - 2.00 Papayas 21 704.39 79.38 2.50 16.88 - - 1.25 Pineapples - - - - - - - Chat 11 581.81 12.62 1.64 83.20 - - 2.54 Coffee 43 539.14 63.52 0.06 34.08 0.91 - 1.42 Hops (Gesho) 721.89 18.47 6.67 74.20 - - 0.67 Enset 289 492.60 80.47 0.06 10.48 1.20 4.40 3.38 Sugar cane 469 039.05 34.20 4.29 52.68 0.18 7.59 1.07
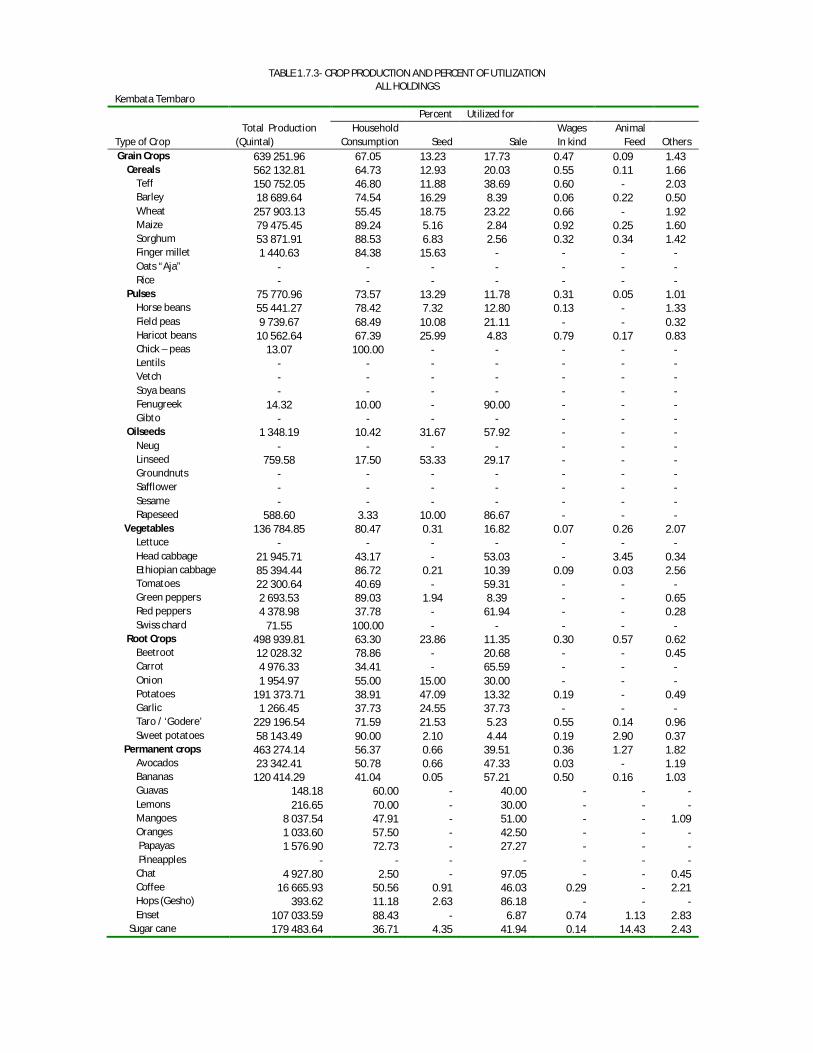
TABLE 1.7.3- CROP PRODUCTION AND PERCENT OF UTILIZATION ALL HOLDINGS
Kembata Tembaro Percent Utilized for Total Production Household Wages Animal Type of Crop (Quintal) Consumption Seed Sale In kind Feed Others Grain Crops 639 251.96 67.05 13.23 17.73 0.47 0.09 1.43 Cereals 562 132.81 64.73 12.93 20.03 0.55 0.11 1.66 Teff 150 752.05 46.80 11.88 38.69 0.60 - 2.03 Barley 18 689.64 74.54 16.29 8.39 0.06 0.22 0.50 Wheat 257 903.13 55.45 18.75 23.22 0.66 - 1.92 Maize 79 475.45 89.24 5.16 2.84 0.92 0.25 1.60 Sorghum 53 871.91 88.53 6.83 2.56 0.32 0.34 1.42 Finger millet 1 440.63 84.38 15.63 - - - - Oats “Aja” - - - - - - - Rice - - - - - - - Pulses 75 770.96 73.57 13.29 11.78 0.31 0.05 1.01 Horse beans 55 441.27 78.42 7.32 12.80 0.13 - 1.33 Field peas 9 739.67 68.49 10.08 21.11 - - 0.32 Haricot beans 10 562.64 67.39 25.99 4.83 0.79 0.17 0.83 Chick – peas 13.07 100.00 - - - - - Lentils - - - - - - - Vetch - - - - - - - Soya beans - - - - - - - Fenugreek 14.32 10.00 - 90.00 - - - Gibto - - - - - - - Oilseeds 1 348.19 10.42 31.67 57.92 - - - Neug - - - - - - - Linseed 759.58 17.50 53.33 29.17 - - - Groundnuts - - - - - - - Safflower - - - - - - - Sesame - - - - - - - Rapeseed 588.60 3.33 10.00 86.67 - - - Vegetables 136 784.85 80.47 0.31 16.82 0.07 0.26 2.07 Lettuce - - - - - - - Head cabbage 21 945.71 43.17 - 53.03 - 3.45 0.34 Ethiopian cabbage 85 394.44 86.72 0.21 10.39 0.09 0.03 2.56 Tomatoes 22 300.64 40.69 - 59.31 - - - Green peppers 2 693.53 89.03 1.94 8.39 - - 0.65 Red peppers 4 378.98 37.78 - 61.94 - - 0.28 Swiss chard 71.55 100.00 - - - - - Root Crops 498 939.81 63.30 23.86 11.35 0.30 0.57 0.62 Beetroot 12 028.32 78.86 - 20.68 - - 0.45 Carrot 4 976.33 34.41 - 65.59 - - - Onion 1 954.97 55.00 15.00 30.00 - - - Potatoes 191 373.71 38.91 47.09 13.32 0.19 - 0.49 Garlic 1 266.45 37.73 24.55 37.73 - - - Taro / ‘Godere’ 229 196.54 71.59 21.53 5.23 0.55 0.14 0.96 Sweet potatoes 58 143.49 90.00 2.10 4.44 0.19 2.90 0.37 Permanent crops 463 274.14 56.37 0.66 39.51 0.36 1.27 1.82 Avocados 23 342.41 50.78 0.66 47.33 0.03 - 1.19 Bananas 120 414.29 41.04 0.05 57.21 0.50 0.16 1.03 Guavas 148.18 60.00 - 40.00 - - - Lemons 216.65 70.00 - 30.00 - - - Mangoes 8 037.54 47.91 - 51.00 - - 1.09 Oranges 1 033.60 57.50 - 42.50 - - - Papayas 1 576.90 72.73 - 27.27 - - - Pineapples - - - - - - - Chat 4 927.80 2.50 - 97.05 - - 0.45 Coffee 16 665.93 50.56 0.91 46.03 0.29 - 2.21 Hops (Gesho) 393.62 11.18 2.63 86.18 - - - Enset 107 033.59 88.43 - 6.87 0.74 1.13 2.83 Sugar cane 179 483.64 36.71 4.35 41.94 0.14 14.43 2.43
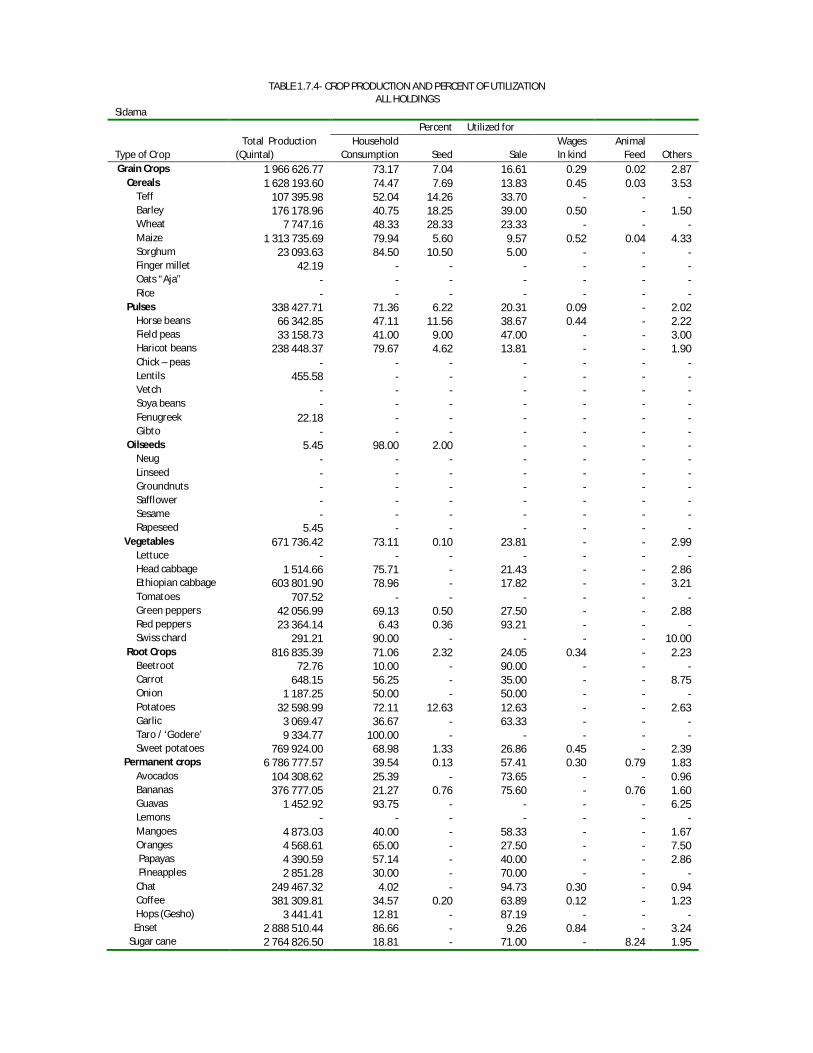
TABLE 1.7.4- CROP PRODUCTION AND PERCENT OF UTILIZATION
ALL HOLDINGS Sidama Percent Utilized for Total Production Household Wages Animal Type of Crop (Quintal) Consumption Seed Sale In kind Feed Others Grain Crops 1 966 626.77 73.17 7.04 16.61 0.29 0.02 2.87 Cereals 1 628 193.60 74.47 7.69 13.83 0.45 0.03 3.53 Teff 107 395.98 52.04 14.26 33.70 - - - Barley 176 178.96 40.75 18.25 39.00 0.50 - 1.50 Wheat 7 747.16 48.33 28.33 23.33 - - - Maize 1 313 735.69 79.94 5.60 9.57 0.52 0.04 4.33 Sorghum 23 093.63 84.50 10.50 5.00 - - - Finger millet 42.19 - - - - - - Oats “Aja” - - - - - - - Rice - - - - - - - Pulses 338 427.71 71.36 6.22 20.31 0.09 - 2.02 Horse beans 66 342.85 47.11 11.56 38.67 0.44 - 2.22 Field peas 33 158.73 41.00 9.00 47.00 - - 3.00 Haricot beans 238 448.37 79.67 4.62 13.81 - - 1.90 Chick – peas - - - - - - - Lentils 455.58 - - - - - - Vetch - - - - - - - Soya beans - - - - - - - Fenugreek 22.18 - - - - - - Gibto - - - - - - - Oilseeds 5.45 98.00 2.00 - - - - Neug - - - - - - - Linseed - - - - - - - Groundnuts - - - - - - - Safflower - - - - - - - Sesame - - - - - - - Rapeseed 5.45 - - - - - - Vegetables 671 736.42 73.11 0.10 23.81 - - 2.99 Lettuce - - - - - - - Head cabbage 1 514.66 75.71 - 21.43 - - 2.86 Ethiopian cabbage 603 801.90 78.96 - 17.82 - - 3.21 Tomatoes 707.52 - - - - - - Green peppers 42 056.99 69.13 0.50 27.50 - - 2.88 Red peppers 23 364.14 6.43 0.36 93.21 - - - Swiss chard 291.21 90.00 - - - - 10.00 Root Crops 816 835.39 71.06 2.32 24.05 0.34 - 2.23 Beetroot 72.76 10.00 - 90.00 - - - Carrot 648.15 56.25 - 35.00 - - 8.75 Onion 1 187.25 50.00 - 50.00 - - - Potatoes 32 598.99 72.11 12.63 12.63 - - 2.63 Garlic 3 069.47 36.67 - 63.33 - - - Taro / ‘Godere’ 9 334.77 100.00 - - - - - Sweet potatoes 769 924.00 68.98 1.33 26.86 0.45 - 2.39 Permanent crops 6 786 777.57 39.54 0.13 57.41 0.30 0.79 1.83 Avocados 104 308.62 25.39 - 73.65 - - 0.96 Bananas 376 777.05 21.27 0.76 75.60 - 0.76 1.60 Guavas 1 452.92 93.75 - - - - 6.25 Lemons - - - - - - - Mangoes 4 873.03 40.00 - 58.33 - - 1.67 Oranges 4 568.61 65.00 - 27.50 - - 7.50 Papayas 4 390.59 57.14 - 40.00 - - 2.86 Pineapples 2 851.28 30.00 - 70.00 - - - Chat 249 467.32 4.02 - 94.73 0.30 - 0.94 Coffee 381 309.81 34.57 0.20 63.89 0.12 - 1.23 Hops (Gesho) 3 441.41 12.81 - 87.19 - - - Enset 2 888 510.44 86.66 - 9.26 0.84 - 3.24 Sugar cane 2 764 826.50 18.81 - 71.00 - 8.24 1.95
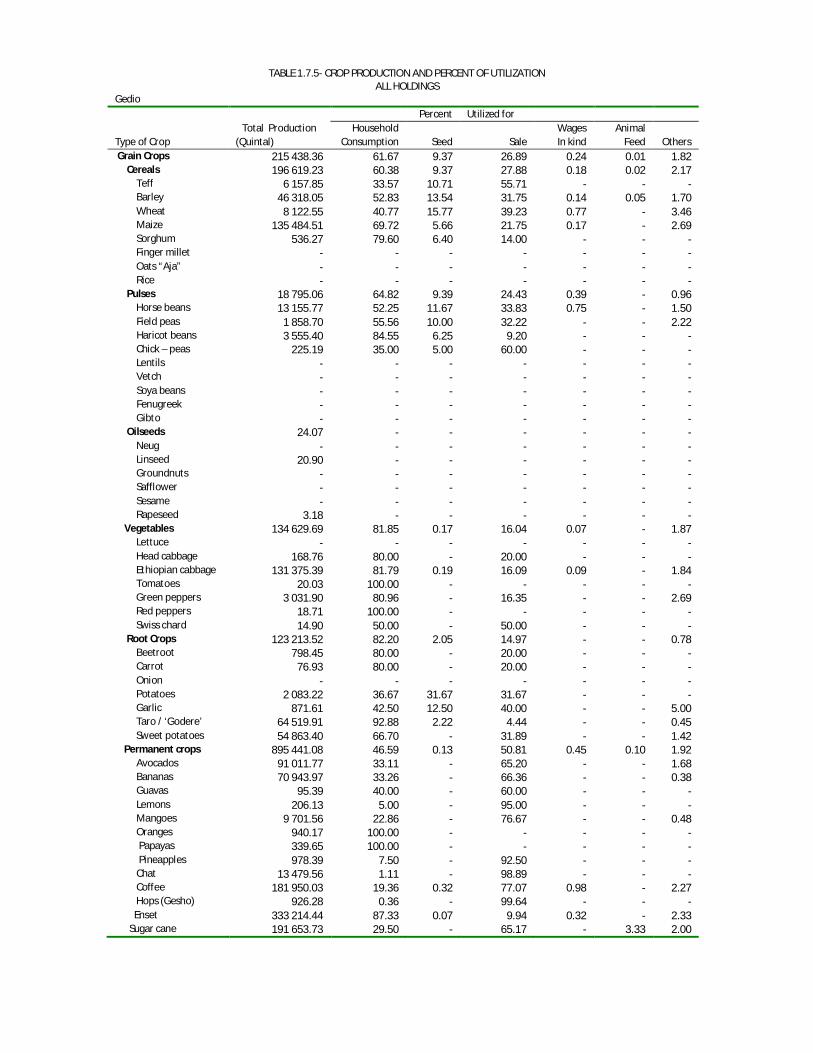
TABLE 1.7.5- CROP PRODUCTION AND PERCENT OF UTILIZATION ALL HOLDINGS
Gedio Percent Utilized for Total Production Household Wages Animal Type of Crop (Quintal) Consumption Seed Sale In kind Feed Others Grain Crops 215 438.36 61.67 9.37 26.89 0.24 0.01 1.82 Cereals 196 619.23 60.38 9.37 27.88 0.18 0.02 2.17 Teff 6 157.85 33.57 10.71 55.71 - - - Barley 46 318.05 52.83 13.54 31.75 0.14 0.05 1.70 Wheat 8 122.55 40.77 15.77 39.23 0.77 - 3.46 Maize 135 484.51 69.72 5.66 21.75 0.17 - 2.69 Sorghum 536.27 79.60 6.40 14.00 - - - Finger millet - - - - - - - Oats “Aja” - - - - - - - Rice - - - - - - - Pulses 18 795.06 64.82 9.39 24.43 0.39 - 0.96 Horse beans 13 155.77 52.25 11.67 33.83 0.75 - 1.50 Field peas 1 858.70 55.56 10.00 32.22 - - 2.22 Haricot beans 3 555.40 84.55 6.25 9.20 - - - Chick – peas 225.19 35.00 5.00 60.00 - - - Lentils - - - - - - - Vetch - - - - - - - Soya beans - - - - - - - Fenugreek - - - - - - - Gibto - - - - - - - Oilseeds 24.07 - - - - - - Neug - - - - - - - Linseed 20.90 - - - - - - Groundnuts - - - - - - - Safflower - - - - - - - Sesame - - - - - - - Rapeseed 3.18 - - - - - - Vegetables 134 629.69 81.85 0.17 16.04 0.07 - 1.87 Lettuce - - - - - - - Head cabbage 168.76 80.00 - 20.00 - - - Ethiopian cabbage 131 375.39 81.79 0.19 16.09 0.09 - 1.84 Tomatoes 20.03 100.00 - - - - - Green peppers 3 031.90 80.96 - 16.35 - - 2.69 Red peppers 18.71 100.00 - - - - - Swiss chard 14.90 50.00 - 50.00 - - - Root Crops 123 213.52 82.20 2.05 14.97 - - 0.78 Beetroot 798.45 80.00 - 20.00 - - - Carrot 76.93 80.00 - 20.00 - - - Onion - - - - - - - Potatoes 2 083.22 36.67 31.67 31.67 - - - Garlic 871.61 42.50 12.50 40.00 - - 5.00 Taro / ‘Godere’ 64 519.91 92.88 2.22 4.44 - - 0.45 Sweet potatoes 54 863.40 66.70 - 31.89 - - 1.42 Permanent crops 895 441.08 46.59 0.13 50.81 0.45 0.10 1.92 Avocados 91 011.77 33.11 - 65.20 - - 1.68 Bananas 70 943.97 33.26 - 66.36 - - 0.38 Guavas 95.39 40.00 - 60.00 - - - Lemons 206.13 5.00 - 95.00 - - - Mangoes 9 701.56 22.86 - 76.67 - - 0.48 Oranges 940.17 100.00 - - - - - Papayas 339.65 100.00 - - - - - Pineapples 978.39 7.50 - 92.50 - - - Chat 13 479.56 1.11 - 98.89 - - - Coffee 181 950.03 19.36 0.32 77.07 0.98 - 2.27 Hops (Gesho) 926.28 0.36 - 99.64 - - - Enset 333 214.44 87.33 0.07 9.94 0.32 - 2.33 Sugar cane 191 653.73 29.50 - 65.17 - 3.33 2.00

TABLE 1.7.6- CROP PRODUCTION AND PERCENT OF UTILIZATION ALL HOLDINGS
Wolayita Percent Utilized for Total Production Household Wages Animal Type of Crop (Quintal) Consumption Seed Sale In kind Feed Others Grain Crops 1 100 713.31 65.82 13.18 18.32 1.35 0.65 0.68 Cereals 873 421.57 59.74 13.31 23.53 1.76 1.01 0.65 Teff 214 113.61 35.94 15.88 45.72 2.14 0.18 0.14 Barley 4 460.50 70.87 20.22 8.91 - - - Wheat 58 958.43 48.10 13.50 34.68 2.82 0.19 0.71 Maize 581 982.15 76.60 10.11 8.90 1.59 1.68 1.11 Sorghum 13 532.32 83.00 14.44 0.61 0.12 1.46 0.37 Finger millet - - - - - - - Oats “Aja” 374.55 12.50 53.75 21.25 - 12.50 - Rice - - - - - - - Pulses 226 773.69 73.42 12.75 12.03 0.86 0.21 0.72 Horse beans 10 820.42 79.08 6.88 12.88 - - 1.15 Field peas 8 784.53 71.90 17.16 9.31 - - 1.64 Haricot beans 200 484.10 72.68 13.10 12.30 1.09 0.29 0.53 Chick – peas 6 684.64 72.79 10.75 14.58 1.25 - 0.63 Lentils - - - - - - - Vetch - - - - - - - Soya beans - - - - - - - Fenugreek - - - - - - - Gibto - - - - - - - Oilseeds 518.05 64.67 35.33 - - - - Neug - - - - - - - Linseed 83.68 70.00 30.00 - - - - Groundnuts 428.83 89.00 11.00 - - - - Safflower 5.55 - 100.00 - - - - Sesame - - - - - - - Rapeseed - - - - - - - Vegetables 72 173.72 80.76 0.33 17.04 0.09 0.04 1.74 Lettuce - - - - - - - Head cabbage 510.35 76.67 - 23.33 - - - Ethiopian cabbage 60 038.77 84.27 - 13.64 0.14 0.07 1.89 Tomatoes 799.63 38.00 - 62.00 - - - Green peppers 8 787.74 83.33 0.64 14.73 - - 1.31 Red peppers 2 037.23 59.44 - 37.50 - - 3.06 Swiss chard - - - - - - - Root Crops 1 494 209.24 77.69 13.76 4.80 0.36 2.84 0.55 Beetroot 3 164.22 52.50 - 47.50 - - - Carrot 1 011.31 100.00 - - - - - Onion 1 512.86 58.33 10.00 31.67 - - - Potatoes 65 051.20 49.06 40.22 9.35 0.72 0.65 - Garlic 881.55 13.33 23.33 63.33 - - - Taro / ‘Godere’ 632 192.87 71.51 22.44 4.93 0.46 0.13 0.53 Sweet potatoes 790 395.23 90.30 0.42 2.36 0.20 6.03 0.70 Permanent crops 1 494 682.57 54.84 0.96 39.48 0.39 3.00 1.32 Avocados 123 381.01 56.84 0.71 41.06 0.28 0.52 0.58 Bananas 239 507.15 38.28 0.75 59.97 0.09 0.32 0.60 Guavas 1 030.06 82.75 - 10.75 - - 6.50 Lemons 2 266.28 34.50 - 57.25 4.50 - 3.75 Mangoes 123 396.71 53.85 0.65 42.99 0.45 - 2.06 Oranges 8 317.92 63.55 - 30.81 1.45 - 4.19 Papayas 24 945.61 81.83 - 15.37 0.12 - 2.68 Pineapples 89.33 20.00 - 80.00 - - - Chat 1 241.03 - - 100.00 - - - Coffee 58 672.83 49.07 0.39 49.32 0.32 0.01 0.89 Hops (Gesho) 664.75 27.27 9.09 63.64 - - - Enset 100 418.67 89.75 2.50 3.56 0.50 2.05 1.64 Sugar cane 810 751.21 37.71 1.71 25.88 0.50 32.42 1.79
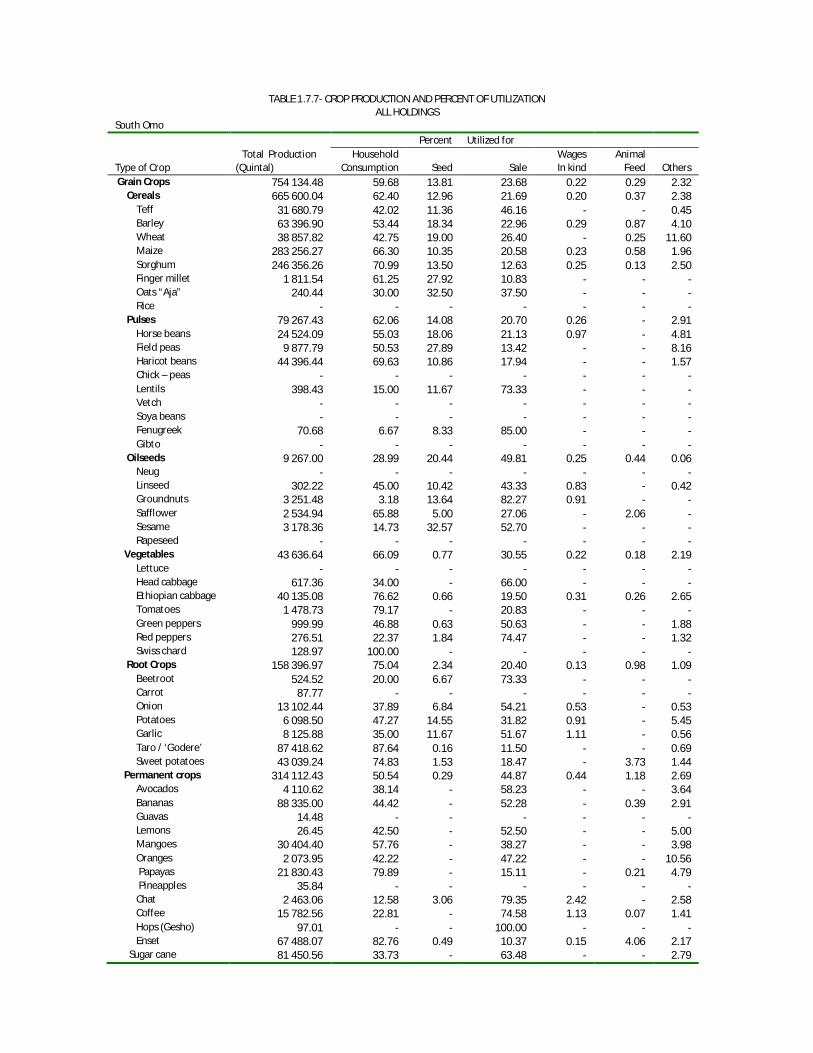
TABLE 1.7.7- CROP PRODUCTION AND PERCENT OF UTILIZATION ALL HOLDINGS
South Omo Percent Utilized for Total Production Household Wages Animal Type of Crop (Quintal) Consumption Seed Sale In kind Feed Others Grain Crops 754 134.48 59.68 13.81 23.68 0.22 0.29 2.32 Cereals 665 600.04 62.40 12.96 21.69 0.20 0.37 2.38 Teff 31 680.79 42.02 11.36 46.16 - - 0.45 Barley 63 396.90 53.44 18.34 22.96 0.29 0.87 4.10 Wheat 38 857.82 42.75 19.00 26.40 - 0.25 11.60 Maize 283 256.27 66.30 10.35 20.58 0.23 0.58 1.96 Sorghum 246 356.26 70.99 13.50 12.63 0.25 0.13 2.50 Finger millet 1 811.54 61.25 27.92 10.83 - - - Oats “Aja” 240.44 30.00 32.50 37.50 - - - Rice - - - - - - - Pulses 79 267.43 62.06 14.08 20.70 0.26 - 2.91 Horse beans 24 524.09 55.03 18.06 21.13 0.97 - 4.81 Field peas 9 877.79 50.53 27.89 13.42 - - 8.16 Haricot beans 44 396.44 69.63 10.86 17.94 - - 1.57 Chick – peas - - - - - - - Lentils 398.43 15.00 11.67 73.33 - - - Vetch - - - - - - - Soya beans - - - - - - - Fenugreek 70.68 6.67 8.33 85.00 - - - Gibto - - - - - - - Oilseeds 9 267.00 28.99 20.44 49.81 0.25 0.44 0.06 Neug - - - - - - - Linseed 302.22 45.00 10.42 43.33 0.83 - 0.42 Groundnuts 3 251.48 3.18 13.64 82.27 0.91 - - Safflower 2 534.94 65.88 5.00 27.06 - 2.06 - Sesame 3 178.36 14.73 32.57 52.70 - - - Rapeseed - - - - - - - Vegetables 43 636.64 66.09 0.77 30.55 0.22 0.18 2.19 Lettuce - - - - - - - Head cabbage 617.36 34.00 - 66.00 - - - Ethiopian cabbage 40 135.08 76.62 0.66 19.50 0.31 0.26 2.65 Tomatoes 1 478.73 79.17 - 20.83 - - - Green peppers 999.99 46.88 0.63 50.63 - - 1.88 Red peppers 276.51 22.37 1.84 74.47 - - 1.32 Swiss chard 128.97 100.00 - - - - - Root Crops 158 396.97 75.04 2.34 20.40 0.13 0.98 1.09 Beetroot 524.52 20.00 6.67 73.33 - - - Carrot 87.77 - - - - - - Onion 13 102.44 37.89 6.84 54.21 0.53 - 0.53 Potatoes 6 098.50 47.27 14.55 31.82 0.91 - 5.45 Garlic 8 125.88 35.00 11.67 51.67 1.11 - 0.56 Taro / ‘Godere’ 87 418.62 87.64 0.16 11.50 - - 0.69 Sweet potatoes 43 039.24 74.83 1.53 18.47 - 3.73 1.44 Permanent crops 314 112.43 50.54 0.29 44.87 0.44 1.18 2.69 Avocados 4 110.62 38.14 - 58.23 - - 3.64 Bananas 88 335.00 44.42 - 52.28 - 0.39 2.91 Guavas 14.48 - - - - - - Lemons 26.45 42.50 - 52.50 - - 5.00 Mangoes 30 404.40 57.76 - 38.27 - - 3.98 Oranges 2 073.95 42.22 - 47.22 - - 10.56 Papayas 21 830.43 79.89 - 15.11 - 0.21 4.79 Pineapples 35.84 - - - - - - Chat 2 463.06 12.58 3.06 79.35 2.42 - 2.58 Coffee 15 782.56 22.81 - 74.58 1.13 0.07 1.41 Hops (Gesho) 97.01 - - 100.00 - - - Enset 67 488.07 82.76 0.49 10.37 0.15 4.06 2.17 Sugar cane 81 450.56 33.73 - 63.48 - - 2.79
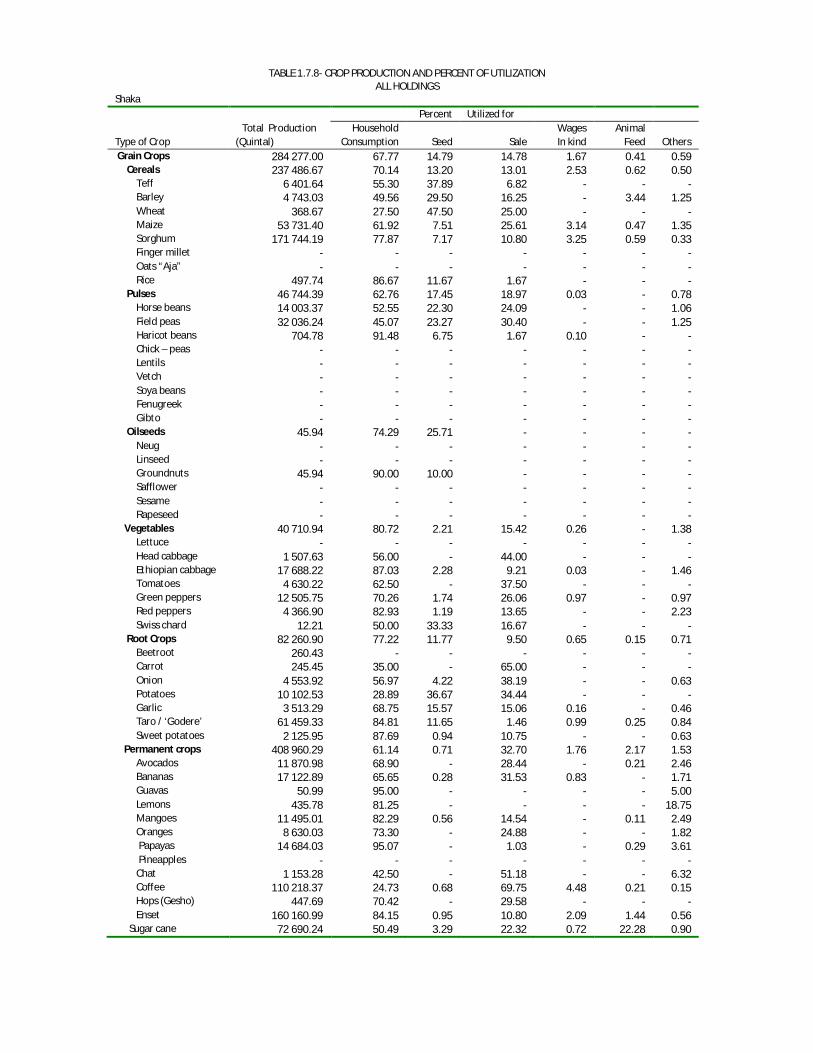
TABLE 1.7.8- CROP PRODUCTION AND PERCENT OF UTILIZATION ALL HOLDINGS
Shaka Percent Utilized for Total Production Household Wages Animal Type of Crop (Quintal) Consumption Seed Sale In kind Feed Others Grain Crops 284 277.00 67.77 14.79 14.78 1.67 0.41 0.59 Cereals 237 486.67 70.14 13.20 13.01 2.53 0.62 0.50 Teff 6 401.64 55.30 37.89 6.82 - - - Barley 4 743.03 49.56 29.50 16.25 - 3.44 1.25 Wheat 368.67 27.50 47.50 25.00 - - - Maize 53 731.40 61.92 7.51 25.61 3.14 0.47 1.35 Sorghum 171 744.19 77.87 7.17 10.80 3.25 0.59 0.33 Finger millet - - - - - - - Oats “Aja” - - - - - - - Rice 497.74 86.67 11.67 1.67 - - - Pulses 46 744.39 62.76 17.45 18.97 0.03 - 0.78 Horse beans 14 003.37 52.55 22.30 24.09 - - 1.06 Field peas 32 036.24 45.07 23.27 30.40 - - 1.25 Haricot beans 704.78 91.48 6.75 1.67 0.10 - - Chick – peas - - - - - - - Lentils - - - - - - - Vetch - - - - - - - Soya beans - - - - - - - Fenugreek - - - - - - - Gibto - - - - - - - Oilseeds 45.94 74.29 25.71 - - - - Neug - - - - - - - Linseed - - - - - - - Groundnuts 45.94 90.00 10.00 - - - - Safflower - - - - - - - Sesame - - - - - - - Rapeseed - - - - - - - Vegetables 40 710.94 80.72 2.21 15.42 0.26 - 1.38 Lettuce - - - - - - - Head cabbage 1 507.63 56.00 - 44.00 - - - Ethiopian cabbage 17 688.22 87.03 2.28 9.21 0.03 - 1.46 Tomatoes 4 630.22 62.50 - 37.50 - - - Green peppers 12 505.75 70.26 1.74 26.06 0.97 - 0.97 Red peppers 4 366.90 82.93 1.19 13.65 - - 2.23 Swiss chard 12.21 50.00 33.33 16.67 - - - Root Crops 82 260.90 77.22 11.77 9.50 0.65 0.15 0.71 Beetroot 260.43 - - - - - - Carrot 245.45 35.00 - 65.00 - - - Onion 4 553.92 56.97 4.22 38.19 - - 0.63 Potatoes 10 102.53 28.89 36.67 34.44 - - - Garlic 3 513.29 68.75 15.57 15.06 0.16 - 0.46 Taro / ‘Godere’ 61 459.33 84.81 11.65 1.46 0.99 0.25 0.84 Sweet potatoes 2 125.95 87.69 0.94 10.75 - - 0.63 Permanent crops 408 960.29 61.14 0.71 32.70 1.76 2.17 1.53 Avocados 11 870.98 68.90 - 28.44 - 0.21 2.46 Bananas 17 122.89 65.65 0.28 31.53 0.83 - 1.71 Guavas 50.99 95.00 - - - - 5.00 Lemons 435.78 81.25 - - - - 18.75 Mangoes 11 495.01 82.29 0.56 14.54 - 0.11 2.49 Oranges 8 630.03 73.30 - 24.88 - - 1.82 Papayas 14 684.03 95.07 - 1.03 - 0.29 3.61 Pineapples - - - - - - - Chat 1 153.28 42.50 - 51.18 - - 6.32 Coffee 110 218.37 24.73 0.68 69.75 4.48 0.21 0.15 Hops (Gesho) 447.69 70.42 - 29.58 - - - Enset 160 160.99 84.15 0.95 10.80 2.09 1.44 0.56 Sugar cane 72 690.24 50.49 3.29 22.32 0.72 22.28 0.90
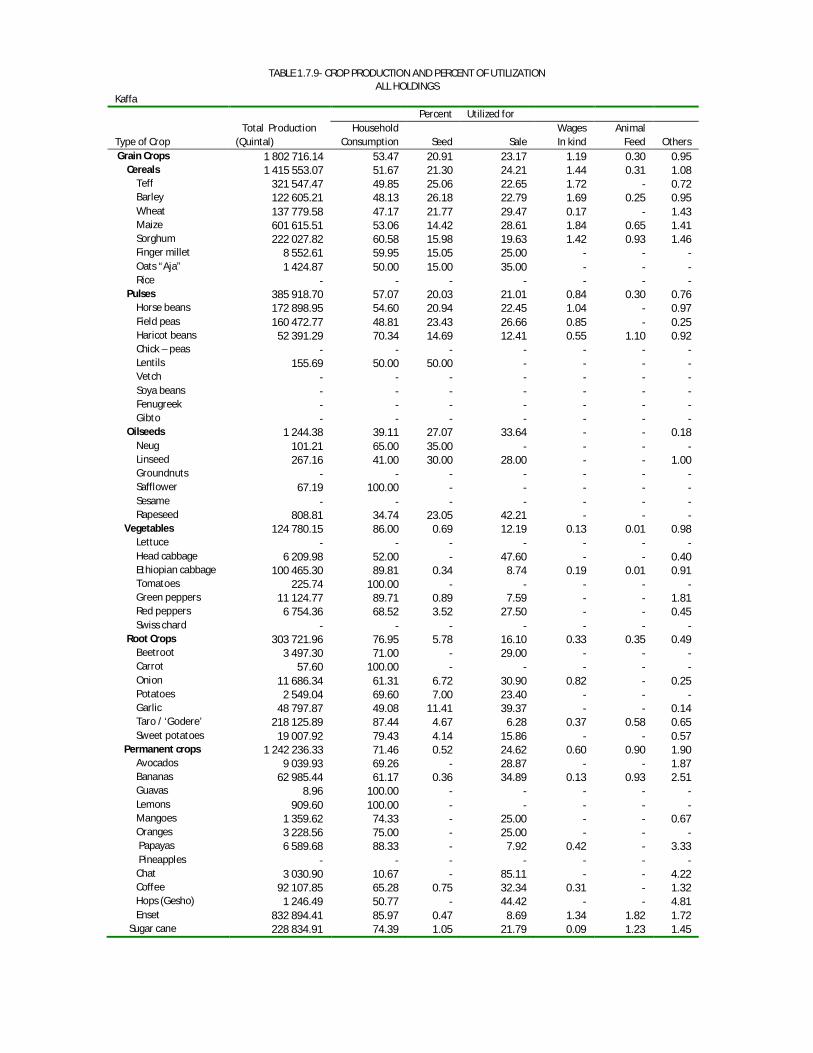
TABLE 1.7.9- CROP PRODUCTION AND PERCENT OF UTILIZATION ALL HOLDINGS
Kaffa Percent Utilized for Total Production Household Wages Animal Type of Crop (Quintal) Consumption Seed Sale In kind Feed Others Grain Crops 1 802 716.14 53.47 20.91 23.17 1.19 0.30 0.95 Cereals 1 415 553.07 51.67 21.30 24.21 1.44 0.31 1.08 Teff 321 547.47 49.85 25.06 22.65 1.72 - 0.72 Barley 122 605.21 48.13 26.18 22.79 1.69 0.25 0.95 Wheat 137 779.58 47.17 21.77 29.47 0.17 - 1.43 Maize 601 615.51 53.06 14.42 28.61 1.84 0.65 1.41 Sorghum 222 027.82 60.58 15.98 19.63 1.42 0.93 1.46 Finger millet 8 552.61 59.95 15.05 25.00 - - - Oats “Aja” 1 424.87 50.00 15.00 35.00 - - - Rice - - - - - - - Pulses 385 918.70 57.07 20.03 21.01 0.84 0.30 0.76 Horse beans 172 898.95 54.60 20.94 22.45 1.04 - 0.97 Field peas 160 472.77 48.81 23.43 26.66 0.85 - 0.25 Haricot beans 52 391.29 70.34 14.69 12.41 0.55 1.10 0.92 Chick – peas - - - - - - - Lentils 155.69 50.00 50.00 - - - - Vetch - - - - - - - Soya beans - - - - - - - Fenugreek - - - - - - - Gibto - - - - - - - Oilseeds 1 244.38 39.11 27.07 33.64 - - 0.18 Neug 101.21 65.00 35.00 - - - - Linseed 267.16 41.00 30.00 28.00 - - 1.00 Groundnuts - - - - - - - Safflower 67.19 100.00 - - - - - Sesame - - - - - - - Rapeseed 808.81 34.74 23.05 42.21 - - - Vegetables 124 780.15 86.00 0.69 12.19 0.13 0.01 0.98 Lettuce - - - - - - - Head cabbage 6 209.98 52.00 - 47.60 - - 0.40 Ethiopian cabbage 100 465.30 89.81 0.34 8.74 0.19 0.01 0.91 Tomatoes 225.74 100.00 - - - - - Green peppers 11 124.77 89.71 0.89 7.59 - - 1.81 Red peppers 6 754.36 68.52 3.52 27.50 - - 0.45 Swiss chard - - - - - - - Root Crops 303 721.96 76.95 5.78 16.10 0.33 0.35 0.49 Beetroot 3 497.30 71.00 - 29.00 - - - Carrot 57.60 100.00 - - - - - Onion 11 686.34 61.31 6.72 30.90 0.82 - 0.25 Potatoes 2 549.04 69.60 7.00 23.40 - - - Garlic 48 797.87 49.08 11.41 39.37 - - 0.14 Taro / ‘Godere’ 218 125.89 87.44 4.67 6.28 0.37 0.58 0.65 Sweet potatoes 19 007.92 79.43 4.14 15.86 - - 0.57 Permanent crops 1 242 236.33 71.46 0.52 24.62 0.60 0.90 1.90 Avocados 9 039.93 69.26 - 28.87 - - 1.87 Bananas 62 985.44 61.17 0.36 34.89 0.13 0.93 2.51 Guavas 8.96 100.00 - - - - - Lemons 909.60 100.00 - - - - - Mangoes 1 359.62 74.33 - 25.00 - - 0.67 Oranges 3 228.56 75.00 - 25.00 - - - Papayas 6 589.68 88.33 - 7.92 0.42 - 3.33 Pineapples - - - - - - - Chat 3 030.90 10.67 - 85.11 - - 4.22 Coffee 92 107.85 65.28 0.75 32.34 0.31 - 1.32 Hops (Gesho) 1 246.49 50.77 - 44.42 - - 4.81 Enset 832 894.41 85.97 0.47 8.69 1.34 1.82 1.72 Sugar cane 228 834.91 74.39 1.05 21.79 0.09 1.23 1.45

TABLE 1.7.10- CROP PRODUCTION AND PERCENT OF UTILIZATION
ALL HOLDINGS Gamo Gofa Percent Utilized for Total Production Household Wages Animal Type of Crop (Quintal) Consumption Seed Sale In kind Feed Others Grain Crops 2 177 017.92 63.51 16.26 16.56 0.57 0.66 2.43 Cereals 1 982 169.23 62.66 15.71 17.01 0.75 0.85 3.02 Teff 563 146.45 40.86 15.38 38.25 1.02 0.10 4.38 Barley 168 375.80 70.04 19.96 8.23 0.14 0.30 1.33 Wheat 108 740.69 66.13 20.90 11.77 0.13 0.04 1.03 Maize 959 295.66 67.56 12.20 12.68 1.25 1.82 4.48 Sorghum 179 763.38 76.73 10.21 7.65 0.93 2.12 2.35 Finger millet 2 836.63 67.50 7.50 25.00 - - - Oats “Aja” 10.62 - - - - - - Rice - - - - - - - Pulses 188 349.13 67.52 16.43 14.20 0.25 0.34 1.26 Horse beans 33 046.19 69.53 17.87 11.57 - - 1.03 Field peas 17 073.67 68.09 20.34 9.66 0.11 - 1.80 Haricot beans 136 972.11 67.12 14.21 16.40 0.35 0.63 1.29 Chick – peas 1 100.16 56.00 14.00 26.00 4.00 - - Lentils - - - - - - - Vetch - - - - - - - Soya beans - - - - - - - Fenugreek 156.99 60.71 23.21 16.07 - - - Gibto - - - - - - - Oilseeds 6 499.57 36.10 28.29 33.78 - - 1.83 Neug - - - - - - - Linseed 305.73 48.75 31.00 18.25 - - 2.00 Groundnuts 2 189.02 21.11 23.33 55.56 - - - Safflower 98.89 60.00 10.00 20.00 - - 10.00 Sesame 3 905.92 23.18 29.09 45.45 - - 2.27 Rapeseed - - - - - - - Vegetables 89 433.74 78.82 2.02 16.93 0.36 0.11 1.76 Lettuce - - - - - - - Head cabbage 502.84 57.50 - 27.50 - - 15.00 Ethiopian cabbage 81 596.36 83.23 2.42 12.34 0.41 0.14 1.47 Tomatoes 687.55 28.75 - 56.25 - - 15.00 Green peppers 5 683.84 50.00 0.65 48.48 - - 0.87 Red peppers 963.15 83.50 0.50 14.00 0.50 - 1.50 Swiss chard - - - - - - - Root Crops 1 395 097.16 77.41 7.20 12.06 0.41 1.65 1.26 Beetroot 114.78 20.00 43.33 36.67 - - - Carrot 522.35 52.50 5.00 42.50 - - - Onion 33 811.89 39.58 20.58 38.08 0.83 - 0.92 Potatoes 238 444.89 74.61 16.09 7.93 0.52 - 0.85 Garlic 30 379.41 35.88 25.00 37.25 - 0.13 1.75 Taro / ‘Godere’ 303 002.17 86.54 4.81 6.16 0.19 1.20 1.11 Sweet potatoes 788 821.66 85.54 0.03 9.17 0.50 3.19 1.57 Permanent crops 1 173 685.19 53.06 1.24 41.29 0.63 1.73 2.06 Avocados 2 880.80 71.00 1.60 23.20 0.40 - 3.80 Bananas 554 905.36 36.55 1.60 59.40 0.59 - 1.86 Guavas 31.74 85.00 - - - 10.00 5.00 Lemons 4 483.00 48.59 - 45.48 1.48 - 4.44 Mangoes 105 521.01 52.28 1.40 42.20 0.92 0.16 3.04 Oranges 8 211.46 49.13 - 46.52 0.87 - 3.48 Papayas 39 761.81 85.27 - 9.78 0.99 - 3.96 Pineapples - - - - - - - Chat 3 803.90 7.83 3.33 88.33 - - 0.50 Coffee 24 844.50 34.50 1.45 62.20 0.34 0.17 1.34 Hops (Gesho) 660.90 27.11 7.37 65.00 - - 0.53 Enset 147 499.71 81.93 1.02 8.72 0.71 5.81 1.82 Sugar cane 281 080.99 33.73 - 60.77 0.77 3.24 1.48

TABLE 1.7.11- CROP PRODUCTION AND PERCENT OF UTILIZATION
ALL HOLDINGS Bench Maji Percent Utilized for Total Production Household Wages Animal Type of Crop (Quintal) Consumption Seed Sale In kind Feed Others Grain Crops 624 034.40 59.34 12.93 25.48 1.39 0.28 0.58 Cereals 563 188.28 55.50 13.80 27.91 1.74 0.40 0.65 Teff 51 902.10 43.90 18.76 36.88 0.45 - - Barley 30 196.15 38.21 18.22 41.88 1.12 - 0.56 Wheat 5 988.46 34.17 15.56 50.28 - - - Maize 204 444.48 66.47 10.27 19.17 2.55 0.48 1.06 Sorghum 246 310.40 59.65 12.73 23.93 2.04 0.86 0.78 Finger millet 3 480.68 91.25 8.75 - - - - Oats “Aja” - - - - - - - Rice 20 866.02 39.17 13.33 43.33 4.17 - - Pulses 59 970.95 66.86 10.27 21.68 0.81 - 0.39 Horse beans 25 983.27 49.94 15.20 33.13 1.11 - 0.61 Field peas 12 314.42 42.31 13.95 41.16 2.24 - 0.34 Haricot beans 21 607.44 82.60 6.65 10.23 0.22 - 0.30 Chick – peas - - - - - - - Lentils - - - - - - - Vetch - - - - - - - Soya beans 65.82 100.00 - - - - - Fenugreek - - - - - - - Gibto - - - - - - - Oilseeds 875.16 51.00 36.33 9.33 - 1.67 1.67 Neug - - - - - - - Linseed 20.74 97.50 2.50 - - - - Groundnuts - - - - - - - Safflower 327.21 31.25 68.75 - - - - Sesame 287.14 33.33 43.33 23.33 - - - Rapeseed 240.08 50.00 - - - 25.00 25.00 Vegetables 117 904.17 80.23 0.87 16.80 0.09 - 2.01 Lettuce - - - - - - - Head cabbage 3 777.22 48.15 - 51.35 - - 0.50 Ethiopian cabbage 49 826.72 84.08 1.05 12.63 0.04 - 2.20 Tomatoes 2 408.84 47.83 - 52.17 - - - Green peppers 5 644.28 83.21 0.24 14.12 - - 2.43 Red peppers 56 149.69 71.05 0.79 26.18 0.66 - 1.32 Swiss chard 97.42 - - - - - - Root Crops 316 843.57 78.99 8.63 10.98 0.06 0.02 1.32 Beetroot 2.05 - - - - - - Carrot 51.49 20.00 - 70.00 - - 10.00 Onion 13 128.31 49.63 1.85 46.41 - - 2.11 Potatoes 2 439.54 78.18 2.27 19.55 - - - Garlic 668.39 67.73 8.18 23.18 - - 0.91 Taro / ‘Godere’ 294 347.40 82.94 10.27 5.31 0.07 0.03 1.38 Sweet potatoes 6 206.40 68.51 0.54 30.54 - - 0.41 Permanent crops 524 090.20 50.75 0.70 46.66 0.15 0.07 1.67 Avocados 9 735.68 46.15 - 50.85 - - 3.00 Bananas 86 541.86 51.52 0.63 45.76 0.05 0.05 2.00 Guavas 38.10 83.33 - 12.33 - - 4.33 Lemons 104.24 51.67 - 31.67 - - 16.67 Mangoes 19 490.44 58.49 0.11 38.23 - - 3.16 Oranges 13 020.05 56.82 0.51 40.31 - - 2.36 Papayas 15 304.54 88.33 - 8.65 - - 3.02 Pineapples 67.10 97.22 - 1.67 - - 1.11 Chat 5 270.03 12.47 - 87.46 - - 0.07 Coffee 109 468.52 25.65 0.62 72.75 0.32 - 0.67 Hops (Gesho) 1 246.20 27.03 3.13 68.91 - - 0.94 Enset 52 064.20 85.01 0.93 12.21 0.36 0.10 1.39 Sugar cane 211 739.23 62.11 1.45 33.33 - 0.59 2.52
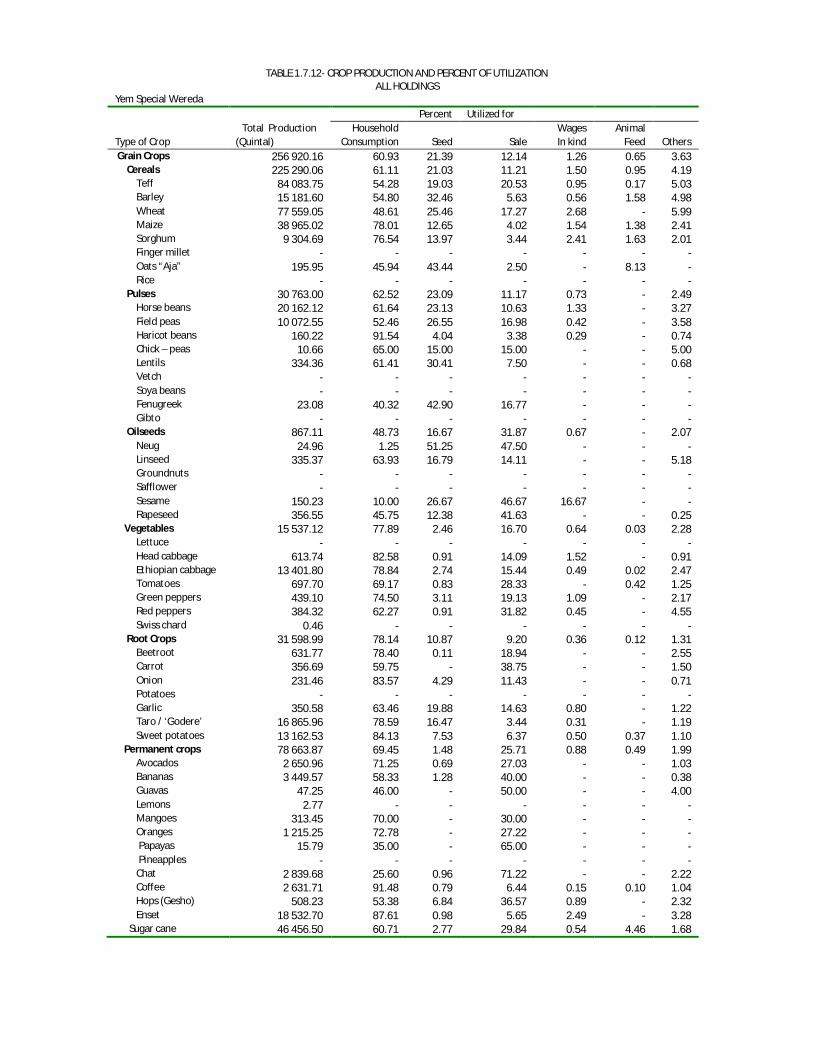
TABLE 1.7.12- CROP PRODUCTION AND PERCENT OF UTILIZATION ALL HOLDINGS
Yem Special Wereda Percent Utilized for Total Production Household Wages Animal Type of Crop (Quintal) Consumption Seed Sale In kind Feed Others Grain Crops 256 920.16 60.93 21.39 12.14 1.26 0.65 3.63 Cereals 225 290.06 61.11 21.03 11.21 1.50 0.95 4.19 Teff 84 083.75 54.28 19.03 20.53 0.95 0.17 5.03 Barley 15 181.60 54.80 32.46 5.63 0.56 1.58 4.98 Wheat 77 559.05 48.61 25.46 17.27 2.68 - 5.99 Maize 38 965.02 78.01 12.65 4.02 1.54 1.38 2.41 Sorghum 9 304.69 76.54 13.97 3.44 2.41 1.63 2.01 Finger millet - - - - - - - Oats “Aja” 195.95 45.94 43.44 2.50 - 8.13 - Rice - - - - - - - Pulses 30 763.00 62.52 23.09 11.17 0.73 - 2.49 Horse beans 20 162.12 61.64 23.13 10.63 1.33 - 3.27 Field peas 10 072.55 52.46 26.55 16.98 0.42 - 3.58 Haricot beans 160.22 91.54 4.04 3.38 0.29 - 0.74 Chick – peas 10.66 65.00 15.00 15.00 - - 5.00 Lentils 334.36 61.41 30.41 7.50 - - 0.68 Vetch - - - - - - - Soya beans - - - - - - - Fenugreek 23.08 40.32 42.90 16.77 - - - Gibto - - - - - - - Oilseeds 867.11 48.73 16.67 31.87 0.67 - 2.07 Neug 24.96 1.25 51.25 47.50 - - - Linseed 335.37 63.93 16.79 14.11 - - 5.18 Groundnuts - - - - - - - Safflower - - - - - - - Sesame 150.23 10.00 26.67 46.67 16.67 - - Rapeseed 356.55 45.75 12.38 41.63 - - 0.25 Vegetables 15 537.12 77.89 2.46 16.70 0.64 0.03 2.28 Lettuce - - - - - - - Head cabbage 613.74 82.58 0.91 14.09 1.52 - 0.91 Ethiopian cabbage 13 401.80 78.84 2.74 15.44 0.49 0.02 2.47 Tomatoes 697.70 69.17 0.83 28.33 - 0.42 1.25 Green peppers 439.10 74.50 3.11 19.13 1.09 - 2.17 Red peppers 384.32 62.27 0.91 31.82 0.45 - 4.55 Swiss chard 0.46 - - - - - - Root Crops 31 598.99 78.14 10.87 9.20 0.36 0.12 1.31 Beetroot 631.77 78.40 0.11 18.94 - - 2.55 Carrot 356.69 59.75 - 38.75 - - 1.50 Onion 231.46 83.57 4.29 11.43 - - 0.71 Potatoes - - - - - - - Garlic 350.58 63.46 19.88 14.63 0.80 - 1.22 Taro / ‘Godere’ 16 865.96 78.59 16.47 3.44 0.31 - 1.19 Sweet potatoes 13 162.53 84.13 7.53 6.37 0.50 0.37 1.10 Permanent crops 78 663.87 69.45 1.48 25.71 0.88 0.49 1.99 Avocados 2 650.96 71.25 0.69 27.03 - - 1.03 Bananas 3 449.57 58.33 1.28 40.00 - - 0.38 Guavas 47.25 46.00 - 50.00 - - 4.00 Lemons 2.77 - - - - - - Mangoes 313.45 70.00 - 30.00 - - - Oranges 1 215.25 72.78 - 27.22 - - - Papayas 15.79 35.00 - 65.00 - - - Pineapples - - - - - - - Chat 2 839.68 25.60 0.96 71.22 - - 2.22 Coffee 2 631.71 91.48 0.79 6.44 0.15 0.10 1.04 Hops (Gesho) 508.23 53.38 6.84 36.57 0.89 - 2.32 Enset 18 532.70 87.61 0.98 5.65 2.49 - 3.28 Sugar cane 46 456.50 60.71 2.77 29.84 0.54 4.46 1.68

TABLE 1.7.13- CROP PRODUCTION AND PERCENT OF UTILIZATION ALL HOLDINGS
Amaro Special Wereda Percent Utilized for Total Production Household Wages Animal Type of Crop (Quintal) Consumption Seed Sale In kind Feed Others Grain Crops 100 356.50 56.77 12.34 28.06 0.36 0.07 2.40 Cereals 76 532.14 56.76 12.18 27.64 0.41 0.10 2.90 Teff 36 628.69 48.01 12.97 36.30 0.11 - 2.61 Barley 11 803.68 51.68 14.32 30.12 0.88 0.28 2.72 Wheat 4 510.15 44.50 11.00 41.33 0.33 - 2.83 Maize 23 084.34 72.24 9.82 14.04 0.33 0.07 3.49 Sorghum 505.28 78.00 8.00 14.00 - - - Finger millet - - - - - - - Oats “Aja” - - - - - - - Rice - - - - - - - Pulses 23 824.36 56.65 12.60 28.87 0.29 0.02 1.58 Horse beans 1 327.86 51.70 16.42 30.38 0.75 - 0.75 Field peas 2 282.84 42.95 12.86 42.05 0.63 0.09 1.43 Haricot beans 19 394.76 65.31 11.67 20.94 0.03 - 2.05 Chick – peas 450.62 71.25 11.25 16.25 - - 1.25 Lentils 368.28 38.06 8.61 52.50 - - 0.83 Vetch - - - - - - - Soya beans - - - - - - - Fenugreek - - - - - - - Gibto - - - - - - - Oilseeds - - - - - - - Neug - - - - - - - Linseed - - - - - - - Groundnuts - - - - - - - Safflower - - - - - - - Sesame - - - - - - - Rapeseed - - - - - - - Vegetables 34 106.03 73.46 0.13 22.83 0.38 - 3.21 Lettuce - - - - - - - Head cabbage 10.58 90.00 - 10.00 - - - Ethiopian cabbage 33 454.43 71.82 0.14 24.19 0.41 - 3.45 Tomatoes 528.09 95.56 - 4.44 - - - Green peppers 103.82 100.00 - - - - - Red peppers - - - - - - - Swiss chard 9.11 - - - - - - Root Crops 19 304.87 74.29 0.12 23.06 0.06 0.59 1.88 Beetroot - - - - - - - Carrot - - - - - - - Onion 15.35 - - - - - - Potatoes - - - - - - - Garlic 116.02 42.50 5.00 50.00 - - 2.50 Taro / ‘Godere’ 1 000.20 86.67 - 9.44 - 2.78 1.11 Sweet potatoes 18 173.29 71.85 - 26.00 0.08 - 2.08 Permanent crops 319 227.19 48.43 0.01 45.45 0.73 1.13 4.24 Avocados 16 121.78 44.18 - 50.88 - - 4.94 Bananas 30 788.60 44.44 - 50.71 - 0.34 4.51 Guavas 104.13 55.00 - 37.27 - - 7.73 Lemons 3 330.54 8.89 - 85.83 - - 5.28 Mangoes 8 037.99 39.39 - 54.15 - - 6.46 Oranges 2 604.85 40.77 - 52.31 - - 6.92 Papayas 7 921.29 68.09 - 28.09 - - 3.82 Pineapples - - - - - - - Chat 795.90 6.59 - 84.09 - 8.41 0.91 Coffee 23 762.57 28.68 - 66.09 0.89 - 4.34 Hops (Gesho) - - - - - - - Enset 83 871.09 73.47 0.04 19.70 1.71 1.83 3.26 Sugar cane 141 888.46 41.51 - 49.11 - 4.25 5.14
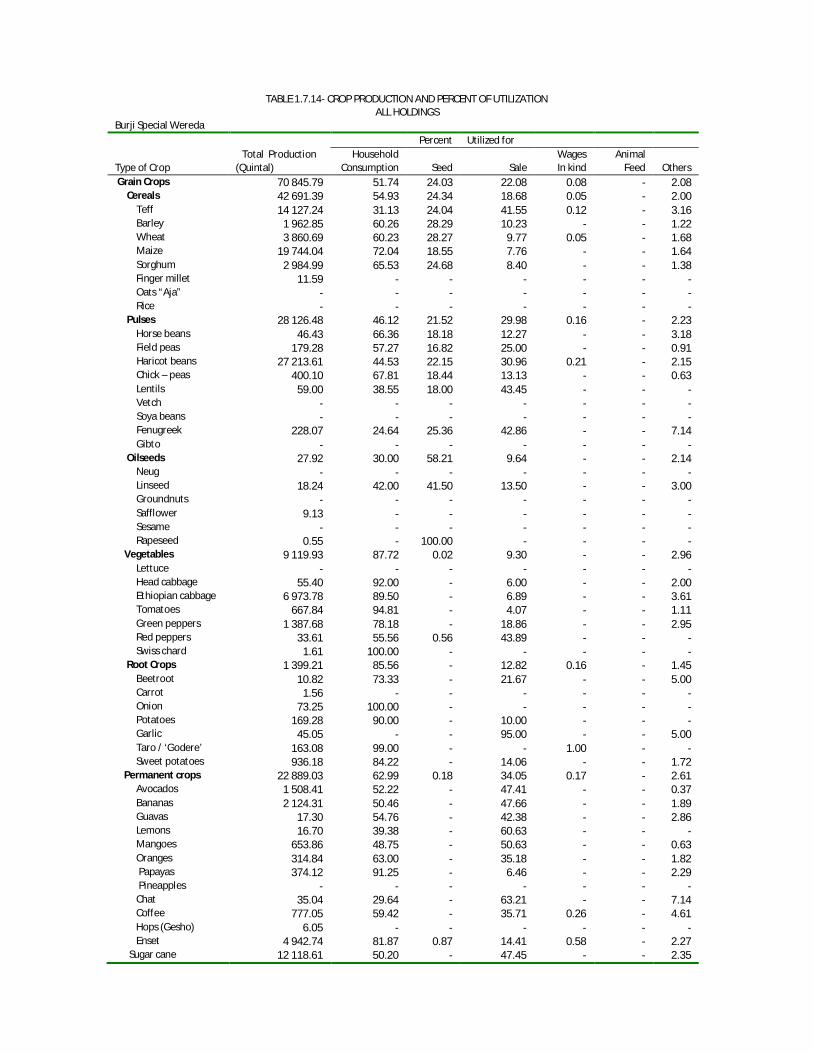
TABLE 1.7.14- CROP PRODUCTION AND PERCENT OF UTILIZATION ALL HOLDINGS
Burji Special Wereda Percent Utilized for Total Production Household Wages Animal Type of Crop (Quintal) Consumption Seed Sale In kind Feed Others Grain Crops 70 845.79 51.74 24.03 22.08 0.08 - 2.08 Cereals 42 691.39 54.93 24.34 18.68 0.05 - 2.00 Teff 14 127.24 31.13 24.04 41.55 0.12 - 3.16 Barley 1 962.85 60.26 28.29 10.23 - - 1.22 Wheat 3 860.69 60.23 28.27 9.77 0.05 - 1.68 Maize 19 744.04 72.04 18.55 7.76 - - 1.64 Sorghum 2 984.99 65.53 24.68 8.40 - - 1.38 Finger millet 11.59 - - - - - - Oats “Aja” - - - - - - - Rice - - - - - - - Pulses 28 126.48 46.12 21.52 29.98 0.16 - 2.23 Horse beans 46.43 66.36 18.18 12.27 - - 3.18 Field peas 179.28 57.27 16.82 25.00 - - 0.91 Haricot beans 27 213.61 44.53 22.15 30.96 0.21 - 2.15 Chick – peas 400.10 67.81 18.44 13.13 - - 0.63 Lentils 59.00 38.55 18.00 43.45 - - - Vetch - - - - - - - Soya beans - - - - - - - Fenugreek 228.07 24.64 25.36 42.86 - - 7.14 Gibto - - - - - - - Oilseeds 27.92 30.00 58.21 9.64 - - 2.14 Neug - - - - - - - Linseed 18.24 42.00 41.50 13.50 - - 3.00 Groundnuts - - - - - - - Safflower 9.13 - - - - - - Sesame - - - - - - - Rapeseed 0.55 - 100.00 - - - - Vegetables 9 119.93 87.72 0.02 9.30 - - 2.96 Lettuce - - - - - - - Head cabbage 55.40 92.00 - 6.00 - - 2.00 Ethiopian cabbage 6 973.78 89.50 - 6.89 - - 3.61 Tomatoes 667.84 94.81 - 4.07 - - 1.11 Green peppers 1 387.68 78.18 - 18.86 - - 2.95 Red peppers 33.61 55.56 0.56 43.89 - - - Swiss chard 1.61 100.00 - - - - - Root Crops 1 399.21 85.56 - 12.82 0.16 - 1.45 Beetroot 10.82 73.33 - 21.67 - - 5.00 Carrot 1.56 - - - - - - Onion 73.25 100.00 - - - - - Potatoes 169.28 90.00 - 10.00 - - - Garlic 45.05 - - 95.00 - - 5.00 Taro / ‘Godere’ 163.08 99.00 - - 1.00 - - Sweet potatoes 936.18 84.22 - 14.06 - - 1.72 Permanent crops 22 889.03 62.99 0.18 34.05 0.17 - 2.61 Avocados 1 508.41 52.22 - 47.41 - - 0.37 Bananas 2 124.31 50.46 - 47.66 - - 1.89 Guavas 17.30 54.76 - 42.38 - - 2.86 Lemons 16.70 39.38 - 60.63 - - - Mangoes 653.86 48.75 - 50.63 - - 0.63 Oranges 314.84 63.00 - 35.18 - - 1.82 Papayas 374.12 91.25 - 6.46 - - 2.29 Pineapples - - - - - - - Chat 35.04 29.64 - 63.21 - - 7.14 Coffee 777.05 59.42 - 35.71 0.26 - 4.61 Hops (Gesho) 6.05 - - - - - - Enset 4 942.74 81.87 0.87 14.41 0.58 - 2.27 Sugar cane 12 118.61 50.20 - 47.45 - - 2.35

TABLE 1.7.15- CROP PRODUCTION AND PERCENT OF UTILIZATION
ALL HOLDINGS Konso Special Wereda Percent Utilized for Total Production Household Wages Animal Type of Crop (Quintal) Consumption Seed Sale In kind Feed Others Grain Crops 347 607.99 61.89 16.14 20.74 0.22 0.14 0.86 Cereals 326 008.24 60.18 16.25 22.16 0.27 0.18 0.95 Teff 67 111.49 15.54 17.46 65.98 - - 1.02 Barley 1 013.63 66.67 18.33 15.00 - - - Wheat 141.97 46.00 18.00 36.00 - - - Maize 162 486.48 67.35 16.76 14.79 0.03 0.05 1.01 Sorghum 95 218.75 77.30 15.26 6.28 0.22 0.02 0.93 Finger millet 35.92 5.00 - - 50.00 45.00 - Oats “Aja” - - - - - - - Rice - - - - - - - Pulses 21 323.53 69.26 15.42 15.01 0.01 - 0.30 Horse beans - - - - - - - Field peas 23.06 20.00 30.00 50.00 - - - Haricot beans 21 255.01 69.39 15.32 14.97 0.01 - 0.31 Chick – peas - - - - - - - Lentils 45.47 85.00 15.00 - - - - Vetch - - - - - - - Soya beans - - - - - - - Fenugreek - - - - - - - Gibto - - - - - - - Oilseeds 276.22 60.43 21.00 14.29 - - 4.29 Neug - - - - - - - Linseed - - - - - - - Groundnuts - - - - - - - Safflower 147.25 79.50 13.00 - - - 7.50 Sesame 128.98 35.00 31.67 33.33 - - - Rapeseed - - - - - - - Vegetables 3 783.66 51.43 - 37.14 7.14 - 4.29 Lettuce - - - - - - - Head cabbage 162.97 - - - - - - Ethiopian cabbage 2 738.77 70.00 - 30.00 - - - Tomatoes 847.24 43.33 - 33.33 16.67 - 6.67 Green peppers 10.63 20.00 - 70.00 - - 10.00 Red peppers - - - - - - - Swiss chard 24.04 - - - - - - Root Crops 3 647.15 79.63 6.30 11.85 1.11 0.74 0.37 Beetroot 290.27 - - - - - - Carrot - - - - - - - Onion 745.48 35.00 60.00 5.00 - - - Potatoes 596.51 75.71 7.14 15.71 1.43 - - Garlic 6.36 30.00 - 70.00 - - - Taro / ‘Godere’ 4.56 82.50 - 12.50 - 5.00 - Sweet potatoes 2 003.97 91.54 - 6.15 1.54 - 0.77 Permanent crops 39 310.69 35.42 1.48 59.78 0.25 0.16 2.90 Avocados 95.34 72.50 - 27.50 - - - Bananas 3 957.29 29.60 2.56 64.81 - - 3.02 Guavas 37.72 70.71 - 20.00 - - 9.29 Lemons 38.26 60.00 - 17.50 - - 22.50 Mangoes 9 750.40 44.57 - 51.74 - - 3.70 Oranges 403.34 100.00 - - - - - Papayas 3 608.04 54.86 0.29 42.00 0.29 - 2.57 Pineapples - - - - - - - Chat 2 375.73 2.32 3.57 94.11 - - - Coffee 1 855.21 30.00 1.38 65.63 0.63 - 2.38 Hops (Gesho) 21.09 73.75 1.25 25.00 - - - Enset - - - - - - - Sugar cane 17 168.27 21.00 2.00 67.50 - 4.00 5.50

TABLE 1.7.16- CROP PRODUCTION AND PERCENT OF UTILIZATION ALL HOLDINGS
Derashe Special Wereda Percent Utilized for Total Production Household Wages Animal Type of Crop (Quintal) Consumption Seed Sale In kind Feed Others Grain Crops 419 452.42 54.85 14.79 20.60 0.35 0.47 8.94 Cereals 367 760.48 53.17 14.11 22.41 0.41 0.59 9.31 Teff 23 082.27 21.51 21.93 51.49 - 0.34 4.73 Barley 9 735.95 53.75 16.42 23.56 0.80 1.08 4.40 Wheat 6 510.00 46.18 19.22 30.88 0.88 0.69 2.16 Maize 180 195.12 61.27 11.30 15.36 0.49 0.62 10.97 Sorghum 148 237.14 60.34 10.79 13.61 0.13 0.36 14.77 Finger millet - - - - - - - Oats “Aja” - - - - - - - Rice - - - - - - - Pulses 51 015.02 59.81 16.90 15.75 0.20 0.11 7.23 Horse beans 804.19 43.48 19.57 31.52 1.30 0.87 3.26 Field peas 1 217.57 50.19 20.63 26.88 0.31 - 2.00 Haricot beans 48 327.50 63.90 16.84 9.76 - - 9.50 Chick – peas 531.28 52.50 9.38 38.13 - - - Lentils 133.34 20.00 10.00 70.00 - - - Vetch - - - - - - - Soya beans 1.14 91.00 9.00 - - - - Fenugreek - - - - - - - Gibto - - - - - - - Oilseeds 676.92 58.75 14.92 8.75 - 0.17 17.42 Neug - - - - - - - Linseed 505.53 20.00 28.33 33.33 - - 18.33 Groundnuts - - - - - - - Safflower 164.18 17.50 2.00 2.50 - 1.00 77.00 Sesame 5.09 95.00 5.00 - - - - Rapeseed 2.11 84.00 16.00 - - - - Vegetables 12 999.07 82.40 0.35 14.51 0.39 0.09 2.25 Lettuce - - - - - - - Head cabbage - - - - - - - Ethiopian cabbage 11 728.22 85.80 0.16 11.23 0.48 0.11 2.23 Tomatoes 272.33 100.00 - - - - - Green peppers 900.49 51.15 0.38 46.92 - - 1.54 Red peppers 95.50 83.33 6.67 - - - 10.00 Swiss chard 2.53 100.00 - - - - - Root Crops 10 548.54 63.25 8.80 16.20 0.25 0.12 11.38 Beetroot 29.84 - - - - - - Carrot - - - - - - - Onion 2 717.90 23.65 21.90 43.60 - - 10.85 Potatoes 943.52 71.00 9.00 20.00 - - - Garlic 68.94 40.00 5.00 55.00 - - - Taro / ‘Godere’ 3 784.29 81.18 5.79 0.92 0.53 - 11.58 Sweet potatoes 3 004.05 70.63 - 12.19 - 0.63 16.56 Permanent crops 15 060.75 42.33 0.64 48.77 1.04 0.67 6.55 Avocados 48.52 40.00 - 60.00 - - - Bananas 876.75 26.65 - 69.26 - - 4.10 Guavas 9.85 66.50 - - - - 33.50 Lemons 37.83 87.50 - - - - 12.50 Mangoes 200.00 17.50 - 49.17 - - 33.33 Oranges 204.77 40.00 - 50.00 - - 10.00 Papayas 290.28 83.46 - 11.92 - - 4.62 Pineapples - - - - - - - Chat 1 915.86 - 4.17 93.54 - - 2.29 Coffee 1 613.41 20.65 0.28 75.77 - 0.35 2.94 Hops (Gesho) 78.51 65.45 - 32.27 - - 2.27 Enset 6 354.18 73.80 0.56 13.16 3.48 1.13 7.88 Sugar cane 3 430.80 27.48 0.22 55.74 - 2.83 13.74
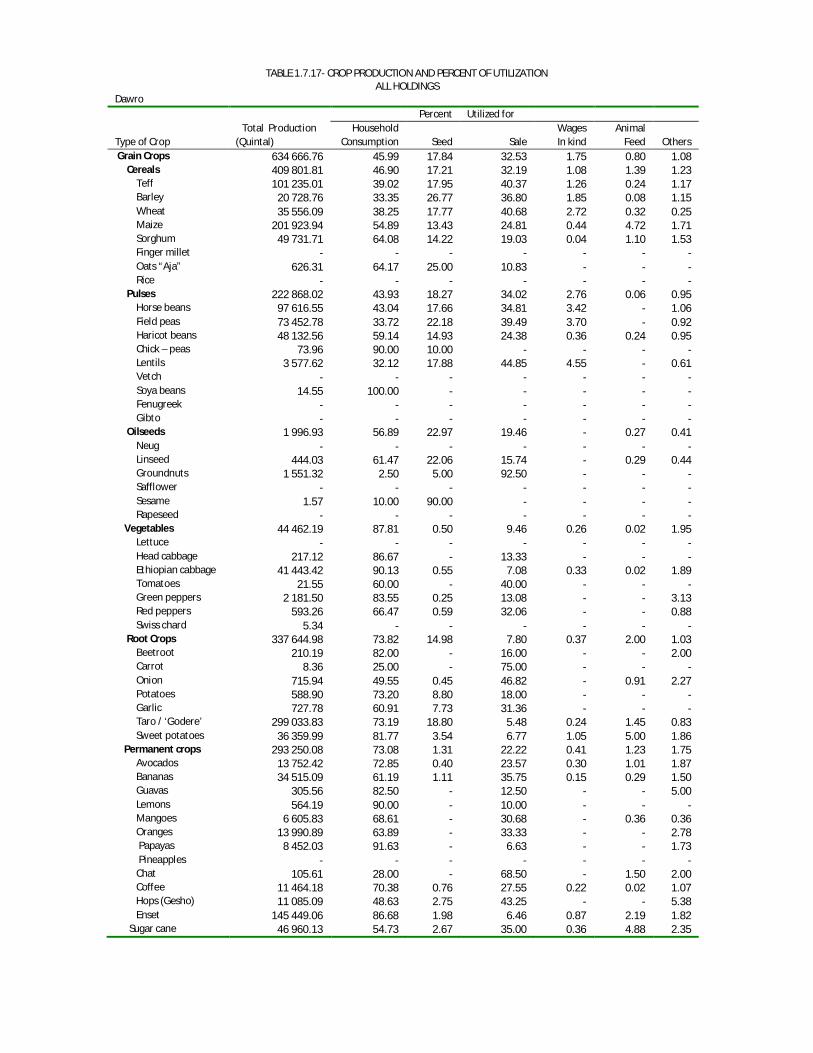
TABLE 1.7.17- CROP PRODUCTION AND PERCENT OF UTILIZATION ALL HOLDINGS
Dawro Percent Utilized for Total Production Household Wages Animal Type of Crop (Quintal) Consumption Seed Sale In kind Feed Others Grain Crops 634 666.76 45.99 17.84 32.53 1.75 0.80 1.08 Cereals 409 801.81 46.90 17.21 32.19 1.08 1.39 1.23 Teff 101 235.01 39.02 17.95 40.37 1.26 0.24 1.17 Barley 20 728.76 33.35 26.77 36.80 1.85 0.08 1.15 Wheat 35 556.09 38.25 17.77 40.68 2.72 0.32 0.25 Maize 201 923.94 54.89 13.43 24.81 0.44 4.72 1.71 Sorghum 49 731.71 64.08 14.22 19.03 0.04 1.10 1.53 Finger millet - - - - - - - Oats “Aja” 626.31 64.17 25.00 10.83 - - - Rice - - - - - - - Pulses 222 868.02 43.93 18.27 34.02 2.76 0.06 0.95 Horse beans 97 616.55 43.04 17.66 34.81 3.42 - 1.06 Field peas 73 452.78 33.72 22.18 39.49 3.70 - 0.92 Haricot beans 48 132.56 59.14 14.93 24.38 0.36 0.24 0.95 Chick – peas 73.96 90.00 10.00 - - - - Lentils 3 577.62 32.12 17.88 44.85 4.55 - 0.61 Vetch - - - - - - - Soya beans 14.55 100.00 - - - - - Fenugreek - - - - - - - Gibto - - - - - - - Oilseeds 1 996.93 56.89 22.97 19.46 - 0.27 0.41 Neug - - - - - - - Linseed 444.03 61.47 22.06 15.74 - 0.29 0.44 Groundnuts 1 551.32 2.50 5.00 92.50 - - - Safflower - - - - - - - Sesame 1.57 10.00 90.00 - - - - Rapeseed - - - - - - - Vegetables 44 462.19 87.81 0.50 9.46 0.26 0.02 1.95 Lettuce - - - - - - - Head cabbage 217.12 86.67 - 13.33 - - - Ethiopian cabbage 41 443.42 90.13 0.55 7.08 0.33 0.02 1.89 Tomatoes 21.55 60.00 - 40.00 - - - Green peppers 2 181.50 83.55 0.25 13.08 - - 3.13 Red peppers 593.26 66.47 0.59 32.06 - - 0.88 Swiss chard 5.34 - - - - - - Root Crops 337 644.98 73.82 14.98 7.80 0.37 2.00 1.03 Beetroot 210.19 82.00 - 16.00 - - 2.00 Carrot 8.36 25.00 - 75.00 - - - Onion 715.94 49.55 0.45 46.82 - 0.91 2.27 Potatoes 588.90 73.20 8.80 18.00 - - - Garlic 727.78 60.91 7.73 31.36 - - - Taro / ‘Godere’ 299 033.83 73.19 18.80 5.48 0.24 1.45 0.83 Sweet potatoes 36 359.99 81.77 3.54 6.77 1.05 5.00 1.86 Permanent crops 293 250.08 73.08 1.31 22.22 0.41 1.23 1.75 Avocados 13 752.42 72.85 0.40 23.57 0.30 1.01 1.87 Bananas 34 515.09 61.19 1.11 35.75 0.15 0.29 1.50 Guavas 305.56 82.50 - 12.50 - - 5.00 Lemons 564.19 90.00 - 10.00 - - - Mangoes 6 605.83 68.61 - 30.68 - 0.36 0.36 Oranges 13 990.89 63.89 - 33.33 - - 2.78 Papayas 8 452.03 91.63 - 6.63 - - 1.73 Pineapples - - - - - - - Chat 105.61 28.00 - 68.50 - 1.50 2.00 Coffee 11 464.18 70.38 0.76 27.55 0.22 0.02 1.07 Hops (Gesho) 11 085.09 48.63 2.75 43.25 - - 5.38 Enset 145 449.06 86.68 1.98 6.46 0.87 2.19 1.82 Sugar cane 46 960.13 54.73 2.67 35.00 0.36 4.88 2.35

TABLE 1.7.18- CROP PRODUCTION AND PERCENT OF UTILIZATION
ALL HOLDINGS Basketo Special Wereda Percent Utilized for Total Production Household Wages Animal Type of Crop (Quintal) Consumption Seed Sale In kind Feed Others Grain Crops 51 401.64 59.53 13.83 24.87 0.22 0.76 0.80 Cereals 47 531.47 52.72 14.57 30.11 0.35 1.12 1.13 Teff 13 564.38 38.71 17.77 41.23 0.50 0.17 1.63 Barley 1 064.47 27.71 40.42 31.04 - - 0.83 Wheat 297.87 42.50 15.00 41.25 - - 1.25 Maize 27 961.45 58.83 10.89 27.18 0.32 1.92 0.85 Sorghum 4 642.50 63.45 12.87 21.38 0.34 0.69 1.26 Finger millet 0.79 - - - - - - Oats “Aja” - - - - - - - Rice - - - - - - - Pulses 3 738.71 73.26 11.17 15.17 - 0.16 0.23 Horse beans 232.07 77.95 6.59 15.45 - - - Field peas 591.33 73.50 10.70 15.40 - 0.20 0.20 Haricot beans 2 874.48 72.99 11.73 14.84 - 0.17 0.27 Chick – peas - - - - - - - Lentils 40.83 10.00 30.00 60.00 - - - Vetch - - - - - - - Soya beans - - - - - - - Fenugreek - - - - - - - Gibto - - - - - - - Oilseeds 131.46 42.14 30.24 27.14 - - 0.48 Neug - - - - - - - Linseed 39.61 34.00 37.50 28.50 - - - Groundnuts 5.20 100.00 - - - - - Safflower 26.59 60.83 22.50 15.00 - - 1.67 Sesame 60.06 20.00 31.25 48.75 - - - Rapeseed - - - - - - - Vegetables 3 091.85 78.70 0.19 20.28 - - 0.83 Lettuce - - - - - - - Head cabbage 718.02 52.00 - 48.00 - - - Ethiopian cabbage 2 206.86 86.53 0.28 11.94 - - 1.25 Tomatoes 20.89 60.00 - 40.00 - - - Green peppers 122.55 100.00 - - - - - Red peppers 15.65 41.00 - 59.00 - - - Swiss chard 7.88 - - - - - - Root Crops 73 803.67 80.32 1.02 14.00 0.30 3.18 1.18 Beetroot 205.22 60.00 - 34.44 - - 5.56 Carrot - - - - - - - Onion 1 273.59 76.85 3.33 16.11 - - 3.70 Potatoes 1 637.89 81.18 3.53 13.53 - - 1.76 Garlic 55.60 60.00 10.00 30.00 - - - Taro / ‘Godere’ 24 655.26 90.19 0.71 7.83 - 0.68 0.60 Sweet potatoes 45 976.10 71.26 0.69 19.22 0.72 6.98 1.14 Permanent crops 83 264.79 53.69 0.93 41.55 0.13 1.95 1.75 Avocados 6 995.66 55.80 0.72 41.47 - 0.10 1.90 Bananas 16 800.83 57.07 0.10 41.80 - - 1.03 Guavas 18.14 80.00 - 15.00 - - 5.00 Lemons 98.65 56.67 - 26.67 - - 16.67 Mangoes 3 564.21 74.61 - 23.64 - - 1.75 Oranges 161.85 55.00 - 45.00 - - - Papayas 1 657.66 91.76 - 4.41 - - 3.82 Pineapples - - - - - - - Chat 37.87 - - 100.00 - - - Coffee 5 414.79 18.86 1.99 77.49 0.07 0.20 1.40 Hops (Gesho) 142.81 32.35 - 67.65 - - - Enset 15 584.84 75.98 0.41 12.50 0.54 9.49 1.08 Sugar cane 32 787.48 66.00 1.88 28.47 - 0.29 3.35
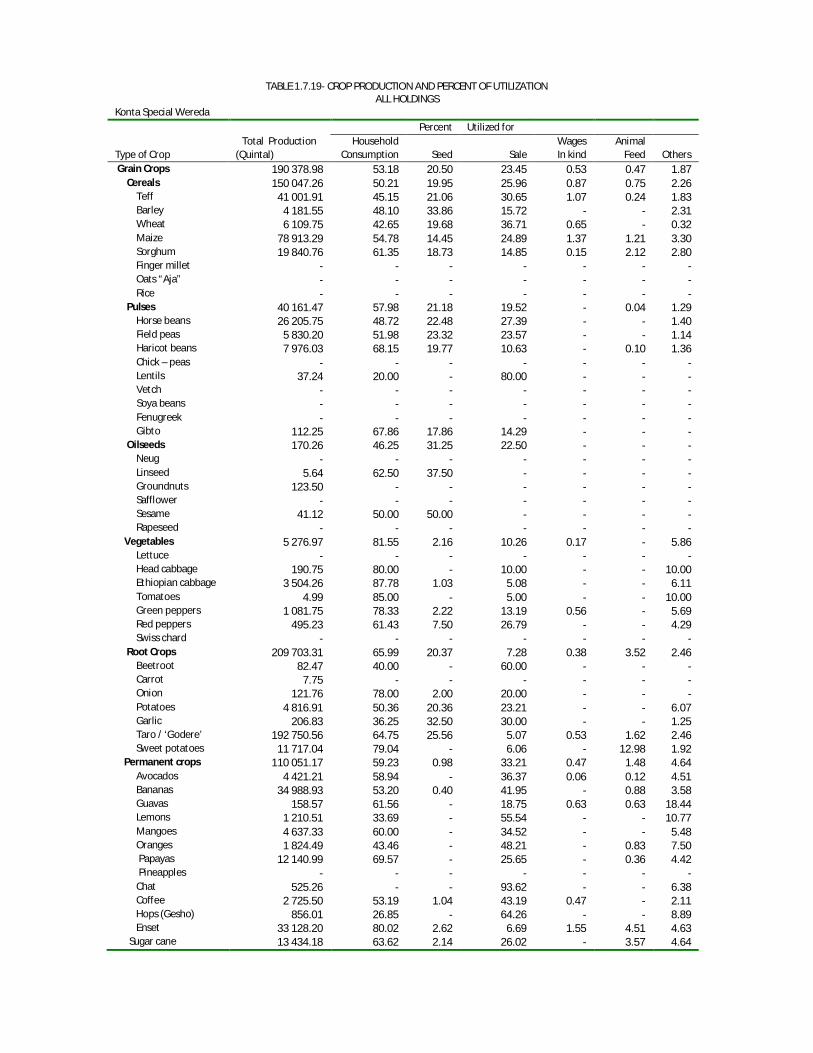
TABLE 1.7.19- CROP PRODUCTION AND PERCENT OF UTILIZATION
ALL HOLDINGS Konta Special Wereda Percent Utilized for Total Production Household Wages Animal Type of Crop (Quintal) Consumption Seed Sale In kind Feed Others Grain Crops 190 378.98 53.18 20.50 23.45 0.53 0.47 1.87 Cereals 150 047.26 50.21 19.95 25.96 0.87 0.75 2.26 Teff 41 001.91 45.15 21.06 30.65 1.07 0.24 1.83 Barley 4 181.55 48.10 33.86 15.72 - - 2.31 Wheat 6 109.75 42.65 19.68 36.71 0.65 - 0.32 Maize 78 913.29 54.78 14.45 24.89 1.37 1.21 3.30 Sorghum 19 840.76 61.35 18.73 14.85 0.15 2.12 2.80 Finger millet - - - - - - - Oats “Aja” - - - - - - - Rice - - - - - - - Pulses 40 161.47 57.98 21.18 19.52 - 0.04 1.29 Horse beans 26 205.75 48.72 22.48 27.39 - - 1.40 Field peas 5 830.20 51.98 23.32 23.57 - - 1.14 Haricot beans 7 976.03 68.15 19.77 10.63 - 0.10 1.36 Chick – peas - - - - - - - Lentils 37.24 20.00 - 80.00 - - - Vetch - - - - - - - Soya beans - - - - - - - Fenugreek - - - - - - - Gibto 112.25 67.86 17.86 14.29 - - - Oilseeds 170.26 46.25 31.25 22.50 - - - Neug - - - - - - - Linseed 5.64 62.50 37.50 - - - - Groundnuts 123.50 - - - - - - Safflower - - - - - - - Sesame 41.12 50.00 50.00 - - - - Rapeseed - - - - - - - Vegetables 5 276.97 81.55 2.16 10.26 0.17 - 5.86 Lettuce - - - - - - - Head cabbage 190.75 80.00 - 10.00 - - 10.00 Ethiopian cabbage 3 504.26 87.78 1.03 5.08 - - 6.11 Tomatoes 4.99 85.00 - 5.00 - - 10.00 Green peppers 1 081.75 78.33 2.22 13.19 0.56 - 5.69 Red peppers 495.23 61.43 7.50 26.79 - - 4.29 Swiss chard - - - - - - - Root Crops 209 703.31 65.99 20.37 7.28 0.38 3.52 2.46 Beetroot 82.47 40.00 - 60.00 - - - Carrot 7.75 - - - - - - Onion 121.76 78.00 2.00 20.00 - - - Potatoes 4 816.91 50.36 20.36 23.21 - - 6.07 Garlic 206.83 36.25 32.50 30.00 - - 1.25 Taro / ‘Godere’ 192 750.56 64.75 25.56 5.07 0.53 1.62 2.46 Sweet potatoes 11 717.04 79.04 - 6.06 - 12.98 1.92 Permanent crops 110 051.17 59.23 0.98 33.21 0.47 1.48 4.64 Avocados 4 421.21 58.94 - 36.37 0.06 0.12 4.51 Bananas 34 988.93 53.20 0.40 41.95 - 0.88 3.58 Guavas 158.57 61.56 - 18.75 0.63 0.63 18.44 Lemons 1 210.51 33.69 - 55.54 - - 10.77 Mangoes 4 637.33 60.00 - 34.52 - - 5.48 Oranges 1 824.49 43.46 - 48.21 - 0.83 7.50 Papayas 12 140.99 69.57 - 25.65 - 0.36 4.42 Pineapples - - - - - - - Chat 525.26 - - 93.62 - - 6.38 Coffee 2 725.50 53.19 1.04 43.19 0.47 - 2.11 Hops (Gesho) 856.01 26.85 - 64.26 - - 8.89 Enset 33 128.20 80.02 2.62 6.69 1.55 4.51 4.63 Sugar cane 13 434.18 63.62 2.14 26.02 - 3.57 4.64
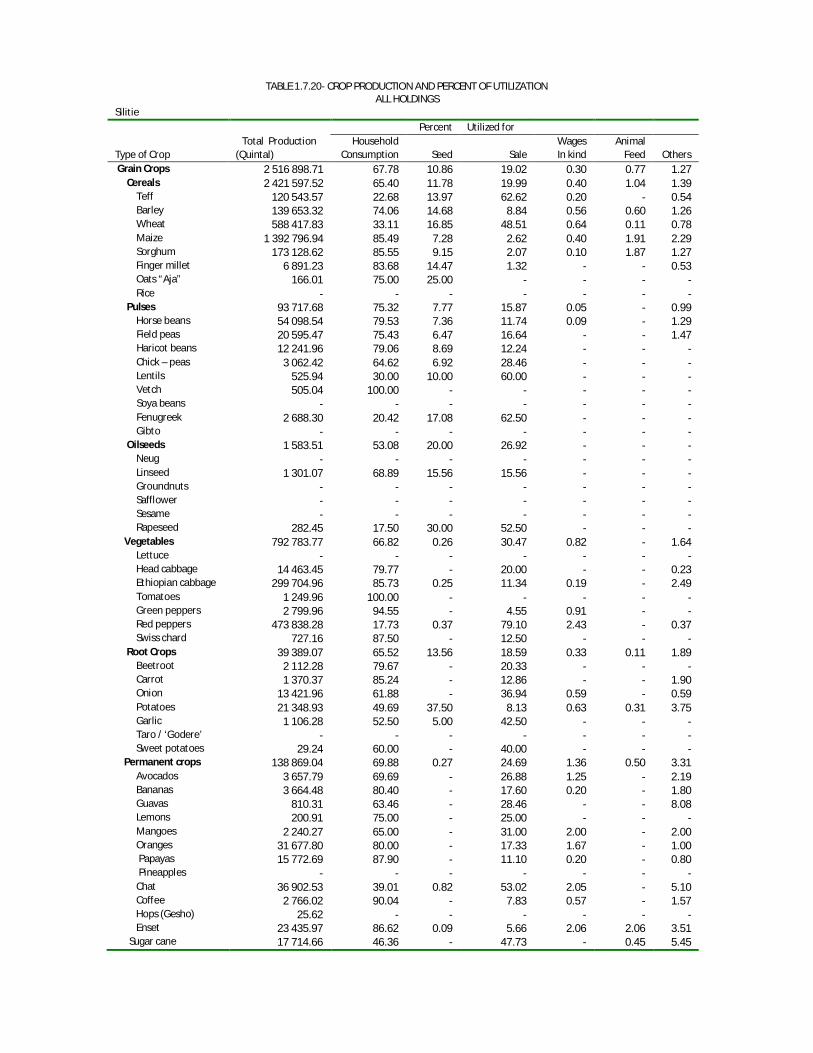
TABLE 1.7.20- CROP PRODUCTION AND PERCENT OF UTILIZATION
ALL HOLDINGS Silitie Percent Utilized for Total Production Household Wages Animal Type of Crop (Quintal) Consumption Seed Sale In kind Feed Others Grain Crops 2 516 898.71 67.78 10.86 19.02 0.30 0.77 1.27 Cereals 2 421 597.52 65.40 11.78 19.99 0.40 1.04 1.39 Teff 120 543.57 22.68 13.97 62.62 0.20 - 0.54 Barley 139 653.32 74.06 14.68 8.84 0.56 0.60 1.26 Wheat 588 417.83 33.11 16.85 48.51 0.64 0.11 0.78 Maize 1 392 796.94 85.49 7.28 2.62 0.40 1.91 2.29 Sorghum 173 128.62 85.55 9.15 2.07 0.10 1.87 1.27 Finger millet 6 891.23 83.68 14.47 1.32 - - 0.53 Oats “Aja” 166.01 75.00 25.00 - - - - Rice - - - - - - - Pulses 93 717.68 75.32 7.77 15.87 0.05 - 0.99 Horse beans 54 098.54 79.53 7.36 11.74 0.09 - 1.29 Field peas 20 595.47 75.43 6.47 16.64 - - 1.47 Haricot beans 12 241.96 79.06 8.69 12.24 - - - Chick – peas 3 062.42 64.62 6.92 28.46 - - - Lentils 525.94 30.00 10.00 60.00 - - - Vetch 505.04 100.00 - - - - - Soya beans - - - - - - - Fenugreek 2 688.30 20.42 17.08 62.50 - - - Gibto - - - - - - - Oilseeds 1 583.51 53.08 20.00 26.92 - - - Neug - - - - - - - Linseed 1 301.07 68.89 15.56 15.56 - - - Groundnuts - - - - - - - Safflower - - - - - - - Sesame - - - - - - - Rapeseed 282.45 17.50 30.00 52.50 - - - Vegetables 792 783.77 66.82 0.26 30.47 0.82 - 1.64 Lettuce - - - - - - - Head cabbage 14 463.45 79.77 - 20.00 - - 0.23 Ethiopian cabbage 299 704.96 85.73 0.25 11.34 0.19 - 2.49 Tomatoes 1 249.96 100.00 - - - - - Green peppers 2 799.96 94.55 - 4.55 0.91 - - Red peppers 473 838.28 17.73 0.37 79.10 2.43 - 0.37 Swiss chard 727.16 87.50 - 12.50 - - - Root Crops 39 389.07 65.52 13.56 18.59 0.33 0.11 1.89 Beetroot 2 112.28 79.67 - 20.33 - - - Carrot 1 370.37 85.24 - 12.86 - - 1.90 Onion 13 421.96 61.88 - 36.94 0.59 - 0.59 Potatoes 21 348.93 49.69 37.50 8.13 0.63 0.31 3.75 Garlic 1 106.28 52.50 5.00 42.50 - - - Taro / ‘Godere’ - - - - - - - Sweet potatoes 29.24 60.00 - 40.00 - - - Permanent crops 138 869.04 69.88 0.27 24.69 1.36 0.50 3.31 Avocados 3 657.79 69.69 - 26.88 1.25 - 2.19 Bananas 3 664.48 80.40 - 17.60 0.20 - 1.80 Guavas 810.31 63.46 - 28.46 - - 8.08 Lemons 200.91 75.00 - 25.00 - - - Mangoes 2 240.27 65.00 - 31.00 2.00 - 2.00 Oranges 31 677.80 80.00 - 17.33 1.67 - 1.00 Papayas 15 772.69 87.90 - 11.10 0.20 - 0.80 Pineapples - - - - - - - Chat 36 902.53 39.01 0.82 53.02 2.05 - 5.10 Coffee 2 766.02 90.04 - 7.83 0.57 - 1.57 Hops (Gesho) 25.62 - - - - - - Enset 23 435.97 86.62 0.09 5.66 2.06 2.06 3.51 Sugar cane 17 714.66 46.36 - 47.73 - 0.45 5.45
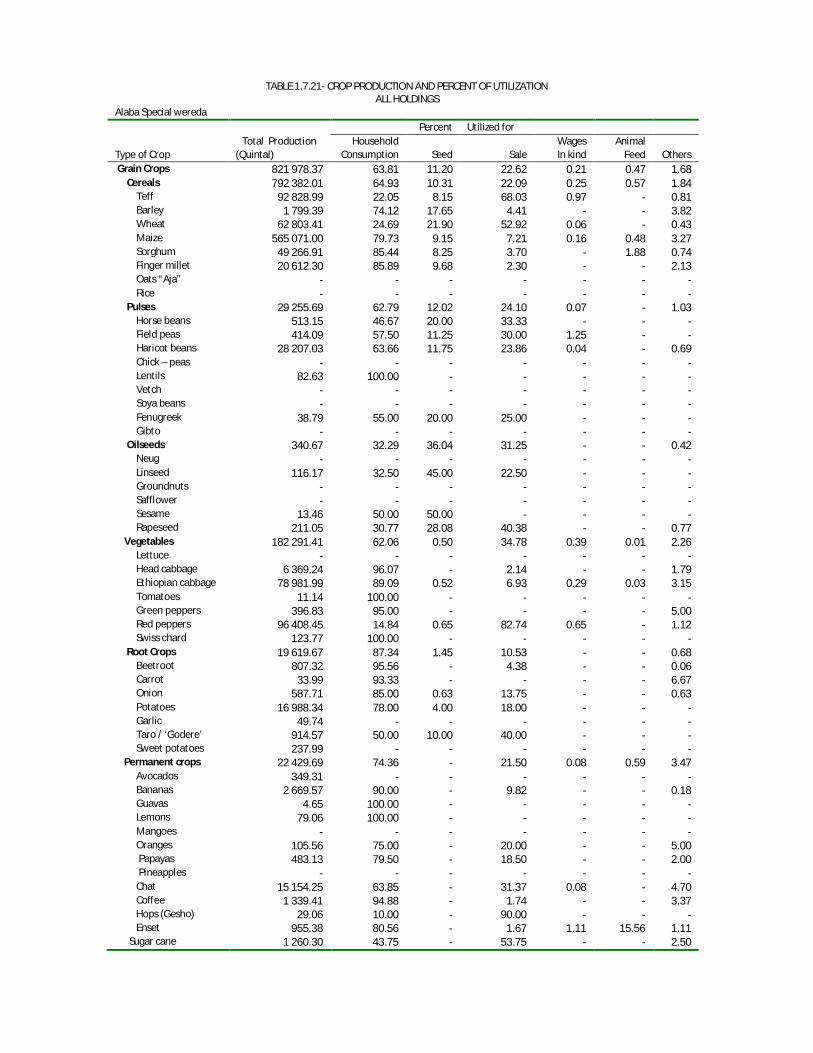
TABLE 1.7.21- CROP PRODUCTION AND PERCENT OF UTILIZATION
ALL HOLDINGS Alaba Special wereda Percent Utilized for Total Production Household Wages Animal Type of Crop (Quintal) Consumption Seed Sale In kind Feed Others Grain Crops 821 978.37 63.81 11.20 22.62 0.21 0.47 1.68 Cereals 792 382.01 64.93 10.31 22.09 0.25 0.57 1.84 Teff 92 828.99 22.05 8.15 68.03 0.97 - 0.81 Barley 1 799.39 74.12 17.65 4.41 - - 3.82 Wheat 62 803.41 24.69 21.90 52.92 0.06 - 0.43 Maize 565 071.00 79.73 9.15 7.21 0.16 0.48 3.27 Sorghum 49 266.91 85.44 8.25 3.70 - 1.88 0.74 Finger millet 20 612.30 85.89 9.68 2.30 - - 2.13 Oats “Aja” - - - - - - - Rice - - - - - - - Pulses 29 255.69 62.79 12.02 24.10 0.07 - 1.03 Horse beans 513.15 46.67 20.00 33.33 - - - Field peas 414.09 57.50 11.25 30.00 1.25 - - Haricot beans 28 207.03 63.66 11.75 23.86 0.04 - 0.69 Chick – peas - - - - - - - Lentils 82.63 100.00 - - - - - Vetch - - - - - - - Soya beans - - - - - - - Fenugreek 38.79 55.00 20.00 25.00 - - - Gibto - - - - - - - Oilseeds 340.67 32.29 36.04 31.25 - - 0.42 Neug - - - - - - - Linseed 116.17 32.50 45.00 22.50 - - - Groundnuts - - - - - - - Safflower - - - - - - - Sesame 13.46 50.00 50.00 - - - - Rapeseed 211.05 30.77 28.08 40.38 - - 0.77 Vegetables 182 291.41 62.06 0.50 34.78 0.39 0.01 2.26 Lettuce - - - - - - - Head cabbage 6 369.24 96.07 - 2.14 - - 1.79 Ethiopian cabbage 78 981.99 89.09 0.52 6.93 0.29 0.03 3.15 Tomatoes 11.14 100.00 - - - - - Green peppers 396.83 95.00 - - - - 5.00 Red peppers 96 408.45 14.84 0.65 82.74 0.65 - 1.12 Swiss chard 123.77 100.00 - - - - - Root Crops 19 619.67 87.34 1.45 10.53 - - 0.68 Beetroot 807.32 95.56 - 4.38 - - 0.06 Carrot 33.99 93.33 - - - - 6.67 Onion 587.71 85.00 0.63 13.75 - - 0.63 Potatoes 16 988.34 78.00 4.00 18.00 - - - Garlic 49.74 - - - - - - Taro / ‘Godere’ 914.57 50.00 10.00 40.00 - - - Sweet potatoes 237.99 - - - - - - Permanent crops 22 429.69 74.36 - 21.50 0.08 0.59 3.47 Avocados 349.31 - - - - - - Bananas 2 669.57 90.00 - 9.82 - - 0.18 Guavas 4.65 100.00 - - - - - Lemons 79.06 100.00 - - - - - Mangoes - - - - - - - Oranges 105.56 75.00 - 20.00 - - 5.00 Papayas 483.13 79.50 - 18.50 - - 2.00 Pineapples - - - - - - - Chat 15 154.25 63.85 - 31.37 0.08 - 4.70 Coffee 1 339.41 94.88 - 1.74 - - 3.37 Hops (Gesho) 29.06 10.00 - 90.00 - - - Enset 955.38 80.56 - 1.67 1.11 15.56 1.11 Sugar cane 1 260.30 43.75 - 53.75 - - 2.50
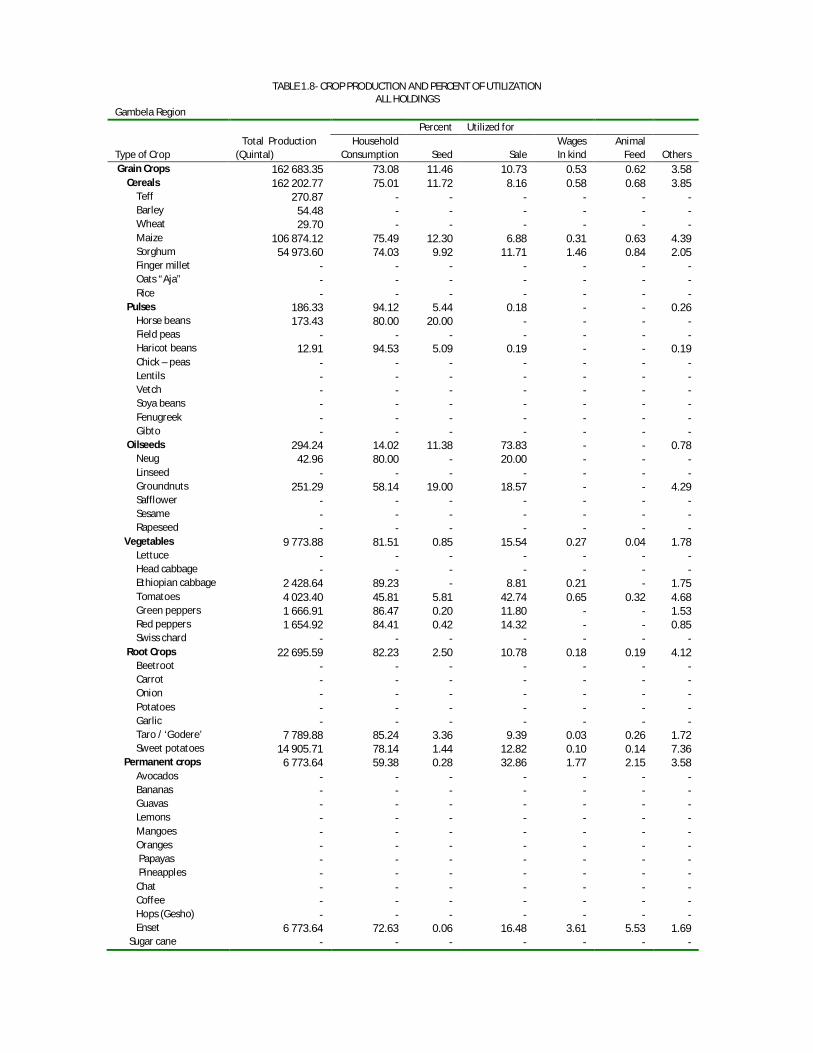
TABLE 1.8- CROP PRODUCTION AND PERCENT OF UTILIZATION
ALL HOLDINGS Gambela Region Percent Utilized for Total Production Household Wages Animal Type of Crop (Quintal) Consumption Seed Sale In kind Feed Others Grain Crops 162 683.35 73.08 11.46 10.73 0.53 0.62 3.58 Cereals 162 202.77 75.01 11.72 8.16 0.58 0.68 3.85 Teff 270.87 - - - - - - Barley 54.48 - - - - - - Wheat 29.70 - - - - - - Maize 106 874.12 75.49 12.30 6.88 0.31 0.63 4.39 Sorghum 54 973.60 74.03 9.92 11.71 1.46 0.84 2.05 Finger millet - - - - - - - Oats “Aja” - - - - - - - Rice - - - - - - - Pulses 186.33 94.12 5.44 0.18 - - 0.26 Horse beans 173.43 80.00 20.00 - - - - Field peas - - - - - - - Haricot beans 12.91 94.53 5.09 0.19 - - 0.19 Chick – peas - - - - - - - Lentils - - - - - - - Vetch - - - - - - - Soya beans - - - - - - - Fenugreek - - - - - - - Gibto - - - - - - - Oilseeds 294.24 14.02 11.38 73.83 - - 0.78 Neug 42.96 80.00 - 20.00 - - - Linseed - - - - - - - Groundnuts 251.29 58.14 19.00 18.57 - - 4.29 Safflower - - - - - - - Sesame - - - - - - - Rapeseed - - - - - - - Vegetables 9 773.88 81.51 0.85 15.54 0.27 0.04 1.78 Lettuce - - - - - - - Head cabbage - - - - - - - Ethiopian cabbage 2 428.64 89.23 - 8.81 0.21 - 1.75 Tomatoes 4 023.40 45.81 5.81 42.74 0.65 0.32 4.68 Green peppers 1 666.91 86.47 0.20 11.80 - - 1.53 Red peppers 1 654.92 84.41 0.42 14.32 - - 0.85 Swiss chard - - - - - - - Root Crops 22 695.59 82.23 2.50 10.78 0.18 0.19 4.12 Beetroot - - - - - - - Carrot - - - - - - - Onion - - - - - - - Potatoes - - - - - - - Garlic - - - - - - - Taro / ‘Godere’ 7 789.88 85.24 3.36 9.39 0.03 0.26 1.72 Sweet potatoes 14 905.71 78.14 1.44 12.82 0.10 0.14 7.36 Permanent crops 6 773.64 59.38 0.28 32.86 1.77 2.15 3.58 Avocados - - - - - - - Bananas - - - - - - - Guavas - - - - - - - Lemons - - - - - - - Mangoes - - - - - - - Oranges - - - - - - - Papayas - - - - - - - Pineapples - - - - - - - Chat - - - - - - - Coffee - - - - - - - Hops (Gesho) - - - - - - - Enset 6 773.64 72.63 0.06 16.48 3.61 5.53 1.69 Sugar cane - - - - - - -

TABLE 1.8.1- CROP PRODUCTION AND PERCENT OF UTILIZATION
ALL HOLDINGS Agnuwak Percent Utilized for Total Production Household Wages Animal Type of Crop (Quintal) Consumption Seed Sale In kind Feed Others Grain Crops 42 313.79 62.31 12.74 21.15 0.49 0.24 3.07 Cereals 42 021.31 70.79 13.69 10.54 0.67 0.34 3.97 Teff 270.87 - - - - - - Barley 54.48 - - - - - - Wheat 29.70 - - - - - - Maize 28 624.32 72.37 14.17 10.01 0.44 0.30 2.72 Sorghum 13 041.94 65.17 11.33 7.83 2.50 0.67 12.50 Finger millet - - - - - - - Oats “Aja” - - - - - - - Rice - - - - - - - Pulses 12.91 91.47 7.79 0.29 - - 0.44 Horse beans - - - - - - - Field peas - - - - - - - Haricot beans 12.91 91.36 8.03 0.30 - - 0.30 Chick – peas - - - - - - - Lentils - - - - - - - Vetch - - - - - - - Soya beans - - - - - - - Fenugreek - - - - - - - Gibto - - - - - - - Oilseeds 279.57 11.73 11.58 75.89 - - 0.81 Neug 42.96 80.00 - 20.00 - - - Linseed - - - - - - - Groundnuts 236.62 58.14 19.00 18.57 - - 4.29 Safflower - - - - - - - Sesame - - - - - - - Rapeseed - - - - - - - Vegetables 4 911.76 74.93 4.44 16.62 0.44 - 3.56 Lettuce - - - - - - - Head cabbage - - - - - - - Ethiopian cabbage 419.80 100.00 - - - - - Tomatoes 3 414.12 46.76 10.00 34.12 1.18 - 7.94 Green peppers 138.44 85.22 1.11 13.11 - - 0.56 Red peppers 939.40 95.00 1.11 2.78 - - 1.11 Swiss chard - - - - - - - Root Crops 13 267.31 76.57 2.35 12.04 0.18 0.15 8.71 Beetroot - - - - - - - Carrot - - - - - - - Onion - - - - - - - Potatoes - - - - - - - Garlic - - - - - - - Taro / ‘Godere’ 908.45 82.96 3.52 7.78 - - 5.74 Sweet potatoes 12 358.87 75.49 1.90 12.75 0.14 0.19 9.54 Permanent crops - - - - - - - Avocados - - - - - - - Bananas - - - - - - - Guavas - - - - - - - Lemons - - - - - - - Mangoes - - - - - - - Oranges - - - - - - - Papayas - - - - - - - Pineapples - - - - - - - Chat - - - - - - - Coffee - - - - - - - Hops (Gesho) - - - - - - - Enset - - - - - - - Sugar cane - - - - - - -
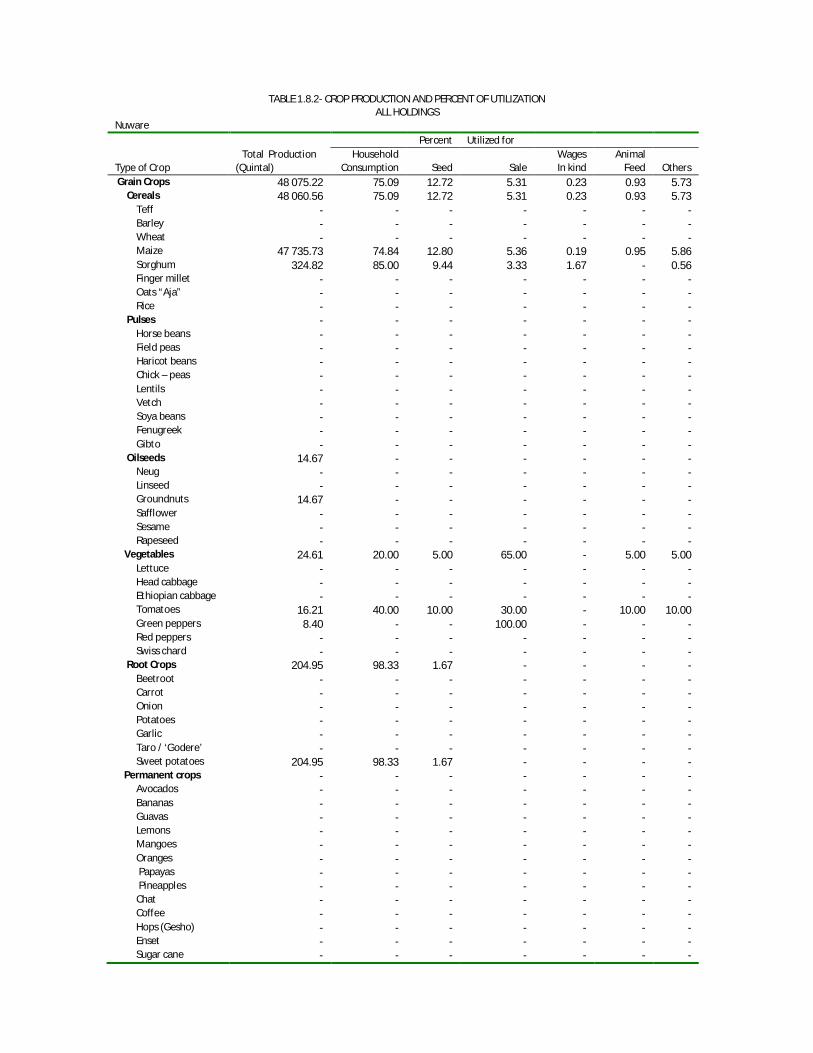
TABLE 1.8.2- CROP PRODUCTION AND PERCENT OF UTILIZATION ALL HOLDINGS
Nuware Percent Utilized for Total Production Household Wages Animal Type of Crop (Quintal) Consumption Seed Sale In kind Feed Others Grain Crops 48 075.22 75.09 12.72 5.31 0.23 0.93 5.73 Cereals 48 060.56 75.09 12.72 5.31 0.23 0.93 5.73 Teff - - - - - - - Barley - - - - - - - Wheat - - - - - - - Maize 47 735.73 74.84 12.80 5.36 0.19 0.95 5.86 Sorghum 324.82 85.00 9.44 3.33 1.67 - 0.56 Finger millet - - - - - - - Oats “Aja” - - - - - - - Rice - - - - - - - Pulses - - - - - - - Horse beans - - - - - - - Field peas - - - - - - - Haricot beans - - - - - - - Chick – peas - - - - - - - Lentils - - - - - - - Vetch - - - - - - - Soya beans - - - - - - - Fenugreek - - - - - - - Gibto - - - - - - - Oilseeds 14.67 - - - - - - Neug - - - - - - - Linseed - - - - - - - Groundnuts 14.67 - - - - - - Safflower - - - - - - - Sesame - - - - - - - Rapeseed - - - - - - - Vegetables 24.61 20.00 5.00 65.00 - 5.00 5.00 Lettuce - - - - - - - Head cabbage - - - - - - - Ethiopian cabbage - - - - - - - Tomatoes 16.21 40.00 10.00 30.00 - 10.00 10.00 Green peppers 8.40 - - 100.00 - - - Red peppers - - - - - - - Swiss chard - - - - - - - Root Crops 204.95 98.33 1.67 - - - - Beetroot - - - - - - - Carrot - - - - - - - Onion - - - - - - - Potatoes - - - - - - - Garlic - - - - - - - Taro / ‘Godere’ - - - - - - - Sweet potatoes 204.95 98.33 1.67 - - - - Permanent crops - - - - - - - Avocados - - - - - - - Bananas - - - - - - - Guavas - - - - - - - Lemons - - - - - - - Mangoes - - - - - - - Oranges - - - - - - - Papayas - - - - - - - Pineapples - - - - - - - Chat - - - - - - - Coffee - - - - - - - Hops (Gesho) - - - - - - - Enset - - - - - - - Sugar cane - - - - - - -
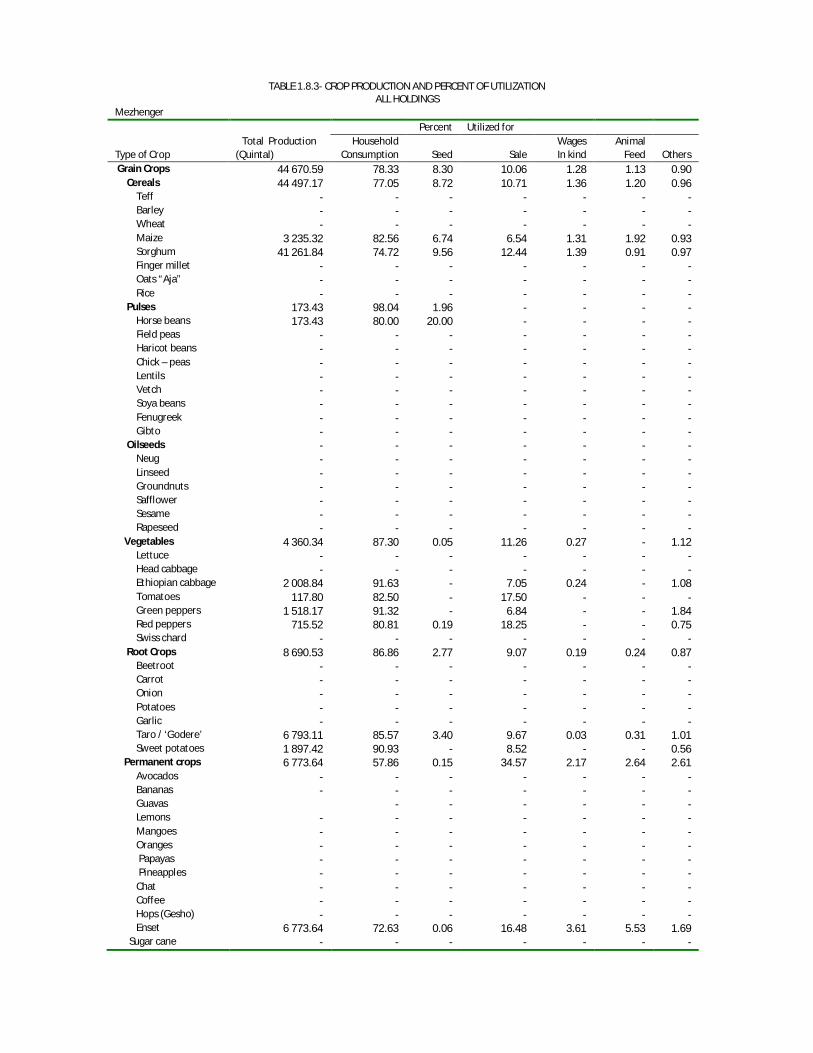
TABLE 1.8.3- CROP PRODUCTION AND PERCENT OF UTILIZATION
ALL HOLDINGS Mezhenger Percent Utilized for Total Production Household Wages Animal Type of Crop (Quintal) Consumption Seed Sale In kind Feed Others Grain Crops 44 670.59 78.33 8.30 10.06 1.28 1.13 0.90 Cereals 44 497.17 77.05 8.72 10.71 1.36 1.20 0.96 Teff - - - - - - - Barley - - - - - - - Wheat - - - - - - - Maize 3 235.32 82.56 6.74 6.54 1.31 1.92 0.93 Sorghum 41 261.84 74.72 9.56 12.44 1.39 0.91 0.97 Finger millet - - - - - - - Oats “Aja” - - - - - - - Rice - - - - - - - Pulses 173.43 98.04 1.96 - - - - Horse beans 173.43 80.00 20.00 - - - - Field peas - - - - - - - Haricot beans - - - - - - - Chick – peas - - - - - - - Lentils - - - - - - - Vetch - - - - - - - Soya beans - - - - - - - Fenugreek - - - - - - - Gibto - - - - - - - Oilseeds - - - - - - - Neug - - - - - - - Linseed - - - - - - - Groundnuts - - - - - - - Safflower - - - - - - - Sesame - - - - - - - Rapeseed - - - - - - - Vegetables 4 360.34 87.30 0.05 11.26 0.27 - 1.12 Lettuce - - - - - - - Head cabbage - - - - - - - Ethiopian cabbage 2 008.84 91.63 - 7.05 0.24 - 1.08 Tomatoes 117.80 82.50 - 17.50 - - - Green peppers 1 518.17 91.32 - 6.84 - - 1.84 Red peppers 715.52 80.81 0.19 18.25 - - 0.75 Swiss chard - - - - - - - Root Crops 8 690.53 86.86 2.77 9.07 0.19 0.24 0.87 Beetroot - - - - - - - Carrot - - - - - - - Onion - - - - - - - Potatoes - - - - - - - Garlic - - - - - - - Taro / ‘Godere’ 6 793.11 85.57 3.40 9.67 0.03 0.31 1.01 Sweet potatoes 1 897.42 90.93 - 8.52 - - 0.56 Permanent crops 6 773.64 57.86 0.15 34.57 2.17 2.64 2.61 Avocados - - - - - - - Bananas - - - - - - - Guavas - - - - - - Lemons - - - - - - - Mangoes - - - - - - - Oranges - - - - - - - Papayas - - - - - - - Pineapples - - - - - - - Chat - - - - - - - Coffee - - - - - - - Hops (Gesho) - - - - - - - Enset 6 773.64 72.63 0.06 16.48 3.61 5.53 1.69 Sugar cane - - - - - - -

TABLE 1.8.4- CROP PRODUCTION AND PERCENT OF UTILIZATION
ALL HOLDINGS Itang Special Wereda Percent Utilized for Total Production Household Wages Animal Type of Crop (Quintal) Consumption Seed Sale In kind Feed Others Grain Crops 27 623.74 75.83 12.42 6.78 0.04 0.09 4.84 Cereals 27 623.74 75.85 12.43 6.74 0.04 0.09 4.85 Teff - - - - - - - Barley - - - - - - - Wheat - - - - - - - Maize 27 278.74 75.95 12.33 6.61 0.05 0.09 4.98 Sorghum 345.00 72.22 16.11 11.67 - - - Finger millet - - - - - - - Oats “Aja” - - - - - - - Rice - - - - - - - Pulses - - - - - - - Horse beans - - - - - - - Field peas - - - - - - - Haricot beans - - - - - - - Chick – peas - - - - - - - Lentils - - - - - - - Vetch - - - - - - - Soya beans - - - - - - - Fenugreek - - - - - - - Gibto - - - - - - - Oilseeds - - - - - - - Neug - - - - - - - Linseed - - - - - - - Groundnuts - - - - - - - Safflower - - - - - - - Sesame - - - - - - - Rapeseed - - - - - - - Vegetables 477.18 52.39 - 44.13 - - 3.48 Lettuce - - - - - - - Head cabbage - - - - - - - Ethiopian cabbage - - - - - - - Tomatoes 475.27 28.33 - 71.67 - - - Green peppers 1.90 - - 100.00 - - - Red peppers - - - - - - - Swiss chard - - - - - - - Root Crops 532.80 70.45 - 26.82 - - 2.73 Beetroot - - - - - - - Carrot - - - - - - - Onion - - - - - - - Potatoes - - - - - - - Garlic - - - - - - - Taro / ‘Godere’ 88.32 90.00 - 10.00 - - - Sweet potatoes 444.47 63.13 - 33.13 - - 3.75 Permanent crops - - - - - - - Avocados - - - - - - - Bananas - - - - - - - Guavas - - - - - - - Lemons - - - - - - - Mangoes - - - - - - - Oranges - - - - - - - Papayas - - - - - - - Pineapples - - - - - - - Chat - - - - - - - Coffee - - - - - - - Hops (Gesho) - - - - - - - Enset - - - - - - - Sugar cane - - - - - - -

TABLE 1.9- CROP PRODUCTION AND PERCENT OF UTILIZATION
ALL HOLDINGS Harari Percent Utilized for Total Production Household Wages Animal Type of Crop (Quintal) Consumption Seed Sale In kind Feed Others Grain Crops 225 687.68 70.91 12.17 13.66 0.08 0.02 3.16 Cereals 202 931.53 85.51 10.74 0.09 0.10 0.02 3.53 Teff - - - - - - - Barley 204.39 90.00 10.00 - - - - Wheat 831.08 92.63 7.11 - - - 0.26 Maize 53 378.16 88.47 9.98 - 0.17 - 1.38 Sorghum 148 510.94 82.57 11.64 0.17 0.06 0.04 5.52 Finger millet - - - - - - - Oats “Aja” 6.95 90.00 10.00 - - - - Rice - - - - - - - Pulses 101.22 86.00 10.00 - - - 4.00 Horse beans - - - - - - - Field peas - - - - - - - Haricot beans 101.22 82.50 12.50 - - - 5.00 Chick – peas - - - - - - - Lentils - - - - - - - Vetch - - - - - - - Soya beans - - - - - - - Fenugreek - - - - - - - Gibto - - - - - - - Oilseeds 22 654.93 22.40 16.94 58.72 - - 1.94 Neug - - - - - - - Linseed - - - - - - - Groundnuts 22 586.42 16.83 17.86 63.45 - - 1.85 Safflower - - - - - - - Sesame 58.34 91.50 5.50 - - - 3.00 Rapeseed 10.17 - - - - - - Vegetables - - - - - - - Lettuce - - - - - - - Head cabbage - - - - - - - Ethiopian cabbage - - - - - - - Tomatoes - - - - - - - Green peppers - - - - - - - Red peppers - - - - - - - Swiss chard - - - - - - - Root Crops 8 178.85 84.58 3.75 7.08 - 0.83 3.75 Beetroot - - - - - - - Carrot - - - - - - - Onion - - - - - - - Potatoes - - - - - - - Garlic - - - - - - - Taro / ‘Godere’ - - - - - - - Sweet potatoes 8 178.85 87.33 - 6.00 - 1.33 5.33 Permanent crops 90 871.41 36.89 0.41 54.61 0.66 - 7.43 Avocados - - - - - - - Bananas 1 274.33 65.14 - 30.23 - - 4.64 Guavas - - - - - - - Lemons - - - - - - - Mangoes 288.66 17.16 - 78.84 - - 4.00 Oranges - - - - - - - Papayas 6 454.72 22.81 - 76.56 - - 0.63 Pineapples - - - - - - - Chat 82 650.91 44.99 0.36 43.16 1.24 - 10.25 Coffee 202.80 61.00 - 34.33 - - 4.67 Hops (Gesho) - - - - - - - Enset - - - - - - - Sugar cane - - - - - - -

TABLE 1.10- CROP PRODUCTION AND PERCENT OF UTILIZATION
ALL HOLDINGS Dire Dawa Percent Utilized for Total Production Household Wages Animal Type of Crop (Quintal) Consumption Seed Sale In kind Feed Others Grain Crops 153 069.91 86.18 7.12 3.79 0.20 0.49 2.23 Cereals 142 026.27 88.29 7.55 0.41 0.30 0.73 2.72 Teff - - - - - - - Barley 115.18 - - - - - - Wheat 53.45 84.00 8.00 - - - 8.00 Maize 3 741.31 90.63 9.37 - - - - Sorghum 138 116.32 87.95 7.27 0.47 0.35 0.85 3.11 Finger millet - - - - - - - Oats “Aja” - - - - - - - Rice - - - - - - - Pulses 7 579.83 91.17 4.19 4.33 - - 0.31 Horse beans - - - - - - - Field peas - - - - - - - Haricot beans 7 579.83 92.05 4.29 3.34 - - 0.32 Chick – peas - - - - - - - Lentils - - - - - - - Vetch - - - - - - - Soya beans - - - - - - - Fenugreek - - - - - - - Gibto - - - - - - - Oilseeds 3 463.80 56.27 12.03 27.77 - - 3.93 Neug - - - - - - - Linseed - - - - - - - Groundnuts 2 102.19 5.20 12.50 77.30 - - 5.00 Safflower - - - - - - - Sesame 1 361.61 85.33 7.56 3.33 - - 3.78 Rapeseed - - - - - - - Vegetables 11 656.65 36.72 4.44 55.95 - - 2.90 Lettuce - - - - - - - Head cabbage - - - - - - - Ethiopian cabbage - - - - - - - Tomatoes 11 656.65 27.30 2.96 66.81 - - 2.93 Green peppers - - - - - - - Red peppers - - - - - - - Swiss chard - - - - - - - Root Crops 5 399.51 46.22 12.36 37.71 - - 3.71 Beetroot - - - - - - - Carrot - - - - - - - Onion - - - - - - - Potatoes - - - - - - - Garlic - - - - - - - Taro / ‘Godere’ - - - - - - - Sweet potatoes 5 399.51 96.15 - - - - 3.85 Permanent crops 13 202.91 44.99 0.72 48.04 0.40 - 5.85 Avocados - - - - - - - Bananas - - - - - - - Guavas - - - - - - - Lemons - - - - - - - Mangoes - - - - - - - Oranges - - - - - - - Papayas - - - - - - - Pineapples - - - - - - - Chat 12 797.14 57.57 0.30 34.19 - - 7.94 Coffee 405.77 10.52 2.15 86.89 - - 0.43 Hops (Gesho) - - - - - - - Enset - - - - - - - Sugar cane - - - - - - -
3.2 UTILIZATION OF LIVESTOCK PRODUCTS
Data on the utilization of animal products were also collected during the survey to assess
product usage experience of holders. The products for which utilization data intended to
be collected were milk, egg, honey, meat, hides and skins, wool and by-products such as
butter, cheese, and bees wax. It is commonly accepted that these products are often used
for household consumption and/or sold to finance the purchase of basic household
commodities such as coffee, salt, cooking oil, sugar, etc. The products are sometimes
used as payments and gifts to others. The survey data on the utilization of animal
products in the rural areas are presented in Summary Table 2 and it reveals that of the
total annual milk production, 46.61 percent was used for household consumption, 4.69
percent was sold, only 0.35 percent was used for wages in kind and the rest 48.36 percent
was used for other purposes (could be for the production of butter, Cheese, and the
likes). With respect to the utilization of butter, 61.44 percent of the produce was used for
household consumption although considerable portion (34.46 percent) was sold. Most of
the total Cheese produced was used for household consumption that is about 83.34 per
cent, 12.96 percent was sold and the rest 3.70 percent was used for wage in kind and
other purposes, which are indicated in the table.
Of the total honey production, about 38.31 percent was used for household
consumption, about 58.49 percent was sold, and less than 1 percent of the honey
production was used as payment (wage) in the country. On the other hand, 43.81 percent
of the wax produced in the country was used as household consumption while 35.81 per
cent was used for sale.
Concerning utilization of egg production, 27.64 percent of the total egg production was
used for household consumption while 36.00 percent of the total egg production was
used for sale. About one-third of the egg production in the country (that is about 36.24
percent) was used for other purposes and that could be for hatching. Holder's utilization
practices on hides and skins were also assessed and the results showed that the products
are mainly used for sale and household consumption (See Summary Table 2).

SUMMARY TABLE 2: Livestock Product Utilization, 2011/12 (2004 E.C) National
Type of Product
Total %
Percent of Product Utilized for: Household
Consumption Sale Wages in Kind Other
Milk 100.00 46.61 4.69 0.35 48.36 Butter 100.00 61.44 34.46 0.34 3.76 Cheese 100.00 83.34 12.96 0.15 3.55 Beef 100.00 50.33 31.66 0.39 17.63 Mutton/Goat Meat 100.00 88.77 4.31 0.24 6.69 Eggs 100.00 27.64 36.00 0.11 36.24 Honey 100.00 38.31 58.49 0.41 2.79 Bees Wax 100.00 43.81 35.81 0.09 20.30 Sheep hair 100.00 55.16 40.55 - 4.29 Skin 100.00 56.14 38.74 0.28 4.85 Hide 100.00 41.64 52.40 0.22 5.73 Arera 100.00 69.03 1.79 0.19 28.99 Chicken Meat - - - - - Camel Meat 100.00 61.59 6.72 - 31.70
Figure 2: Percentages of Livestock product utilization
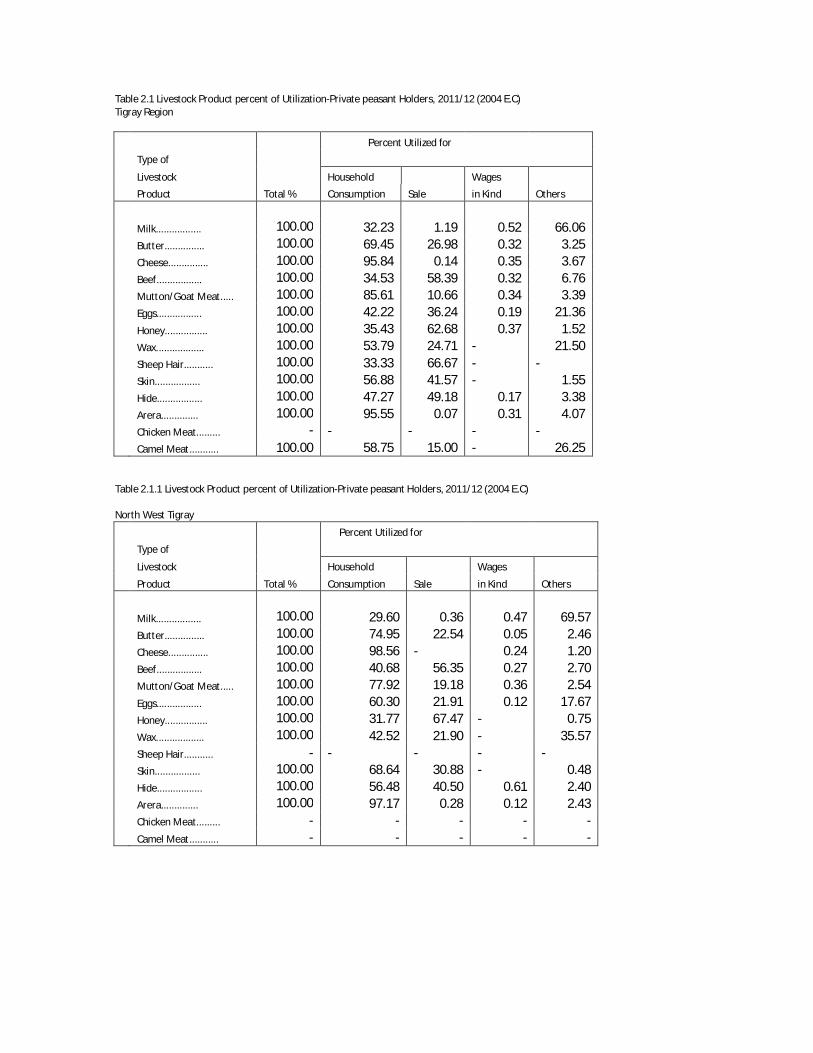
Table 2.1 Livestock Product percent of Utilization-Private peasant Holders, 2011/12 (2004 E.C) Tigray Region
Percent Utilized for
Type of
Livestock Household Wages
Product Total % Consumption Sale in Kind Others
Milk................. 100.00 32.23 1.19 0.52 66.06 Butter............... 100.00 69.45 26.98 0.32 3.25 Cheese............... 100.00 95.84 0.14 0.35 3.67 Beef................. 100.00 34.53 58.39 0.32 6.76 Mutton/Goat Meat..... 100.00 85.61 10.66 0.34 3.39 Eggs................. 100.00 42.22 36.24 0.19 21.36 Honey................ 100.00 35.43 62.68 0.37 1.52 Wax.................. 100.00 53.79 24.71 - 21.50 Sheep Hair........... 100.00 33.33 66.67 - - Skin................. 100.00 56.88 41.57 - 1.55 Hide................. 100.00 47.27 49.18 0.17 3.38 Arera.............. 100.00 95.55 0.07 0.31 4.07 Chicken Meat......... - - - - - Camel Meat........... 100.00 58.75 15.00 - 26.25
Table 2.1.1 Livestock Product percent of Utilization-Private peasant Holders, 2011/12 (2004 E.C) North West Tigray
Percent Utilized for
Type of
Livestock Household Wages
Product Total % Consumption Sale in Kind Others
Milk................. 100.00 29.60 0.36 0.47 69.57 Butter............... 100.00 74.95 22.54 0.05 2.46 Cheese............... 100.00 98.56 - 0.24 1.20 Beef................. 100.00 40.68 56.35 0.27 2.70 Mutton/Goat Meat..... 100.00 77.92 19.18 0.36 2.54 Eggs................. 100.00 60.30 21.91 0.12 17.67 Honey................ 100.00 31.77 67.47 - 0.75 Wax.................. 100.00 42.52 21.90 - 35.57 Sheep Hair........... - - - - - Skin................. 100.00 68.64 30.88 - 0.48 Hide................. 100.00 56.48 40.50 0.61 2.40 Arera.............. 100.00 97.17 0.28 0.12 2.43 Chicken Meat......... - - - - - Camel Meat........... - - - - -

Table 2.1.2 Livestock Product percent of Utilization-Private peasant Holders, 2011/12 (2004 E.C) Central Tigray
Percent Utilized for
Type of
Livestock Household Wages
Product Total % Consumption Sale in Kind Others
Milk................. 100.00 28.47 0.71 0.44 70.38 Butter............... 100.00 75.05 22.13 0.05 2.77 Cheese............... 100.00 99.67 0.12 0.05 0.16 Beef................. 100.00 14.44 61.67 - 23.89 Mutton/Goat Meat..... 100.00 88.77 6.71 0.11 4.41 Eggs................. 100.00 36.09 38.38 - 25.52 Honey................ 100.00 27.99 69.15 0.88 1.98 Wax.................. 100.00 85.62 14.38 - - Sheep Hair........... 100.00 100.00 - - - Skin................. 100.00 74.62 20.62 - 4.76 Hide................. 100.00 51.49 40.07 - 8.45 Arera.............. 100.00 99.05 - - 0.95 Chicken Meat......... - - - - - Camel Meat........... - - - - -
Table 2.1.3 Livestock Product percent of Utilization-Private peasant Holders, 2011/12 (2004 E.C) East Tigray
Percent Utilized for
Type of
Livestock Household Wages
Product Total % Consumption Sale in Kind Others
Milk................. 100.00 21.54 - - 78.46 Butter............... 100.00 50.27 45.50 - 4.23 Cheese............... 100.00 96.88 3.13 - - Beef................. 100.00 17.50 - - 82.50 Mutton/Goat Meat..... 100.00 95.00 - - 5.00 Eggs................. 100.00 20.13 72.61 - 7.26 Honey................ 100.00 52.13 47.25 - 0.63 Wax.................. 100.00 100.00 - - - Sheep Hair........... - - - - - Skin................. 100.00 50.00 - - 50.00 Hide................. 100.00 22.22 77.78 - - Arera.............. 100.00 100.00 - - - Chicken Meat......... - - - - - Camel Meat........... - - - - -
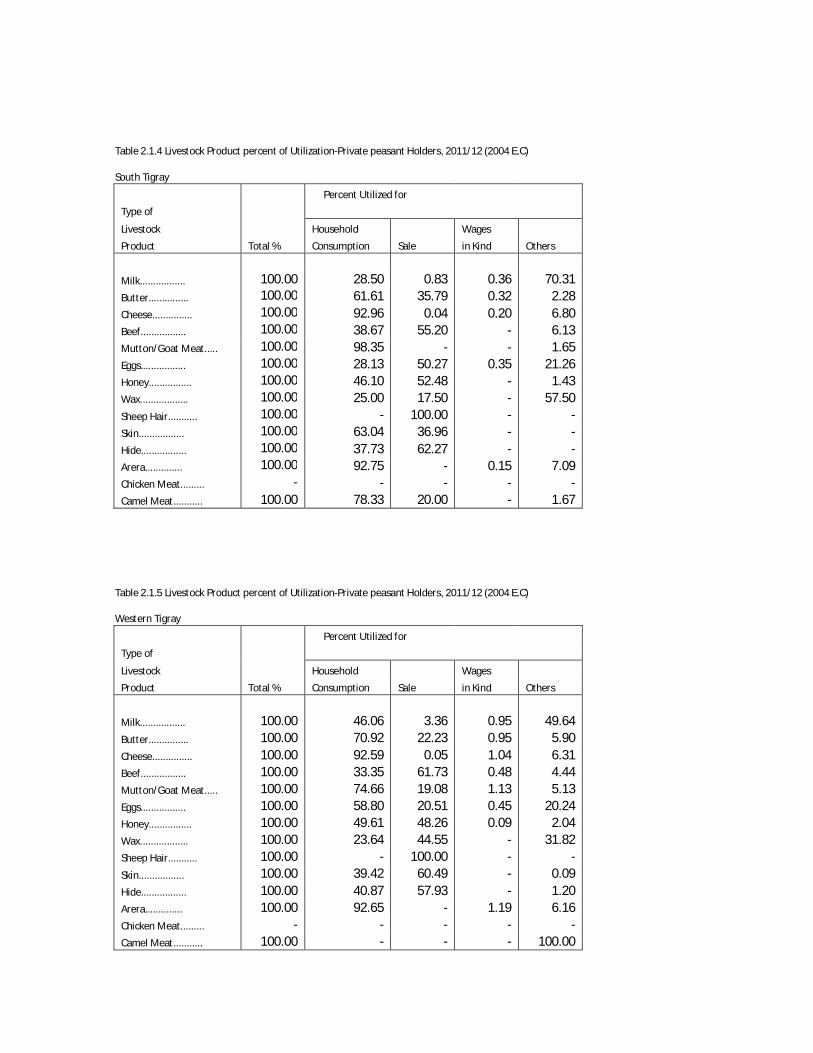
Table 2.1.4 Livestock Product percent of Utilization-Private peasant Holders, 2011/12 (2004 E.C) South Tigray
Percent Utilized for
Type of
Livestock Household Wages
Product Total % Consumption Sale in Kind Others
Milk................. 100.00 28.50 0.83 0.36 70.31 Butter............... 100.00 61.61 35.79 0.32 2.28 Cheese............... 100.00 92.96 0.04 0.20 6.80 Beef................. 100.00 38.67 55.20 - 6.13 Mutton/Goat Meat..... 100.00 98.35 - - 1.65 Eggs................. 100.00 28.13 50.27 0.35 21.26 Honey................ 100.00 46.10 52.48 - 1.43 Wax.................. 100.00 25.00 17.50 - 57.50 Sheep Hair........... 100.00 - 100.00 - - Skin................. 100.00 63.04 36.96 - - Hide................. 100.00 37.73 62.27 - - Arera.............. 100.00 92.75 - 0.15 7.09 Chicken Meat......... - - - - - Camel Meat........... 100.00 78.33 20.00 - 1.67
Table 2.1.5 Livestock Product percent of Utilization-Private peasant Holders, 2011/12 (2004 E.C) Western Tigray
Percent Utilized for
Type of
Livestock Household Wages
Product Total % Consumption Sale in Kind Others
Milk................. 100.00 46.06 3.36 0.95 49.64 Butter............... 100.00 70.92 22.23 0.95 5.90 Cheese............... 100.00 92.59 0.05 1.04 6.31 Beef................. 100.00 33.35 61.73 0.48 4.44 Mutton/Goat Meat..... 100.00 74.66 19.08 1.13 5.13 Eggs................. 100.00 58.80 20.51 0.45 20.24 Honey................ 100.00 49.61 48.26 0.09 2.04 Wax.................. 100.00 23.64 44.55 - 31.82 Sheep Hair........... 100.00 - 100.00 - - Skin................. 100.00 39.42 60.49 - 0.09 Hide................. 100.00 40.87 57.93 - 1.20 Arera.............. 100.00 92.65 - 1.19 6.16 Chicken Meat......... - - - - - Camel Meat........... 100.00 - - - 100.00
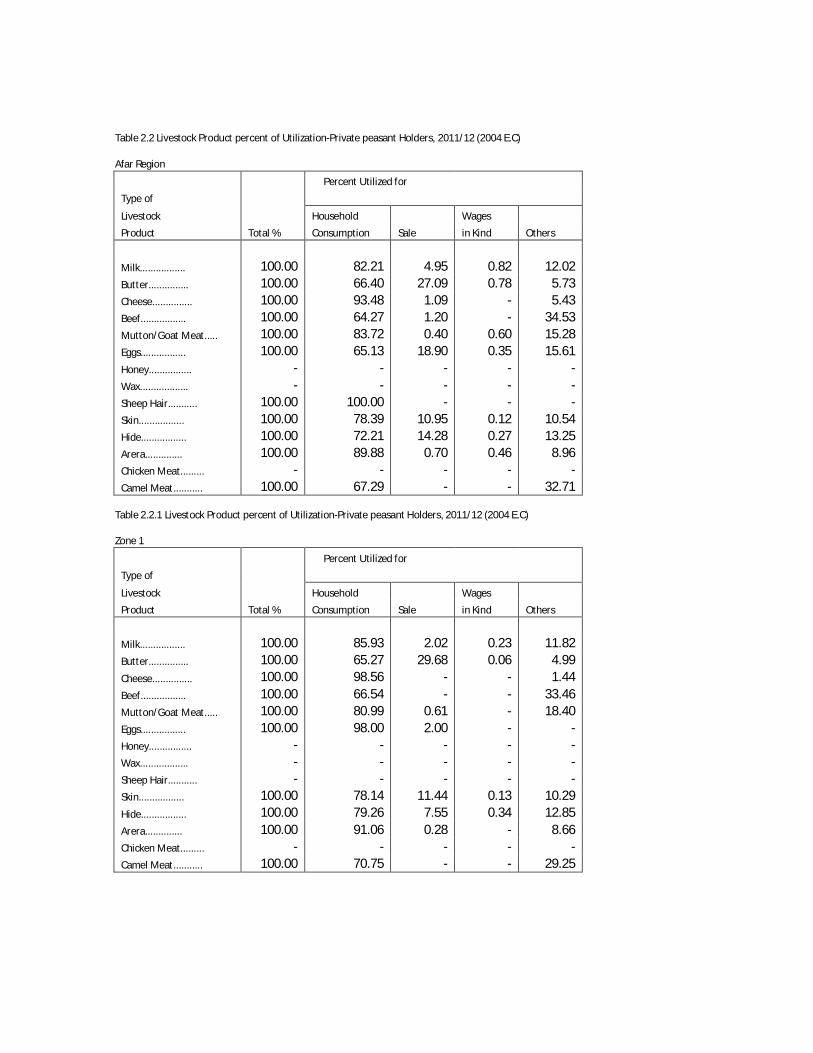
Table 2.2 Livestock Product percent of Utilization-Private peasant Holders, 2011/12 (2004 E.C) Afar Region
Percent Utilized for
Type of
Livestock Household Wages
Product Total % Consumption Sale in Kind Others
Milk................. 100.00 82.21 4.95 0.82 12.02 Butter............... 100.00 66.40 27.09 0.78 5.73 Cheese............... 100.00 93.48 1.09 - 5.43 Beef................. 100.00 64.27 1.20 - 34.53 Mutton/Goat Meat..... 100.00 83.72 0.40 0.60 15.28 Eggs................. 100.00 65.13 18.90 0.35 15.61 Honey................ - - - - - Wax.................. - - - - - Sheep Hair........... 100.00 100.00 - - - Skin................. 100.00 78.39 10.95 0.12 10.54 Hide................. 100.00 72.21 14.28 0.27 13.25 Arera.............. 100.00 89.88 0.70 0.46 8.96 Chicken Meat......... - - - - - Camel Meat........... 100.00 67.29 - - 32.71
Table 2.2.1 Livestock Product percent of Utilization-Private peasant Holders, 2011/12 (2004 E.C) Zone 1
Percent Utilized for
Type of
Livestock Household Wages
Product Total % Consumption Sale in Kind Others
Milk................. 100.00 85.93 2.02 0.23 11.82 Butter............... 100.00 65.27 29.68 0.06 4.99 Cheese............... 100.00 98.56 - - 1.44 Beef................. 100.00 66.54 - - 33.46 Mutton/Goat Meat..... 100.00 80.99 0.61 - 18.40 Eggs................. 100.00 98.00 2.00 - - Honey................ - - - - - Wax.................. - - - - - Sheep Hair........... - - - - - Skin................. 100.00 78.14 11.44 0.13 10.29 Hide................. 100.00 79.26 7.55 0.34 12.85 Arera.............. 100.00 91.06 0.28 - 8.66 Chicken Meat......... - - - - - Camel Meat........... 100.00 70.75 - - 29.25

Table 2.2.2 Livestock Product percent of Utilization-Private peasant Holders, 2011/12 (2004 E.C) Zone 3
Percent Utilized for
Type of
Livestock Household Wages
Product Total % Consumption Sale in Kind Others
Milk................. 100.00 76.34 9.59 1.75 12.33 Butter............... 100.00 68.05 23.28 1.85 6.83 Cheese............... 100.00 73.95 5.26 - 20.79 Beef................. 100.00 57.10 5.00 - 37.90 Mutton/Goat Meat..... 100.00 86.73 0.17 1.26 11.84 Eggs................. 100.00 63.00 20.00 0.38 16.62 Honey................ - - - - - Wax.................. - - - - - Sheep Hair........... 100.00 100.00 - - - Skin................. 100.00 80.81 6.25 - 12.94 Hide................. 100.00 66.73 19.50 0.21 13.56 Arera.............. 100.00 88.04 1.37 1.17 9.42 Chicken Meat......... - - - - - Camel Meat........... 100.00 50.00 - - 50.00
Table 2.3 Livestock Product percent of Utilization-Private peasant Holders, 2011/12 (2004 E.C) Amhara Region
Percent Utilized for
Type of
Livestock Household Wages
Product Total % Consumption Sale in Kind Others
Milk................. 100.00 35.79 0.18 0.76 63.27 Butter............... 100.00 61.24 35.12 0.27 3.38 Cheese............... 100.00 96.30 0.25 0.08 3.37 Beef................. 100.00 43.59 36.13 0.72 19.56 Mutton/Goat Meat..... 100.00 94.79 0.90 0.14 4.17 Eggs................. 100.00 19.16 43.05 0.13 37.67 Honey................ 100.00 38.76 58.13 0.41 2.70 Wax.................. 100.00 37.98 31.88 - 30.14 Sheep Hair........... 100.00 55.95 39.78 - 4.28 Skin................. 100.00 43.74 52.48 0.33 3.45 Hide................. 100.00 37.49 60.22 0.17 2.12 Arera.............. 100.00 68.38 0.23 0.18 31.21 Chicken Meat......... - - - - - Camel Meat........... 100.00 70.00 25.83 - 4.17
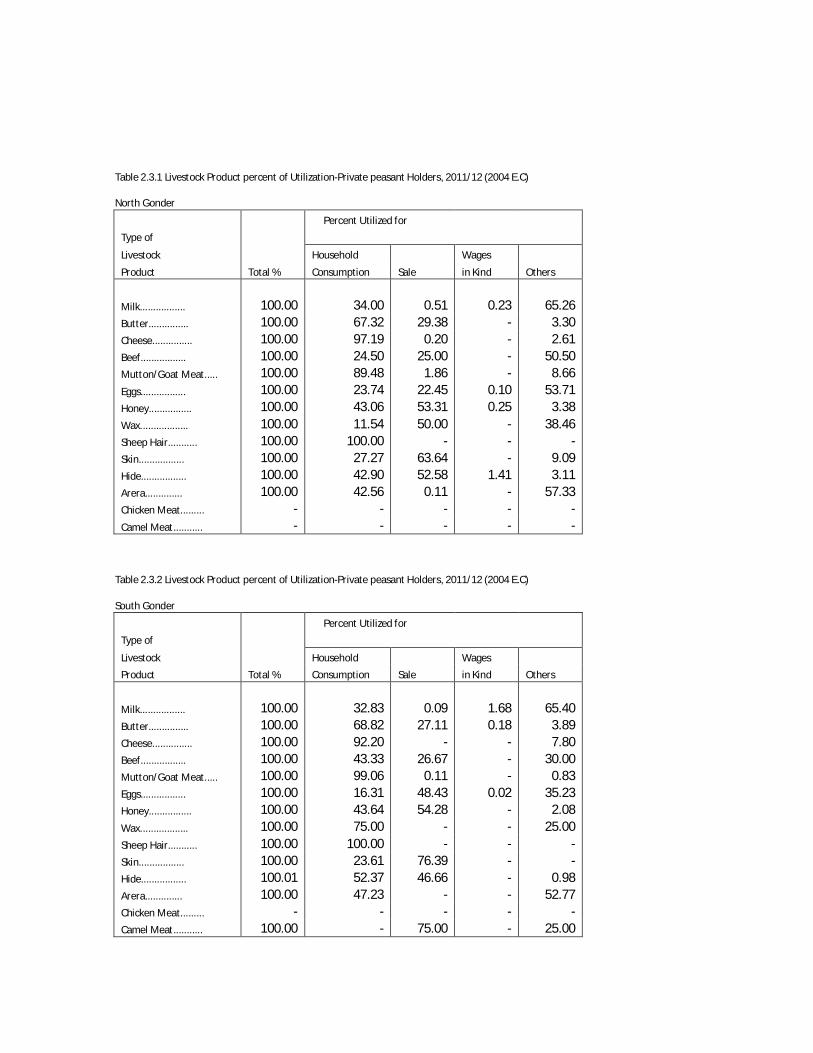
Table 2.3.1 Livestock Product percent of Utilization-Private peasant Holders, 2011/12 (2004 E.C) North Gonder
Percent Utilized for
Type of
Livestock Household Wages
Product Total % Consumption Sale in Kind Others
Milk................. 100.00 34.00 0.51 0.23 65.26 Butter............... 100.00 67.32 29.38 - 3.30 Cheese............... 100.00 97.19 0.20 - 2.61 Beef................. 100.00 24.50 25.00 - 50.50 Mutton/Goat Meat..... 100.00 89.48 1.86 - 8.66 Eggs................. 100.00 23.74 22.45 0.10 53.71 Honey................ 100.00 43.06 53.31 0.25 3.38 Wax.................. 100.00 11.54 50.00 - 38.46 Sheep Hair........... 100.00 100.00 - - - Skin................. 100.00 27.27 63.64 - 9.09 Hide................. 100.00 42.90 52.58 1.41 3.11 Arera.............. 100.00 42.56 0.11 - 57.33 Chicken Meat......... - - - - - Camel Meat........... - - - - -
Table 2.3.2 Livestock Product percent of Utilization-Private peasant Holders, 2011/12 (2004 E.C) South Gonder
Percent Utilized for
Type of
Livestock Household Wages
Product Total % Consumption Sale in Kind Others
Milk................. 100.00 32.83 0.09 1.68 65.40 Butter............... 100.00 68.82 27.11 0.18 3.89 Cheese............... 100.00 92.20 - - 7.80 Beef................. 100.00 43.33 26.67 - 30.00 Mutton/Goat Meat..... 100.00 99.06 0.11 - 0.83 Eggs................. 100.00 16.31 48.43 0.02 35.23 Honey................ 100.00 43.64 54.28 - 2.08 Wax.................. 100.00 75.00 - - 25.00 Sheep Hair........... 100.00 100.00 - - - Skin................. 100.00 23.61 76.39 - - Hide................. 100.01 52.37 46.66 - 0.98 Arera.............. 100.00 47.23 - - 52.77 Chicken Meat......... - - - - - Camel Meat........... 100.00 - 75.00 - 25.00

Table 2.3.3 Livestock Product percent of Utilization-Private peasant Holders, 2011/12 (2004 E.C) North Wolo
Percent Utilized for
Type of
Livestock Household Wages
Product Total % Consumption Sale in Kind Others
Milk................. 100.00 33.35 0.11 - 66.54 Butter............... 100.00 44.86 45.10 0.69 9.34 Cheese............... 100.00 95.56 - 0.17 4.26 Beef................. 100.00 31.54 48.08 - 20.38 Mutton/Goat Meat..... 100.00 96.98 0.26 - 2.75 Eggs................. 100.00 22.96 46.33 - 30.71 Honey................ 100.00 39.37 59.13 0.17 1.33 Wax.................. 100.00 31.67 31.67 - 36.67 Sheep Hair........... 100.00 62.62 37.38 - - Skin................. 100.00 54.79 45.21 - - Hide................. 100.00 39.65 60.35 - - Arera.............. 100.00 76.57 0.35 0.47 22.61 Chicken Meat......... - - - - - Camel Meat........... 100.00 100.00 - - -
Table 2.3.4 Livestock Product percent of Utilization-Private peasant Holders, 2011/12 (2004 E.C) South Wolo
Percent Utilized for
Type of
Livestock Household Wages
Product Total % Consumption Sale in Kind Others
Milk................. 100.00 42.94 0.44 - 56.62 Butter............... 100.01 58.84 38.34 0.42 2.41 Cheese............... 100.00 99.11 - - 0.89 Beef................. 100.00 38.03 48.83 - 13.14 Mutton/Goat Meat..... 100.00 89.95 1.49 - 8.55 Eggs................. 100.00 19.97 63.49 0.18 16.37 Honey................ 100.00 40.39 55.54 - 4.07 Wax.................. 100.00 56.46 28.15 - 15.38 Sheep Hair........... 100.00 78.05 21.95 - - Skin................. 100.00 45.12 54.88 - - Hide................. 100.00 28.96 71.04 - - Arera.............. 100.00 95.75 0.76 0.15 3.34 Chicken Meat......... - - - - - Camel Meat........... - - - - -
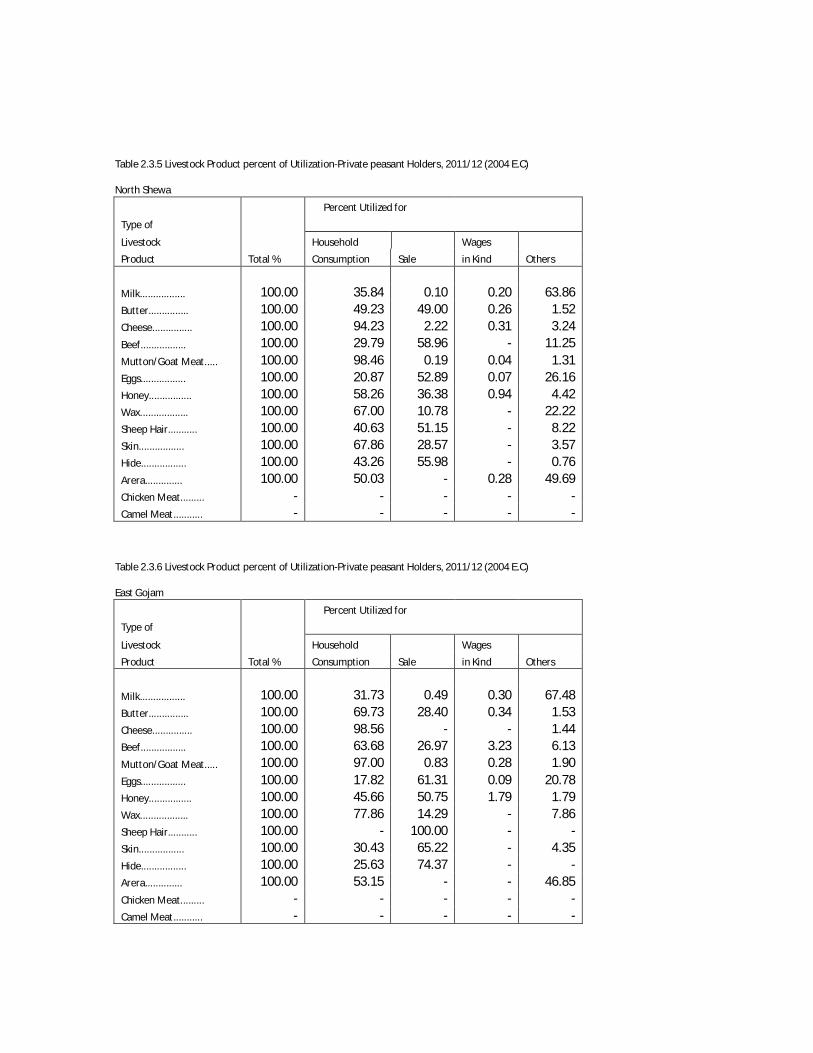
Table 2.3.5 Livestock Product percent of Utilization-Private peasant Holders, 2011/12 (2004 E.C) North Shewa
Percent Utilized for
Type of
Livestock Household Wages
Product Total % Consumption Sale in Kind Others
Milk................. 100.00 35.84 0.10 0.20 63.86 Butter............... 100.00 49.23 49.00 0.26 1.52 Cheese............... 100.00 94.23 2.22 0.31 3.24 Beef................. 100.00 29.79 58.96 - 11.25 Mutton/Goat Meat..... 100.00 98.46 0.19 0.04 1.31 Eggs................. 100.00 20.87 52.89 0.07 26.16 Honey................ 100.00 58.26 36.38 0.94 4.42 Wax.................. 100.00 67.00 10.78 - 22.22 Sheep Hair........... 100.00 40.63 51.15 - 8.22 Skin................. 100.00 67.86 28.57 - 3.57 Hide................. 100.00 43.26 55.98 - 0.76 Arera.............. 100.00 50.03 - 0.28 49.69 Chicken Meat......... - - - - - Camel Meat........... - - - - -
Table 2.3.6 Livestock Product percent of Utilization-Private peasant Holders, 2011/12 (2004 E.C) East Gojam
Percent Utilized for
Type of
Livestock Household Wages
Product Total % Consumption Sale in Kind Others
Milk................. 100.00 31.73 0.49 0.30 67.48 Butter............... 100.00 69.73 28.40 0.34 1.53 Cheese............... 100.00 98.56 - - 1.44 Beef................. 100.00 63.68 26.97 3.23 6.13 Mutton/Goat Meat..... 100.00 97.00 0.83 0.28 1.90 Eggs................. 100.00 17.82 61.31 0.09 20.78 Honey................ 100.00 45.66 50.75 1.79 1.79 Wax.................. 100.00 77.86 14.29 - 7.86 Sheep Hair........... 100.00 - 100.00 - - Skin................. 100.00 30.43 65.22 - 4.35 Hide................. 100.00 25.63 74.37 - - Arera.............. 100.00 53.15 - - 46.85 Chicken Meat......... - - - - - Camel Meat........... - - - - -
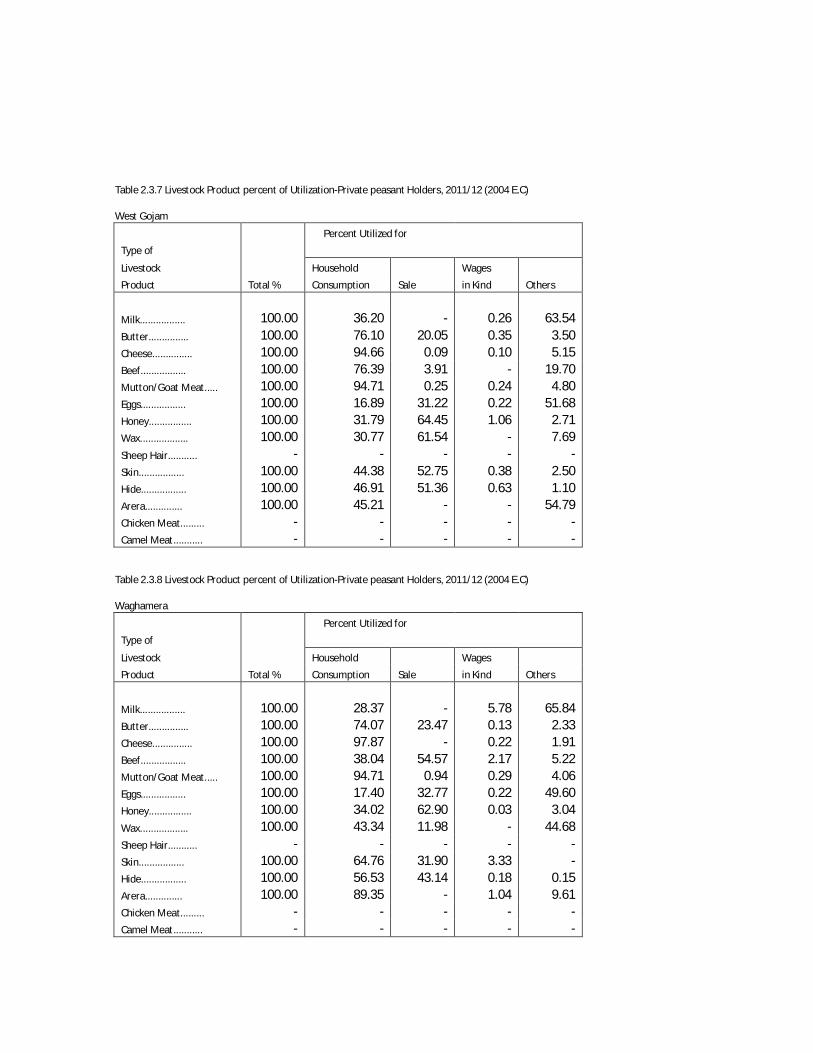
Table 2.3.7 Livestock Product percent of Utilization-Private peasant Holders, 2011/12 (2004 E.C) West Gojam
Percent Utilized for
Type of
Livestock Household Wages
Product Total % Consumption Sale in Kind Others
Milk................. 100.00 36.20 - 0.26 63.54 Butter............... 100.00 76.10 20.05 0.35 3.50 Cheese............... 100.00 94.66 0.09 0.10 5.15 Beef................. 100.00 76.39 3.91 - 19.70 Mutton/Goat Meat..... 100.00 94.71 0.25 0.24 4.80 Eggs................. 100.00 16.89 31.22 0.22 51.68 Honey................ 100.00 31.79 64.45 1.06 2.71 Wax.................. 100.00 30.77 61.54 - 7.69 Sheep Hair........... - - - - - Skin................. 100.00 44.38 52.75 0.38 2.50 Hide................. 100.00 46.91 51.36 0.63 1.10 Arera.............. 100.00 45.21 - - 54.79 Chicken Meat......... - - - - - Camel Meat........... - - - - -
Table 2.3.8 Livestock Product percent of Utilization-Private peasant Holders, 2011/12 (2004 E.C) Waghamera
Percent Utilized for
Type of
Livestock Household Wages
Product Total % Consumption Sale in Kind Others
Milk................. 100.00 28.37 - 5.78 65.84 Butter............... 100.00 74.07 23.47 0.13 2.33 Cheese............... 100.00 97.87 - 0.22 1.91 Beef................. 100.00 38.04 54.57 2.17 5.22 Mutton/Goat Meat..... 100.00 94.71 0.94 0.29 4.06 Eggs................. 100.00 17.40 32.77 0.22 49.60 Honey................ 100.00 34.02 62.90 0.03 3.04 Wax.................. 100.00 43.34 11.98 - 44.68 Sheep Hair........... - - - - - Skin................. 100.00 64.76 31.90 3.33 - Hide................. 100.00 56.53 43.14 0.18 0.15 Arera.............. 100.00 89.35 - 1.04 9.61 Chicken Meat......... - - - - - Camel Meat........... - - - - -
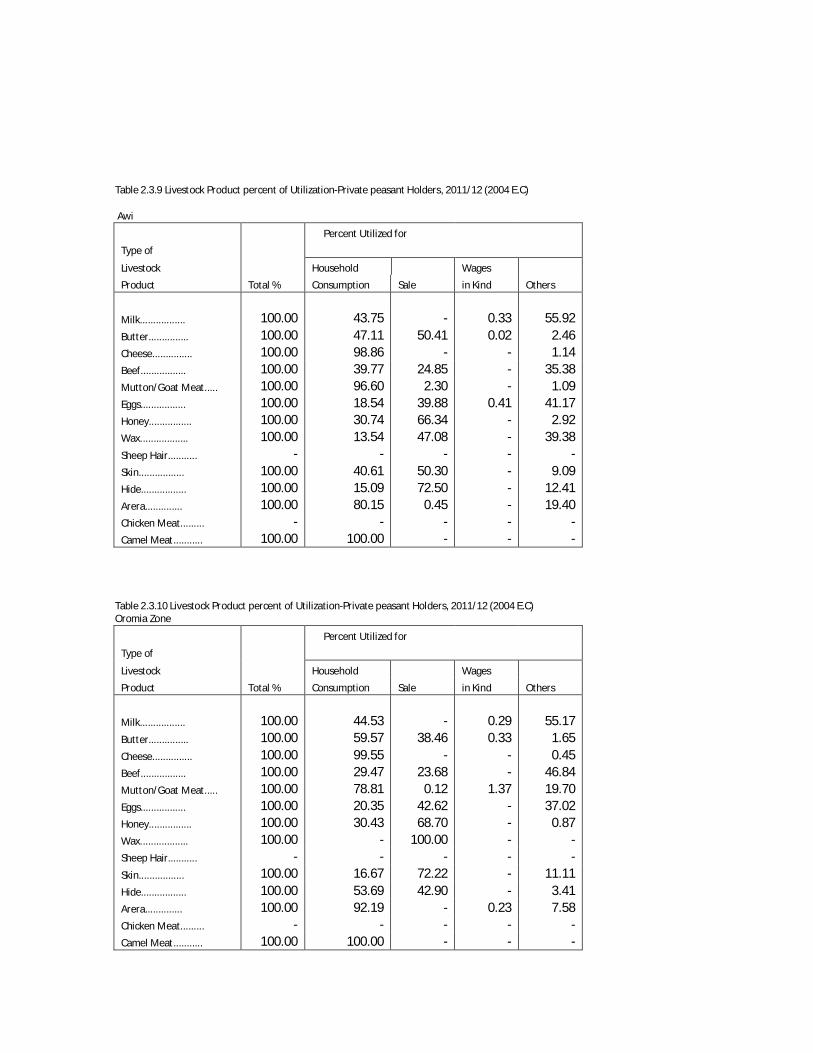
Table 2.3.9 Livestock Product percent of Utilization-Private peasant Holders, 2011/12 (2004 E.C) Awi
Percent Utilized for
Type of
Livestock Household Wages
Product Total % Consumption Sale in Kind Others
Milk................. 100.00 43.75 - 0.33 55.92 Butter............... 100.00 47.11 50.41 0.02 2.46 Cheese............... 100.00 98.86 - - 1.14 Beef................. 100.00 39.77 24.85 - 35.38 Mutton/Goat Meat..... 100.00 96.60 2.30 - 1.09 Eggs................. 100.00 18.54 39.88 0.41 41.17 Honey................ 100.00 30.74 66.34 - 2.92 Wax.................. 100.00 13.54 47.08 - 39.38 Sheep Hair........... - - - - - Skin................. 100.00 40.61 50.30 - 9.09 Hide................. 100.00 15.09 72.50 - 12.41 Arera.............. 100.00 80.15 0.45 - 19.40 Chicken Meat......... - - - - - Camel Meat........... 100.00 100.00 - - -
Table 2.3.10 Livestock Product percent of Utilization-Private peasant Holders, 2011/12 (2004 E.C) Oromia Zone
Percent Utilized for
Type of
Livestock Household Wages
Product Total % Consumption Sale in Kind Others
Milk................. 100.00 44.53 - 0.29 55.17 Butter............... 100.00 59.57 38.46 0.33 1.65 Cheese............... 100.00 99.55 - - 0.45 Beef................. 100.00 29.47 23.68 - 46.84 Mutton/Goat Meat..... 100.00 78.81 0.12 1.37 19.70 Eggs................. 100.00 20.35 42.62 - 37.02 Honey................ 100.00 30.43 68.70 - 0.87 Wax.................. 100.00 - 100.00 - - Sheep Hair........... - - - - - Skin................. 100.00 16.67 72.22 - 11.11 Hide................. 100.00 53.69 42.90 - 3.41 Arera.............. 100.00 92.19 - 0.23 7.58 Chicken Meat......... - - - - - Camel Meat........... 100.00 100.00 - - -

Table 2.3.11 Livestock Product percent of Utilization-Private peasant Holders, 2011/12 (2004 E.C) Argoba Special
Percent Utilized for
Type of
Livestock Household Wages
Product Total % Consumption Sale in Kind Others
Milk................. 100.00 26.43 - 0.09 73.48 Butter............... 100.00 55.56 41.60 0.25 2.59 Cheese............... - - - - - Beef................. 100.00 39.23 34.23 - 26.54 Mutton/Goat Meat..... 100.00 88.64 1.36 0.08 9.92 Eggs................. 100.00 8.75 27.87 0.10 63.27 Honey................ 100.00 26.25 73.13 - 0.63 Wax.................. 100.00 60.00 40.00 - - Sheep Hair........... - - - - - Skin................. 100.00 50.00 50.00 - - Hide................. 100.00 32.58 67.42 - - Arera.............. 100.00 96.41 0.63 - 2.97 Chicken Meat......... - - - - - Camel Meat........... 100.00 20.00 80.00 - -
Table 2.4 Livestock Product percent of Utilization-Private peasant Holders, 2011/12 (2004 E.C) Oromia Region
Percent Utilized for
Type of
Livestock Household Wages
Product Total % Consumption Sale in Kind Others
Milk................. 100.00 47.86 3.41 0.10 48.63 Butter............... 100.00 60.66 34.99 0.09 4.27 Cheese............... 100.00 85.55 9.47 0.04 4.93 Beef................. 100.00 52.06 34.74 0.06 13.14 Mutton/Goat Meat..... 100.00 91.48 2.89 0.08 5.55 Eggs................. 100.00 30.63 37.09 0.11 32.17 Honey................ 100.00 45.86 50.31 0.41 3.43 Wax.................. 100.00 33.20 46.63 0.07 20.10 Sheep Hair........... 100.00 25.00 75.00 - - Skin................. 100.00 47.36 45.86 0.49 6.29 Hide................. 100.00 30.37 62.09 0.32 7.22 Arera.............. 100.00 72.50 0.82 0.06 26.62 Chicken Meat......... - - - - - Camel Meat........... 100.00 77.00 - - 23.00
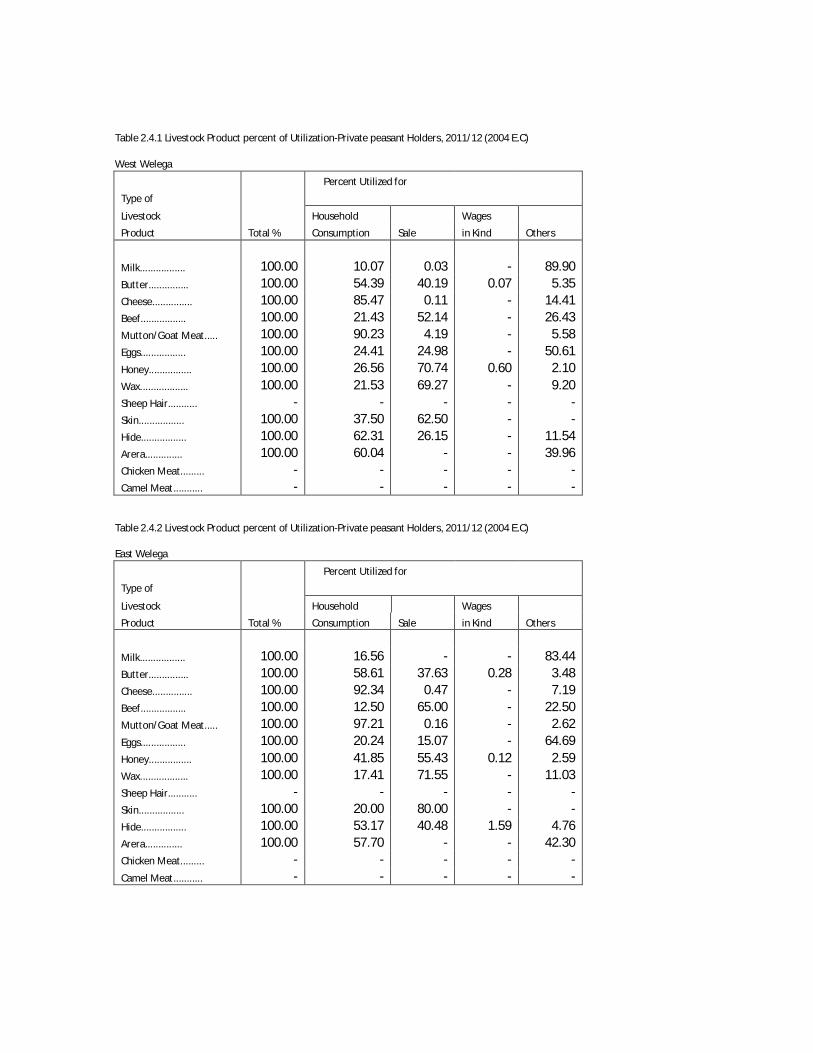
Table 2.4.1 Livestock Product percent of Utilization-Private peasant Holders, 2011/12 (2004 E.C) West Welega
Percent Utilized for
Type of
Livestock Household Wages
Product Total % Consumption Sale in Kind Others
Milk................. 100.00 10.07 0.03 - 89.90 Butter............... 100.00 54.39 40.19 0.07 5.35 Cheese............... 100.00 85.47 0.11 - 14.41 Beef................. 100.00 21.43 52.14 - 26.43 Mutton/Goat Meat..... 100.00 90.23 4.19 - 5.58 Eggs................. 100.00 24.41 24.98 - 50.61 Honey................ 100.00 26.56 70.74 0.60 2.10 Wax.................. 100.00 21.53 69.27 - 9.20 Sheep Hair........... - - - - - Skin................. 100.00 37.50 62.50 - - Hide................. 100.00 62.31 26.15 - 11.54 Arera.............. 100.00 60.04 - - 39.96 Chicken Meat......... - - - - - Camel Meat........... - - - - -
Table 2.4.2 Livestock Product percent of Utilization-Private peasant Holders, 2011/12 (2004 E.C) East Welega
Percent Utilized for
Type of
Livestock Household Wages
Product Total % Consumption Sale in Kind Others
Milk................. 100.00 16.56 - - 83.44 Butter............... 100.00 58.61 37.63 0.28 3.48 Cheese............... 100.00 92.34 0.47 - 7.19 Beef................. 100.00 12.50 65.00 - 22.50 Mutton/Goat Meat..... 100.00 97.21 0.16 - 2.62 Eggs................. 100.00 20.24 15.07 - 64.69 Honey................ 100.00 41.85 55.43 0.12 2.59 Wax.................. 100.00 17.41 71.55 - 11.03 Sheep Hair........... - - - - - Skin................. 100.00 20.00 80.00 - - Hide................. 100.00 53.17 40.48 1.59 4.76 Arera.............. 100.00 57.70 - - 42.30 Chicken Meat......... - - - - - Camel Meat........... - - - - -

Table 2.4.3 Livestock Product percent of Utilization-Private peasant Holders, 2011/12 (2004 E.C) Illubabor
Percent Utilized for
Type of
Livestock Household Wages
Product Total % Consumption Sale in Kind Others
Milk................. 100.00 87.80 1.53 - 10.67 Butter............... 100.00 68.31 28.82 - 2.88 Cheese............... 100.00 93.17 2.49 0.03 4.31 Beef................. 100.00 67.50 32.50 - - Mutton/Goat Meat..... 100.00 92.03 3.66 0.23 4.07 Eggs................. 100.00 55.89 37.36 0.26 6.48 Honey................ 100.00 44.29 51.50 0.04 4.18 Wax.................. 100.00 68.00 25.20 0.80 6.00 Sheep Hair........... - - - - - Skin................. 100.00 11.11 88.89 - - Hide................. 100.00 5.41 74.32 1.35 18.92 Arera.............. 100.00 94.87 0.32 - 4.81 Chicken Meat......... - - - - - Camel Meat........... 100.00 100.00 - - -
Table 2.4.5 Livestock Product percent of Utilization-Private peasant Holders, 2011/12 (2004 E.C) Jimma
Percent Utilized for
Type of
Livestock Household Wages
Product Total % Consumption Sale in Kind Others
Milk................. 100.00 88.17 0.55 0.42 10.86 Butter............... 100.00 66.30 30.38 0.16 3.15 Cheese............... 100.00 75.58 20.30 0.20 3.92 Beef................. 100.00 52.50 45.00 - 2.50 Mutton/Goat Meat..... 100.00 86.19 9.24 - 4.58 Eggs................. 100.00 43.91 40.21 0.08 15.81 Honey................ 100.00 54.00 39.91 1.59 4.50 Wax.................. 100.00 19.69 27.19 - 53.13 Sheep Hair........... - - - - - Skin................. 100.00 7.14 64.29 - 28.57 Hide................. 100.00 7.55 77.36 1.89 13.21 Arera.............. 100.00 88.02 3.48 - 8.51 Chicken Meat......... - - - - - Camel Meat........... - - - - -
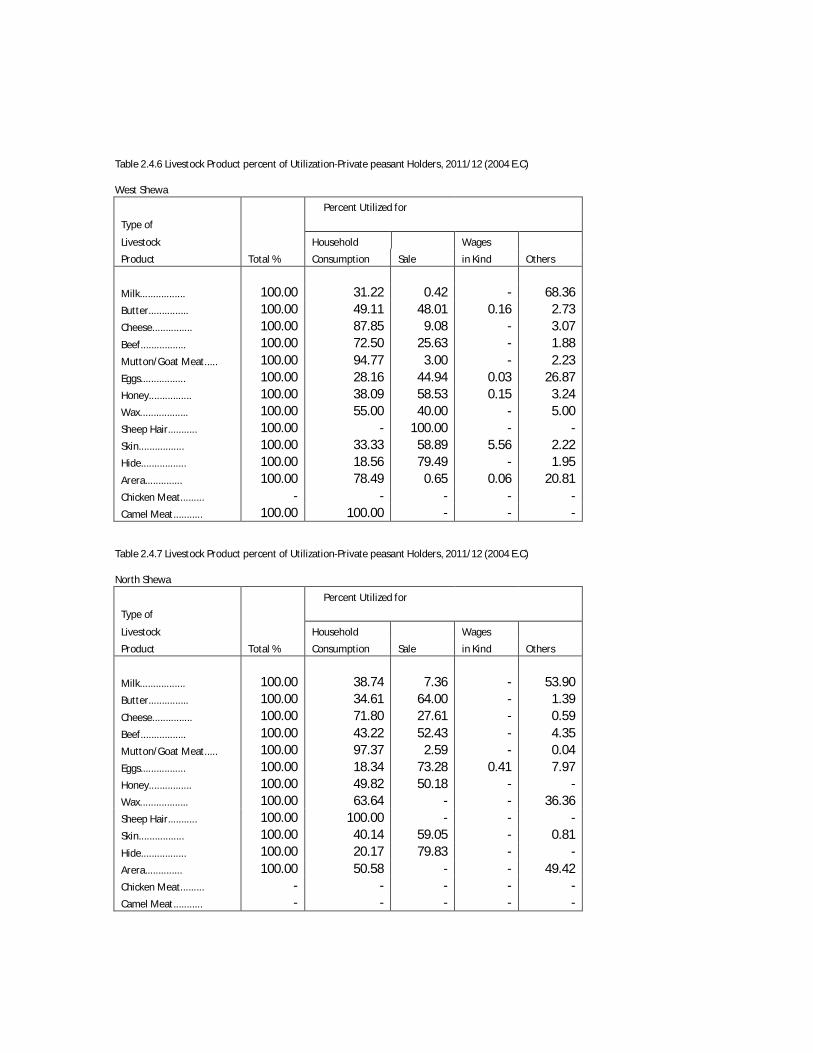
Table 2.4.6 Livestock Product percent of Utilization-Private peasant Holders, 2011/12 (2004 E.C) West Shewa
Percent Utilized for
Type of
Livestock Household Wages
Product Total % Consumption Sale in Kind Others
Milk................. 100.00 31.22 0.42 - 68.36 Butter............... 100.00 49.11 48.01 0.16 2.73 Cheese............... 100.00 87.85 9.08 - 3.07 Beef................. 100.00 72.50 25.63 - 1.88 Mutton/Goat Meat..... 100.00 94.77 3.00 - 2.23 Eggs................. 100.00 28.16 44.94 0.03 26.87 Honey................ 100.00 38.09 58.53 0.15 3.24 Wax.................. 100.00 55.00 40.00 - 5.00 Sheep Hair........... 100.00 - 100.00 - - Skin................. 100.00 33.33 58.89 5.56 2.22 Hide................. 100.00 18.56 79.49 - 1.95 Arera.............. 100.00 78.49 0.65 0.06 20.81 Chicken Meat......... - - - - - Camel Meat........... 100.00 100.00 - - -
Table 2.4.7 Livestock Product percent of Utilization-Private peasant Holders, 2011/12 (2004 E.C) North Shewa
Percent Utilized for
Type of
Livestock Household Wages
Product Total % Consumption Sale in Kind Others
Milk................. 100.00 38.74 7.36 - 53.90 Butter............... 100.00 34.61 64.00 - 1.39 Cheese............... 100.00 71.80 27.61 - 0.59 Beef................. 100.00 43.22 52.43 - 4.35 Mutton/Goat Meat..... 100.00 97.37 2.59 - 0.04 Eggs................. 100.00 18.34 73.28 0.41 7.97 Honey................ 100.00 49.82 50.18 - - Wax.................. 100.00 63.64 - - 36.36 Sheep Hair........... 100.00 100.00 - - - Skin................. 100.00 40.14 59.05 - 0.81 Hide................. 100.00 20.17 79.83 - - Arera.............. 100.00 50.58 - - 49.42 Chicken Meat......... - - - - - Camel Meat........... - - - - -

Table 2.4.8 Livestock Product percent of Utilization-Private peasant Holders, 2011/12 (2004 E.C) East Shewa
Percent Utilized for
Type of
Livestock Household Wages
Product Total % Consumption Sale in Kind Others
Milk................. 100.00 57.73 0.80 - 41.47 Butter............... 100.00 71.17 25.64 - 3.19 Cheese............... 100.00 89.00 9.66 - 1.34 Beef................. 100.00 31.44 57.44 - 11.11 Mutton/Goat Meat..... 100.00 90.31 7.92 - 1.77 Eggs................. 100.00 30.66 49.23 0.35 19.76 Honey................ 100.00 79.71 20.29 - - Wax.................. - - - - - Sheep Hair........... - - - - - Skin................. 100.00 62.50 25.00 - 12.50 Hide................. 100.00 43.80 53.04 - 3.15 Arera.............. 100.00 88.06 - - 11.94 Chicken Meat......... - - - - - Camel Meat........... - - - - -
Table 2.4.9 Livestock Product percent of Utilization-Private peasant Holders, 2011/12 (2004 E.C) Arsi
Percent Utilized for
Type of
Livestock Household Wages
Product Total % Consumption Sale in Kind Others
Milk................. 100.00 64.19 0.44 0.10 35.27 Butter............... 100.00 69.44 24.65 0.04 5.87 Cheese............... 100.00 94.81 2.99 - 2.20 Beef................. 100.00 46.67 28.00 - 25.33 Mutton/Goat Meat..... 100.00 94.07 - - 5.93 Eggs................. 100.00 34.92 42.34 - 22.75 Honey................ 100.00 69.03 26.05 - 4.92 Wax.................. 100.00 41.67 - - 58.33 Sheep Hair........... - - - - - Skin................. 100.00 47.21 48.53 0.44 3.82 Hide................. 100.00 29.72 42.50 - 27.78 Arera.............. 100.00 79.64 0.16 0.07 20.13 Chicken Meat......... - - - - - Camel Meat........... - - - - -
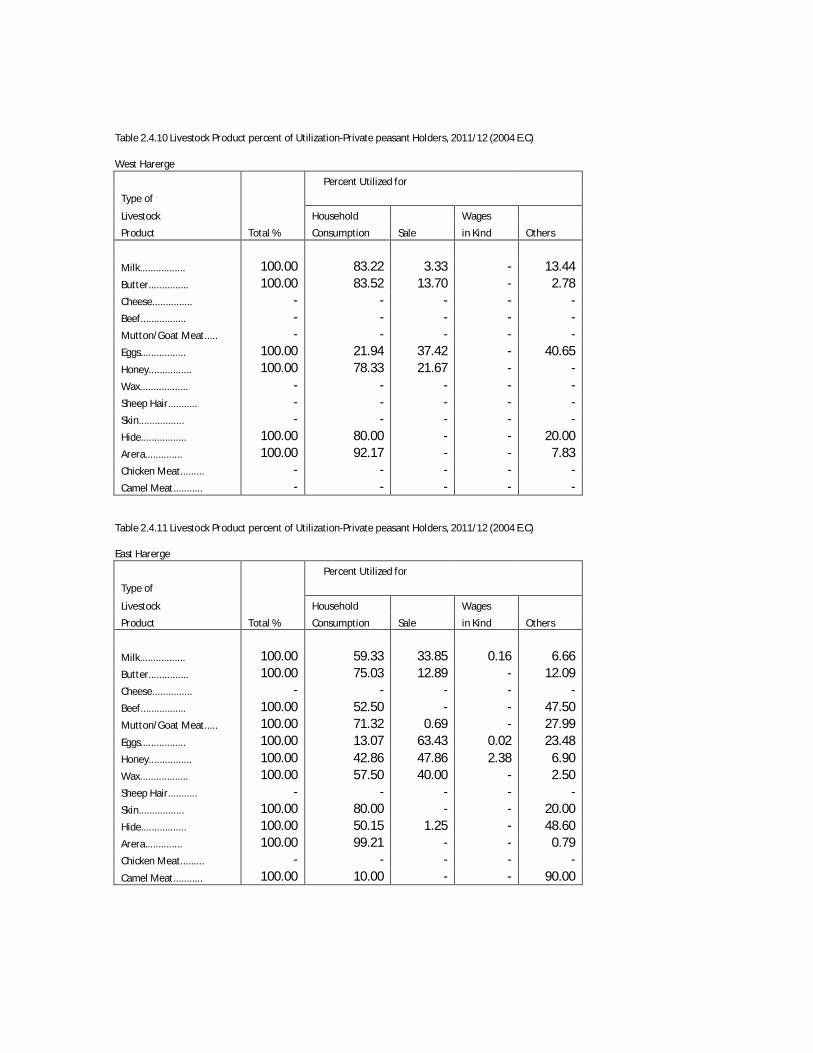
Table 2.4.10 Livestock Product percent of Utilization-Private peasant Holders, 2011/12 (2004 E.C) West Harerge
Percent Utilized for
Type of
Livestock Household Wages
Product Total % Consumption Sale in Kind Others
Milk................. 100.00 83.22 3.33 - 13.44 Butter............... 100.00 83.52 13.70 - 2.78 Cheese............... - - - - - Beef................. - - - - - Mutton/Goat Meat..... - - - - - Eggs................. 100.00 21.94 37.42 - 40.65 Honey................ 100.00 78.33 21.67 - - Wax.................. - - - - - Sheep Hair........... - - - - - Skin................. - - - - - Hide................. 100.00 80.00 - - 20.00 Arera.............. 100.00 92.17 - - 7.83 Chicken Meat......... - - - - - Camel Meat........... - - - - -
Table 2.4.11 Livestock Product percent of Utilization-Private peasant Holders, 2011/12 (2004 E.C) East Harerge
Percent Utilized for
Type of
Livestock Household Wages
Product Total % Consumption Sale in Kind Others
Milk................. 100.00 59.33 33.85 0.16 6.66 Butter............... 100.00 75.03 12.89 - 12.09 Cheese............... - - - - - Beef................. 100.00 52.50 - - 47.50 Mutton/Goat Meat..... 100.00 71.32 0.69 - 27.99 Eggs................. 100.00 13.07 63.43 0.02 23.48 Honey................ 100.00 42.86 47.86 2.38 6.90 Wax.................. 100.00 57.50 40.00 - 2.50 Sheep Hair........... - - - - - Skin................. 100.00 80.00 - - 20.00 Hide................. 100.00 50.15 1.25 - 48.60 Arera.............. 100.00 99.21 - - 0.79 Chicken Meat......... - - - - - Camel Meat........... 100.00 10.00 - - 90.00
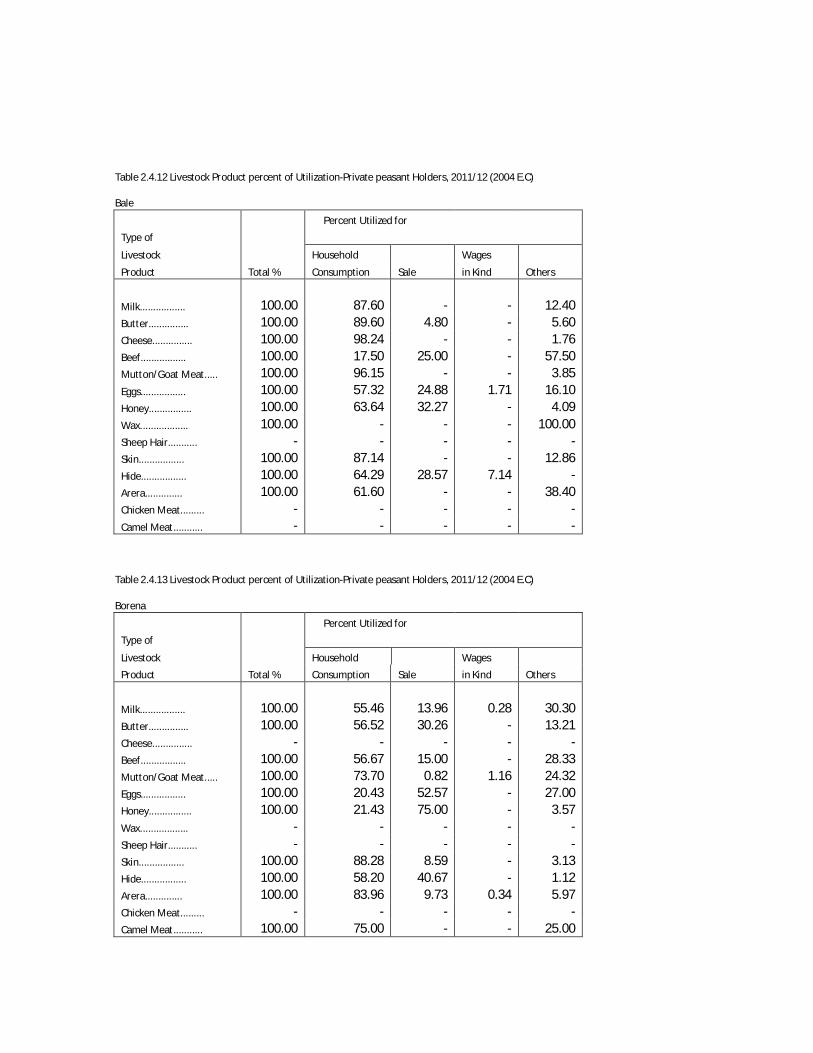
Table 2.4.12 Livestock Product percent of Utilization-Private peasant Holders, 2011/12 (2004 E.C) Bale
Percent Utilized for
Type of
Livestock Household Wages
Product Total % Consumption Sale in Kind Others
Milk................. 100.00 87.60 - - 12.40 Butter............... 100.00 89.60 4.80 - 5.60 Cheese............... 100.00 98.24 - - 1.76 Beef................. 100.00 17.50 25.00 - 57.50 Mutton/Goat Meat..... 100.00 96.15 - - 3.85 Eggs................. 100.00 57.32 24.88 1.71 16.10 Honey................ 100.00 63.64 32.27 - 4.09 Wax.................. 100.00 - - - 100.00 Sheep Hair........... - - - - - Skin................. 100.00 87.14 - - 12.86 Hide................. 100.00 64.29 28.57 7.14 - Arera.............. 100.00 61.60 - - 38.40 Chicken Meat......... - - - - - Camel Meat........... - - - - -
Table 2.4.13 Livestock Product percent of Utilization-Private peasant Holders, 2011/12 (2004 E.C) Borena
Percent Utilized for
Type of
Livestock Household Wages
Product Total % Consumption Sale in Kind Others
Milk................. 100.00 55.46 13.96 0.28 30.30 Butter............... 100.00 56.52 30.26 - 13.21 Cheese............... - - - - - Beef................. 100.00 56.67 15.00 - 28.33 Mutton/Goat Meat..... 100.00 73.70 0.82 1.16 24.32 Eggs................. 100.00 20.43 52.57 - 27.00 Honey................ 100.00 21.43 75.00 - 3.57 Wax.................. - - - - - Sheep Hair........... - - - - - Skin................. 100.00 88.28 8.59 - 3.13 Hide................. 100.00 58.20 40.67 - 1.12 Arera.............. 100.00 83.96 9.73 0.34 5.97 Chicken Meat......... - - - - - Camel Meat........... 100.00 75.00 - - 25.00
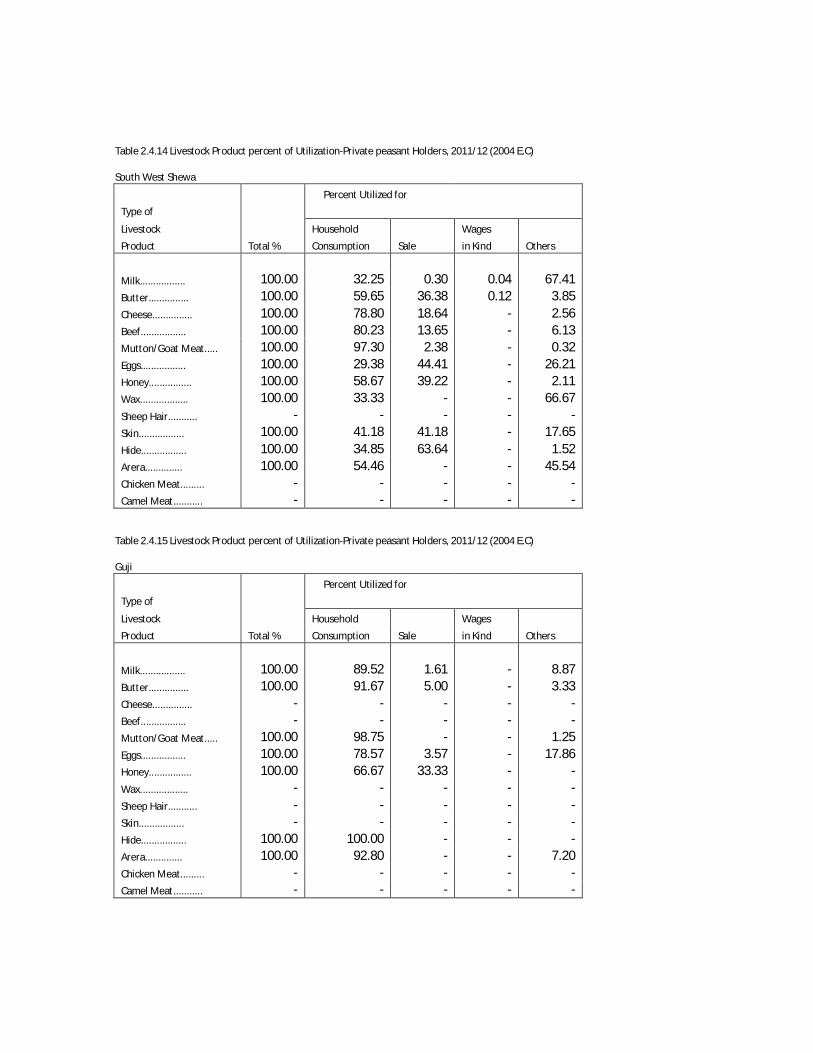
Table 2.4.14 Livestock Product percent of Utilization-Private peasant Holders, 2011/12 (2004 E.C) South West Shewa
Percent Utilized for
Type of
Livestock Household Wages
Product Total % Consumption Sale in Kind Others
Milk................. 100.00 32.25 0.30 0.04 67.41 Butter............... 100.00 59.65 36.38 0.12 3.85 Cheese............... 100.00 78.80 18.64 - 2.56 Beef................. 100.00 80.23 13.65 - 6.13 Mutton/Goat Meat..... 100.00 97.30 2.38 - 0.32 Eggs................. 100.00 29.38 44.41 - 26.21 Honey................ 100.00 58.67 39.22 - 2.11 Wax.................. 100.00 33.33 - - 66.67 Sheep Hair........... - - - - - Skin................. 100.00 41.18 41.18 - 17.65 Hide................. 100.00 34.85 63.64 - 1.52 Arera.............. 100.00 54.46 - - 45.54 Chicken Meat......... - - - - - Camel Meat........... - - - - -
Table 2.4.15 Livestock Product percent of Utilization-Private peasant Holders, 2011/12 (2004 E.C) Guji
Percent Utilized for
Type of
Livestock Household Wages
Product Total % Consumption Sale in Kind Others
Milk................. 100.00 89.52 1.61 - 8.87 Butter............... 100.00 91.67 5.00 - 3.33 Cheese............... - - - - - Beef................. - - - - - Mutton/Goat Meat..... 100.00 98.75 - - 1.25 Eggs................. 100.00 78.57 3.57 - 17.86 Honey................ 100.00 66.67 33.33 - - Wax.................. - - - - - Sheep Hair........... - - - - - Skin................. - - - - - Hide................. 100.00 100.00 - - - Arera.............. 100.00 92.80 - - 7.20 Chicken Meat......... - - - - - Camel Meat........... - - - - -

Table 2.4.16 Livestock Product percent of Utilization-Private peasant Holders, 2011/12 (2004 E.C) Kelem
Percent Utilized for
Type of
Livestock Household Wages
Product Total % Consumption Sale in Kind Others
Milk................. 100.00 21.90 0.22 - 77.88 Butter............... 100.00 58.59 35.21 0.04 6.16 Cheese............... 100.00 86.81 0.36 0.22 12.61 Beef................. - - - - - Mutton/Goat Meat..... 100.00 90.00 5.45 - 4.55 Eggs................. 100.00 29.03 16.02 0.15 54.81 Honey................ 100.00 42.50 52.72 0.22 4.57 Wax.................. 100.00 37.50 54.17 - 8.33 Sheep Hair........... - - - - - Skin................. 100.00 - 100.00 - - Hide................. 100.00 33.33 65.15 - 1.52 Arera.............. 100.00 60.45 0.08 - 39.47 Chicken Meat......... - - - - - Camel Meat........... - - - - -
Table 2.4.17 Livestock Product percent of Utilization-Private peasant Holders, 2011/12 (2004 E.C) Horogudru
Percent Utilized for
Type of
Livestock Household Wages
Product Total % Consumption Sale in Kind Others
Milk................. 100.00 15.95 0.03 0.24 83.78 Butter............... 100.00 56.36 40.07 0.14 3.43 Cheese............... 100.00 90.03 - - 9.97 Beef................. 100.00 37.42 49.85 - 12.73 Mutton/Goat Meat..... 100.00 94.27 2.34 - 3.39 Eggs................. 100.00 21.28 18.76 - 59.96 Honey................ 100.00 35.13 60.88 0.25 3.75 Wax.................. 100.00 38.42 31.05 - 30.53 Sheep Hair........... 100.00 - 100.00 - - Skin................. 100.00 50.00 50.00 - - Hide................. 100.00 21.25 77.08 - 1.67 Arera.............. 100.00 63.66 0.27 0.33 35.74 Chicken Meat......... - - - - - Camel Meat........... 100.00 100.00 - - -
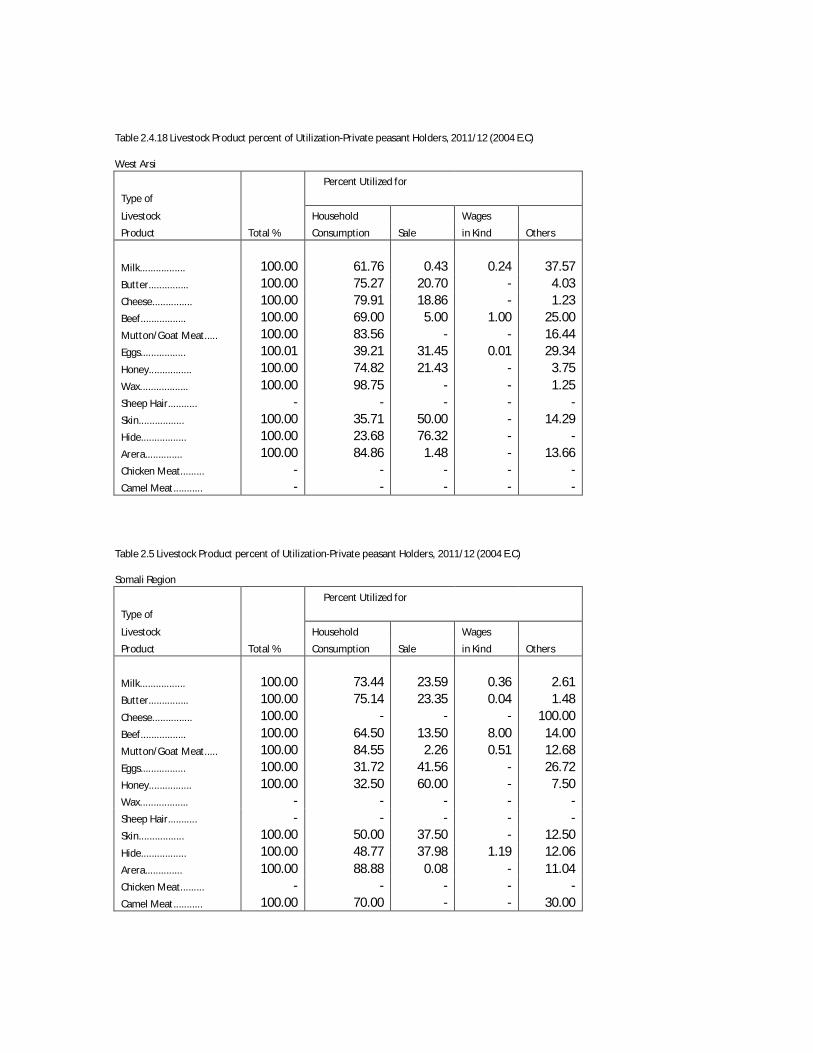
Table 2.4.18 Livestock Product percent of Utilization-Private peasant Holders, 2011/12 (2004 E.C) West Arsi
Percent Utilized for
Type of
Livestock Household Wages
Product Total % Consumption Sale in Kind Others
Milk................. 100.00 61.76 0.43 0.24 37.57 Butter............... 100.00 75.27 20.70 - 4.03 Cheese............... 100.00 79.91 18.86 - 1.23 Beef................. 100.00 69.00 5.00 1.00 25.00 Mutton/Goat Meat..... 100.00 83.56 - - 16.44 Eggs................. 100.01 39.21 31.45 0.01 29.34 Honey................ 100.00 74.82 21.43 - 3.75 Wax.................. 100.00 98.75 - - 1.25 Sheep Hair........... - - - - - Skin................. 100.00 35.71 50.00 - 14.29 Hide................. 100.00 23.68 76.32 - - Arera.............. 100.00 84.86 1.48 - 13.66 Chicken Meat......... - - - - - Camel Meat........... - - - - -
Table 2.5 Livestock Product percent of Utilization-Private peasant Holders, 2011/12 (2004 E.C) Somali Region
Percent Utilized for
Type of
Livestock Household Wages
Product Total % Consumption Sale in Kind Others
Milk................. 100.00 73.44 23.59 0.36 2.61 Butter............... 100.00 75.14 23.35 0.04 1.48 Cheese............... 100.00 - - - 100.00 Beef................. 100.00 64.50 13.50 8.00 14.00 Mutton/Goat Meat..... 100.00 84.55 2.26 0.51 12.68 Eggs................. 100.00 31.72 41.56 - 26.72 Honey................ 100.00 32.50 60.00 - 7.50 Wax.................. - - - - - Sheep Hair........... - - - - - Skin................. 100.00 50.00 37.50 - 12.50 Hide................. 100.00 48.77 37.98 1.19 12.06 Arera.............. 100.00 88.88 0.08 - 11.04 Chicken Meat......... - - - - - Camel Meat........... 100.00 70.00 - - 30.00
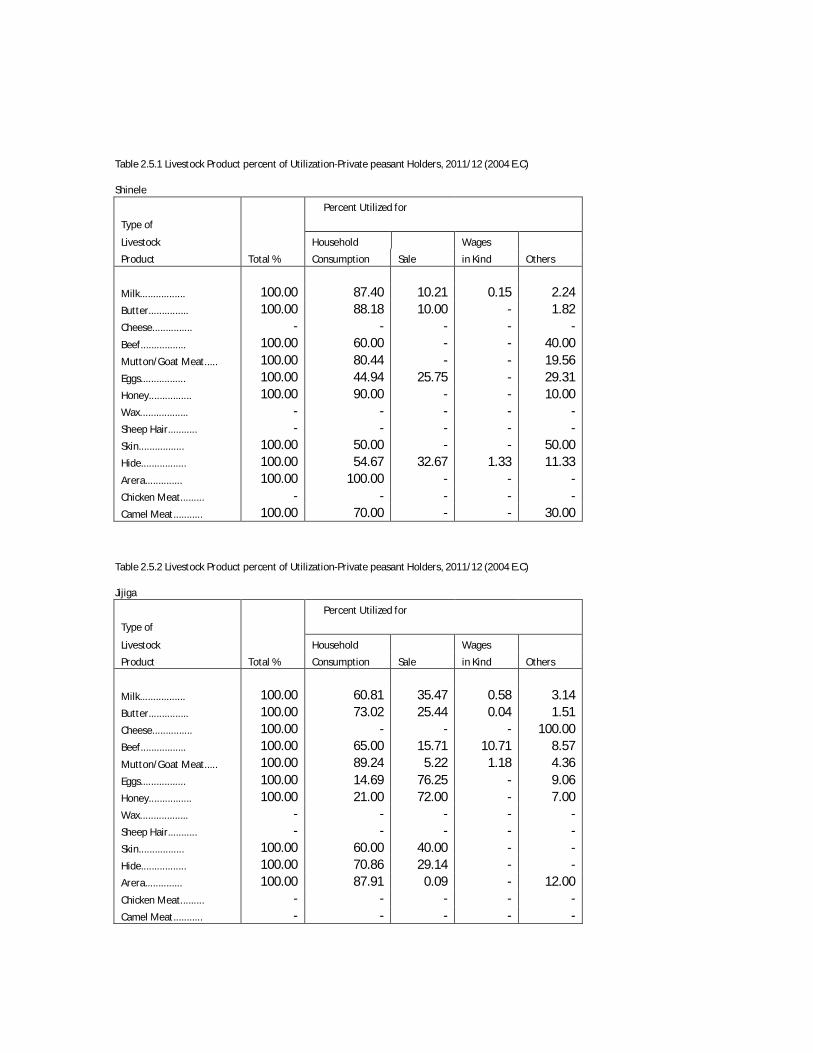
Table 2.5.1 Livestock Product percent of Utilization-Private peasant Holders, 2011/12 (2004 E.C) Shinele
Percent Utilized for
Type of
Livestock Household Wages
Product Total % Consumption Sale in Kind Others
Milk................. 100.00 87.40 10.21 0.15 2.24 Butter............... 100.00 88.18 10.00 - 1.82 Cheese............... - - - - - Beef................. 100.00 60.00 - - 40.00 Mutton/Goat Meat..... 100.00 80.44 - - 19.56 Eggs................. 100.00 44.94 25.75 - 29.31 Honey................ 100.00 90.00 - - 10.00 Wax.................. - - - - - Sheep Hair........... - - - - - Skin................. 100.00 50.00 - - 50.00 Hide................. 100.00 54.67 32.67 1.33 11.33 Arera.............. 100.00 100.00 - - - Chicken Meat......... - - - - - Camel Meat........... 100.00 70.00 - - 30.00
Table 2.5.2 Livestock Product percent of Utilization-Private peasant Holders, 2011/12 (2004 E.C) Jijiga
Percent Utilized for
Type of
Livestock Household Wages
Product Total % Consumption Sale in Kind Others
Milk................. 100.00 60.81 35.47 0.58 3.14 Butter............... 100.00 73.02 25.44 0.04 1.51 Cheese............... 100.00 - - - 100.00 Beef................. 100.00 65.00 15.71 10.71 8.57 Mutton/Goat Meat..... 100.00 89.24 5.22 1.18 4.36 Eggs................. 100.00 14.69 76.25 - 9.06 Honey................ 100.00 21.00 72.00 - 7.00 Wax.................. - - - - - Sheep Hair........... - - - - - Skin................. 100.00 60.00 40.00 - - Hide................. 100.00 70.86 29.14 - - Arera.............. 100.00 87.91 0.09 - 12.00 Chicken Meat......... - - - - - Camel Meat........... - - - - -

Table 2.5.3 Livestock Product percent of Utilization-Private peasant Holders, 2011/12 (2004 E.C) Liben
Percent Utilized for
Type of
Livestock Household Wages
Product Total % Consumption Sale in Kind Others
Milk................. 100.00 85.83 12.38 0.07 1.72 Butter............... 100.00 100.00 - - - Cheese............... - - - - - Beef................. 100.00 70.00 25.00 5.00 - Mutton/Goat Meat..... 100.00 81.91 - - 18.09 Eggs................. 100.00 32.53 37.53 - 29.93 Honey................ - - - - - Wax.................. - - - - - Sheep Hair........... - - - - - Skin................. 100.00 - 100.00 - - Hide................. 100.00 10.96 56.16 2.74 30.14 Arera.............. 100.00 100.00 - - - Chicken Meat......... - - - - - Camel Meat........... - - - - -
Table 2.6 Livestock Product percent of Utilization-Private peasant Holders, 2011/12 (2004 E.C) Benshangule-Gumuz Region
Percent Utilized for
Type of
Livestock Household Wages
Product Total % Consumption Sale in Kind Others
Milk................. 100.00 40.20 2.17 0.48 57.15 Butter............... 100.00 48.12 48.43 0.36 3.09 Cheese............... 100.00 91.85 2.22 0.09 5.85 Beef................. 100.00 52.25 35.69 0.39 11.67 Mutton/Goat Meat..... 100.00 79.77 13.74 0.27 6.22 Eggs................. 100.00 19.31 16.35 0.11 64.22 Honey................ 100.00 24.73 71.61 1.09 2.58 Wax.................. 100.00 57.52 28.93 - 13.55 Sheep Hair........... - - - - - Skin................. 100.00 52.94 41.18 - 5.88 Hide................. 100.00 48.25 46.01 - 5.75 Arera.............. 100.00 78.05 0.52 0.18 21.25 Chicken Meat......... - - - - - Camel Meat........... - - - - -

Table 2.6.1 Livestock Product percent of Utilization-Private peasant Holders, 2011/12 (2004 E.C) Metekel
Percent Utilized for
Type of
Livestock Household Wages
Product Total % Consumption Sale in Kind Others
Milk................. 100.00 46.39 0.07 0.74 52.80 Butter............... 100.00 50.05 46.07 0.52 3.36 Cheese............... 100.00 92.48 2.43 0.12 4.98 Beef................. 100.00 65.43 18.29 - 16.29 Mutton/Goat Meat..... 100.00 82.75 8.54 - 8.71 Eggs................. 100.00 22.37 15.94 - 61.69 Honey................ 100.00 31.60 65.77 1.84 0.79 Wax.................. 100.00 8.00 56.00 - 36.00 Sheep Hair........... - - - - - Skin................. 100.00 20.83 70.83 - 8.33 Hide................. 100.00 26.30 69.15 - 4.56 Arera.............. 100.00 78.71 - 0.18 21.11 Chicken Meat......... - - - - - Camel Meat........... - - - - -
Table 2.6.2 Livestock Product percent of Utilization-Private peasant Holders, 2011/12 (2004 E.C) Asosa
Percent Utilized for
Type of
Livestock Household Wages
Product Total % Consumption Sale in Kind Others
Milk................. 100.00 37.50 19.72 - 42.78 Butter............... 100.00 36.35 63.65 - - Cheese............... 100.00 93.33 6.67 - - Beef................. 100.00 46.67 46.67 6.67 - Mutton/Goat Meat..... 100.00 77.71 16.00 0.32 5.97 Eggs................. 100.00 22.96 25.26 0.48 51.29 Honey................ 100.00 22.04 68.52 1.11 8.33 Wax.................. 100.00 65.38 12.31 - 22.31 Sheep Hair........... - - - - - Skin................. 100.00 91.67 8.33 - - Hide................. 100.00 48.37 45.51 - 6.12 Arera.............. 100.00 60.75 8.00 1.00 30.25 Chicken Meat......... - - - - - Camel Meat........... - - - - -
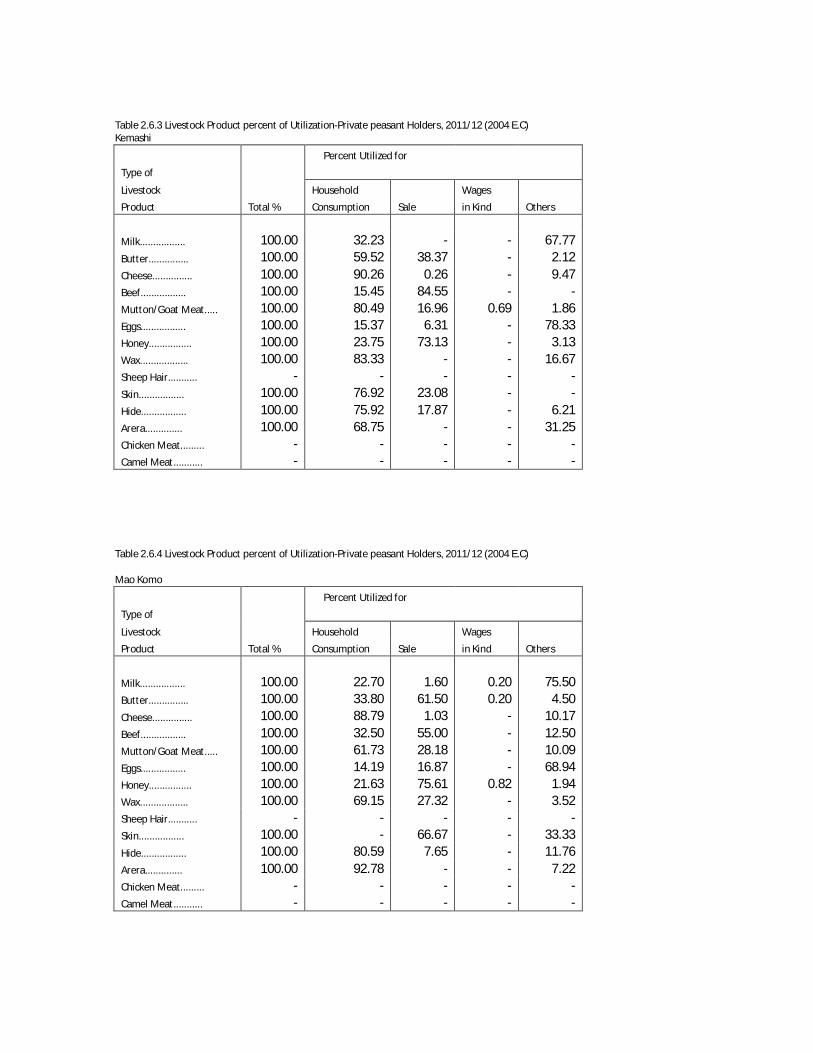
Table 2.6.3 Livestock Product percent of Utilization-Private peasant Holders, 2011/12 (2004 E.C) Kemashi
Percent Utilized for
Type of
Livestock Household Wages
Product Total % Consumption Sale in Kind Others
Milk................. 100.00 32.23 - - 67.77 Butter............... 100.00 59.52 38.37 - 2.12 Cheese............... 100.00 90.26 0.26 - 9.47 Beef................. 100.00 15.45 84.55 - - Mutton/Goat Meat..... 100.00 80.49 16.96 0.69 1.86 Eggs................. 100.00 15.37 6.31 - 78.33 Honey................ 100.00 23.75 73.13 - 3.13 Wax.................. 100.00 83.33 - - 16.67 Sheep Hair........... - - - - - Skin................. 100.00 76.92 23.08 - - Hide................. 100.00 75.92 17.87 - 6.21 Arera.............. 100.00 68.75 - - 31.25 Chicken Meat......... - - - - - Camel Meat........... - - - - -
Table 2.6.4 Livestock Product percent of Utilization-Private peasant Holders, 2011/12 (2004 E.C) Mao Komo
Percent Utilized for
Type of
Livestock Household Wages
Product Total % Consumption Sale in Kind Others
Milk................. 100.00 22.70 1.60 0.20 75.50 Butter............... 100.00 33.80 61.50 0.20 4.50 Cheese............... 100.00 88.79 1.03 - 10.17 Beef................. 100.00 32.50 55.00 - 12.50 Mutton/Goat Meat..... 100.00 61.73 28.18 - 10.09 Eggs................. 100.00 14.19 16.87 - 68.94 Honey................ 100.00 21.63 75.61 0.82 1.94 Wax.................. 100.00 69.15 27.32 - 3.52 Sheep Hair........... - - - - - Skin................. 100.00 - 66.67 - 33.33 Hide................. 100.00 80.59 7.65 - 11.76 Arera.............. 100.00 92.78 - - 7.22 Chicken Meat......... - - - - - Camel Meat........... - - - - -
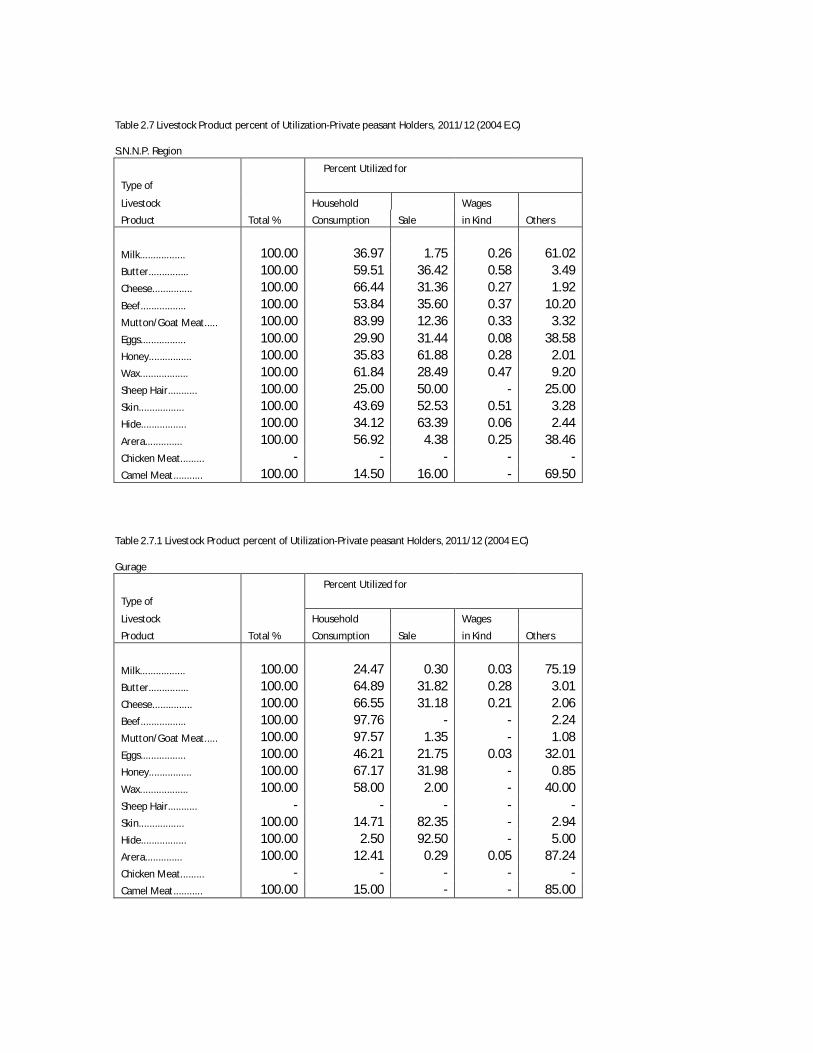
Table 2.7 Livestock Product percent of Utilization-Private peasant Holders, 2011/12 (2004 E.C) S.N.N.P. Region
Percent Utilized for
Type of
Livestock Household Wages
Product Total % Consumption Sale in Kind Others
Milk................. 100.00 36.97 1.75 0.26 61.02 Butter............... 100.00 59.51 36.42 0.58 3.49 Cheese............... 100.00 66.44 31.36 0.27 1.92 Beef................. 100.00 53.84 35.60 0.37 10.20 Mutton/Goat Meat..... 100.00 83.99 12.36 0.33 3.32 Eggs................. 100.00 29.90 31.44 0.08 38.58 Honey................ 100.00 35.83 61.88 0.28 2.01 Wax.................. 100.00 61.84 28.49 0.47 9.20 Sheep Hair........... 100.00 25.00 50.00 - 25.00 Skin................. 100.00 43.69 52.53 0.51 3.28 Hide................. 100.00 34.12 63.39 0.06 2.44 Arera.............. 100.00 56.92 4.38 0.25 38.46 Chicken Meat......... - - - - - Camel Meat........... 100.00 14.50 16.00 - 69.50
Table 2.7.1 Livestock Product percent of Utilization-Private peasant Holders, 2011/12 (2004 E.C) Gurage
Percent Utilized for
Type of
Livestock Household Wages
Product Total % Consumption Sale in Kind Others
Milk................. 100.00 24.47 0.30 0.03 75.19 Butter............... 100.00 64.89 31.82 0.28 3.01 Cheese............... 100.00 66.55 31.18 0.21 2.06 Beef................. 100.00 97.76 - - 2.24 Mutton/Goat Meat..... 100.00 97.57 1.35 - 1.08 Eggs................. 100.00 46.21 21.75 0.03 32.01 Honey................ 100.00 67.17 31.98 - 0.85 Wax.................. 100.00 58.00 2.00 - 40.00 Sheep Hair........... - - - - - Skin................. 100.00 14.71 82.35 - 2.94 Hide................. 100.00 2.50 92.50 - 5.00 Arera.............. 100.00 12.41 0.29 0.05 87.24 Chicken Meat......... - - - - - Camel Meat........... 100.00 15.00 - - 85.00

Table 2.7.2 Livestock Product percent of Utilization-Private peasant Holders, 2011/12 (2004 E.C) Hadiya
Percent Utilized for
Type of
Livestock Household Wages
Product Total % Consumption Sale in Kind Others
Milk................. 100.00 24.68 0.48 0.04 74.80 Butter............... 100.00 60.77 35.17 0.64 3.43 Cheese............... 100.00 65.12 33.84 0.16 0.88 Beef................. 100.00 100.00 - - - Mutton/Goat Meat..... 100.00 100.00 - - - Eggs................. 100.00 24.42 16.92 - 58.66 Honey................ 100.00 48.18 51.24 0.29 0.29 Wax.................. 100.00 7.50 25.00 - 67.50 Sheep Hair........... 100.00 - 100.00 - - Skin................. 100.00 37.50 62.50 - - Hide................. 100.00 5.77 94.23 - - Arera.............. 100.00 54.43 0.15 - 45.42 Chicken Meat......... - - - - - Camel Meat........... 100.00 - - - 100.00
Table 2.7.3 Livestock Product percent of Utilization-Private peasant Holders, 2011/12 (2004 E.C) Kembata-Tembaro
Percent Utilized for
Type of
Livestock Household Wages
Product Total % Consumption Sale in Kind Others
Milk................. 100.00 21.04 0.50 0.04 78.42 Butter............... 100.00 59.15 36.84 0.24 3.77 Cheese............... 100.00 59.20 40.48 - 0.32 Beef................. 100.00 70.00 - - 30.00 Mutton/Goat Meat..... 100.00 95.00 5.00 - - Eggs................. 100.00 26.79 22.93 - 50.29 Honey................ 100.00 44.91 54.06 - 1.03 Wax.................. 100.00 70.00 30.00 - - Sheep Hair........... - - - - - Skin................. 100.00 50.00 50.00 - - Hide................. 100.00 14.44 77.78 - 7.78 Arera.............. 100.00 52.20 1.36 0.14 46.30 Chicken Meat......... - - - - - Camel Meat........... - - - - -

Table 2.7.4 Livestock Product percent of Utilization-Private peasant Holders, 2011/12 (2004 E.C) Sidama
Percent Utilized for
Type of
Livestock Household Wages
Product Total % Consumption Sale in Kind Others
Milk................. 100.00 21.59 0.79 0.12 77.51 Butter............... 100.00 56.41 39.37 0.23 3.98 Cheese............... - - - - - Beef................. 100.00 96.00 - - 4.00 Mutton/Goat Meat..... 100.00 94.29 - - 5.71 Eggs................. 100.00 21.53 43.69 - 34.78 Honey................ 100.00 70.91 26.36 - 2.73 Wax.................. 100.00 100.00 - - - Sheep Hair........... - - - - - Skin................. 100.00 50.00 50.00 - - Hide................. 100.00 31.67 68.33 - - Arera.............. 100.00 79.77 13.72 0.32 6.19 Chicken Meat......... - - - - - Camel Meat........... - - - - -
Table 2.7.5 Livestock Product percent of Utilization-Private peasant Holders, 2011/12 (2004 E.C) Gedio
Percent Utilized for
Type of
Livestock Household Wages
Product Total % Consumption Sale in Kind Others
Milk................. 100.00 37.64 7.91 - 54.45 Butter............... 100.00 57.96 39.72 - 2.31 Cheese............... 100.00 51.67 48.33 - - Beef................. 100.00 38.33 41.67 - 20.00 Mutton/Goat Meat..... 100.00 89.30 3.95 - 6.74 Eggs................. 100.00 31.61 32.71 - 35.68 Honey................ 100.00 42.50 57.50 - - Wax.................. - - - - - Sheep Hair........... - - - - - Skin................. 100.00 14.29 85.71 - - Hide................. 100.00 2.44 97.56 - - Arera.............. 100.00 85.29 13.14 - 1.57 Chicken Meat......... - - - - - Camel Meat........... - - - - -

Table 2.7.6 Livestock Product percent of Utilization-Private peasant Holders, 2011/12 (2004 E.C) Wolayita
Percent Utilized for
Type of
Livestock Household Wages
Product Total % Consumption Sale in Kind Others
Milk................. 100.00 14.94 0.15 0.02 84.90 Butter............... 100.00 39.80 52.93 0.98 6.29 Cheese............... 100.00 53.37 44.64 0.28 1.71 Beef................. 100.00 100.00 - - - Mutton/Goat Meat..... 100.00 83.33 16.67 - - Eggs................. 100.00 17.66 33.31 - 49.04 Honey................ 100.00 31.69 60.23 - 8.08 Wax.................. 100.00 3.00 97.00 - - Sheep Hair........... - - - - - Skin................. - - - - - Hide................. 100.00 30.00 66.67 - 3.33 Arera.............. 100.00 66.44 14.20 0.67 18.69 Chicken Meat......... - - - - - Camel Meat........... - - - - -
Table 2.7.7 Livestock Product percent of Utilization-Private peasant Holders, 2011/12 (2004 E.C) South Omo
Percent Utilized for
Type of
Livestock Household Wages
Product Total % Consumption Sale in Kind Others
Milk................. 100.00 59.37 0.63 0.09 39.91 Butter............... 100.00 55.48 42.43 0.05 2.04 Cheese............... 100.00 64.13 33.04 - 2.83 Beef................. 100.00 38.78 35.27 - 25.95 Mutton/Goat Meat..... 100.00 88.94 6.59 0.44 4.03 Eggs................. 100.00 29.68 44.83 - 25.49 Honey................ 100.00 23.81 72.41 0.85 2.93 Wax.................. 100.00 45.45 54.55 - - Sheep Hair........... - - - - - Skin................. 100.00 70.24 29.76 - - Hide................. 100.00 67.08 27.73 - 5.19 Arera.............. 100.00 97.51 1.38 - 1.11 Chicken Meat......... - - - - - Camel Meat........... - - - - -
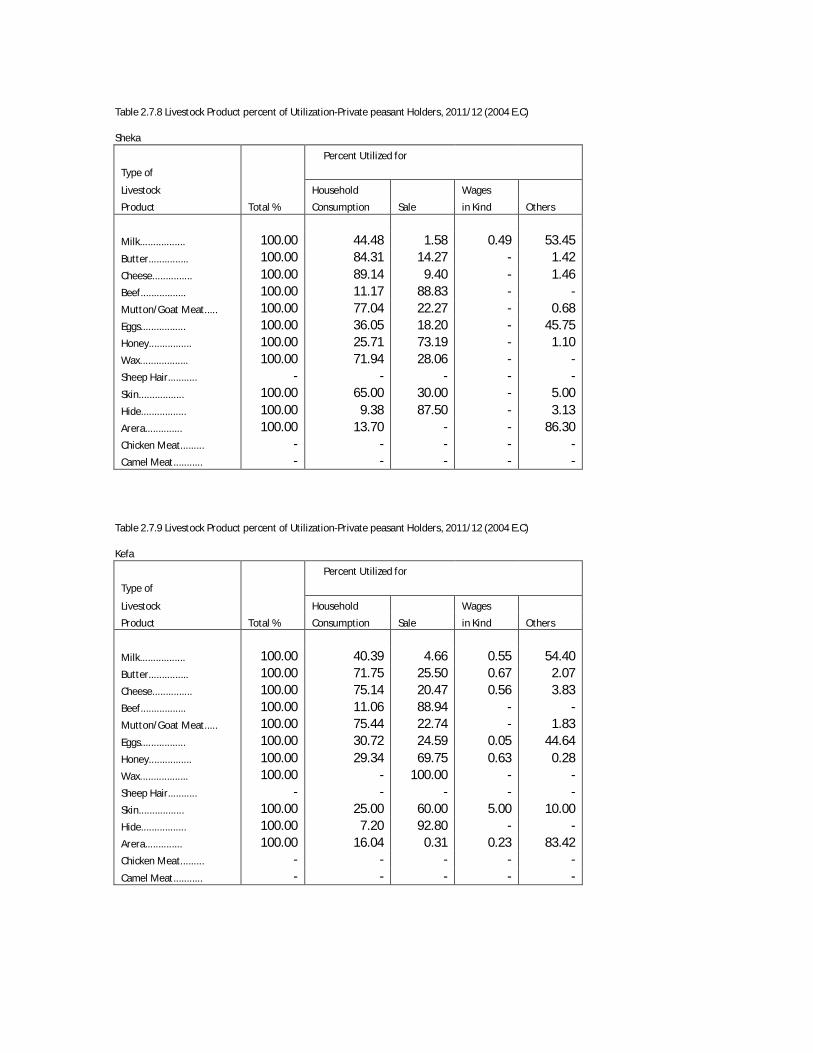
Table 2.7.8 Livestock Product percent of Utilization-Private peasant Holders, 2011/12 (2004 E.C) Sheka
Percent Utilized for
Type of
Livestock Household Wages
Product Total % Consumption Sale in Kind Others
Milk................. 100.00 44.48 1.58 0.49 53.45 Butter............... 100.00 84.31 14.27 - 1.42 Cheese............... 100.00 89.14 9.40 - 1.46 Beef................. 100.00 11.17 88.83 - - Mutton/Goat Meat..... 100.00 77.04 22.27 - 0.68 Eggs................. 100.00 36.05 18.20 - 45.75 Honey................ 100.00 25.71 73.19 - 1.10 Wax.................. 100.00 71.94 28.06 - - Sheep Hair........... - - - - - Skin................. 100.00 65.00 30.00 - 5.00 Hide................. 100.00 9.38 87.50 - 3.13 Arera.............. 100.00 13.70 - - 86.30 Chicken Meat......... - - - - - Camel Meat........... - - - - -
Table 2.7.9 Livestock Product percent of Utilization-Private peasant Holders, 2011/12 (2004 E.C) Kefa
Percent Utilized for
Type of
Livestock Household Wages
Product Total % Consumption Sale in Kind Others
Milk................. 100.00 40.39 4.66 0.55 54.40 Butter............... 100.00 71.75 25.50 0.67 2.07 Cheese............... 100.00 75.14 20.47 0.56 3.83 Beef................. 100.00 11.06 88.94 - - Mutton/Goat Meat..... 100.00 75.44 22.74 - 1.83 Eggs................. 100.00 30.72 24.59 0.05 44.64 Honey................ 100.00 29.34 69.75 0.63 0.28 Wax.................. 100.00 - 100.00 - - Sheep Hair........... - - - - - Skin................. 100.00 25.00 60.00 5.00 10.00 Hide................. 100.00 7.20 92.80 - - Arera.............. 100.00 16.04 0.31 0.23 83.42 Chicken Meat......... - - - - - Camel Meat........... - - - - -
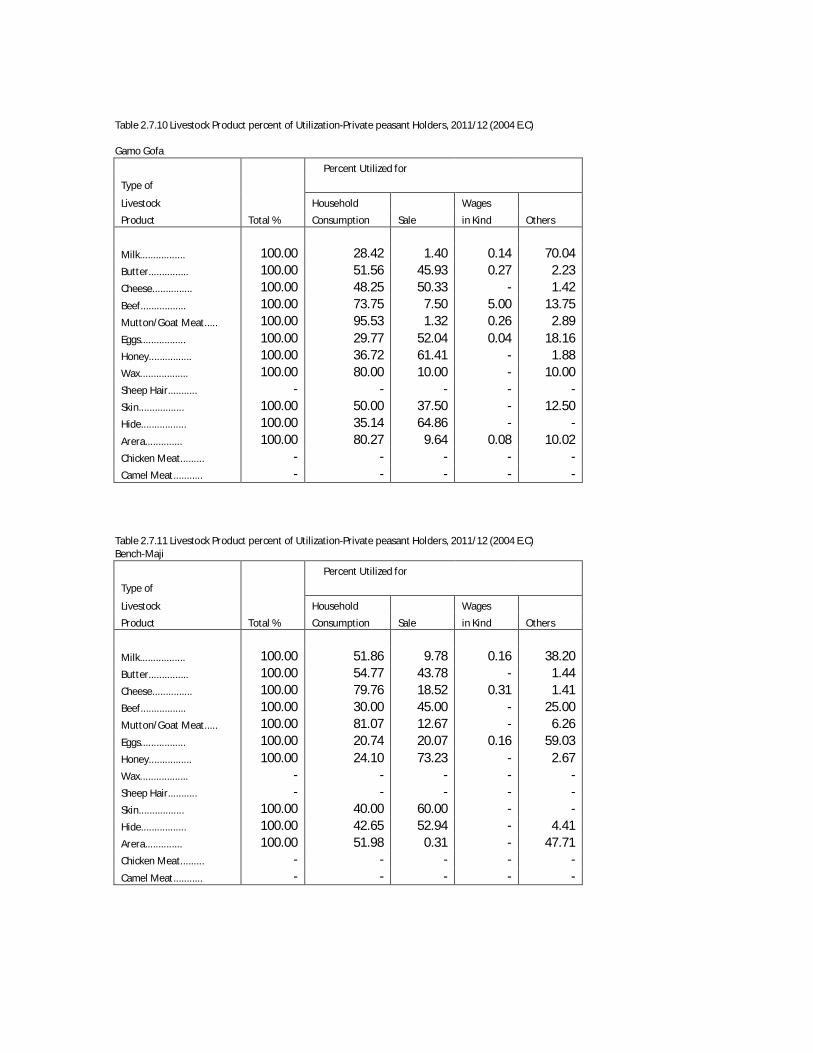
Table 2.7.10 Livestock Product percent of Utilization-Private peasant Holders, 2011/12 (2004 E.C) Gamo Gofa
Percent Utilized for
Type of
Livestock Household Wages
Product Total % Consumption Sale in Kind Others
Milk................. 100.00 28.42 1.40 0.14 70.04 Butter............... 100.00 51.56 45.93 0.27 2.23 Cheese............... 100.00 48.25 50.33 - 1.42 Beef................. 100.00 73.75 7.50 5.00 13.75 Mutton/Goat Meat..... 100.00 95.53 1.32 0.26 2.89 Eggs................. 100.00 29.77 52.04 0.04 18.16 Honey................ 100.00 36.72 61.41 - 1.88 Wax.................. 100.00 80.00 10.00 - 10.00 Sheep Hair........... - - - - - Skin................. 100.00 50.00 37.50 - 12.50 Hide................. 100.00 35.14 64.86 - - Arera.............. 100.00 80.27 9.64 0.08 10.02 Chicken Meat......... - - - - - Camel Meat........... - - - - -
Table 2.7.11 Livestock Product percent of Utilization-Private peasant Holders, 2011/12 (2004 E.C) Bench-Maji
Percent Utilized for
Type of
Livestock Household Wages
Product Total % Consumption Sale in Kind Others
Milk................. 100.00 51.86 9.78 0.16 38.20 Butter............... 100.00 54.77 43.78 - 1.44 Cheese............... 100.00 79.76 18.52 0.31 1.41 Beef................. 100.00 30.00 45.00 - 25.00 Mutton/Goat Meat..... 100.00 81.07 12.67 - 6.26 Eggs................. 100.00 20.74 20.07 0.16 59.03 Honey................ 100.00 24.10 73.23 - 2.67 Wax.................. - - - - - Sheep Hair........... - - - - - Skin................. 100.00 40.00 60.00 - - Hide................. 100.00 42.65 52.94 - 4.41 Arera.............. 100.00 51.98 0.31 - 47.71 Chicken Meat......... - - - - - Camel Meat........... - - - - -

Table 2.7.12 Livestock Product percent of Utilization-Private peasant Holders, 2011/12 (2004 E.C) Yem Special Wereda
Percent Utilized for
Type of
Livestock Household Wages
Product Total % Consumption Sale in Kind Others
Milk................. 100.00 91.32 0.54 0.38 7.75 Butter............... 100.00 65.25 32.69 0.08 1.98 Cheese............... 100.00 84.68 14.09 - 1.24 Beef................. 100.00 28.89 70.00 - 1.11 Mutton/Goat Meat..... 100.00 63.44 32.19 1.25 3.13 Eggs................. 100.00 31.61 64.02 - 4.38 Honey................ 100.00 44.27 55.12 0.12 0.49 Wax.................. 100.00 100.00 - - - Sheep Hair........... - - - - - Skin................. 100.00 72.73 27.27 - - Hide................. 100.00 7.69 92.31 - - Arera.............. 100.00 91.80 7.50 - 0.70 Chicken Meat......... - - - - - Camel Meat........... - - - - -
Table 2.7.13 Livestock Product percent of Utilization-Private peasant Holders, 2011/12 (2004 E.C) Amaro Special Wereda
Percent Utilized for
Type of
Livestock Household Wages
Product Total % Consumption Sale in Kind Others
Milk................. 100.00 34.36 - 0.17 65.47 Butter............... 100.00 65.08 30.56 0.72 3.64 Cheese............... 100.00 55.00 45.00 - - Beef................. 100.00 50.00 28.33 - 21.67 Mutton/Goat Meat..... 100.00 94.63 1.25 0.22 3.90 Eggs................. 100.00 21.55 38.54 0.36 39.56 Honey................ 100.00 43.46 50.58 0.38 5.58 Wax.................. 100.00 100.00 - - - Sheep Hair........... - - - - - Skin................. 100.00 100.00 - - - Hide................. 100.00 42.65 57.35 - - Arera.............. 100.00 82.47 10.31 0.31 6.91 Chicken Meat......... - - - - - Camel Meat........... - - - - -

Table 2.7.14 Livestock Product percent of Utilization-Private peasant Holders, 2011/12 (2004 E.C) Burji Special Wereda
Percent Utilized for
Type of
Livestock Household Wages
Product Total % Consumption Sale in Kind Others
Milk................. 100.00 47.70 0.22 - 52.08 Butter............... 100.00 77.05 19.25 0.10 3.59 Cheese............... 100.00 100.00 - - - Beef................. 100.00 25.00 75.00 - - Mutton/Goat Meat..... 100.00 93.82 - - 6.18 Eggs................. 100.00 29.65 31.65 - 38.69 Honey................ 100.00 34.09 62.27 - 3.64 Wax.................. - - - - - Sheep Hair........... - - - - - Skin................. 100.00 100.00 - - - Hide................. 100.00 100.00 - - - Arera.............. 100.00 85.99 9.64 - 4.38 Chicken Meat......... - - - - - Camel Meat........... - - - - -
Table 2.7.15 Livestock Product percent of Utilization-Private peasant Holders, 2011/12 (2004 E.C) Konso Special wereda
Percent Utilized for
Type of
Livestock Household Wages
Product Total % Consumption Sale in Kind Others
Milk................. 100.00 47.41 0.91 1.73 49.95 Butter............... 100.00 54.63 30.63 - 14.74 Cheese............... 100.00 100.00 - - - Beef................. 100.00 49.17 26.67 4.17 20.00 Mutton/Goat Meat..... 100.00 86.90 9.05 0.48 3.57 Eggs................. 100.00 21.99 47.41 - 30.60 Honey................ 100.00 10.83 89.17 - - Wax.................. - - - - - Sheep Hair........... - - - - - Skin................. 100.00 100.00 - - - Hide................. 100.00 95.59 2.94 1.47 - Arera.............. 100.00 92.88 2.28 - 4.84 Chicken Meat......... - - - - - Camel Meat........... - - - - -

Table 2.7.16 Livestock Product percent of Utilization-Private peasant Holders, 2011/12 (2004 E.C) Dereashe Special Wereda
Percent Utilized for
Type of
Livestock Household Wages
Product Total % Consumption Sale in Kind Others
Milk................. 100.00 54.63 - - 45.37 Butter............... 100.00 68.07 28.52 - 3.41 Cheese............... 100.00 100.00 - - - Beef................. 100.00 - 100.00 - - Mutton/Goat Meat..... 100.00 55.71 40.43 0.14 3.71 Eggs................. 100.00 36.57 36.57 - 26.86 Honey................ 100.00 23.57 72.14 - 4.29 Wax.................. 100.00 66.67 33.33 - - Sheep Hair........... - - - - - Skin................. 100.00 - 100.00 - - Hide................. 100.00 61.76 38.24 - - Arera.............. 100.00 97.50 - - 2.50 Chicken Meat......... - - - - - Camel Meat........... - - - - -
Table 2.7.17 Livestock Product percent of Utilization-Private peasant Holders, 2011/12 (2004 E.C) Dawro
Percent Utilized for
Type of
Livestock Household Wages
Product Total % Consumption Sale in Kind Others
Milk................. 100.00 44.00 1.03 0.84 54.13 Butter............... 100.00 53.76 40.25 2.85 3.14 Cheese............... 100.00 60.59 35.90 0.78 2.73 Beef................. 100.00 8.33 91.67 - - Mutton/Goat Meat..... 100.00 73.13 16.88 10.00 - Eggs................. 100.00 36.50 36.45 0.46 26.59 Honey................ 100.00 26.58 70.50 - 2.93 Wax.................. 100.00 50.83 - 3.33 45.83 Sheep Hair........... 100.00 50.00 - - 50.00 Skin................. 100.00 - 66.67 - 33.33 Hide................. 100.00 35.29 64.71 - - Arera.............. 100.00 53.93 0.81 1.03 44.23 Chicken Meat......... - - - - - Camel Meat........... - - - - -
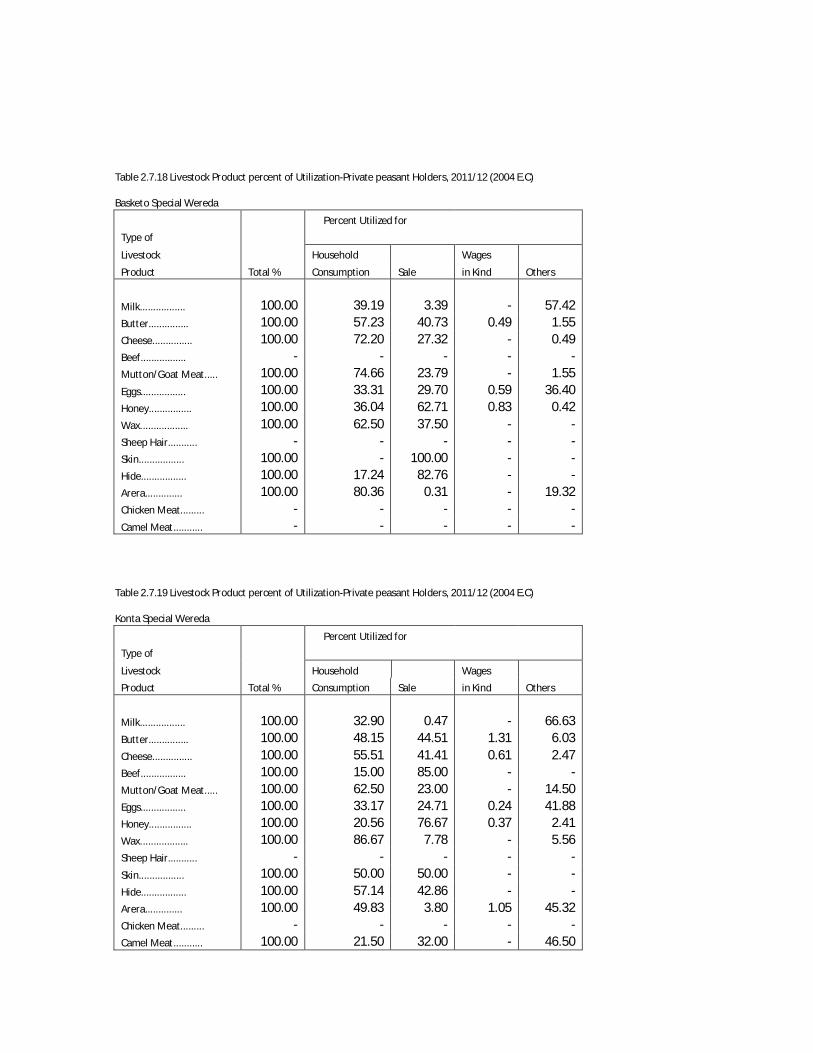
Table 2.7.18 Livestock Product percent of Utilization-Private peasant Holders, 2011/12 (2004 E.C) Basketo Special Wereda
Percent Utilized for
Type of
Livestock Household Wages
Product Total % Consumption Sale in Kind Others
Milk................. 100.00 39.19 3.39 - 57.42 Butter............... 100.00 57.23 40.73 0.49 1.55 Cheese............... 100.00 72.20 27.32 - 0.49 Beef................. - - - - - Mutton/Goat Meat..... 100.00 74.66 23.79 - 1.55 Eggs................. 100.00 33.31 29.70 0.59 36.40 Honey................ 100.00 36.04 62.71 0.83 0.42 Wax.................. 100.00 62.50 37.50 - - Sheep Hair........... - - - - - Skin................. 100.00 - 100.00 - - Hide................. 100.00 17.24 82.76 - - Arera.............. 100.00 80.36 0.31 - 19.32 Chicken Meat......... - - - - - Camel Meat........... - - - - -
Table 2.7.19 Livestock Product percent of Utilization-Private peasant Holders, 2011/12 (2004 E.C) Konta Special Wereda
Percent Utilized for
Type of
Livestock Household Wages
Product Total % Consumption Sale in Kind Others
Milk................. 100.00 32.90 0.47 - 66.63 Butter............... 100.00 48.15 44.51 1.31 6.03 Cheese............... 100.00 55.51 41.41 0.61 2.47 Beef................. 100.00 15.00 85.00 - - Mutton/Goat Meat..... 100.00 62.50 23.00 - 14.50 Eggs................. 100.00 33.17 24.71 0.24 41.88 Honey................ 100.00 20.56 76.67 0.37 2.41 Wax.................. 100.00 86.67 7.78 - 5.56 Sheep Hair........... - - - - - Skin................. 100.00 50.00 50.00 - - Hide................. 100.00 57.14 42.86 - - Arera.............. 100.00 49.83 3.80 1.05 45.32 Chicken Meat......... - - - - - Camel Meat........... 100.00 21.50 32.00 - 46.50
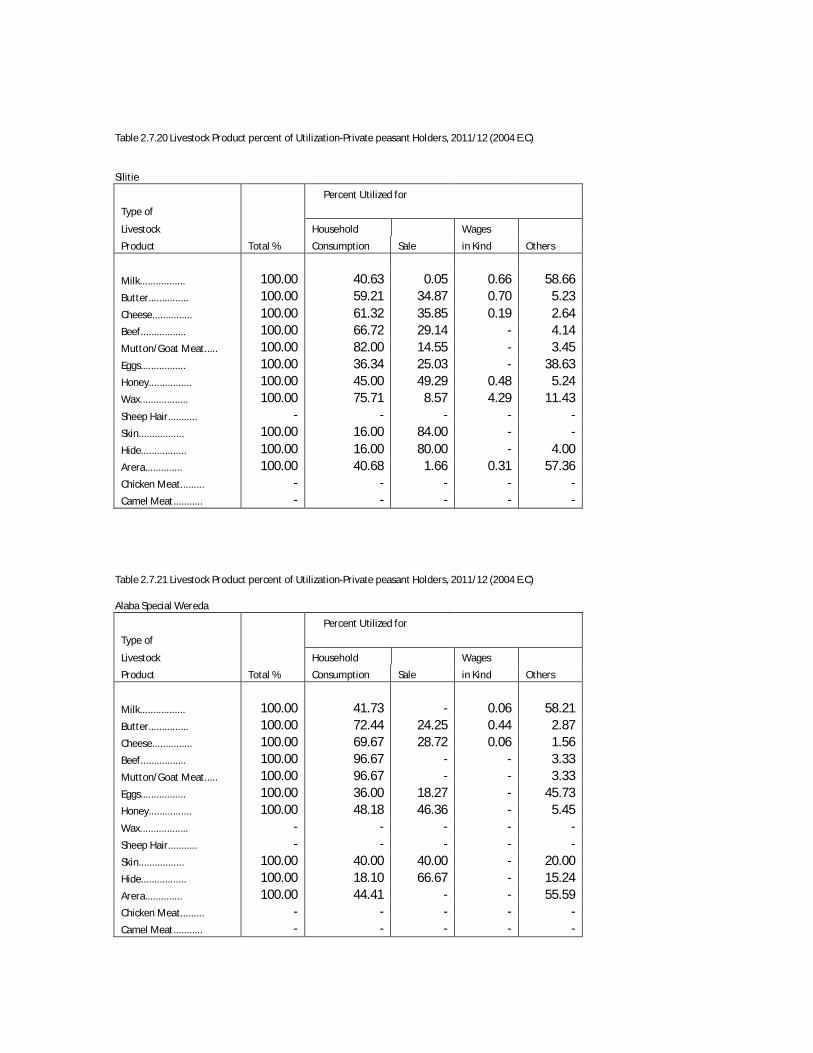
Table 2.7.20 Livestock Product percent of Utilization-Private peasant Holders, 2011/12 (2004 E.C) Silitie
Percent Utilized for
Type of
Livestock Household Wages
Product Total % Consumption Sale in Kind Others
Milk................. 100.00 40.63 0.05 0.66 58.66 Butter............... 100.00 59.21 34.87 0.70 5.23 Cheese............... 100.00 61.32 35.85 0.19 2.64 Beef................. 100.00 66.72 29.14 - 4.14 Mutton/Goat Meat..... 100.00 82.00 14.55 - 3.45 Eggs................. 100.00 36.34 25.03 - 38.63 Honey................ 100.00 45.00 49.29 0.48 5.24 Wax.................. 100.00 75.71 8.57 4.29 11.43 Sheep Hair........... - - - - - Skin................. 100.00 16.00 84.00 - - Hide................. 100.00 16.00 80.00 - 4.00 Arera.............. 100.00 40.68 1.66 0.31 57.36 Chicken Meat......... - - - - - Camel Meat........... - - - - -
Table 2.7.21 Livestock Product percent of Utilization-Private peasant Holders, 2011/12 (2004 E.C) Alaba Special Wereda
Percent Utilized for
Type of
Livestock Household Wages
Product Total % Consumption Sale in Kind Others
Milk................. 100.00 41.73 - 0.06 58.21 Butter............... 100.00 72.44 24.25 0.44 2.87 Cheese............... 100.00 69.67 28.72 0.06 1.56 Beef................. 100.00 96.67 - - 3.33 Mutton/Goat Meat..... 100.00 96.67 - - 3.33 Eggs................. 100.00 36.00 18.27 - 45.73 Honey................ 100.00 48.18 46.36 - 5.45 Wax.................. - - - - - Sheep Hair........... - - - - - Skin................. 100.00 40.00 40.00 - 20.00 Hide................. 100.00 18.10 66.67 - 15.24 Arera.............. 100.00 44.41 - - 55.59 Chicken Meat......... - - - - - Camel Meat........... - - - - -

Table 2.8 Livestock Product percent of Utilization-Private peasant Holders, 2011/12 (2004 E.C) Gambela Region
Percent Utilized for
Type of
Livestock Household Wages
Product Total % Consumption Sale in Kind Others
Milk................. 100.00 71.97 9.86 0.20 17.97 Butter............... 100.00 71.71 24.91 0.07 3.32 Cheese............... 100.00 84.83 11.27 - 3.90 Beef................. 100.00 60.61 5.96 - 33.43 Mutton/Goat Meat..... 100.00 84.46 5.41 - 10.14 Eggs................. 100.00 26.90 33.26 0.08 39.77 Honey................ 100.00 21.09 73.91 0.27 4.73 Wax.................. 100.00 35.00 40.63 - 24.38 Sheep Hair........... - - - - - Skin................. 100.00 97.50 2.00 - 0.50 Hide................. 100.00 37.23 61.70 - 1.06 Arera.............. 100.00 62.44 0.69 0.32 36.55 Chicken Meat......... - - - - - Camel Meat........... 100.00 25.00 15.00 - 60.00
Table 2.8.1 Livestock Product percent of Utilization-Private peasant Holders, 2011/12 (2004 E.C) Agnuwak
Percent Utilized for
Type of
Livestock Household Wages
Product Total % Consumption Sale in Kind Others
Milk................. 100.00 59.42 9.86 - 30.72 Butter............... 100.00 70.66 19.06 - 10.28 Cheese............... 100.00 71.02 18.41 - 10.57 Beef................. 100.00 30.00 50.00 - 20.00 Mutton/Goat Meat..... 100.00 77.00 12.00 - 11.00 Eggs................. 100.00 30.76 20.74 - 48.51 Honey................ 100.00 20.00 74.27 0.49 5.24 Wax.................. 100.00 35.00 40.63 - 24.38 Sheep Hair........... - - - - - Skin................. 100.00 - 100.00 - - Hide................. 100.00 100.00 - - - Arera.............. 100.00 76.73 3.06 - 20.20 Chicken Meat......... - - - - - Camel Meat........... 100.00 - - - 100.00

Table 2.8.2 Livestock Product percent of Utilization-Private peasant Holders, 2011/12 (2004 E.C) Nuware
Percent Utilized for
Type of
Livestock Household Wages
Product Total % Consumption Sale in Kind Others
Milk................. 100.00 82.89 9.73 0.13 7.25 Butter............... 100.00 56.36 30.00 - 13.64 Cheese............... 100.00 60.00 30.00 - 10.00 Beef................. 100.00 66.60 0.64 - 32.77 Mutton/Goat Meat..... 100.00 75.10 2.55 - 22.35 Eggs................. 100.00 20.36 45.93 0.07 33.64 Honey................ 100.00 8.33 58.33 - 33.33 Wax.................. - - - - - Sheep Hair........... - - - - - Skin................. 100.00 98.94 - - 1.06 Hide................. - - - - - Arera.............. 100.00 80.43 1.29 - 18.29 Chicken Meat......... - - - - - Camel Meat........... - - - - -
Table 2.8.3 Livestock Product percent of Utilization-Private peasant Holders, 2011/12 (2004 E.C) Mezhenger
Percent Utilized for
Type of
Livestock Household Wages
Product Total % Consumption Sale in Kind Others
Milk................. 100.00 52.71 4.67 0.26 42.36 Butter............... 100.00 80.72 18.37 - 0.91 Cheese............... 100.00 90.07 8.38 - 1.55 Beef................. 100.00 25.00 75.00 - - Mutton/Goat Meat..... 100.00 93.89 5.87 - 0.24 Eggs................. 100.00 41.30 22.10 0.23 36.37 Honey................ 100.00 22.67 75.35 - 1.98 Wax.................. - - - - - Sheep Hair........... - - - - - Skin................. 100.00 100.00 - - - Hide................. 100.00 11.29 88.71 - - Arera.............. 100.00 41.54 - - 58.46 Chicken Meat......... - - - - - Camel Meat........... - - - - -

Table 2.8.4 Livestock Product percent of Utilization-Private peasant Holders, 2011/12 (2004 E.C) Itang Special
Percent Utilized for
Type of
Livestock Household Wages
Product Total % Consumption Sale in Kind Others
Milk................. 100.00 75.56 15.31 0.33 8.79 Butter............... 100.00 49.00 48.33 0.33 2.33 Cheese............... 100.00 45.00 35.00 - 20.00 Beef................. 100.00 57.35 8.03 - 34.62 Mutton/Goat Meat..... 100.00 81.17 8.00 - 10.83 Eggs................. 100.00 15.32 42.92 - 41.75 Honey................ 100.00 50.00 - - 50.00 Wax.................. - - - - - Sheep Hair........... - - - - - Skin................. 100.00 98.04 1.96 - - Hide................. 100.00 87.10 9.68 - 3.23 Arera.............. 100.00 93.89 - 2.04 4.07 Chicken Meat......... - - - - - Camel Meat........... 100.00 50.00 30.00 - 20.00
Table 2.9 Livestock Product percent of Utilization-Private peasant Holders, 2011/12 (2004 E.C) Harai Region
Percent Utilized for
Type of
Livestock Household Wages
Product Total % Consumption Sale in Kind Others
Milk................. 100.00 54.77 40.10 0.04 5.08 Butter............... 100.00 100.00 - - - Cheese............... - - - - - Beef................. 100.00 15.00 - - 85.00 Mutton/Goat Meat..... 100.00 56.10 - - 43.90 Eggs................. 100.00 30.71 32.52 0.40 36.37 Honey................ 100.00 74.50 20.50 - 5.00 Wax.................. 100.00 - - - 100.00 Sheep Hair........... - - - - - Skin................. 100.00 33.33 - - 66.67 Hide................. 100.00 46.88 - - 53.13 Arera.............. 100.00 100.00 - - - Chicken Meat......... - - - - - Camel Meat........... - - - - -
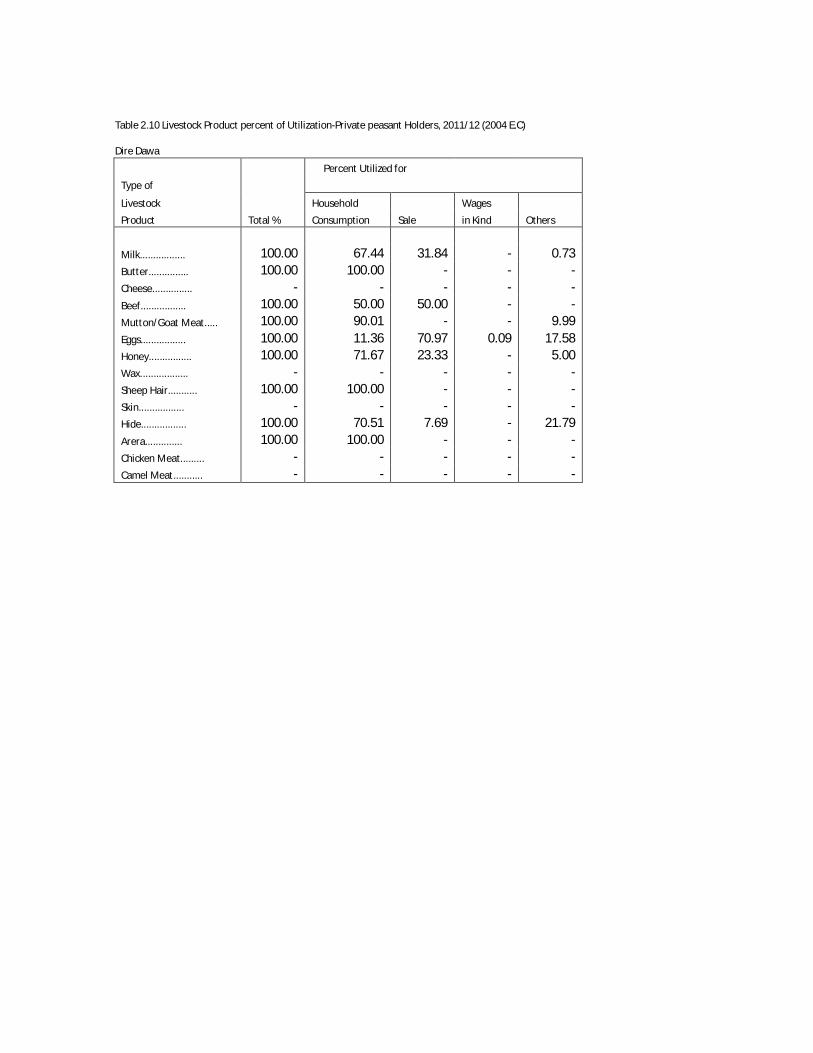
Table 2.10 Livestock Product percent of Utilization-Private peasant Holders, 2011/12 (2004 E.C) Dire Dawa
Percent Utilized for
Type of
Livestock Household Wages
Product Total % Consumption Sale in Kind Others
Milk................. 100.00 67.44 31.84 - 0.73 Butter............... 100.00 100.00 - - - Cheese............... - - - - - Beef................. 100.00 50.00 50.00 - - Mutton/Goat Meat..... 100.00 90.01 - - 9.99 Eggs................. 100.00 11.36 70.97 0.09 17.58 Honey................ 100.00 71.67 23.33 - 5.00 Wax.................. - - - - - Sheep Hair........... 100.00 100.00 - - - Skin................. - - - - - Hide................. 100.00 70.51 7.69 - 21.79 Arera.............. 100.00 100.00 - - - Chicken Meat......... - - - - - Camel Meat........... - - - - -

APPENDIX I
ESTIMATION PROCEDURES OF TOTALS, RATIOS AND SAMPLING ERRORS

The following formulas were used to estimate total area of land under specific crop, production
and yield of specific crop in a stratum.
1. For estimating Total Area of Land under Specific Crop:
h hhin
i ihihihij
h
jhih
naWaWA
1 11
in which, hihih
hihhi hmn
HMW is the basic weight.
Where:
h represents the stratum
hn is the total number of sample EAs successfully covered in the hth stratum.
hM is the measure of size of the hth stratum as obtained from the sampling frame.
him is the measure of size of the ith sample EA in the hth stratum obtained from the sampling
frame.
hiH is the total number of agricultural households of the ith sample EA in the hth
stratum.
hih is the number of sample agricultural households successfully covered in the ith sample EA
in the hth stratum.
hija is the value of area for agricultural household j, in the ith EA in the hth strtatum under a
specific crop.
hia is the sample total area under specific crop for EA i in stratum h
hA estimate of total area under specific crop in stratum h
2. For estimating Total Production under Specific Crop:
hn
ihihih W
1
ˆ
in which, hihihi Ya *
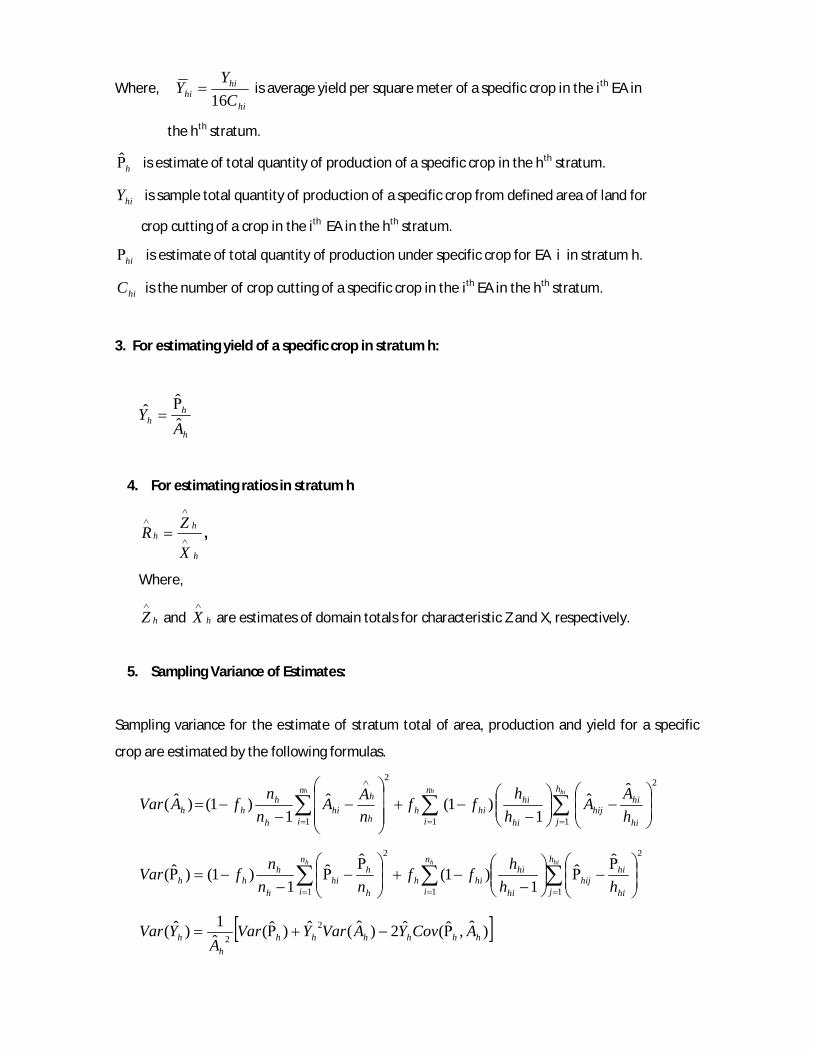
Where, hi
hihi C
YY16
is average yield per square meter of a specific crop in the ith EA in
the hth stratum.
hˆ is estimate of total quantity of production of a specific crop in the hth stratum.
hiY is sample total quantity of production of a specific crop from defined area of land for
crop cutting of a crop in the ith EA in the hth stratum.
hi is estimate of total quantity of production under specific crop for EA i in stratum h.
hiC is the number of crop cutting of a specific crop in the ith EA in the hth stratum.
3. For estimating yield of a specific crop in stratum h:
h
hh A
Y ˆˆˆ
4. For estimating ratios in stratum h
h
hh
X
ZR ,
Where,
hZ and hX are estimates of domain totals for characteristic Z and X, respectively.
5. Sampling Variance of Estimates:
Sampling variance for the estimate of stratum total of area, production and yield for a specific
crop are estimated by the following formulas.
hihh h
j hi
hihij
n
i hi
hihih
n
i h
hhi
h
hhh h
AAh
hffnAA
nnfAVar
1
2
11
2ˆ
ˆ1
)1(ˆ1
)1()ˆ(
2
11
2
1
ˆˆ
1)1(
ˆˆ
1)1()ˆ(
hihh h
j hi
hihij
n
i hi
hihih
n
i h
hhi
h
hhh hh
hffnn
nfVar
)ˆ,ˆ(ˆ2)ˆ(ˆ)ˆ(ˆ1)ˆ( 2
2 hhhhhhh
h ACovYAVarYVarA
YVar
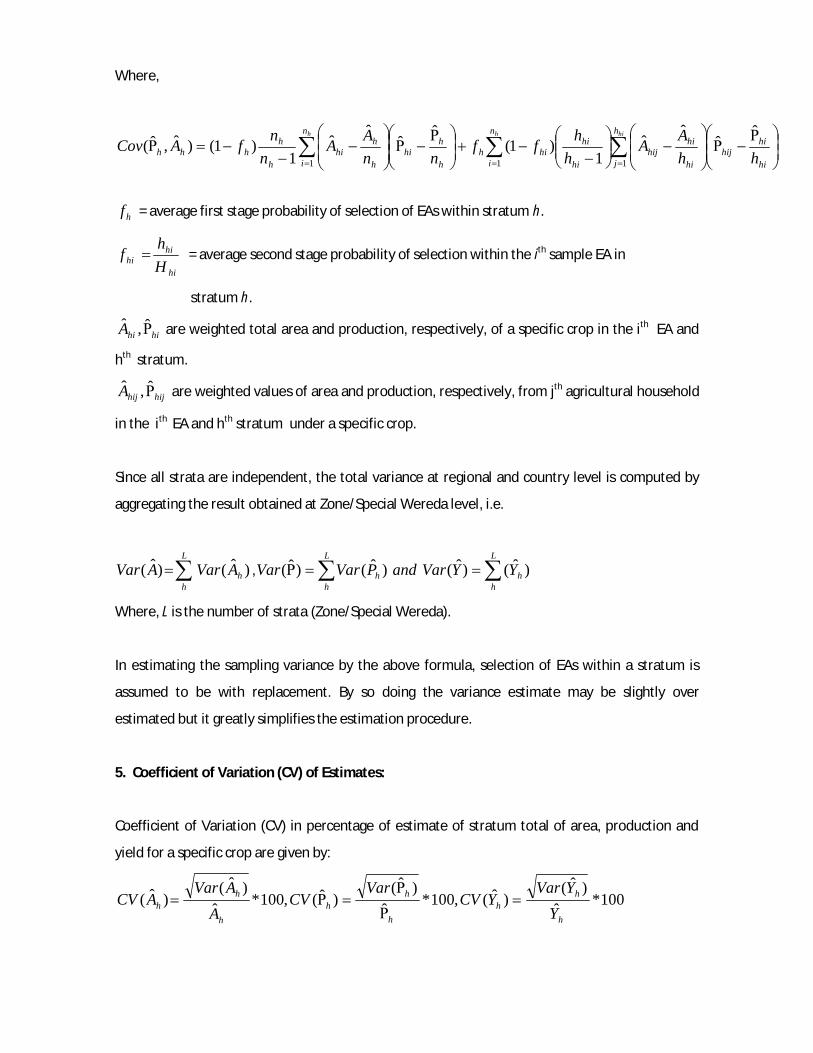
Where,
hi
hihij
h
j hi
hihij
n
i hi
hihih
h
hhi
n
i h
hhi
h
hhhh hh
AAh
hffnn
AAn
nfACovhihh ˆ
ˆˆ
ˆ1
)1(ˆ
ˆˆ
ˆ1
)1()ˆ,ˆ(111
hf = average first stage probability of selection of EAs within stratum h.
hi
hihi H
hf = average second stage probability of selection within the ith sample EA in
stratum h.
hihiA ˆ,ˆ are weighted total area and production, respectively, of a specific crop in the ith EA and
hth stratum.
hijhijA ˆ,ˆ are weighted values of area and production, respectively, from jth agricultural household
in the ith EA and hth stratum under a specific crop.
Since all strata are independent, the total variance at regional and country level is computed by
aggregating the result obtained at Zone/Special Wereda level, i.e.
L
hhAVarAVar )ˆ()ˆ( ,
L
h
L
hhh YYVarandPVarVar )ˆ()ˆ()ˆ()ˆ(
Where, L is the number of strata (Zone/Special Wereda).
In estimating the sampling variance by the above formula, selection of EAs within a stratum is
assumed to be with replacement. By so doing the variance estimate may be slightly over
estimated but it greatly simplifies the estimation procedure.
5. Coefficient of Variation (CV) of Estimates:
Coefficient of Variation (CV) in percentage of estimate of stratum total of area, production and
yield for a specific crop are given by:
100*ˆ)ˆ(
)ˆ(,100*ˆ)ˆ(
)ˆ(,100*ˆ)ˆ(
)ˆ(h
hh
h
hh
h
hh Y
YVarYCV
VarCV
AAVar
ACV
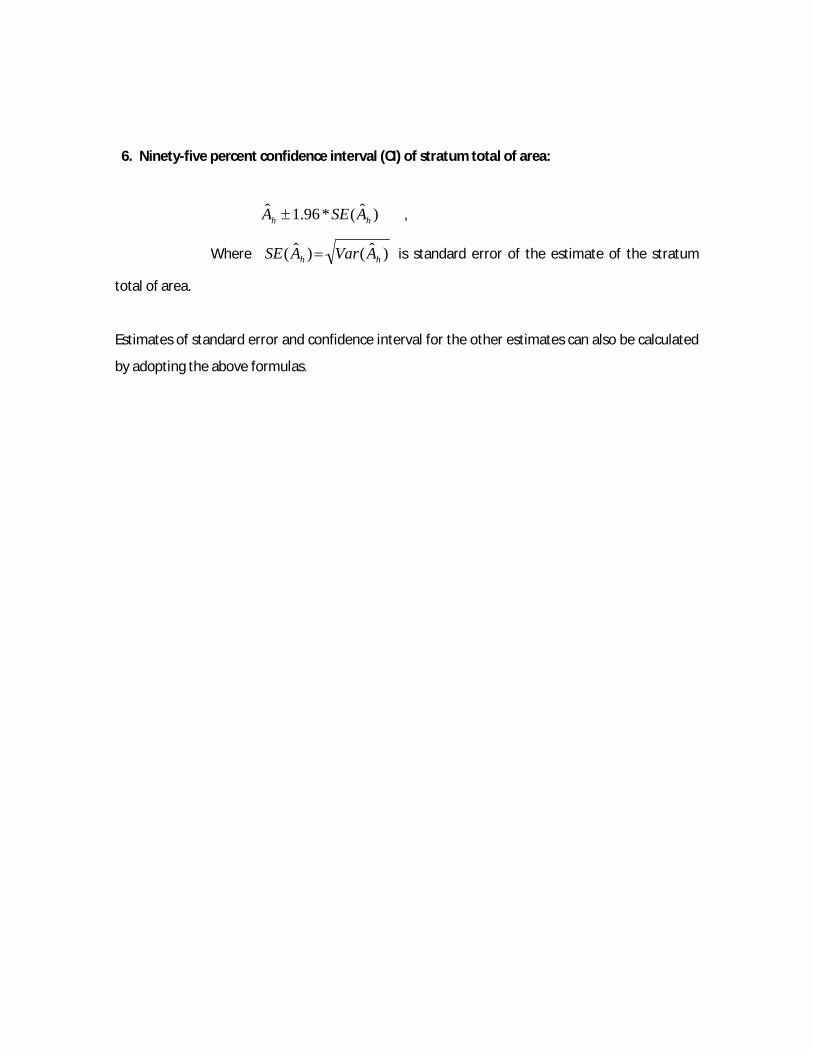
6. Ninety-five percent confidence interval (CI) of stratum total of area:
)ˆ(*96.1ˆhh ASEA ,
Where )ˆ()ˆ( hh AVarASE is standard error of the estimate of the stratum
total of area.
Estimates of standard error and confidence interval for the other estimates can also be calculated
by adopting the above formulas.
APPENDIX II
QUESTIONNAIRE
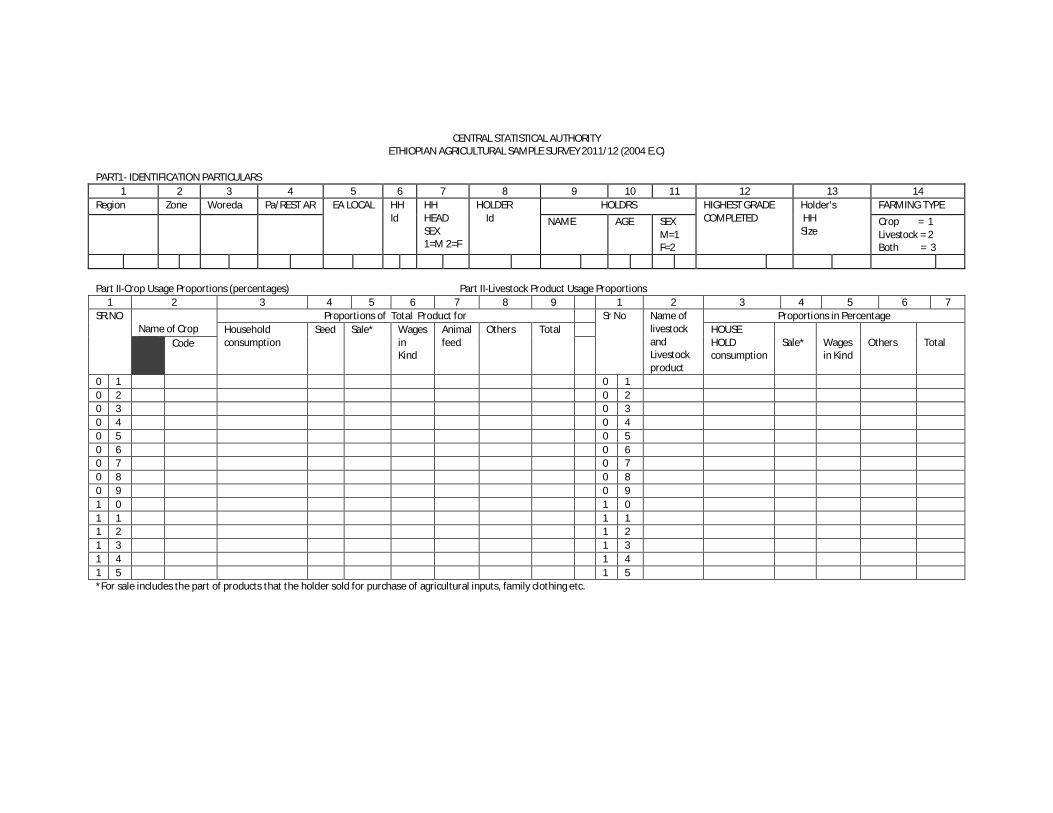
CENTRAL STATISTICAL AUTHORITY
ETHIOPIAN AGRICULTURAL SAMPLE SURVEY 2011/12 (2004 E.C)
PART1- IDENTIFICATION PARTICULARS 1 2 3 4 5 6 7 8 9 10 11 12 13 14
Region Zone Woreda Pa/REST AR EA LOCAL HH Id
HH HEAD SEX 1=M 2=F
HOLDER Id
HOLDRS HIGHEST GRADE COMPLETED
Holder's HH Size
FARMING TYPE
NAME AGE SEX M=1 F=2
Crop = 1 Livestock = 2 Both = 3
Part II-Crop Usage Proportions (percentages) Part II-Livestock Product Usage Proportions
1 2 3 4 5 6 7 8 9 1 2 3 4 5 6 7 SR.NO
Name of Crop Proportions of Total Product for Sr No Name of
livestock and Livestock product
Proportions in Percentage Household consumption
Seed Sale* Wages in Kind
Animal feed
Others Total HOUSE HOLD consumption
Sale*
Wages in Kind
Others
Total Code
0 1 0 1 0 2 0 2 0 3 0 3 0 4 0 4 0 5 0 5 0 6 0 6 0 7 0 7 0 8 0 8 0 9 0 9 1 0 1 0 1 1 1 1 1 2 1 2 1 3 1 3 1 4 1 4 1 5 1 5 *For sale includes the part of products that the holder sold for purchase of agricultural inputs, family clothing etc.