Embed Size (px)
Citation preview
AGRICULTURAL
www.elsevier.com/locate/agsy
Agricultural Systems 88 (2006) 227–254
SYSTEMS
Crop sequence effects of 10 crops in thenorthern Great Plains
J.M. Krupinsky *, D.L. Tanaka, S.D. Merrill,M.A. Liebig, J.D. Hanson
Northern Great Plains Research Laboratory, Agricultural Research Service, USDA, Box 0459,
Mandan, ND 58554-0459, United States
Received 4 June 2004; received in revised form 11 March 2005; accepted 24 March 2005
Abstract
Dynamic cropping systems, which involve a long-term strategy of annual crop sequencing,
require detailed information on management components known to influence crop perfor-
mance. Considering that proper sequencing of crops is an important component for successful
dynamic cropping systems, a research project was undertaken to determine the advantages
and/or disadvantages of previous crop and crop residues for numerous crop sequences. A
multi-disciplinary team of scientists evaluated crop sequence effects of 10 crops (barley,
canola, crambe, dry bean, dry pea, flax, safflower, soybean, spring wheat, and sunflower)
on seed yield, soil coverage by residue, soil water use, surface soil properties, and plant dis-
eases in central North Dakota. Two years were required to establish a crop by crop residue
matrix (crop matrix). During the second year (site 1, 1999; site 2, 2000) 10 crops were evalu-
ated with a crop matrix. During the third and fourth year spring wheat (site 1, 2000; site 2,
2001) and sunflower (site 1, 2001; site 2, 2002), respectively, were seeded over the crop matrix.
The seed yield of four crops (crambe, flax, safflower, and soybean) of the 10 crops evaluated in
the crop matrix was influenced by the preceding crop at site 1 in 1999 an above average mois-
ture year. The seed yield of eight crops (canola, crambe, dry bean, flax, safflower, soybean,
spring wheat, and barley) was influenced by the preceding crop at site 2 in 2000 a more average
precipitation year. Some of the lowest seed yields were obtained when a crop was seeded on its
own residue. A synthesis of seed yield data from a given year provided overall values for
0308-521X/$ - see front matter � 2005 Elsevier Ltd. All rights reserved.
doi:10.1016/j.agsy.2005.03.011
* Corresponding author. Tel.: +701 667 3011; fax: +701 667 3054.
E-mail address: [email protected] (J.M. Krupinsky).
228 J.M. Krupinsky et al. / Agricultural Systems 88 (2006) 227–254
positive and negative effects of crops and crop residue on subsequent crops. In general, the
three legume crops had positive effects in contrast to non-leguminous crops, which usually
had negative effects. However, sunflower was an exception among the non-leguminous crops;
at site 2 in 2000, sunflower was positive for subsequent crops compared with canola or crambe,
which had negative effects. Crop sequences composed of small cereal grains had the highest
soil coverage by residue while sequences of two dicotyledonous species had considerably lower
coverage. Soil water use among crops varied, ranging from sunflower with the numerically
highest soil water use to dry pea with the least. Significant changes in surface soil properties
due to crops were generally not detected in this short-term project. Given the variation in Scle-
rotinia disease incidence for canola, crambe, safflower, and sunflower within the crop matrix,
it was difficult to detect significant differences based on the previous crop. Differences were evi-
dent two years later when the highest incidence of Sclerotinia basal stalk rot for sunflower was
detected in plots where crambe was grown two years earlier. During the third year, when
spring wheat was seeded over a crop matrix, spring wheat yields increased following 23 and
19 crop sequence treatments out of a possible 100 at site 1 and site 2, respectively, compared
to the continuous wheat treatment. All crop sequence treatments that yielded better than the
continuous wheat treatment were comprised of mostly non-cereal crops, demonstrating the
positive impact of crop diversity on cereal crop production. The severity of leaf spot diseases
on spring wheat were affected by crop sequence and fungal spore production was greatest on
the continuous wheat treatment. Even though decreases in leaf spot disease severity and mod-
est yield increases were obtained with some crop sequence treatments, significant yield
increases due to reduced leaf spot disease severity were not obtained under our conditions.
� 2005 Elsevier Ltd. All rights reserved.
Keywords: Diverse cropping systems; Crop rotation; Rotation effect
1. Introduction
The northern Great Plains of North America is recognized throughout the world
for its fertile soils, which contribute to the production of large quantities of cereal
grain, oilseed, and pulse crops. This area, which includes most of Montana, NorthDakota, South Dakota, and parts of Wyoming and Nebraska in the United States
as well as arable regions of Manitoba, Saskatchewan, Alberta, and British Columbia
in Canada, contains approximately 52 Mha of cropland and contributes over $20bil-
lion in annual agricultural output (Padbury et al., 2002; Statistics Canada, 2003; US
Census Bureau, 2002). Despite this impressive level of production, there are concerns
about the sustainability of cropping systems within the region. High climatic vari-
ability within the northern Great Plains leads to economic instability of crop produc-
tion practices (Peterson, 1996). This instability is exacerbated by historical andcurrent trends that include a lack of crop diversity (Brummer, 1998; Peterson
et al., 1996), declines in soil organic matter (Campbell et al., 1996; Lyon et al.,
1997), and improper management of crop nutrients (Westfall et al., 1996).
Diversification, opportunism, risk avoidance, and flexibility are four principles
considered essential to create a more sustainable agriculture in highly dynamic eco-
regions such as the northern Great Plains (Behnke et al., 1993; Dhuyvetter et al.,
J.M. Krupinsky et al. / Agricultural Systems 88 (2006) 227–254 229
1996; Sandford, 1982). Development and utilization of more diverse cropping sys-
tems is closely aligned with these principles. Diverse cropping systems have been pro-
posed to reverse many of the negative socio-economic and environmental impacts of
predominant crop production practices in the region (Zentner et al., 2001). For such
a reversal to occur, however, information on the agronomic potential, environmentalimpact, and economics of alternative crops is needed. Obtaining such information is
complicated by the fact that individual crops interact differently with numerous man-
agement components, such as tillage methods, crop sequencing, cultivar selection,
nutrient management, and weed and disease control. Understanding how individual
crops and management components interact is essential in the development of prac-
tical, efficient, and cost-effective cropping systems capable of stabilizing crop produc-
tion while minimizing deleterious effects on the environment (Hanson et al., 2003).
Tanaka et al. (2002) developed the concept of dynamic cropping systems to facil-itate the determination of causal relationships between crop performance and spe-
cific management components. As defined, dynamic cropping systems refer to a
long-term strategy of annual crop sequencing that optimizes crop and soil use op-
tions and the attainment of production, economic, and resource conservation goals
by using sound ecological management principles (Tanaka et al., 2002). Optimizing
cropping options to meet these goals requires detailed information on multiple man-
agement components known to influence crop performance. This information should
provide clearer recommendations for proper crop sequencing, which has long beenviewed as crucial for cropping system success (Leighty, 1938; Pierce and Rice, 1988).
The objective of this study was to determine the advantages and/or disadvantages
of previous crop and crop residues for numerous crop sequences in the northern
Great Plains. Specifically, we sought to evaluate the effects of crop sequencing on
crop performance, soil coverage by residue, soil water use, surface soil properties,
and plant diseases in a crop matrix.
2. Methodology
2.1. Description of experiment
The research project was located at the Area IV Soil Conservation Districts/
USDA-ARS-Northern Great Plains Research Laboratory Research Farm approxi-
mately 6 km southwest of Mandan, ND (46�46 02200N, 100�57 00900W). The site, occu-
pying approximately 12.2 ha, was on gently rolling uplands (0–3% slope) with a siltyloess mantle overlying till. The predominant soil at the site was a Wilton silt loam
(fine-silty, mixed, superactive frigid Pachic Haplustoll). Average soil bulk density,
soil pH, and total C in the surface 7.5 cm was 1.34 Mg m�3, 6.1, and 21.7 Mg ha�1,
respectively. Prior to initiating the experiment, the site was in a hard red spring
wheat (Triticum aestivum L.)-winter wheat-sunflower (Helianthus annuus L.) rotation
under reduced tillage management for 14 yr. From 1914 to 2000, annual precipita-
tion averaged 409 mm, with 79% of the total received during the growing season
from April through September. Average annual temperature was 4 �C, though daily
230 J.M. Krupinsky et al. / Agricultural Systems 88 (2006) 227–254
averages range from 21 �C in the summer to �11 �C in the winter. Long-term precip-
itation and temperature data were recorded about 5 km northeast of the study site.
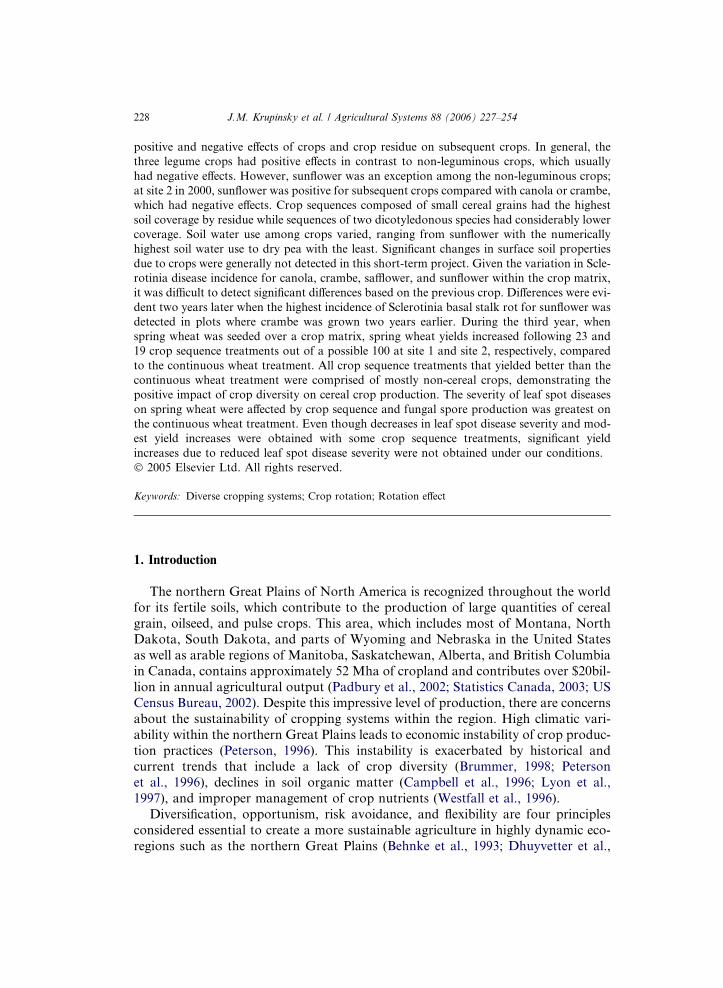
An experimental crop by crop residue matrix design was used to allow the simul-
taneous evaluation of numerous crop sequences in the same experiment under sim-
ilar weather and soil conditions. Two years were required to form a crop by cropresidue matrix (referred to hereafter as crop matrix) in which 10 crops were direct
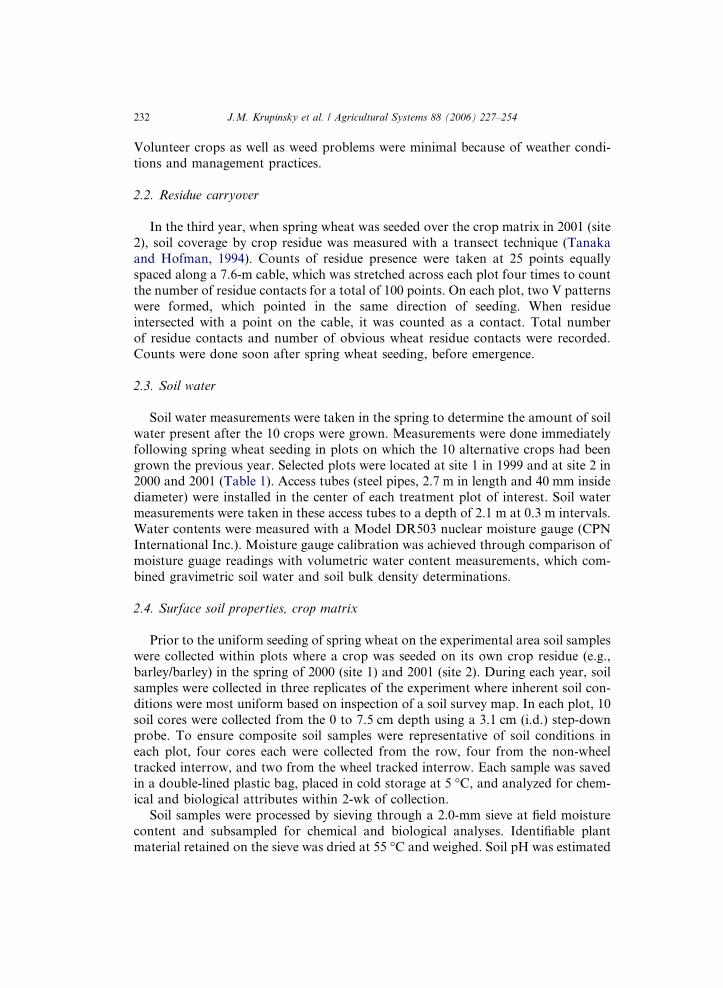
seeded into the crop residue of the same 10 crops (Fig. 1). In 1998, a field was divided
into two sites (approximately 6.1 ha each). During the first year (1998 and 1999 for
the site 1 and site 2, respectively; Table 1), four replicates of 10 crops (barley [Hord-
eum vulgare L.], dry bean [Phaseolus vulgaris L.], canola [Brassica napus L.], crambe
[Crambe abyssinica Hochst. ex R.E. Fr.], flax [Linum usitatissimum L.], dry pea [Pi-
sum sativum L.], safflower [Carthamus tinctorius L.], soybean [Glycine max (L.)
Merr.], sunflower, and spring wheat) were direct seeded in 9-m wide strips with aJohn Deere 750 no-till drill into a uniform cereal residue (winter wheat in the east
field; barley in the west field). During the second year (Table 1), the same 10 crops
were direct seeded perpendicular over the residue of the previous year�s crops. Thisestablished a 10 · 10 matrix with 100 treatment combinations, where each crop was
grown on 10 crop residues (Fig. 1). Treatments were replicated four times each year
following a strip-block design with individual 9 · 9 m plots considered as experimen-
tal units. In the third year (Table 1), spring wheat was uniformly seeded over a pre-
vious crop matrix. In the fourth year (Table 1), sunflower was uniformly seeded
Crop by crop residue matrix, 100 plotsCrop
1 2 3 4 5 6 7 8 9 10 111 12 13 14 15 16 17 18 19 20 221 22 23 24 25 26 27 28 29 30 531 32 33 34 35 36 37 38 39 40 941 42 43 44 45 46 47 48 49 50 751 52 53 54 55 56 57 58 59 60 1061 62 63 64 65 66 67 68 69 70 671 72 73 74 75 76 77 78 79 80 381 82 83 84 85 86 87 88 89 90 491 92 93 94 95 96 97 98 99 100 85 2 7 1 8 4 6 9 3 10 Crop
Firstyear,tencropsseededin strips
Second year, ten crops seededperpendicular over crop residue
Fig. 1. Design of one replicate of a crop matrix used to evaluate the influence of crop sequence. During the
first year 10 crops (numbered 1 through 10) were seeded into a uniform crop residue. During the second
year the same crops were no-till seeded perpendicular over the residue of the previous year�s crop.
Individual plot numbers were assigned for each of the four replications.
Table 1
Crops and sites used to evaluate the influence of crop sequence
Year Crop Site 1a Site 2a
1 Ten cropsb 1998 1999
2 Crop matrix, 10 cropsc 1999 2000
3 Spring wheat seeded over crop matrix 2000 2001
4 Sunflower seeded over crop matrix 2001 2002
a In 1998 a field was divided into two sites to provide two site years.b Two years were required to establish a crop matrix (crop by crop residue matrix). During the first year
10 crops were seeded in strips to provide residue into which 10 crops were seeded during the second year.c Two years were required to establish a crop matrix. During the second year 10 crops were seeded
perpendicular over the crop residue from the first year to form a crop matrix.
J.M. Krupinsky et al. / Agricultural Systems 88 (2006) 227–254 231
following spring wheat on a previous crop matrix. At site 1 the sunflower crop was
compromised by a damaging wind storm. Thus, sunflower yield data are not in-
cluded in this paper. However, Sclerotinia (Sclerotinia sclerotiorum (Lib.) De Bary)
disease data obtained from site 2 are presented.
Cultural practices used during the experiment were similar to those of local no-till
producers. Planting and harvesting operations were conducted based on locally opti-
mal time periods for each crop (Table 2). Seed yield was determined by harvesting
11.4 m2 area with a plot combine. Nitrogen was applied as a mid-row (between everyother row) band application of NH4NO3 at 67 kg N ha�1 during seeding of all crops.
Phosphorus was applied with the seed as 0-44-0 at 11 kg P ha�1. Appropriate fungi-
cide seed treatments were used except for dry bean, dry pea, and soybean to which
recommended inoculants were applied. Weeds were controlled with herbicides
following standard no-till recommendations for each crop and crop sequence.
Table 2
Cultivars, seeding rate, and seeding and harvesting dates used for the 10 crops in the crop matrix
Crop Cultivar Viable
seeds ha�1
Seeding date Harvest date
Canola Dynamite 2.5 million Late April to mid-May Early to late August
Crambe Meyer 2.0 million Late April to mid-May Early to late August
Dry bean T-39 (1999)
Black shadow
(1998, 2000)
222,000 After all possible chance
of frost to early June
Late August to late September
Dry pea Profi 864,000 Early April to mid-May Early to mid-August
Flax Omega 9.9 million Late April to mid-May Early August to mid-September
Safflower Montola 2000 494,000 Late April to mid-May Late August to mid September
Soybean Jim 494,000 Late May to first week
in June
Mid to late September
Sunflower Cenex 803 69,000 Mid-May to early June Early to late October
Spring wheat Amidon 3.2 million Late March to mid-May Early to late August
Barley Stander 3.2 million Late March to mid-May Early to late August
232 J.M. Krupinsky et al. / Agricultural Systems 88 (2006) 227–254
Volunteer crops as well as weed problems were minimal because of weather condi-
tions and management practices.
2.2. Residue carryover
In the third year, when spring wheat was seeded over the crop matrix in 2001 (site
2), soil coverage by crop residue was measured with a transect technique (Tanaka
and Hofman, 1994). Counts of residue presence were taken at 25 points equally
spaced along a 7.6-m cable, which was stretched across each plot four times to count
the number of residue contacts for a total of 100 points. On each plot, two V patterns
were formed, which pointed in the same direction of seeding. When residue
intersected with a point on the cable, it was counted as a contact. Total number
of residue contacts and number of obvious wheat residue contacts were recorded.Counts were done soon after spring wheat seeding, before emergence.
2.3. Soil water
Soil water measurements were taken in the spring to determine the amount of soil
water present after the 10 crops were grown. Measurements were done immediately
following spring wheat seeding in plots on which the 10 alternative crops had been
grown the previous year. Selected plots were located at site 1 in 1999 and at site 2 in2000 and 2001 (Table 1). Access tubes (steel pipes, 2.7 m in length and 40 mm inside
diameter) were installed in the center of each treatment plot of interest. Soil water
measurements were taken in these access tubes to a depth of 2.1 m at 0.3 m intervals.
Water contents were measured with a Model DR503 nuclear moisture gauge (CPN
International Inc.). Moisture gauge calibration was achieved through comparison of
moisture guage readings with volumetric water content measurements, which com-
bined gravimetric soil water and soil bulk density determinations.
2.4. Surface soil properties, crop matrix
Prior to the uniform seeding of spring wheat on the experimental area soil samples
were collected within plots where a crop was seeded on its own crop residue (e.g.,
barley/barley) in the spring of 2000 (site 1) and 2001 (site 2). During each year, soil
samples were collected in three replicates of the experiment where inherent soil con-
ditions were most uniform based on inspection of a soil survey map. In each plot, 10
soil cores were collected from the 0 to 7.5 cm depth using a 3.1 cm (i.d.) step-downprobe. To ensure composite soil samples were representative of soil conditions in
each plot, four cores each were collected from the row, four from the non-wheel
tracked interrow, and two from the wheel tracked interrow. Each sample was saved
in a double-lined plastic bag, placed in cold storage at 5 �C, and analyzed for chem-
ical and biological attributes within 2-wk of collection.
Soil samples were processed by sieving through a 2.0-mm sieve at field moisture
content and subsampled for chemical and biological analyses. Identifiable plant
material retained on the sieve was dried at 55 �C and weighed. Soil pH was estimated
J.M. Krupinsky et al. / Agricultural Systems 88 (2006) 227–254 233
from a 1:1 soil–water mixture (Watson and Brown, 1998). Particulate organic matter
(POM) was estimated by weight loss-on-ignition for the 0.053–0.5 and 0.5–2.0 mm
size fractions (Cambardella et al., 2000). Potentially mineralizable nitrogen was
estimated from the NH4–N accumulated after a 7-d anaerobic incubation at 40 �C(Bundy and Meisinger, 1994). Soil microbial biomass carbon was estimated usingthe microwave irradiation technique (Islam and Weil, 1998). Fifty grams of field
moist soil was incubated 10-d at 55% water-filled pore space in the presence of
10 ml of 2.0 M NaOH. Carbon dioxide content was determined by single end-point
titration with 0.1 M HCl (Paul et al., 1999). Flush of CO2–carbon following irradi-
ation was calculated without subtraction of a 10-d control as suggested by Fran-
zluebbers et al. (1999). Soil microbial biomass nitrogen was estimated from a 10-d
mineral nitrogen flush between irradiated and non-irradiated soil following the
method of Shen et al. (1984). Soil NO3–N and NH4–N were estimated from 1:10soil–KCl (2 M) extracts using cadmium reduction followed by a modified Griess–
Ilosvay method and indophenol blue reaction (Mulvaney, 1996). Gravimetric data
were converted to a volumetric basis by sampling depth using field measured soil
bulk density (Blake and Hartge, 1986). All data were expressed on an oven-dry
basis.
2.5. Leaf spot disease on spring wheat following crop matrix
Leaf spot disease severity on spring wheat and barley following 10 crops in the
crop matrix (sites 1 and 2) was previously reported (Krupinsky et al., 2004). In
the third year, when spring wheat was uniformly seeded over each crop matrix (Ta-
ble 1), spring wheat was evaluated for leaf spot disease severity at both sites as in a
previous study (Krupinsky et al., 2004). The total percentage of necrosis and chloro-
sis was visually assessed for individual spring wheat leaves (20 leaves per plot for
each evaluation) and used as an indicator of the severity of leaf spot diseases. The
leaves evaluated for disease severity were the flagleaf (the uppermost leaf), flag-leaf-1 (first leaf below the flagleaf), flagleaf-2, and flagleaf-3.
Spring wheat was evaluated for disease severity following selected crop sequence
treatments. Evaluated crop sequence treatments included: (1) spring wheat after nine
alternative crops (one year without spring wheat: spring wheat/alternative crop/
spring wheat); (2) spring wheat after two alternative crops (two years without spring
wheat: alternative crop/alternative crop/spring wheat); and (3) spring wheat after
spring wheat. The spring wheat after spring wheat treatments (spring wheat/spring
wheat/spring wheat and flax/spring wheat/spring wheat) were considered to be mostfavorable for disease development. For the first two evaluations of 2000, three rep-
licates of 22 crop sequence treatments were evaluated for leaf spot disease severity at
site 1. Afterwards, additional crop sequence treatments in which a crop was seeded
on its own crop residue (e.g. barley/barley/spring wheat) were included, giving a total
of 29 crop sequence treatments for evaluation. Even though seeding a crop on its
own crop residue is not a recommended management practice, the treatments were
used to obtain a more uniform crop residue of a particular crop. In 2001, four rep-
licates of 32 crop sequence treatments were evaluated for leaf spot disease severity at
234 J.M. Krupinsky et al. / Agricultural Systems 88 (2006) 227–254
site 2. Disease severity was evaluated seven times in 2000 (June 28–July 17) and eight
times in 2001 (June 27–July 17).
2.6. Fungal spores, spring wheat following crop matrix
Fungal conidia of Pyrenophora tritici-repentis [Died.] Drechs., cause of tan spot
disease on wheat, were monitored during the 2001 season within several crop se-
quence treatments using spore samplers at site 2. Ten spore samplers (Rotorod sam-
plers, Model 82, Multidata, St. Louis Park, MN) were placed within spring wheat in
two replicates of the flax/dry bean/spring wheat, flax/safflower/spring wheat, and dry
pea/crambe/spring wheat treatments to provide residue treatments without spring
wheat for two years. Considering the field size and distances between plots these
treatments were selected because they could be efficiently monitored. Spore samplerswere also placed in four replicates of continuous wheat for comparison. The sam-
plers operated 10% of the time and the ‘‘I’’ rods were changed daily, mounted,
stained and stored as previously described (Krupinsky, 1992). The fungal spores
were examined microscopically on an 18 mm section of the sampling rod (under
the 18 mm cover slip) with a compound Zeiss microscope illuminated with an Illu-
minator 100. Spore production was monitored from May 16 (DOY 136) to July 6
(DOY 187).
2.7. Sclerotinia disease, crop matrix; sunflower following crop matrix
The fungus, S. sclerotiorum, causes Sclerotinia stem rot (white mold) on canola
and crambe, Sclerotinia stem rot and head rot (head blight) on safflower and sun-
flower (Bailey et al., 2003; Nyvall, 1999). Canola, crambe, safflower, and sunflower
plants were evaluated for Sclerotinia diseases within the crop matrix at both sites.
Canola and crambe plants with bleached (white) stems, stems sometimes shredding,
were rated positive for Sclerotinia at both sites (100 plants per plot) (Lamey, 1995).Safflower heads were rated positive for the incidence of Sclerotinia head blight when
a sclerotium (hard fungal body) was present under a necrotic head. Fifty and 100
heads per plot were evaluated at site 1 and 2, respectively. Sunflower plants were
rated positive for Sclerotinia basal stem rot (50 and 25 plants per plot at site 1
and 2, respectively) when a basal stem canker was present at the base of the plant.
A tan, grayish or green-brown canker forms at the base of a Sclerotinia infected
plant and, as the decay progresses, the stalk becomes bleached with a shredded
appearance (Gulya et al., 1994).In the fourth year, sunflower was uniformly seeded following spring wheat
over the crop matrix (Table 1). Because Sclerotinia basal stem rot on sunflower
is initiated by root contact with the fungus (Gulya et al., 1994), sunflower was
used as a Sclerotinia-indicator crop. Thus, sunflower provided an assessment
of Sclerotinia carryover associated with various crop sequence treatments.
Sunflower plants grown on four replicates of 100 treatments were evaluated
for presence of Sclerotinia basal stem rot (60 plants per plot) on September 4
and 18 at site 2.
J.M. Krupinsky et al. / Agricultural Systems 88 (2006) 227–254 235
2.8. Statistical analysis
Crop production and soil water data were analyzed using the GLM procedure
(SAS, 8.0, SAS Inst., Cary, NC). Statistical comparisons within each evaluation were
made with Tukey�s HSD test. Crop residue data were analyzed using the GLM pro-cedure and statistical comparisons were made with Scheffe�s test. When spring wheat
was seeded over each previous crop matrix during the third year (Table 1), Dunnett�sone-tailed test was used to make comparisons between crop sequence treatments and
the continuous wheat treatment, which was considered to have the lowest yield po-
tential. Mean values of soil properties as affected by crop were compared using
PROC MIXED (Littell et al., 1996). All statistical differences were evaluated at a
probability level of p 6 0.05.
Severity of leaf spot diseases associated with various crop sequences was com-pared using the GLM procedure (SAS, 8.0, SAS Inst., Cary, NC). Dunnett�s one-
tailed test was used to make comparisons between the crop sequence treatments
and the continuous wheat treatment, which was considered to be the most favorable
for leaf spot disease development. For Sclerotinia diseases, the GLM procedure was
conducted using the number of infected heads or plants for each field evaluation.
Statistical comparisons within each evaluation were made with Student–Newman–
Keuls� test. All statistical differences were evaluated at a probability level of p 6 0.05.
2.9. Synthesis of data
In order to understand the overall crop sequential effects, the crop matrix yield
data were interpreted with relative values to assess overall positive or negative effects.
The crop matrix yield data (Tables 3 and 4) were evaluated by a t-test and, based on
the t-test, scores were assigned, which were converted to relative values to better
understand the overall crop sequential effects. To begin with, the differences between
crop yields due to previous crop within a column (crop), and the annual crop averagewere determined by a one-tailed t-test (Tables 3 and 4). In order to quantify the effect
of the residue crop on the subsequent crop, scores were assigned when a significant
difference was detected between a crop yield and the annual crop average (yield
across all residue treatments). If the difference was significant at p 6 0.10, then it
was assigned a score of 1 for a positive effect and �1 for a negative. If it was signif-
icant at p 6 0.05, then it was assigned a score of 2 for a positive effect and �2 for a
negative effect. Scores for positive and negative effects were separately totaled along
rows and overall residue crop scores were tabulated (Table 5).The 40 residue crop scores were converted to relative values so that the average
relative value for a crop was 10. With this process, the numerical values can be inter-
preted on a percentage basis. An example of this process: with dry bean as the res-
idue crop in 2000 (Table 4), canola was assigned a score of 2 because canola yield
following dry bean was significantly higher than the annual crop mean for canola
at the p 6 0.05 level. Sunflower was assigned a score of 1 because sunflower yield fol-
lowing dry bean was significantly higher than its annual crop mean at the p 6 0.10
level. Thus, the total score for yields in 2000 with dry bean as the residue crop
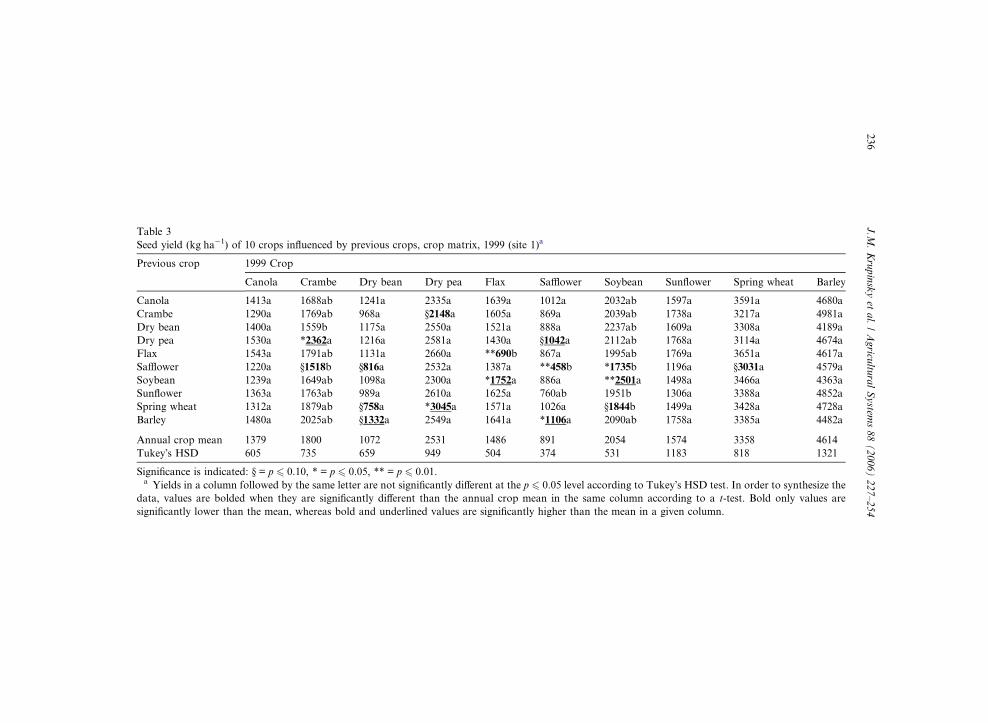
Table 3
Seed yield (kg ha�1) of 10 crops influenced by previous crops, crop matrix, 1999 (site 1)a
Previous crop 1999 Crop
Canola Crambe Dry bean Dry pea Flax Safflower Soybean Sunflower Spring wheat Barley
Canola 1413a 1688ab 1241a 2335a 1639a 1012a 2032ab 1597a 3591a 4680a
Crambe 1290a 1769ab 968a §2148a 1605a 869a 2039ab 1738a 3217a 4981a
Dry bean 1400a 1559b 1175a 2550a 1521a 888a 2237ab 1609a 3308a 4189a
Dry pea 1530a *2362a 1216a 2581a 1430a §1042a 2112ab 1768a 3114a 4674a
Flax 1543a 1791ab 1131a 2660a **690b 867a 1995ab 1769a 3651a 4617a
Safflower 1220a §1518b §816a 2532a 1387a **458b *1735b 1196a §3031a 4579a
Soybean 1239a 1649ab 1098a 2300a *1752a 886a **2501a 1498a 3466a 4363a
Sunflower 1363a 1763ab 989a 2610a 1625a 760ab 1951b 1306a 3388a 4852a
Spring wheat 1312a 1879ab §758a *3045a 1571a 1026a §1844b 1499a 3428a 4728a
Barley 1480a 2025ab §1332a 2549a 1641a *1106a 2090ab 1758a 3385a 4482a
Annual crop mean 1379 1800 1072 2531 1486 891 2054 1574 3358 4614
Tukey�s HSD 605 735 659 949 504 374 531 1183 818 1321
Significance is indicated: § = p 6 0.10, * = p 6 0.05, ** = p 6 0.01.a Yields in a column followed by the same letter are not significantly different at the p 6 0.05 level according to Tukey�s HSD test. In order to synthesize the
data, values are bolded when they are significantly different than the annual crop mean in the same column according to a t-test. Bold only values are
significantly lower than the mean, whereas bold and underlined values are significantly higher than the mean in a given column.
236
J.M
.Krupinskyet
al./Agricu
lturalSystem
s88(2006)227–254
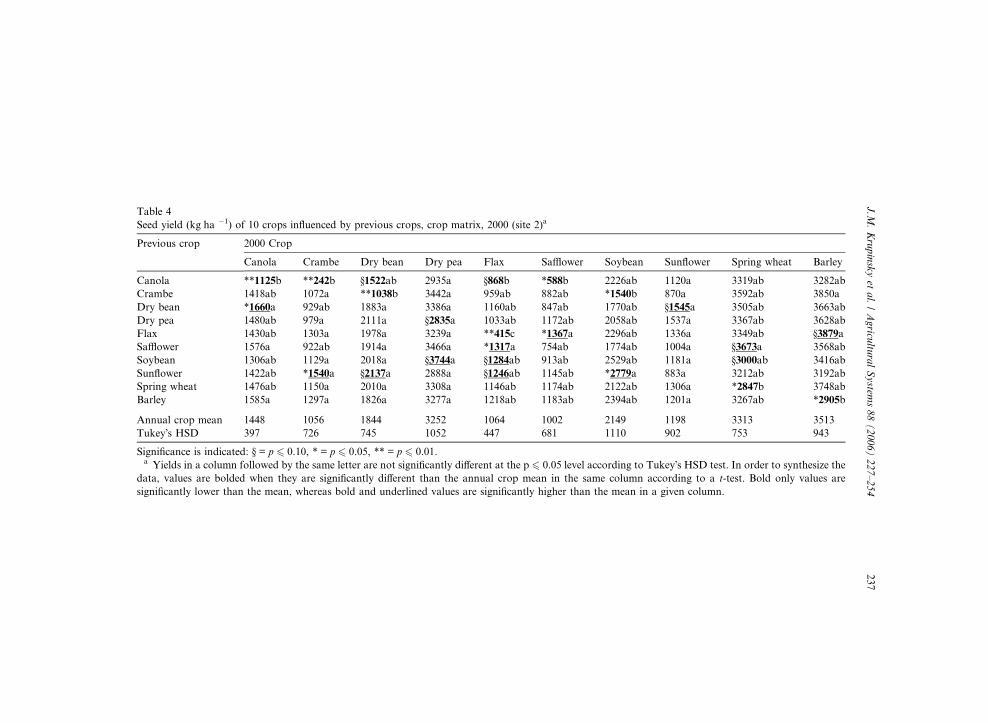
Table 4
Seed yield (kg ha �1) of 10 crops influenced by previous crops, crop matrix, 2000 (site 2)a
Previous crop 2000 Crop
Canola Crambe Dry bean Dry pea Flax Safflower Soybean Sunflower Spring wheat Barley
Canola **1125b **242b §1522ab 2935a §868b *588b 2226ab 1120a 3319ab 3282ab
Crambe 1418ab 1072a **1038b 3442a 959ab 882ab *1540b 870a 3592ab 3850a
Dry bean *1660a 929ab 1883a 3386a 1160ab 847ab 1770ab §1545a 3505ab 3663ab
Dry pea 1480ab 979a 2111a §2835a 1033ab 1172ab 2058ab 1537a 3367ab 3628ab
Flax 1430ab 1303a 1978a 3239a **415c *1367a 2296ab 1336a 3349ab §3879a
Safflower 1576a 922ab 1914a 3466a *1317a 754ab 1774ab 1004a §3673a 3568ab
Soybean 1306ab 1129a 2018a §3744a §1284ab 913ab 2529ab 1181a §3000ab 3416ab
Sunflower 1422ab *1540a §2137a 2888a §1246ab 1145ab *2779a 883a 3212ab 3192ab
Spring wheat 1476ab 1150a 2010a 3308a 1146ab 1174ab 2122ab 1306a *2847b 3748ab
Barley 1585a 1297a 1826a 3277a 1218ab 1183ab 2394ab 1201a 3267ab *2905b
Annual crop mean 1448 1056 1844 3252 1064 1002 2149 1198 3313 3513
Tukey�s HSD 397 726 745 1052 447 681 1110 902 753 943
Significance is indicated: § = p 6 0.10, * = p 6 0.05, ** = p 6 0.01.a Yields in a column followed by the same letter are not significantly different at the p 6 0.05 level according to Tukey�s HSD test. In order to synthesize the
data, values are bolded when they are significantly different than the annual crop mean in the same column according to a t-test. Bold only values are
significantly lower than the mean, whereas bold and underlined values are significantly higher than the mean in a given column.
J.M
.Krupinskyet
al./Agricu
lturalSystem
s88(2006)227–254
237
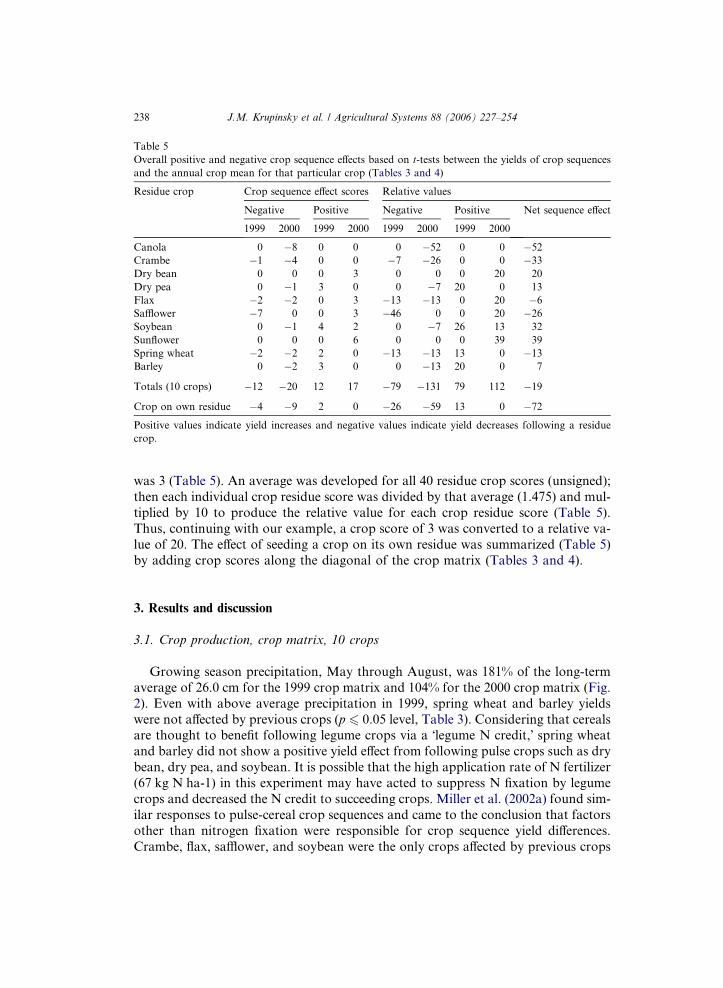
Table 5
Overall positive and negative crop sequence effects based on t-tests between the yields of crop sequences
and the annual crop mean for that particular crop (Tables 3 and 4)
Residue crop Crop sequence effect scores Relative values
Negative Positive Negative Positive Net sequence effect
1999 2000 1999 2000 1999 2000 1999 2000
Canola 0 �8 0 0 0 �52 0 0 �52
Crambe �1 �4 0 0 �7 �26 0 0 �33
Dry bean 0 0 0 3 0 0 0 20 20
Dry pea 0 �1 3 0 0 �7 20 0 13
Flax �2 �2 0 3 �13 �13 0 20 �6
Safflower �7 0 0 3 �46 0 0 20 �26
Soybean 0 �1 4 2 0 �7 26 13 32
Sunflower 0 0 0 6 0 0 0 39 39
Spring wheat �2 �2 2 0 �13 �13 13 0 �13
Barley 0 �2 3 0 0 �13 20 0 7
Totals (10 crops) �12 �20 12 17 �79 �131 79 112 �19
Crop on own residue �4 �9 2 0 �26 �59 13 0 �72
Positive values indicate yield increases and negative values indicate yield decreases following a residue
crop.
238 J.M. Krupinsky et al. / Agricultural Systems 88 (2006) 227–254
was 3 (Table 5). An average was developed for all 40 residue crop scores (unsigned);
then each individual crop residue score was divided by that average (1.475) and mul-
tiplied by 10 to produce the relative value for each crop residue score (Table 5).
Thus, continuing with our example, a crop score of 3 was converted to a relative va-
lue of 20. The effect of seeding a crop on its own residue was summarized (Table 5)
by adding crop scores along the diagonal of the crop matrix (Tables 3 and 4).
3. Results and discussion
3.1. Crop production, crop matrix, 10 crops
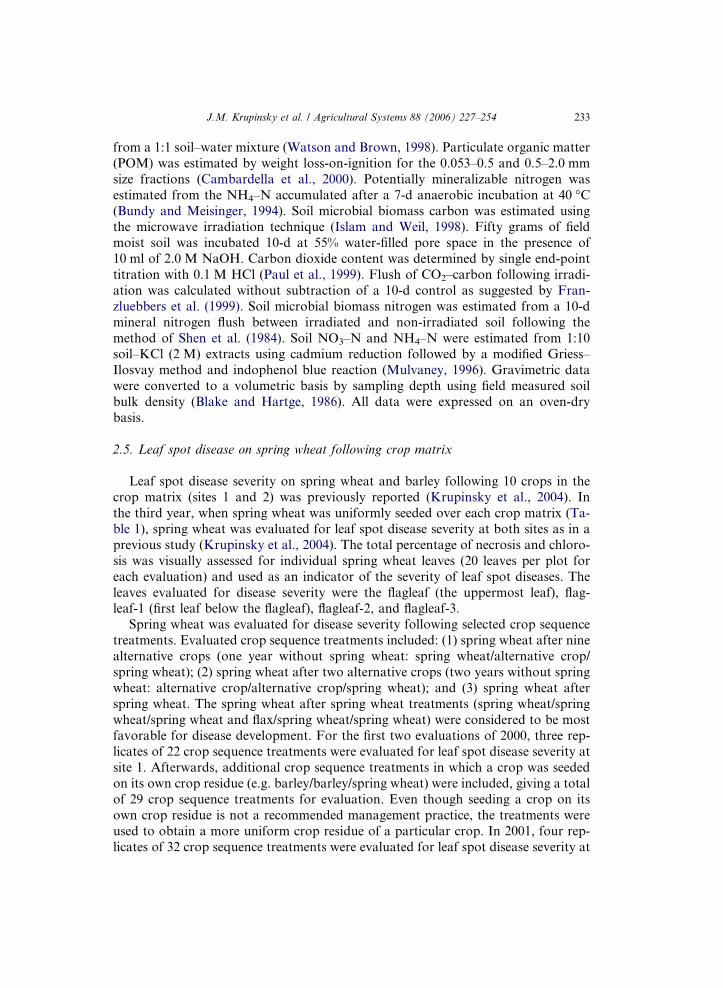
Growing season precipitation, May through August, was 181% of the long-term
average of 26.0 cm for the 1999 crop matrix and 104% for the 2000 crop matrix (Fig.
2). Even with above average precipitation in 1999, spring wheat and barley yields
were not affected by previous crops (p 6 0.05 level, Table 3). Considering that cerealsare thought to benefit following legume crops via a �legume N credit,� spring wheat
and barley did not show a positive yield effect from following pulse crops such as dry
bean, dry pea, and soybean. It is possible that the high application rate of N fertilizer
(67 kg N ha-1) in this experiment may have acted to suppress N fixation by legume
crops and decreased the N credit to succeeding crops. Miller et al. (2002a) found sim-
ilar responses to pulse-cereal crop sequences and came to the conclusion that factors
other than nitrogen fixation were responsible for crop sequence yield differences.
Crambe, flax, safflower, and soybean were the only crops affected by previous crops
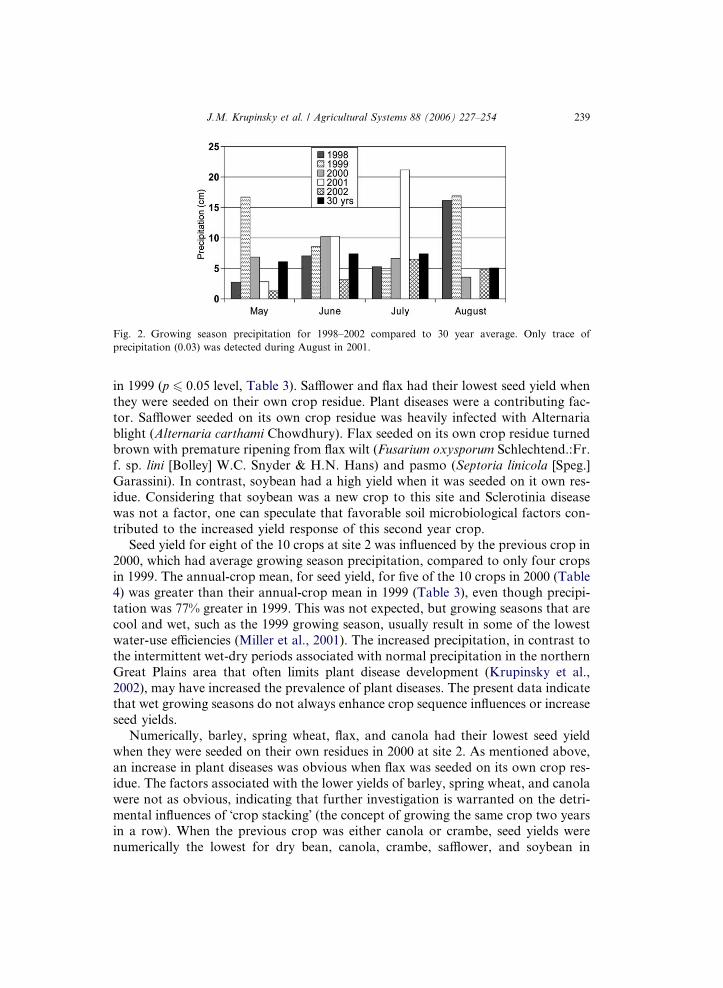
Fig. 2. Growing season precipitation for 1998–2002 compared to 30 year average. Only trace of
precipitation (0.03) was detected during August in 2001.
J.M. Krupinsky et al. / Agricultural Systems 88 (2006) 227–254 239
in 1999 (p 6 0.05 level, Table 3). Safflower and flax had their lowest seed yield when
they were seeded on their own crop residue. Plant diseases were a contributing fac-
tor. Safflower seeded on its own crop residue was heavily infected with Alternaria
blight (Alternaria carthami Chowdhury). Flax seeded on its own crop residue turnedbrown with premature ripening from flax wilt (Fusarium oxysporum Schlechtend.:Fr.
f. sp. lini [Bolley] W.C. Snyder & H.N. Hans) and pasmo (Septoria linicola [Speg.]
Garassini). In contrast, soybean had a high yield when it was seeded on it own res-
idue. Considering that soybean was a new crop to this site and Sclerotinia disease
was not a factor, one can speculate that favorable soil microbiological factors con-
tributed to the increased yield response of this second year crop.
Seed yield for eight of the 10 crops at site 2 was influenced by the previous crop in
2000, which had average growing season precipitation, compared to only four cropsin 1999. The annual-crop mean, for seed yield, for five of the 10 crops in 2000 (Table
4) was greater than their annual-crop mean in 1999 (Table 3), even though precipi-
tation was 77% greater in 1999. This was not expected, but growing seasons that are
cool and wet, such as the 1999 growing season, usually result in some of the lowest
water-use efficiencies (Miller et al., 2001). The increased precipitation, in contrast to
the intermittent wet-dry periods associated with normal precipitation in the northern
Great Plains area that often limits plant disease development (Krupinsky et al.,
2002), may have increased the prevalence of plant diseases. The present data indicatethat wet growing seasons do not always enhance crop sequence influences or increase
seed yields.
Numerically, barley, spring wheat, flax, and canola had their lowest seed yield
when they were seeded on their own residues in 2000 at site 2. As mentioned above,
an increase in plant diseases was obvious when flax was seeded on its own crop res-
idue. The factors associated with the lower yields of barley, spring wheat, and canola
were not as obvious, indicating that further investigation is warranted on the detri-
mental influences of �crop stacking� (the concept of growing the same crop two yearsin a row). When the previous crop was either canola or crambe, seed yields were
numerically the lowest for dry bean, canola, crambe, safflower, and soybean in
240 J.M. Krupinsky et al. / Agricultural Systems 88 (2006) 227–254
2000. Therefore, choosing a proper crop sequence with canola and/or crambe can be
crucial if optimum seed yields are to be obtained by a succeeding crop. Dry pea and
sunflower were the only crops not influenced by previous crops in 2000.
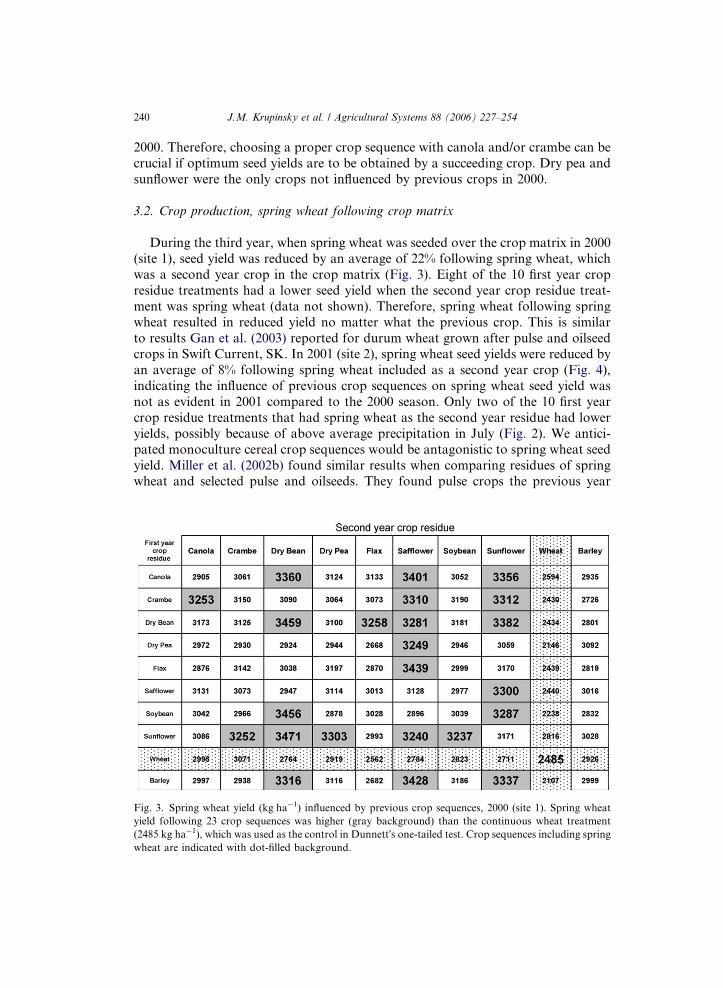
3.2. Crop production, spring wheat following crop matrix
During the third year, when spring wheat was seeded over the crop matrix in 2000
(site 1), seed yield was reduced by an average of 22% following spring wheat, which
was a second year crop in the crop matrix (Fig. 3). Eight of the 10 first year crop
residue treatments had a lower seed yield when the second year crop residue treat-
ment was spring wheat (data not shown). Therefore, spring wheat following spring
wheat resulted in reduced yield no matter what the previous crop. This is similar
to results Gan et al. (2003) reported for durum wheat grown after pulse and oilseedcrops in Swift Current, SK. In 2001 (site 2), spring wheat seed yields were reduced by
an average of 8% following spring wheat included as a second year crop (Fig. 4),
indicating the influence of previous crop sequences on spring wheat seed yield was
not as evident in 2001 compared to the 2000 season. Only two of the 10 first year
crop residue treatments that had spring wheat as the second year residue had lower
yields, possibly because of above average precipitation in July (Fig. 2). We antici-
pated monoculture cereal crop sequences would be antagonistic to spring wheat seed
yield. Miller et al. (2002b) found similar results when comparing residues of springwheat and selected pulse and oilseeds. They found pulse crops the previous year
Fig. 3. Spring wheat yield (kg ha�1) influenced by previous crop sequences, 2000 (site 1). Spring wheat
yield following 23 crop sequences was higher (gray background) than the continuous wheat treatment
(2485 kg ha�1), which was used as the control in Dunnett�s one-tailed test. Crop sequences including spring
wheat are indicated with dot-filled background.
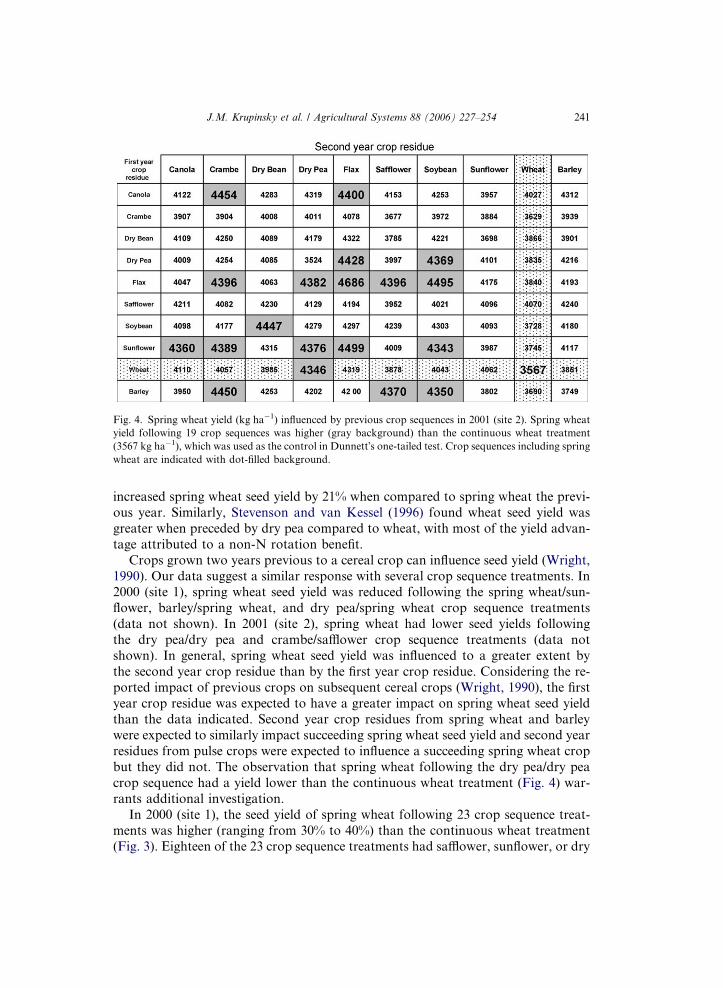
Fig. 4. Spring wheat yield (kg ha�1) influenced by previous crop sequences in 2001 (site 2). Spring wheat
yield following 19 crop sequences was higher (gray background) than the continuous wheat treatment
(3567 kg ha�1), which was used as the control in Dunnett�s one-tailed test. Crop sequences including spring
wheat are indicated with dot-filled background.
J.M. Krupinsky et al. / Agricultural Systems 88 (2006) 227–254 241
increased spring wheat seed yield by 21% when compared to spring wheat the previ-
ous year. Similarly, Stevenson and van Kessel (1996) found wheat seed yield was
greater when preceded by dry pea compared to wheat, with most of the yield advan-
tage attributed to a non-N rotation benefit.
Crops grown two years previous to a cereal crop can influence seed yield (Wright,
1990). Our data suggest a similar response with several crop sequence treatments. In2000 (site 1), spring wheat seed yield was reduced following the spring wheat/sun-
flower, barley/spring wheat, and dry pea/spring wheat crop sequence treatments
(data not shown). In 2001 (site 2), spring wheat had lower seed yields following
the dry pea/dry pea and crambe/safflower crop sequence treatments (data not
shown). In general, spring wheat seed yield was influenced to a greater extent by
the second year crop residue than by the first year crop residue. Considering the re-
ported impact of previous crops on subsequent cereal crops (Wright, 1990), the first
year crop residue was expected to have a greater impact on spring wheat seed yieldthan the data indicated. Second year crop residues from spring wheat and barley
were expected to similarly impact succeeding spring wheat seed yield and second year
residues from pulse crops were expected to influence a succeeding spring wheat crop
but they did not. The observation that spring wheat following the dry pea/dry pea
crop sequence had a yield lower than the continuous wheat treatment (Fig. 4) war-
rants additional investigation.
In 2000 (site 1), the seed yield of spring wheat following 23 crop sequence treat-
ments was higher (ranging from 30% to 40%) than the continuous wheat treatment(Fig. 3). Eighteen of the 23 crop sequence treatments had safflower, sunflower, or dry
242 J.M. Krupinsky et al. / Agricultural Systems 88 (2006) 227–254
bean as the second year crop. In 2001 (site 2), the seed yield of spring wheat follow-
ing 19 crop sequence treatments was higher (ranging from 22% to 31%) than the con-
tinuous wheat treatment (Fig. 4). Greater yields did not appear to be highly
associated with the second year crops as in 2000 but were more closely associated
with the first year crops of flax and sunflower. All crop sequence treatments thatyielded better than the continuous wheat treatment were comprised of mostly
non-cereal crops (Figs. 3 and 4). In contrast, the crop sequence treatments with
either spring wheat or barley in second year of the crop matrix (20 treatments) did
not yield better than the continuous wheat treatment (Figs. 3 and 4) in either year.
In addition, there was only one treatment out of 10 that included spring wheat in the
first year of the crop sequence that yielded better than the continuous wheat treat-
ment over two years. This indicates the importance of crop diversity prior to a spring
wheat crop for optimizing spring wheat production. The use of alternative crops inthe rotations allows time for natural enemies to destroy potential wheat pathogens
(Cook and Veseth, 1991; Krupinsky et al., 2002).
Even though approximately 20% of all the crop sequences tested each year yielded
significantly better than the continuous wheat treatment, only six crop sequences
(sunflower/crambe, soybean/dry bean, sunflower/dry pea, flax/safflower, barley/saf-
flower, and sunflower/soybean) were common to both years demonstrating the diffi-
culty of selecting a specific crop sequence for all environmental conditions. As Cook
and Veseth (1991) indicate, the number of years with alternative crops before return-ing to wheat may be more important than the crops used in the crop sequences. This
again shows the need for diversity, not only in the crops used but also in the crop
sequences used in a long-term cropping system.
3.3. Residue carryover
Soil coverage by crop residue influences the soil surface environment. Moisture
retention is improved with soil coverage by crop residue because of reduced evapora-tion, increased snow trapping, and reduced surface runoff due to better water infiltra-
tion (Cook and Veseth, 1991). Higher residue coverage delays heating and drying of
the soil surface, especially earlier in the growing season. Reduction in drying of the
soil surface allows for greater root activity and enhancement of biological activity.
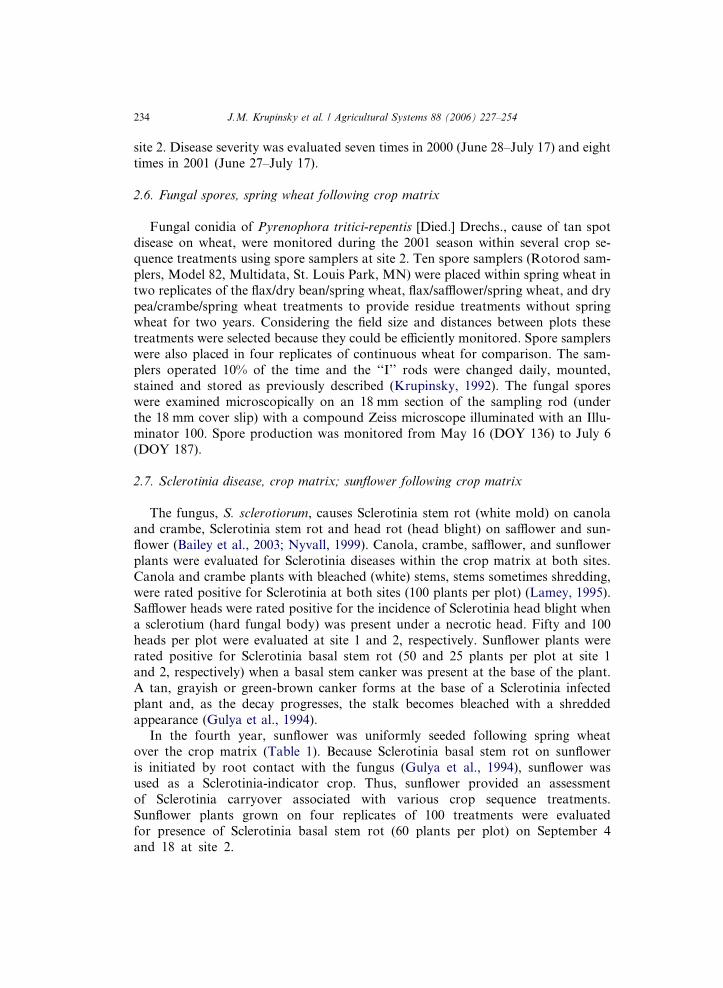
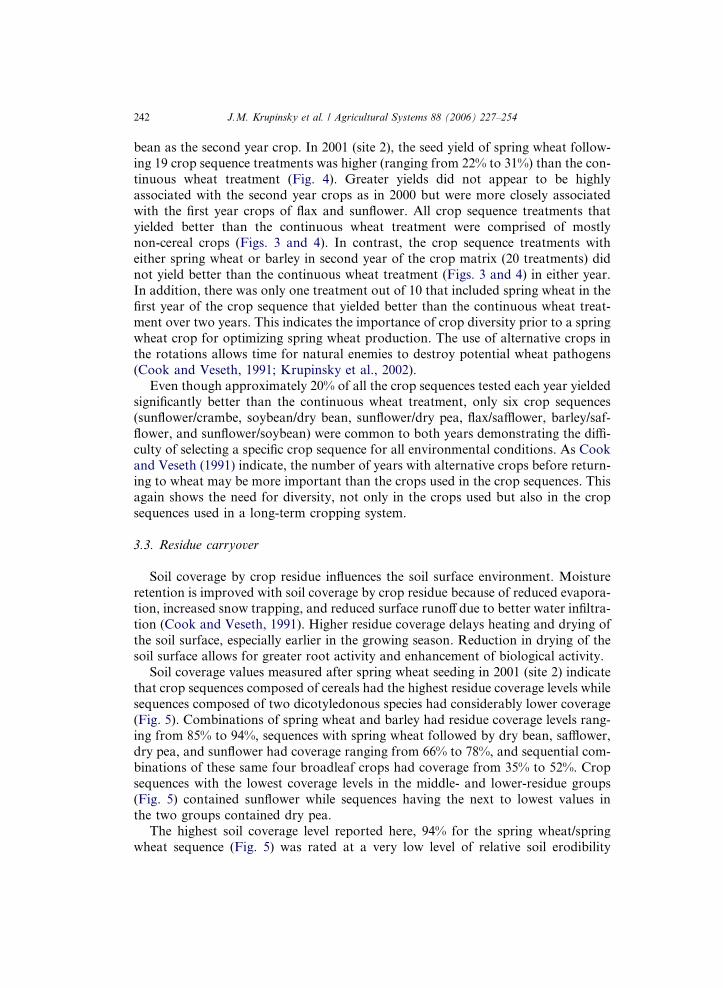
Soil coverage values measured after spring wheat seeding in 2001 (site 2) indicate
that crop sequences composed of cereals had the highest residue coverage levels while
sequences composed of two dicotyledonous species had considerably lower coverage
(Fig. 5). Combinations of spring wheat and barley had residue coverage levels rang-ing from 85% to 94%, sequences with spring wheat followed by dry bean, safflower,
dry pea, and sunflower had coverage ranging from 66% to 78%, and sequential com-
binations of these same four broadleaf crops had coverage from 35% to 52%. Crop
sequences with the lowest coverage levels in the middle- and lower-residue groups
(Fig. 5) contained sunflower while sequences having the next to lowest values in
the two groups contained dry pea.
The highest soil coverage level reported here, 94% for the spring wheat/spring
wheat sequence (Fig. 5) was rated at a very low level of relative soil erodibility
Crop sequence
SW/S
WSW
/BR
BR/B
R .SW
/BN
SW/S
FSW
/PE
SW/S
N
PE/P
EBN
/BN
SF/S
FPE
/SN
SN/S
N
Per
cent
soi
l cov
erag
e by
res
idue
0
10
20
30
40
50
60
70
80
90
100
0
10
20
30
40
50
60
70
80
90
100SW = spring wheat; BR = barley, BN = dry bean,
SF = safflower, PE = dry pea, SN = sunflower
aab
a-ca-e a-e
a-f a-f
b-fc-f d-f
e-ff
Fig. 5. Percentage of soil covered by crop residue measured in the spring of 2001 (site 2) soon after spring
wheat seeding. The sequence of crops grown in 1999 and 2000 is identified. Entries possessing the same
letter (note letter ranges) are not significantly different according to Scheffe�s test at a probability level of
p 6 0.05. Previous crops: BR = barley, BN = dry bean, PE = Dry pea, SF = safflower, SN = sunflower,
and SW = spring wheat.
J.M. Krupinsky et al. / Agricultural Systems 88 (2006) 227–254 243
due to wind, 3% based on the Revised Wind Erosion Equation model (evaluated for
residue alone, no residue coverage = 100% relative soil erodibility; Bilbro and Fry-
rear, 1994; Fryrear et al., 1998). A comparable rating for relative soil erodibility
due to water was 4% (based on the Revised Universal Soil Loss Equation model; Re-
nard et al., 1997). Lower soil coverage levels reported here, 35–40% for sunflower/sunflower and dry pea/sunflower, respectively (Fig. 5), were rated at moderate levels
of relative soil erodibility due to wind, 23% and 19% respectively, based on the Re-
vised Wind Erosion Equation model. Comparable ratings for relative soil erodibility
due to water were 28% and 22% for sunflower/sunflower and dry pea/sunflower,
respectively. Thus, low residue crop sequence treatments such as dry pea/sunflower
need to be cautiously evaluated when considering crop sequences for lands that are
more inherently erodible.
These results were obtained under no-till management and during years of aboveaverage to average precipitation, a combination that tends to optimize residue pro-
duction. Even under these favorable conditions, marginal levels of soil coverage by
residues were detected in crop sequence treatments where lower residue-providing
crops were seeded into their own or each others residues (Fig. 5). Under conditions
of serious precipitation limitation and drought, two years of lower residue-generating
crops could result in low levels of soil coverage by residue and the hazard for potential
244 J.M. Krupinsky et al. / Agricultural Systems 88 (2006) 227–254
soil erosion will escalate. Under drought conditions, no-till management alone
will not prevent unacceptable levels of soil erosion hazard from occurring due to
low crop growth, low residue production, and surface soil disaggregation (Merrill
et al., 1999).
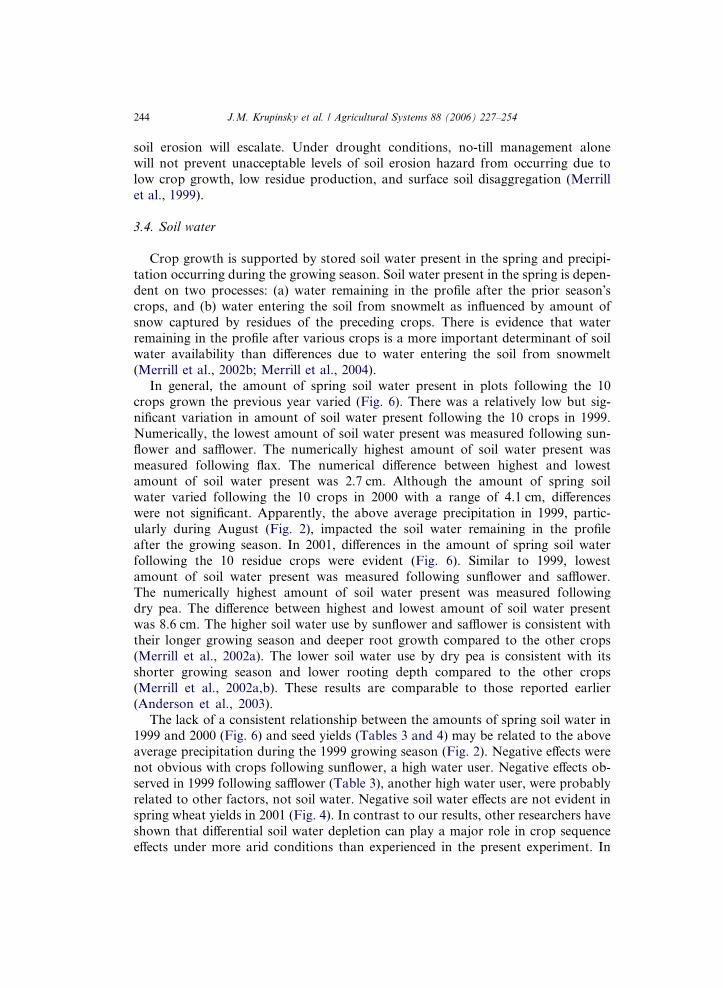
3.4. Soil water
Crop growth is supported by stored soil water present in the spring and precipi-
tation occurring during the growing season. Soil water present in the spring is depen-
dent on two processes: (a) water remaining in the profile after the prior season�scrops, and (b) water entering the soil from snowmelt as influenced by amount of
snow captured by residues of the preceding crops. There is evidence that water
remaining in the profile after various crops is a more important determinant of soilwater availability than differences due to water entering the soil from snowmelt
(Merrill et al., 2002b; Merrill et al., 2004).
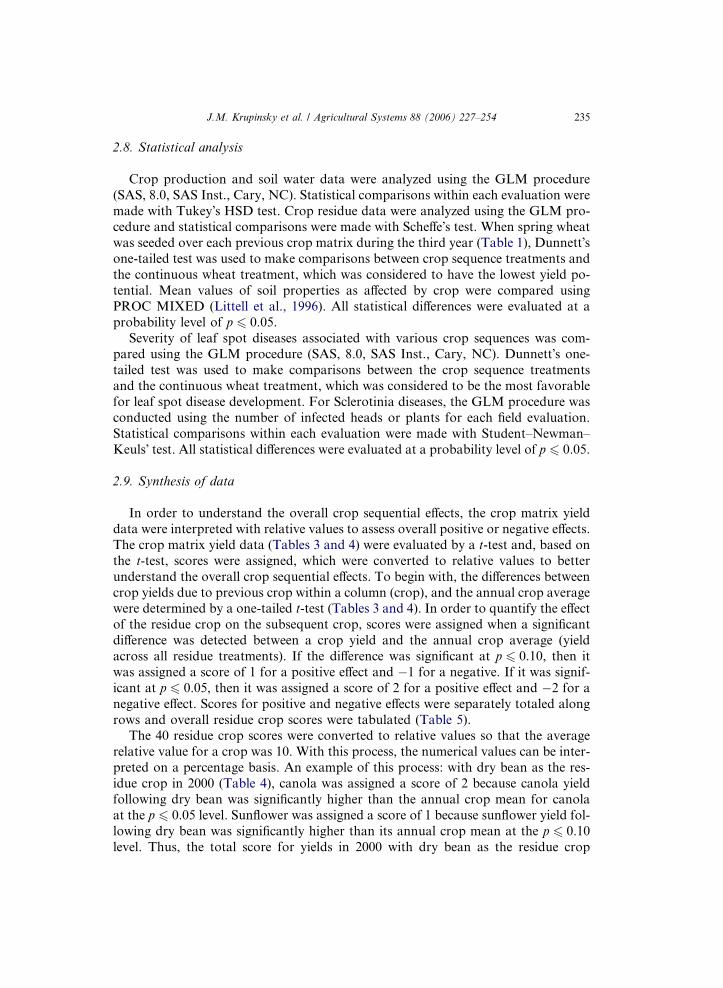
In general, the amount of spring soil water present in plots following the 10
crops grown the previous year varied (Fig. 6). There was a relatively low but sig-
nificant variation in amount of soil water present following the 10 crops in 1999.
Numerically, the lowest amount of soil water present was measured following sun-
flower and safflower. The numerically highest amount of soil water present was
measured following flax. The numerical difference between highest and lowestamount of soil water present was 2.7 cm. Although the amount of spring soil
water varied following the 10 crops in 2000 with a range of 4.1 cm, differences
were not significant. Apparently, the above average precipitation in 1999, partic-
ularly during August (Fig. 2), impacted the soil water remaining in the profile
after the growing season. In 2001, differences in the amount of spring soil water
following the 10 residue crops were evident (Fig. 6). Similar to 1999, lowest
amount of soil water present was measured following sunflower and safflower.
The numerically highest amount of soil water present was measured followingdry pea. The difference between highest and lowest amount of soil water present
was 8.6 cm. The higher soil water use by sunflower and safflower is consistent with
their longer growing season and deeper root growth compared to the other crops
(Merrill et al., 2002a). The lower soil water use by dry pea is consistent with its
shorter growing season and lower rooting depth compared to the other crops
(Merrill et al., 2002a,b). These results are comparable to those reported earlier
(Anderson et al., 2003).
The lack of a consistent relationship between the amounts of spring soil water in1999 and 2000 (Fig. 6) and seed yields (Tables 3 and 4) may be related to the above
average precipitation during the 1999 growing season (Fig. 2). Negative effects were
not obvious with crops following sunflower, a high water user. Negative effects ob-
served in 1999 following safflower (Table 3), another high water user, were probably
related to other factors, not soil water. Negative soil water effects are not evident in
spring wheat yields in 2001 (Fig. 4). In contrast to our results, other researchers have
shown that differential soil water depletion can play a major role in crop sequence
effects under more arid conditions than experienced in the present experiment. In
Measured April 20, 2000
BR CN CR BN PE FL SF SB SN
SW
Soi
l wat
er in
1.8
m o
f pro
file
--
cm
0
50
55
60
65
a
a
a aa
a aa
a
a
Measured May 9, 1999
BR CN CR BN PE FL SF SB SN
SW
0
50
55
60
65
Measured April 19, 2001
Previous year's crop
BR CN CR BN PE FL SF SB SN
SW
0
50
55
60
65
abc bcab
bc
a
ab
cd
ab
d
bc
abc abc abcabc
abc abcab a
bc c
Fig. 6. Total spring soil water content in the soil profile measured to a depth of 1.8 m where the indicated
crops had grown the previous year. Previous crops: BR = barley, CN = canola, CR = crambe, BN = dry
bean, PE = Dry pea, FL = flax, SF = safflower, SB = soybean, SN = sunflower, and SW = spring wheat.
J.M. Krupinsky et al. / Agricultural Systems 88 (2006) 227–254 245
the central Great Plains, yield of winter wheat was negatively impacted by the higher
water usage of prior sunflower and soybean crops (Nielsen et al., 1999; Norwood,
2000).
246 J.M. Krupinsky et al. / Agricultural Systems 88 (2006) 227–254
3.5. Surface soil properties, crop matrix
Soil surface properties including bulk density, soil pH, identifiable plant mate-
rial, particulate organic matter, potentially mineralizable N and microbial biomass
C and N were generally not affected by crops in this study (data not shown). Theonly exception was that particulate organic matter in the 0.5–2.0 mm size fraction
was greater after soybean (3054 kg ha�1) than after dry pea, safflower, flax and dry
bean (1595–1951 kg ha�1). Among the 10 crops, dry pea tended to possess the low-
est values for most soil properties, presumably because of low residue input to the
soil.
The short timeframe of the experiment likely contributed to the lack of significant
crop effects on soil properties. However, other factors may have played a role in the
prevalence of non-significant treatment effects. For instance, the field had inherentlyhigh soil fertility, had been continuously cropped under reduced-tillage management
for 14 yr prior to the initiation of the experiment, and was under no-till management
during the experiment. As a result, the potential for crops to have an appreciable ef-
fect on soil properties may have been small because of a �masking� effect from high
soil fertility and reduced-tillage.
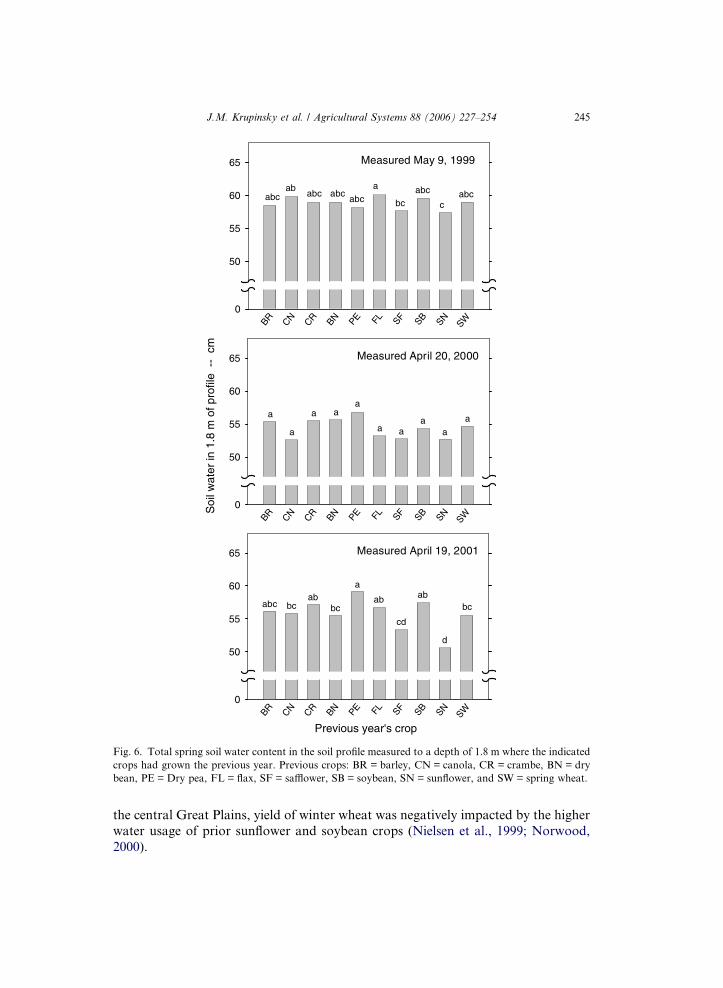
3.6. Leaf spot disease on spring wheat following crop matrix
Leaf spot diseases were present on spring wheat during the third year, when spring
wheat was seeded over the crop matrix. The most common leaf spot diseases on
spring wheat were tan spot, caused by Drechslera tritici-repentis [Died.] Shoemaker
(teleomorph = P. tritici-repentis) and stagonospora nodorum blotch, caused by
Stagonospora nodorum [Berk.] Cast. et Germ. (teleomorph = Phaeosphaeria
nodorum) [E. Muller] Hedjaroude (Krupinsky et al., 2004). When defining the rela-
tionship between yield and disease severity caused by tan spot and stagonospora
nodorum blotch, Bhathal et al. (2003) recently reported losses in grain yield rangingfrom 18% to 31%. Other diseases present included stagonospora avenae blotch
(Stagonospora avenae Bissett f. sp. triticea T. Johnson), and septoria tritici blotch
(Septoria tritici Roberge in Desmaz) and spot blotch (Bipolaris sorokiniana [Sacc.]
Shoemaker) (Krupinsky et al., 2004).
When spring wheat was evaluated for leaf spot disease severity in 2000 (site 1),
differences in disease severity among crop sequence treatments were evident in six
of seven evaluations. This indicates that disease severity was influenced by crop se-
quence treatments. As a group the �two year without spring wheat� crop sequencescould not be distinguished from the �one year without spring wheat� crop sequences
(Fig. 7(a)). There were individual crop sequences that had less disease severity than
the continuous wheat treatment. For example, leaf spot disease severity levels early
in the season on spring wheat following barley were lower than continuous wheat in
2000 (Fig. 7(b)). Similar to a previous report (Krupinsky et al., 2004), differences
among treatments were more evident in the earlier evaluations indicating a greater
influence of crop residue and carryover of inoculum earlier in the season compared
to later. When the continuous wheat treatment was used as the control, the crambe/
0102030405060708090
100
28Jn 30Jn 5Jl 7Jl 12Jl 14Jl 17Jl
FL/SW/SW
SW/SW/SW
SW/BR/SW
BR/BR/SW
CR/BR/SW
0102030405060708090
100
28Jn 30Jn 5Jl 7Jl 12Jl 14Jl 17Jl
FL/SW/SW
SW/SW/SW
No SW 1yr
No SW 2 yr
% N
ecro
sis/
chlo
rosi
s%
Nec
rosi
s/ch
loro
sis
Date of evaluation
Date of evaluation(a)
(b)
Fig. 7. Leaf spot disease severity (percentage necrosis and chlorosis) on Amidon spring wheat following
crop sequence treatments: (a) Spring wheat (SW) following spring wheat compared to �one-year-without-spring wheat� (No SW 1 yr) and �two-year-without-spring wheat� (No SW 2 yr) crop sequences. (b) Spring
wheat following spring wheat compared to spring wheat following barley (BR); FL = flax, CR = crambe.
J.M. Krupinsky et al. / Agricultural Systems 88 (2006) 227–254 247
barley/spring wheat treatment had less disease severity than continuous wheat in all
analyses when differences were detected. This is consistent with an earlier observa-
tion where the risk for leaf spot disease on spring wheat was lower following barley
compared to spring wheat (Krupinsky et al., 2004). Three crop sequence treatments
(flax/dry pea/spring wheat, soybean/flax/spring wheat, and spring wheat/dry pea/
spring wheat) had less disease than the continuous wheat treatment for three ofthe four times differences were detected. Although these three treatments and the
crambe/barley/spring wheat treatment were distinguished from the continuous wheat
treatment based on disease severity and yielded 10–29% higher than the continuous
wheat treatment, they were not statistically different from the continuous wheat
treatment based on seed yield (Fig. 3).
When spring wheat was evaluated for leaf spot disease severity in 2001 (site 2),
there were differences among crop sequence treatments in four of eight evaluations.
Similar to 2000, the �two year without spring wheat� crop sequences, as a group,
248 J.M. Krupinsky et al. / Agricultural Systems 88 (2006) 227–254
could not be distinguished from the �one year without spring wheat� crop se-
quences. There were crop sequence treatments that had less disease severity than
the continuous wheat treatment. Those crop sequence treatments with less disease
for at least three of the four times differences were detected were flax/flax/spring
wheat and safflower/safflower/spring wheat. The crop sequences that were differentfrom the continuous wheat treatment two or more times were flax/canola/spring
wheat, pea/crambe/spring wheat, soybean/flax/spring wheat, spring wheat/dry
bean/spring wheat, and soybean/soybean/spring wheat. Although these treatments
were distinguished from the continuous wheat treatment based on disease severity
and yielded 11–31% higher than the continuous wheat treatment, with one excep-
tion, they were statistically similar to the continuous wheat treatment based on
seed yield (Fig. 4). This is similar to what occurred in 2000. Thus, even though
there was a decrease in leaf spot disease severity with some crop sequence treat-ments and modest yield increases, significant yield increases because of deceases
in leaf spot disease severity were not detected under our environmental conditions.
It is possible that the movement of fungal spores among plots (interplot interfer-
ence) diluted the impact of individual crop sequence treatments, particularly later
in the season.
3.7. Fungal spores, spring wheat following crop matrix
Fungal spores were detected within the spring wheat crop following all crop se-
quence treatments evaluated during the 2001 season. The average number of D. tri-
tici-repentis conidia per sampler for each sampling day over the total collection
period was 0.22, 0.20 and 0.13 conidia per cubic meter of air sampled per day from
the flax/safflower/spring wheat, flax/dry bean/spring wheat, dry pea/crambe/spring
wheat treatments, respectively, compared to 0.47 conidia per cubic meter of air
sampled per day for the continuous wheat treatment. Thus, D. tritici-repentis con-
idia were obtained from all treatments and at least twice as many conidia were ob-tained from the continuous wheat treatment compared to the other treatments.
Even though spore production was statistically similar among treatments during
most weeks, significantly more conidia were collected within the continuous wheat
treatment during the fifth week compared to the other three treatments. When the
number of conidia collected during the fifth, sixth, and seventh weeks were com-
bined, the average number of conidia from the flax/safflower/spring wheat, flax/
dry bean/spring wheat, dry pea/crambe/spring wheat treatments was 0.19, 0.10
and 0.06 conidia per cubic meter of air sampled per day respectively, comparedto 0.80 conidia per cubic meter of air sampled per day for the continuous wheat
treatment. During these three weeks at least four times as many conidia were ob-
tained from the continuous wheat treatment compared to the other treatments.
In the sixth week, the amount of disease severity on spring wheat plants following
the continuous wheat treatment was significantly higher compared to the other
treatments (data not shown). Thus, the higher level of spore production associated
with the continuous wheat treatment apparently increased the potential for higher
disease severity.
J.M. Krupinsky et al. / Agricultural Systems 88 (2006) 227–254 249
There was an association between the quantity of conidia obtained and the resi-
due on the soil surface, particularly obvious wheat residue. The amount of total res-
idue on the soil surface for each of the treatments was 74% (74 residue contacts of a
100 possible), 72%, 60%, and 94% for the flax/dry bean/spring wheat, flax/safflower/
spring wheat, dry pea/crambe/spring wheat, and spring wheat/spring wheat/springwheat treatments, respectively. Greater differences were more apparent in the
amount of obvious wheat residue present in the plots with 0%, 1%, 1%, and 53%
(53 of a 100 possible residue contacts was obvious wheat residue) for the flax/dry
bean/spring wheat, flax/safflower/spring wheat, dry pea/crambe/spring wheat, and
spring wheat/spring wheat/spring wheat treatments, respectively. Thus, the higher le-
vel of wheat residue (on which conidia [inoculum] are produced) was associated with
the continuous wheat treatment increasing the potential for leaf spot diseases on
spring wheat in those plots. This indicates the importance of crop sequence, as amanagement tool, in decreasing the amount of inoculum available to initiate leaf
spot diseases. Although pathogens may not be completely eliminated by crop se-
quence, rotating among crop types reduces the amount of inoculum pressure on
the crop being grown (Krupinsky et al., 2002).
3.8. Sclerotinia disease, crop matrix; sunflower following crop matrix
The incidence of Sclerotinia head blight on safflower was low, ranging from 0% to3% in 1999 and from 0% to 2% in 2000, with the highest level on safflower grown on
crambe residue for both years. For canola, the incidence of Sclerotinia stem rot ran-
ged from 0% to 6% in 1999 and from 1% to 5% in 2000, with the highest level occur-
ring on safflower residue both years. For crambe, the incidence of Sclerotinia stem
rot ranged from 2% to 15% in 1999 and from 10% to 60% in 2000, with the highest
level occurring on safflower residue both years. Thus, the higher levels of Sclerotinia
on canola and crambe were observed when those crops followed a safflower crop for
both years even though the incidence of Sclerotinia head blight on the previous saf-flower crop was rather low. Sunflower was rated for Sclerotinia basal stem rot but
the data are not included because no diseased plants were identified in 1999 and
few infected plants (0.01%) were present in 2000. Given the variation in Sclerotinia
disease incidence among plots, it was difficult to demonstrate significant differences
among previous residue treatments at a probability level of p 6 0.05. Even though
there were some patterns in the incidence of Sclerotinia disease, one can speculate
that the movement of ascospores among plots or from other areas made it difficult
to detect significant differences among the individual crop residue treatments.Accordingly, crop rotation may be only partially effective because of the movement
of wind-borne ascospores (Krupinsky et al., 2002).
The impact of crop rotation on Sclerotinia disease was more evident with the uni-
form sunflower crop at site 2 [crop matrix (2000)/spring wheat (2001)/sunflower
(2002)]. The number of sunflower plants infected with Sclerotinia basal stalk rot
was related to crops grown two years previous. The highest incidence of Sclerotinia
basal stalk rot (24%) was associated with former crambe plots that had a high inci-
dence of Sclerotinia disease in 2000. The sunflower seed yield (1506 kg ha�1) was
250 J.M. Krupinsky et al. / Agricultural Systems 88 (2006) 227–254
31% lower in the previous crambe plots compared to the average yield obtained from
the previous barley (2122 kg ha�1), canola (2170 kg ha�1), dry pea (2128 kg ha�1),
and sunflower (2286 kg ha�1) plots, indicating crops grown two years previous to
a sunflower crop can influence yield. The former dry pea plots (13% Sclerotinia basal
stalk rot) and canola plots (6% Sclerotinia basal stalk rot) ranked second, with theremaining plots ranging from 0.5% to 3% grouped together. Although the dry pea
and canola plots were not significantly different from one another, the canola plots
could not be distinguished from the remaining plots. Considering Sclerotinia disease
was not evident in the dry pea crop or in the grain harvested in 2000, further inves-
tigation is warranted to explain why intermediate levels of Sclerotinia disease were
detected following dry pea.
4. Synthesis and conclusions
4.1. Crop production, crop matrix, 10 crops
When the three legume crops were compared to the seven non-leguminous
crops, on a per-crop basis, the legumes exhibited more positive crop-sequence ef-
fects on seed yield compared to the non-leguminous crops which usually exhibited
negative effects. When the crop sequential effects of the various residue crops wereassessed (Table 5, rightmost column), all three legume crops had positive net rel-
ative values. Overall, a relative value of +22 per crop was associated with the le-
gumes compared to �12 per crop for non-legumes (derived from Table 5).
However, sunflower was an exception among the non-leguminous crops. Sun-
flower as residue crop had a positive effect on subsequent crops in 2000 with
average precipitation but not in 1999, an above average precipitation year (Tables
3 and 4).
The most negative crop sequence effects on seed yield were observed when acrop was seeded on its own crop residue (Tables 3 and 4). The overall relative val-
ues for this crop sequence effect were �26 in 1999 and �59 in 2000 (Table 5). With
five negative relative values out of a possible 10 in 2000 (Table 4), the negative im-
pact of a crop being seeded on its own crop residue was more than doubled in
2000, an average precipitation year, compared to 1999, an above average precipi-
tation year. In 1999, safflower as a residue crop had a negative impact on the seed
yield of five out of 10 crops (Table 3) and a relative value of �46 for overall se-
quence effect (Table 5). Safflower, a xeric species, may promote allelopathic orother effects in a wet year, such as 1999. Canola and crambe had negative effects
on subsequent crops in 2000, with relative values of �52 and �26, respectively, for
the overall sequence effect in 2000 (Table 5). Considering that mycorrhizae can be
beneficial to their host plants (Paul and Clark, 1996) and canola and crambe be-
long to the Cruciferae family, which includes typically non-mycorrhizal crops (Har-
ley and Harley, 1987), growing non-mycorrhizal plants may negatively impact
mycorrhizal fungi in the soil, and consequently affect subsequent mycorrhizal crops
that follow.
J.M. Krupinsky et al. / Agricultural Systems 88 (2006) 227–254 251
4.2. Crop production, spring wheat following crop matrix
Spring wheat yields following diverse crop sequences were generally higher than
the continuous wheat treatment. In 2000, spring wheat yields were enhanced follow-
ing six and seven crop sequence treatments when sunflower and safflower, respec-tively, were the second year crop residue (Fig. 3). In 2001, spring wheat yields
were enhanced following 10 crop sequence treatments when either sunflower or flax
were the first year crop residue (Fig. 4). Safflower and sunflower were previously re-
ported to be high water users compared to the other crops (Merrill et al., 2004). With
the above average precipitation in 1999, the pattern of results suggests high water-
using crops, by reducing soil wetness, may have modified soil moisture conditions
for spring wheat and lessened the potential of soilborne diseases. Leaf spot disease
observations (Fig. 7) indicate the inclusion of diverse crops in crop sequences maylessen disease severity compared to continuous wheat early in the season, contribut-
ing to a general increase in spring wheat yields.
4.3. Some overall considerations
In general, our results showed that the pulse legume crops dry pea, dry bean, and
soybean, as a group, provided positive crop sequential enhancements to the yields of
other crops compared to the non-leguminous crops. With the notable exception ofsunflower, non-leguminous crops were more associated with negative crop sequential
effects. Because the soil that the study was conducted on had inherently high soil fer-
tility and had been under soil health-enhancing no-till management with adequate
N-fertilization, it is difficult, or possibly impossible, to ascribe positive legume effects
specifically to a ‘‘nitrogen-credit’’, N-fixation effect. This important overall result
points to the need to apply the research tools of soil microbiological analysis linked
to soil-based plant pathological analyses in order to reach better understanding of
such crop sequential effects.The future costs of nitrogen fertilization and the local-to-global environmental
burdens of off-field nitrogen flux (Follett and Hatfield, 2001) are expected to increase
the value of including legumes in crop rotations. As this and other studies have
shown, legume crops are inferior to non-leguminous crops in terms of maintaining
soil coverage by crop residue, which is one of the most important factors for main-
taining soil health. Thus, expected increased use of legumes will require a proper bal-
ancing of these crops with higher residue-providing crops such as small cereal grains.
This will in turn place emphasis on research for maintenance and enhancement ofno-till soil and crop management systems.
Acknowledgement
We thank J. Hartel, D. Schlenker, D. Wetch, M. Hatzenbuhler, M. Lares, C.
Flakker, and C. Klein for their technical assistance; M. West and G. Richardson
for statistical advice; and anonymous reviewers for their reviews and constructive
252 J.M. Krupinsky et al. / Agricultural Systems 88 (2006) 227–254
comments; and the Area IV Soil Conservation Districts, National Sunflower Asso-
ciation, North Dakota Oilseed Council, Northern Canola Growers Association,
and the USDA-ARS National Sclerotinia Initiative for their supplemental support.
USDA-ARS, Northern Plains Area, is an equal opportunity/affirmative action
employer and all agency services are available without discrimination. Mention ofa trademark, proprietary product, or company by USDA personnel is intended
for explicit description only and does not imply its approval to the exclusion of other
products that may also be suitable.
References
Anderson, R.L., Tanaka, D.L., Merrill, S.D., 2003. Yield and water use of broadleaf crops in a semiarid
climate. J. Agric. Water Manage. 58, 255–266.
Bailey, K.L., Gossen, B.D., Gugel, R.K., Morrall, R.A.A. (Eds.), 2003. Diseases of Field Crops in
Canada, third ed. Canadian Phytopathological Society, University Extension Press, University of
Saskatchewan, Saskatoon, SK.
Behnke, R., Scoones, I., Kerven, D., 1993. Range Ecology at Disequilibrium. ODI, London.
Bilbro, J.D., Fryrear, D.W., 1994. Wind erosion losses as related to plant silhouette and soil cover. Agron.
J. 86, 550–553.
Bhathal, J.S., Loughman, R., Speijers, J., 2003. Yield reduction to leaf disease from yellow (tan) spot and
septoria nodorum blotch. Eur. J. Plant Pathol. 109, 435–443.
Blake, G.R., Hartge, K.H., 1986. Bulk density. In: Klute, A. (Ed.), Methods of Soil Analysis. Part 1 –
Physical and Mineralogical Methods, second ed., SSSA Book Series, vol. 5 SSSA and ASA, Madison,
WI, pp. 363–382.
Brummer, E.C., 1998. Diversity, stability, and sustainable American agriculture. Agron. J. 90, 1–2.
Bundy, L.G., Meisinger, J.J., 1994. Nitrogen availability indices. In: Weaver, R.W., Angle, S., Bottomley,
P., Bezdicek, D., Smith, S., Tabatabai, A., Wollum, A. (Eds.), Methods of Soil Analysis. Part 2 –
Microbiological and Biochemical Methods, SSSA Book Series, vol. 5. SSSA and ASA, Madison, WI,
pp. 951–984.
Cambardella, C.A., Gajda, A.M., Doran, J.W., Wienhold, B.J., Kettler, T.A., 2000. Estimation of
particulate and total organic matter by weight loss-on-ignition. In: Lal, R., Kimble, J.M., Follett, R.F.,
Stewart, B.A. (Eds.), Assessment Methods for Soil Carbon. Lewis Publishers, Boca Raton, FL, pp.
349–359.
Campbell, C.A., McConkey, B.G., Zenter, R.P., Selles, F., Curtin, D., 1996. Long-term effects of tillage
and crop rotations on soil organic C and total N in a clay soil in southwestern Saskatchewan. Can. J.
Soil Sci. 76, 395–401.
Cook, R.J., Veseth, R.J., 1991. Wheat Health Management. American Phytopathological Society Press,
St. Paul, MN.
Dhuyvetter, K.C., Thompson, C.R., Norwood, C.A., Halvorson, A.D., 1996. Economics of dryland
cropping systems in the Great Plains: a review. J. Prod. Agric. 9, 216–222.
Follett, R.F., Hatfield, J.L., 2001. Nitrogen in the Environment: Sources, Problems, and Management.
Elsevier, New York, NY.
Franzluebbers, A.J., Haney, R.L., Hons, F.M., Zuberer, D.A., 1999. Assessing biological soil quality with
chloroform fumigation–incubation: Why subtract a control? Can. J. Soil Sci. 79, 521–528.
Fryrear, D.W., Saleh, A., Bilbro, J.D., Schomberg, H.M., Stout, J.E., Zobeck, T.M., 1998. Revised wind
erosion equation (RWEQ). Technical Bull. No. 1. USDA-ARS, Lubbock, TX.
Gan, Y.T., Miller, P.R., McConkey, B.G., Zentner, R.P., Stevenson, F.C., McDonald, C.L., 2003.
Influences of diverse cropping sequences on durum wheat yield and protein in the semiarid northern
Great Plains. Agron. J. 95, 245–252.
Gulya, T., Nelson, B., Lamey, H., 1994. Diseases. In: Berglund, D.R. (Ed.), Sunflower Production,
Extension Bulletin 25 (revised). North Dakota State University, Fargo, pp. 44–62.
J.M. Krupinsky et al. / Agricultural Systems 88 (2006) 227–254 253
Hanson, J.D., Hendrickson, J.R., Krupinsky, J.M., Tanaka, D.L., Liebig, M.A., Merrill, S.D., Johnson,
H.A., 2003. Introduction to dynamic cropping systems as part of integrated agricultural systems. In:
Hanson, J.D., Krupinsky, J.M., (Eds.) Proceedings of the Dynamic Cropping Systems: Principles,
Processes, and Challenges. 5–7 August 2003, Bismarck, ND, pp. 1–8.
Harley, J.L., Harley, E.L., 1987. A check-list of mycorrhiza in British flora – addenda, errata and index.
New Phytol. 107, 741–749.
Islam, K.R., Weil, R.R., 1998. Microwave irradiation of soil for routine measurement of microbial
biomass carbon. Biol. Fertil. Soils. 27, 408–416.
Krupinsky, J.M., 1992. Collection of conidia and ascospores of Pyrenophora tritici-repentis from wheat
straw. In: Francl, L.J, Krupinsky, J.M., and McMullen, M.P. (Eds.), Advances in Tan Spot Research.
Proceedings of the Second International Tan Spot Workshop. 1992. North Dakota State Univ., Fargo.
pp. 91-95.
Krupinsky, J.M., Bailey, K.L., McMullen, M.P., Gossen, B.D., Turkington, T.K., 2002. Managing plant
disease risk in diversified cropping systems. Agron. J. 94, 198–209.
Krupinsky, J.M., Tanaka, D.L., Lares, M.T., Merrill, S.D., 2004. Leaf spot diseases of barley and spring
wheat as influenced by preceding crops. Agron. J. 96, 259–266.
Lamey, H.A., 1995. Survey of blackleg and Sclerotinia stem rot of canola in North Dakota in 1991 and
1993. Plant Dis. 79, 322–324.
Leighty, C.E., 1938. Crop rotation. In: USDA Yearbook of Agriculture. Soils and Men. US Government
Printing Office, Washington, DC, pp. 406–430.
Littell, R.C., Milliken, G.A., Stroup, W.W., Wolfinger, R.D., 1996. SAS System for Mixed Models. SAS
Inst., Inc., Cary, NC.
Lyon, D.J., Monz, C.A., Brown, R.E., Metherell, A.K., 1997. Soil organic matter changes over two
decades of winter wheat-fallow cropping in western Nebraska. In: Paul, E.A., Paustian, K., Elliott,
E.T., Cole, C.V. (Eds.), Soil Organic Matter in Temperate Agroecosystems: Long-term Experiments in
North America. CRC Press, Boca Raton, FL, pp. 343–353.
Merrill, S.D., Black, A.L., Fryrear, D.L., Saleh, A., Zobeck, T.M., Halvorson, A.D., Tanaka, D.L., 1999.
Soil wind erosion hazard of spring wheat-fallow as affected by long-term climate and tillage. Soil Sci.
Soc. Am. J. 63, 1768–1777.
Merrill, S.D., Tanaka, D.L., Hanson, J.D., 2002a. Root length growth of eight crop species in Haplustoll
soils. Soil Sci. Soc. Am. J. 66, 913–923.
Merrill, S.D., Tanaka, D.L., Krupinsky, J.M., Liebig, M.A., Hendrickson, J.R., Hanson, J.D., Ries, R.E.,
2002b. Soil water use and soil residue coverage by sunflower compared to other crops. In: Proceedings
of the 24th Sunflower Research Workshop. January 17–18. National Sunflower Association, Bismarck,
ND, pp. 88–96.
Merrill, S.D., Tanaka, D.L., Krupinsky, J.M., Ries, R.E., 2004. Water use and depletion by diverse crop
species on Haplustoll soil in the Northern Great Plains. J. Soil Water Conserv. 59, 176–183.
Miller, P.R., McDonald, C.L., Derksen, D.A., Waddington, J., 2001. The adaptation of seven broadleaf
crops to the dry semiarid prairie. Can. J. Plant. Sci. 81, 29–43.
Miller, P.R., McConkey, B.G., Clayton, G.W., Brandt, S.A., Staricka, J.A., Johnston, A.M., Lanfond, G.,
Schatz, B.G., Baltensperger, D.D., Neill, K., 2002a. Pulse crop adaptation in the northern Great
Plains. Agron. J. 94, 261–272.
Miller, P.R., Waddington, J., McDonald, C.L., Derksen, D.A., 2002b. Cropping sequence affects wheat
productivity on the semi-arid northern Great Plains. Can. J. Plant Sci. 82, 307–318.
Mulvaney, R.L., 1996. Nitrogen – inorganic forms. In: Sparks, D.L. (Ed.), Methods of Soil Analysis. Part
3. Chemical Methods, SSSA Book Series, vol. 5. SSSA and ASA, Madison, WI, pp. 1123–1184.
Nielsen, D.C., Anderson, R.L., Bowman, R.A., Aiken, R.M., Vigil, M.F., Benjamin, J.G., 1999.
Winter wheat and proso millet yield reduction due to sunflower in the rotation. J. Prod. Agric. 12,
193–197.
Norwood, C.A., 2000. Dryland winter wheat as affected by previous crops. Agron. J. 92, 121–127.
Nyvall, R.F., 1999. Field Crop Diseases Handbook, third ed. Iowa State University Press, Ames.
Paul, E.A., Clark, F.E., 1996. Soil Microbiology and Biochemistry, second ed. Academic Press, San
Diego, CA.
254 J.M. Krupinsky et al. / Agricultural Systems 88 (2006) 227–254
Paul, E.A., Harris, D., Klug, M.J., Ruess, R.W., 1999. The determination of microbial biomass. In:
Robertson, G.P., Coleman, D.C., Bledsoe, C.S., Sollins, Sollins, P. (Eds.), Standard Soil Methods for
Long-term Ecological Research. Oxford Univ. Press, New York, pp. 291–317.
Padbury, G., Waltman, S., Caprio, J., Coen, G., McGinn, S., Mortensen, D., Nielsen, G., Sinclair, R.,
2002. Agroecosystems and land resources of the northern Great Plains. Agron. J. 94, 251–261.
Peterson, G.A., 1996. Cropping systems in the Great Plains. J. Prod. Agric. 9, 179.
Peterson, G.A., Schlegel, A.J., Tanaka, D.L., Jones, O.R., 1996. Precipitation use efficiency as affected by
cropping and tillage systems. J. Prod. Agric. 9, 180–186.
Pierce, F.J., Rice, C.W., 1988. Crop rotation and its impact on efficiency of water and nitrogen use. In:
Hargrove, W.L. (Ed.) Cropping strategies for efficient use of water and nitrogen. ASA Special
Publications 51. ASA, CSSA, and SSSA, Madison, WI, pp. 21–42.
Renard, K.G., Foster, G.A., Weesies, D.K., McCool, D.K., Yoder, D.C., 1997. Predicting soil erosion by
water: a guide to conservation planning with the revised universal soil loss equation (RUSLE). USDA,
Agriculture Handbook No. 703.
Sandford, S., 1982. Management of Pastoral Development in the Third World. Wiley and Sons, Inc., New
York.
Shen, S.M., Pruden, G., Jenkinson, D.S., 1984. Mineralization and immobilization of nitrogen in
fumigated soil and the measurement of microbial biomass nitrogen. Soil Biol. Biochem. 16, 437–444.
Statistics Canada. 2003. Census of Canada. Statistics Canada Advisory Services. Available from <http://
www.statcan.ca/> (verified 01/16/04).
Stevenson, F.C., van Kessel, C., 1996. The nitrogen and non-nitrogen rotation benefits of pea to
succeeding crops. Can. J. Plant Sci. 76, 735–745.
Tanaka, D.L., Hofman, V., 1994. Residue reduction. In: Moldenhauer, W.C., Black, A.L. (Eds.), Crop
Residue Management to Reduce Erosion and Improve Soil Quality (Northern Great Plains). USDA-
ARS, Conservation Research No. 38. Government Printing Office, Washington, DC, pp. 36–41.
Tanaka, D.L., Krupinsky, J.M., Liebig, M.A., Merrill, S.D., Ries, R.E., Hendrickson, J.R., Johnson,
H.A., Hanson, J.D., 2002. Dynamic cropping systems: An adaptable approach to crop production in
the Great Plains. Agron. J. 94, 957–961.
US Census Bureau. 2002. Statistical abstract of the United States – 2002. US Government Printing Office.
Washington, DC. Available from <http://www.census.gov/statab/www/> (verified 01/16/04).
Watson, M.E., Brown, J.R., 1998. pH and lime requirement. In: Brown JR (Ed.) Recommended chemical
soil test procedures for the North Central Region. North Central Regional Publications 221 (revised).
Missouri Agricultural and Expemental Sation Bulletin SB1001, pp. 13–16.
Westfall, D.G., Havlin, J.L., Hergert, G.W., Raun, W.R., 1996. Nitrogen management in dryland
cropping systems. J. Prod. Agric. 9, 192–199.
Wright, A.T., 1990. Yield effects of pulses on subsequent cereal crops in the northern prairies. Can. J.
Plant Sci. 70, 1023–1032.
Zentner, R.P., Campbell, C.A., Biederbeck, V.O., Miller, P.R., Selles, F., Fernandez, M.R., 2001. In
search of a sustainable cropping system for the semiarid Canadian prairies. J. Sust. Agric. 18, 117–136.


![State: Jharkhandjsac.jharkhand.gov.in/pdf/crop/JKD1-Garhwa-10.08.12[1].pdf · Cauliflower 0.520 0.520 Medicinal and Aromatic crops - Plantation crops - Fodder crops - Total fodder](https://img.pdfslide.net/doc/110x75/5e984abdba1859541f1aa068/state-1pdf-cauliflower-0520-0520-medicinal-and-aromatic-crops-plantation.jpg)