Embed Size (px)
Citation preview
UGC Jr.No. 45308 | IFS – 2018: 1.14 | SJIF 2016:3.343 | SJIF 2017: 4.253 | ISI 2017-2018: 0.673
Emperor International Journal of Finance and Management Research [EIJFMR] Page 158
Paper ID: 13180225 ISSN: 2395-5929
CROPPING PATTERN AMONG THE
TRIBAL HOUSEHOLDS – A STUDY IN
TELANGANA
Dr.K.MOHAN REDDY
Associate Professor
Department of Economics
Kakatiya University
Warangal (TS).
Dr.V.NAVEEN Part-time Faculty Member
Department of Economics
University P.G. College
Kakatiya University Warangal (TS).
ABSTRACT
The present paper deals with the cropping pattern
among the tribal households with special reference to
Khammam and Adilabad districts of Telangana. The
paper is mainly based on the data gathered from the
primary sources. By and large, from the analysis, it
can be said that the causes and resultant
consequences of the changes in cropping were so
complex and inter-related to each other and therefore,
it is not that much easy to isolate the individual
factors. The cropping pattern among the tribal
farmers was predominantly oriented towards food
crops only and there is no change overtime in their
cropping pattern. Finally, the study also lends support
of the earlier writings that the cropping pattern in
most of the tribal villages oriented towards growing
the food crops primarily cereals of the type.
Therefore, the researchers of the present study were
of the view that the tribal farmers have to be open
minded and willing to experiment with new
technologies and have to develop an alternative
model with harmonious admixture of traditional and
modern scientific knowledge.
Keywords: Cropping pattern, Tribal farming,
Food crops
I. INTRODUCTION
The present paper deals with the cropping pattern
among the tribal households with special reference to
Khammam and Adilabad districts of Telangana. The
present paper is divided into three sections. Section-I
deals with the nature of tribal agriculture and the
cropping pattern in tribal areas. Section-II deals with
the review and methodology of the present paper.
Field findings and summary of the study had been
presented in Section-III.
Cropping pattern can be defined as the
proportion of area under different crops at a
particular period of time. A change in cropping
pattern means a change in the proportion of area
under different crops. Cropping pattern in India is
determined mainly by natural factors like rainfall,
climate and soil conditions. Economic factors1,
historical factors2, social factors3, and policies of
the government4 affect the cropping pattern in a
significant way. Besides, technological factors5 also
play an important role. Cropping patterns can be of
various kinds. The important cropping patterns are:
Sole cropping6, Double cropping7, Rotational
cropping8, Mixed cropping9 and Intensive
cropping10. It can be of two types, Multiple
cropping11 and Inter-cropping12.
UGC Jr.No. 45308 | IFS – 2018: 1.14 | SJIF 2016:3.343 | SJIF 2017: 4.253 | ISI 2017-2018: 0.673
Emperor International Journal of Finance and Management Research [EIJFMR] Page 159
Paper ID: 13180225 ISSN: 2395-5929
Cropping pattern in Indian agriculture is broadly
classified into two parts viz; food grain and non-food
grain crops. In the recent years, the importance of
food grains processing industries is being
increasingly recognized for generation of income and
employment. Agriculture sector has been the source
of supply of raw materials to industries. In India, the
demand for food grain and non-food grain
commodities is increasing due to increase in
population. Therefore, it can be said that the increase
of agricultural production is essential for meeting the
increased demand. This sort of tendency is not an
exception to the agriculture even in the case of tribal
areas.
Majority of the tribes are engaged in agricultural
and livestock rearing activities and other economic
pursuits of the tribes are food gathering, hunting,
fishing, handicrafts, trade and industrial labour etc.
Among various activities agriculture, livestock
rearing and non-farm activities are the major sources
of income and the percentage of their contribution to
the tribal livelihood is not so open. Data pertaining to
the contribution of various economic activities
among the tribal farmers is mandatory for any
economic development programmes for the tribal
farmers. Though various studies on socio-economic
conditions of farmers were carried out in India,
studies are limited with reference to the tribal
farmers.
The tribal agriculture is mostly on primitive
lines, as evidenced by shifting cultivation, use of
indigenous technologies, small size of land holdings
and lack of diversification of occupations. Tribal
agriculture is largely rain-fed with meager irrigation
sources. The major resultant of tribal agriculture is
low productivity. Besides these, the occurrence of
drought further affects the crop production and
productivity.
In India, different tribal groups are living in
various degrees of economic backwardness. They
live generally in inhospitable terrain where
productivity of the soil is low and their hamlets are
found in the interior forest areas along with the hill
streams. There are no communication facilities
between the various isolated tribal groups as well as
between the tribal and the world at large. Their lands
are dry, alienated and there are no irrigation facilities.
In their lands, they do not utilize chemical fertilizers,
improved seeds and pesticides. Therefore, the
agriculture in tribal areas is somewhat different from
other areas mainly on account of the difference in
natural topography and also the typical topography of
undulating and hilly areas has made tribal area
agriculture less profitable. (Mohammad Awais, 2012)
This economic backwardness is also reflected
through the crops being grown on the tribal farms.
Almost all the tribal farmers still grow indigenous
crops giving low yields and eventually low marketed
surplus and get low farm incomes resulting into low
marginal propensity to save. These farmers also
operate at a low capital base of the liberal credit
facilities available after nationalization of the major
commercial banks.
The reason for the economic backwardness of
the tribal people may not be only economic that lack
of input facilities and less or not capital availability to
invest. These reasons may also be of social nature
relating to the attitude and values of the tribal people
to the whole business of the farming and the use of
modern agricultural inputs like HYV seeds,
fertilizers, farm machinery and credit obtained from
outside the farm. Keeping in view of these issues, the
present study has made a maiden attempt to examine
UGC Jr.No. 45308 | IFS – 2018: 1.14 | SJIF 2016:3.343 | SJIF 2017: 4.253 | ISI 2017-2018: 0.673
Emperor International Journal of Finance and Management Research [EIJFMR] Page 160
Paper ID: 13180225 ISSN: 2395-5929
the cropping pattern among the tribal households of
Khammam and Adilabad districts of Telangana State.
Indian tribes have been studied by the scholars of
different disciplines from different points of view on
various facets of the Indian tribes. Some of the
studies had been mentioned hereunder.
The study of Sahu (1970) reported that tribal
agriculture was rightly classified as subsistence
sector of the tribal economy and according to the
study primitive method of farming, low cropping
intensity, high labour intensive farming and static
cropping pattern were the key characteristics of tribal
agriculture in India.
Rao, P.P. and Rao, V.G.K (1996) conducted a
study to find out the extent of adoption of rice
production technology by the tribal farmers in high
attitude and tribal zone of Andhra Pradesh during
1992-93. The study revealed that a majority of the
respondents had adopted the rice production
technology to the medium extent. It analyzed that the
extent of adoption was found to be positively and
significantly associated with age, farming experience,
training received, and socio-economic status,
cropping intensity, aspiration, economic motivation,
innovativeness, information source utilization and its
credibility.
The study of Jairath, M.S. (1994) investigated
the effect of the wholesale market on agricultural and
economic development in tribal areas of Madhya
Pradesh, identified constraints and problems faced in
agricultural marketing. The development of the
market has led to the growth of market oriented crop
production in the tribal areas. The cropping pattern
has shifted from cereals and pulses to oilseeds and
other crops. Tribal farmers face many problems at the
rural assembly centers, which lack even basic
facilities.
Rao, Y.U.K. and Bathaian, D. (1993) in their
study, they were of the view that many tribal farmers
in India are now adopting permanent agriculture. The
study was calculated from 103 cultivators in
Huckmpet mandal, Vishakhapatnam district in
Andhra Pradesh for 1987-88. Average irrigated area
in tribal areas was 72 per cent and increased with
farm size. Small farms had a higher percentage of
average cultivated area to the total area, higher
cropping intensity, and a higher percentage of
expenditure on social ceremonies than large farms.
Sinha, A.K. et. al. (2004) in their study, they
analyzed the existing cropping pattern and the
possibilities for enhancing the productive potential of
tribal farms in Ranchi district, Jharkhand State. The
study has taken up during 2000-01, collected from a
sample of 120 tribal farmers, were used in the
analysis. Linear programming was used to develop
optimum plans for each size group of selected farms.
The study found that 20 per cent of the existing area
under rice cultivation (71.25 per cent of the total
cropped area) needs to be allocated to vegetables and
pulses in order to obtain maximum profit. Through
the re-allocation of resources, cropping intensity on
the sample farms can be increased by up to 184 per
cent. Through the optimization of resources use,
under the condition of improved technology and
unrestricted capital, net farm income can be increased
by up to 275 per cent.
Besides the aforesaid studies, the studies
(Dobariya, et.al, (2016), Jalaja, and Kala (2015),
Trivedi and Patel (1992), Venkateshwara Swamy,
et.al.(2016), Pavankalyan and Vasudev (2017) that
have been carried were of the view that the cropping
pattern in almost all the tribal villages was oriented
towards foodgrains which is in sharp contrast to the
plain areas. Keeping all these facets in view, the

UGC Jr.No. 45308 | IFS – 2018: 1.14 | SJIF 2016:3.343 | SJIF 2017: 4.253 | ISI 2017-2018: 0.673
Emperor International Journal of Finance and Management Research [EIJFMR] Page 161
Paper ID: 13180225 ISSN: 2395-5929
present study had been undertaken to analyse the
under mentioned objectives.
Objective
1) To examine the nature of cropping pattern
among the tribal households;
2) To analyse the relative share of different
crops in the cropping pattern followed by
the sample farmers; and
3) To analyse the relative share of area under
different sources of irrigation.
To ascertain the aforesaid objectives, the
researchers had adopted the following methodology.
The research design adopted for the study is to
examine the cropping pattern among the tribal
households in the erstwhile districts of Khammam
and Adilabad in Telangana State. These two districts
in the State of Telangana represent the highest
concentration of tribal population. Further, it is to be
noted that, from each district, three mandals had been
chosen. From each mandal, one village had been
selected at random and from each village, 30 sample
households have been chosen at random. Altogether,
six mandals, six villages and 180 sample households
had been selected for the present study. The data had
been collected from the chosen tribal households by
administering the pre-tested, structured interview
schedule by the method of personal interview. The
sample households were personally contacted and
rapport was established to get unbiased information.
The researchers had been collected the data during
the year 2013-14 and the data pertaining to the
reference period of 2012-13. Table-1 shows about the
size of sample households.
Table-1: A Panoramic view of the Sample Size
Name of the District Name of the Mandal
Name of the Village No. of sample
Households in the village
Adilabad
1. Tiryani
2. Utnoor
3. Jannaram
1. Indhanpalle
2. Singaraipet
3. Jannaram
30
30
30
Khammam 1. Chintoor
2. Bhadrachalam
3. Yellandu
1. Chatti
2. Kistaram
3. Yellandu
30
30
30
The present section had been devoted to examine the cropping pattern among the tribal households with empirical
evidence. In this section, as per requirement of the study, the field study was conducted in three villages of three
mandals in Adilabad and Khammam districts of Telangana by covering 30 samples from each village and altogether
the data had been collected from the 180 tribal households with a view to analyse the relative share of different
crops in the cropping pattern followed by the sample farmers.
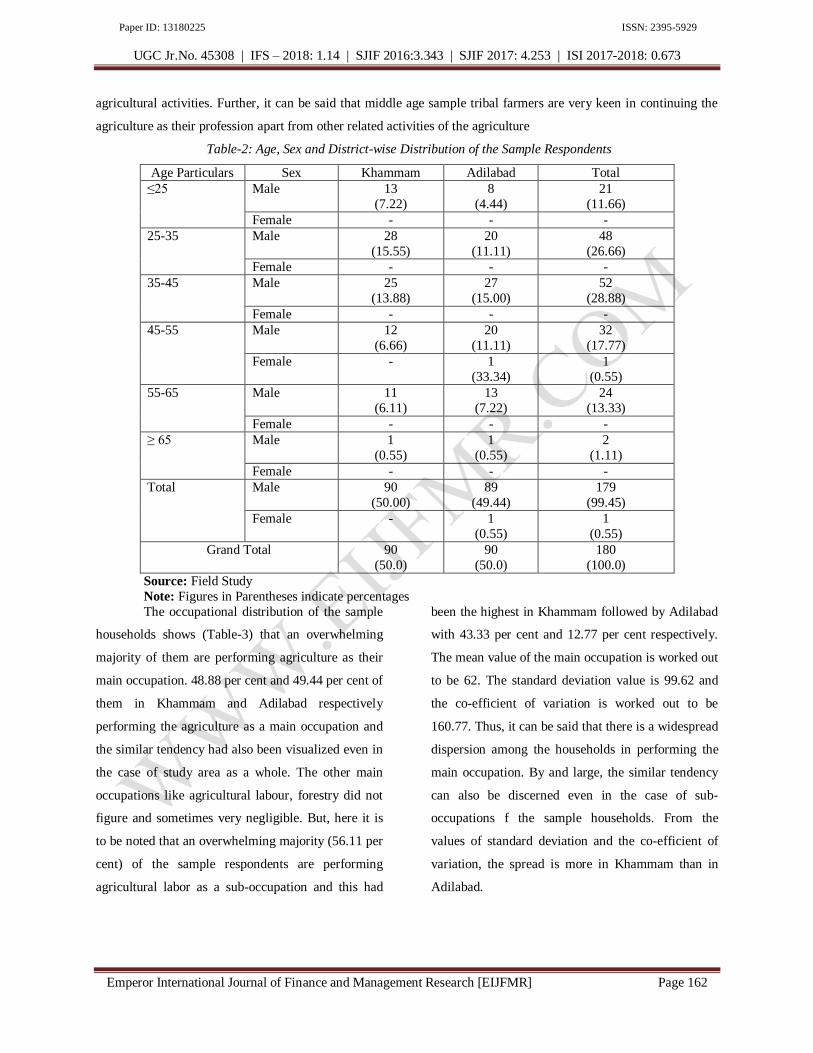
While looking at the data presented in Table-2 reveal the fact that all the sample respondents are male
except one household in Adilabad district. The age-wise distribution of the sample households attest the fact that a
majority of the sample households were in the two age groups i.e. 25-35 years and 35-45 years and these two age
groups together constitute 29.43 per cent and 26.22 per cent of the total in Khammam and Adilabad respectively,
which indicates that these two age groups are actively involving in the agricultural operations. From the analysis, it
can be inferred that the elder farmers and younger farmers are not bestowing their attention towards performing the
UGC Jr.No. 45308 | IFS – 2018: 1.14 | SJIF 2016:3.343 | SJIF 2017: 4.253 | ISI 2017-2018: 0.673
Emperor International Journal of Finance and Management Research [EIJFMR] Page 162
Paper ID: 13180225 ISSN: 2395-5929
agricultural activities. Further, it can be said that middle age sample tribal farmers are very keen in continuing the
agriculture as their profession apart from other related activities of the agriculture
Table-2: Age, Sex and District-wise Distribution of the Sample Respondents
Age Particulars Sex Khammam Adilabad Total
≤25 Male 13
(7.22)
8
(4.44)
21
(11.66)
Female - - -
25-35 Male 28
(15.55)
20
(11.11)
48
(26.66)
Female - - -
35-45 Male 25
(13.88)
27
(15.00)
52
(28.88)
Female - - -
45-55 Male 12
(6.66)
20
(11.11)
32
(17.77)
Female - 1
(33.34)
1
(0.55)
55-65 Male 11
(6.11)
13
(7.22)
24
(13.33)
Female - - -
≥ 65 Male 1
(0.55)
1
(0.55)
2
(1.11)
Female - - -
Total Male 90
(50.00)
89
(49.44)
179
(99.45)
Female - 1
(0.55)
1
(0.55)
Grand Total 90
(50.0)
90
(50.0)
180
(100.0)
Source: Field Study
Note: Figures in Parentheses indicate percentages
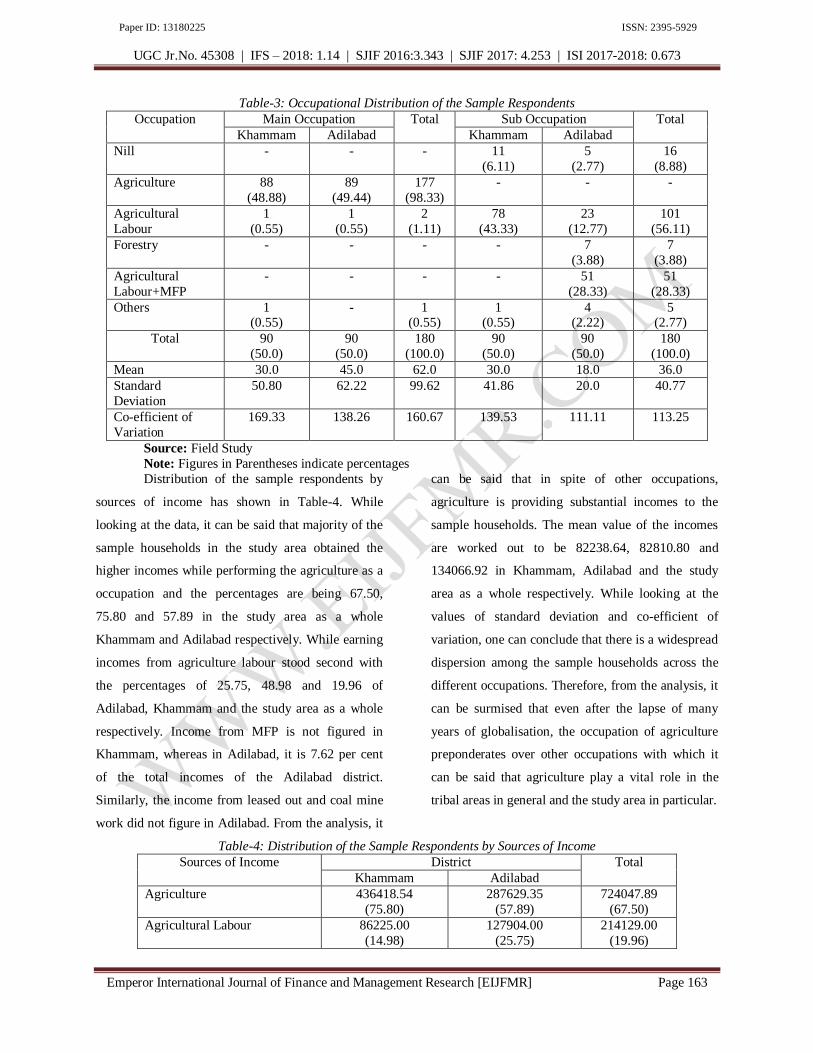
The occupational distribution of the sample
households shows (Table-3) that an overwhelming
majority of them are performing agriculture as their
main occupation. 48.88 per cent and 49.44 per cent of
them in Khammam and Adilabad respectively
performing the agriculture as a main occupation and
the similar tendency had also been visualized even in
the case of study area as a whole. The other main
occupations like agricultural labour, forestry did not
figure and sometimes very negligible. But, here it is
to be noted that an overwhelming majority (56.11 per
cent) of the sample respondents are performing
agricultural labor as a sub-occupation and this had
been the highest in Khammam followed by Adilabad
with 43.33 per cent and 12.77 per cent respectively.
The mean value of the main occupation is worked out
to be 62. The standard deviation value is 99.62 and
the co-efficient of variation is worked out to be
160.77. Thus, it can be said that there is a widespread
dispersion among the households in performing the
main occupation. By and large, the similar tendency
can also be discerned even in the case of sub-
occupations f the sample households. From the
values of standard deviation and the co-efficient of
variation, the spread is more in Khammam than in
Adilabad.
UGC Jr.No. 45308 | IFS – 2018: 1.14 | SJIF 2016:3.343 | SJIF 2017: 4.253 | ISI 2017-2018: 0.673
Emperor International Journal of Finance and Management Research [EIJFMR] Page 163
Paper ID: 13180225 ISSN: 2395-5929
Table-3: Occupational Distribution of the Sample Respondents
Occupation Main Occupation Total Sub Occupation Total
Khammam Adilabad Khammam Adilabad
Nill - - - 11
(6.11)
5
(2.77)
16
(8.88)
Agriculture 88
(48.88)
89
(49.44)
177
(98.33)
- - -
Agricultural
Labour
1
(0.55)
1
(0.55)
2
(1.11)
78
(43.33)
23
(12.77)
101
(56.11)
Forestry - - - - 7
(3.88)
7
(3.88)
Agricultural
Labour+MFP
- - - - 51
(28.33)
51
(28.33)
Others 1 (0.55)
- 1 (0.55)
1 (0.55)
4 (2.22)
5 (2.77)
Total 90
(50.0)
90
(50.0)
180
(100.0)
90
(50.0)
90
(50.0)
180
(100.0)
Mean 30.0 45.0 62.0 30.0 18.0 36.0
Standard
Deviation
50.80 62.22 99.62 41.86 20.0 40.77
Co-efficient of
Variation
169.33 138.26 160.67 139.53 111.11 113.25
Source: Field Study
Note: Figures in Parentheses indicate percentages
Distribution of the sample respondents by
sources of income has shown in Table-4. While
looking at the data, it can be said that majority of the
sample households in the study area obtained the
higher incomes while performing the agriculture as a
occupation and the percentages are being 67.50,
75.80 and 57.89 in the study area as a whole
Khammam and Adilabad respectively. While earning
incomes from agriculture labour stood second with
the percentages of 25.75, 48.98 and 19.96 of
Adilabad, Khammam and the study area as a whole
respectively. Income from MFP is not figured in
Khammam, whereas in Adilabad, it is 7.62 per cent
of the total incomes of the Adilabad district.
Similarly, the income from leased out and coal mine
work did not figure in Adilabad. From the analysis, it
can be said that in spite of other occupations,
agriculture is providing substantial incomes to the
sample households. The mean value of the incomes
are worked out to be 82238.64, 82810.80 and
134066.92 in Khammam, Adilabad and the study
area as a whole respectively. While looking at the
values of standard deviation and co-efficient of
variation, one can conclude that there is a widespread
dispersion among the sample households across the
different occupations. Therefore, from the analysis, it
can be surmised that even after the lapse of many
years of globalisation, the occupation of agriculture
preponderates over other occupations with which it
can be said that agriculture play a vital role in the
tribal areas in general and the study area in particular.
Table-4: Distribution of the Sample Respondents by Sources of Income
Sources of Income District Total
Khammam Adilabad
Agriculture 436418.54
(75.80)
287629.35
(57.89)
724047.89
(67.50)
Agricultural Labour 86225.00
(14.98)
127904.00
(25.75)
214129.00
(19.96)
UGC Jr.No. 45308 | IFS – 2018: 1.14 | SJIF 2016:3.343 | SJIF 2017: 4.253 | ISI 2017-2018: 0.673
Emperor International Journal of Finance and Management Research [EIJFMR] Page 164
Paper ID: 13180225 ISSN: 2395-5929
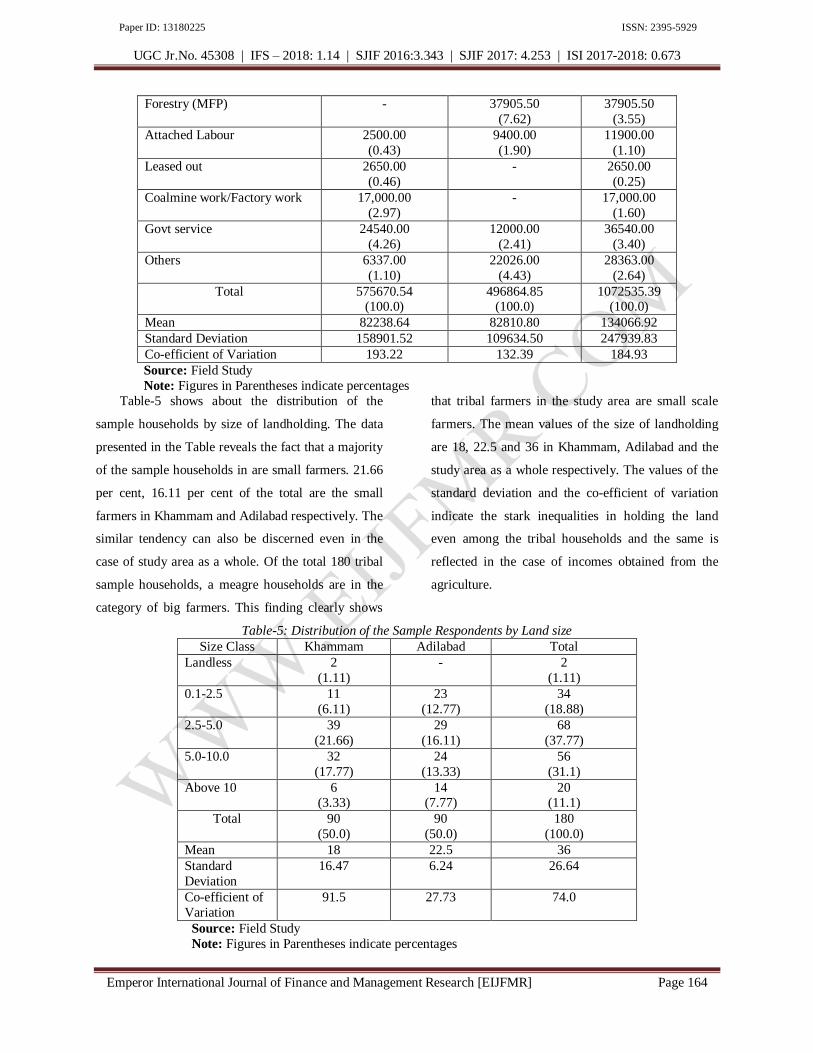
Forestry (MFP) - 37905.50
(7.62)
37905.50
(3.55)
Attached Labour 2500.00
(0.43)
9400.00
(1.90)
11900.00
(1.10)
Leased out 2650.00
(0.46)
- 2650.00
(0.25)
Coalmine work/Factory work 17,000.00
(2.97)
- 17,000.00
(1.60)
Govt service 24540.00
(4.26)
12000.00
(2.41)
36540.00
(3.40)
Others 6337.00
(1.10)
22026.00
(4.43)
28363.00
(2.64)
Total 575670.54 (100.0)
496864.85 (100.0)
1072535.39 (100.0)
Mean 82238.64 82810.80 134066.92
Standard Deviation 158901.52 109634.50 247939.83
Co-efficient of Variation 193.22 132.39 184.93
Source: Field Study
Note: Figures in Parentheses indicate percentages
Table-5 shows about the distribution of the
sample households by size of landholding. The data
presented in the Table reveals the fact that a majority
of the sample households in are small farmers. 21.66
per cent, 16.11 per cent of the total are the small
farmers in Khammam and Adilabad respectively. The
similar tendency can also be discerned even in the
case of study area as a whole. Of the total 180 tribal
sample households, a meagre households are in the
category of big farmers. This finding clearly shows
that tribal farmers in the study area are small scale
farmers. The mean values of the size of landholding
are 18, 22.5 and 36 in Khammam, Adilabad and the
study area as a whole respectively. The values of the
standard deviation and the co-efficient of variation
indicate the stark inequalities in holding the land
even among the tribal households and the same is
reflected in the case of incomes obtained from the
agriculture.
Table-5: Distribution of the Sample Respondents by Land size
Size Class Khammam Adilabad Total
Landless 2
(1.11)
- 2
(1.11)
0.1-2.5 11
(6.11)
23
(12.77)
34
(18.88)
2.5-5.0 39
(21.66)
29
(16.11)
68
(37.77)
5.0-10.0 32
(17.77)
24
(13.33)
56
(31.1)
Above 10 6 (3.33)
14 (7.77)
20 (11.1)
Total 90
(50.0)
90
(50.0)
180
(100.0)
Mean 18 22.5 36
Standard
Deviation
16.47 6.24 26.64
Co-efficient of
Variation
91.5 27.73 74.0
Source: Field Study
Note: Figures in Parentheses indicate percentages

UGC Jr.No. 45308 | IFS – 2018: 1.14 | SJIF 2016:3.343 | SJIF 2017: 4.253 | ISI 2017-2018: 0.673
Emperor International Journal of Finance and Management Research [EIJFMR] Page 165
Paper ID: 13180225 ISSN: 2395-5929
Table-6: Land owned and Average size of holding
Khammam Adilabad
No of families owning
the land
88 90
Total land owned 511.25 564.00
Average size of
holding
5.80 6.26
Sample population 456 472
Average size of
population
5.06 5.24
Source: Field Study
Note: Figures in Parentheses indicate percentages Land owned, average size of holding and average size of family, average size of population have shown in
Table-6. The data attest the fact that the average size of holding in Adilabad is higher than the Khammam with 6.26
acres and 5.80 acres in both the districts the average size of landholding is higher than the national average i.e. 1.52.
The average size of population in Khammam is worked out to be 5.06 and in Adilabad it is 5.24 and in both the
districts the average size of population is more or less equal to the national average (5.2).
Table-7: Cropping Pattern for Both Karif and Rabi Seasons in Khammam
Area under different crops Name of the Village Total
Chatti Kistaram Yellandu
Paddy 48.50
(31.00)
64.00
(32.95)
42.50
(22.98)
155.00
Maize 4.50
(2.87)
- 2.00
(1.08)
6.50
Jowar 55.00
(35.14)
61.00
(31.40)
66.00
(35.68)
182.00
Samai - 6.25 (3.22)
1.00 (0.54)
7.25
Pearl millet - 6.00
(3.08)
- 6.00
Green Gram 3.00
(1.91)
12.50
(6.43)
6.50
(3.52)
22.00
Red Gram 12.00
(7.67)
2.00
(1.04)
18.50
(10.00)
32.50
Black gram - 3.00
(1.54)
3.00
(1.62)
6.00
Hoarse gram 2.00
(1.28)
4.00
(2.06)
3.00
(1.62)
9.00
Cow gram - 2.00
(1.04)
- 2.00
Ground nut - - - -
Gingilly 9.00
(5.75)
- 14.50
(7.84)
23.50
Mirchi 7.50
(4.80)
9.50
(4.90)
3.00
(1.62)
20.00
Redgram+ gingilly 15.00
(9.58)
- 10.00
(5.40)
25.00
Jowar + green gram - 15.00
(7.72)
2.00
(1.08)
17.00
Greengram + redgram - - 9.00 (4.86)
9.00
UGC Jr.No. 45308 | IFS – 2018: 1.14 | SJIF 2016:3.343 | SJIF 2017: 4.253 | ISI 2017-2018: 0.673
Emperor International Journal of Finance and Management Research [EIJFMR] Page 166
Paper ID: 13180225 ISSN: 2395-5929
Greengram + cowgram - 3.00
(1.54)
- 3.00
Redgram + jowar - - 4.00
(2.16)
4.00
Greengram + hoarse gram - 3.00
(1.54)
- 3.00
Blackgram + hoarse gram - 0.50
(0.25)
- 0.50
Redgram +Blackgram - 0.50
(0.25)
Jowar - 2.00
(1.04)
- 2.00
Total area under the crops 156.50 (100.00)
194.25 (100.00
185.00 (100.00)
535.75
Mean 17.38 12.14 13.21 26.76
Standard Deviation 19.98 20.10 18.69 49.52
Co-efficient of Variation 114.95 165.56 141.48 185.05
Source: Field Study
Note: Figures in Parentheses indicate percentages
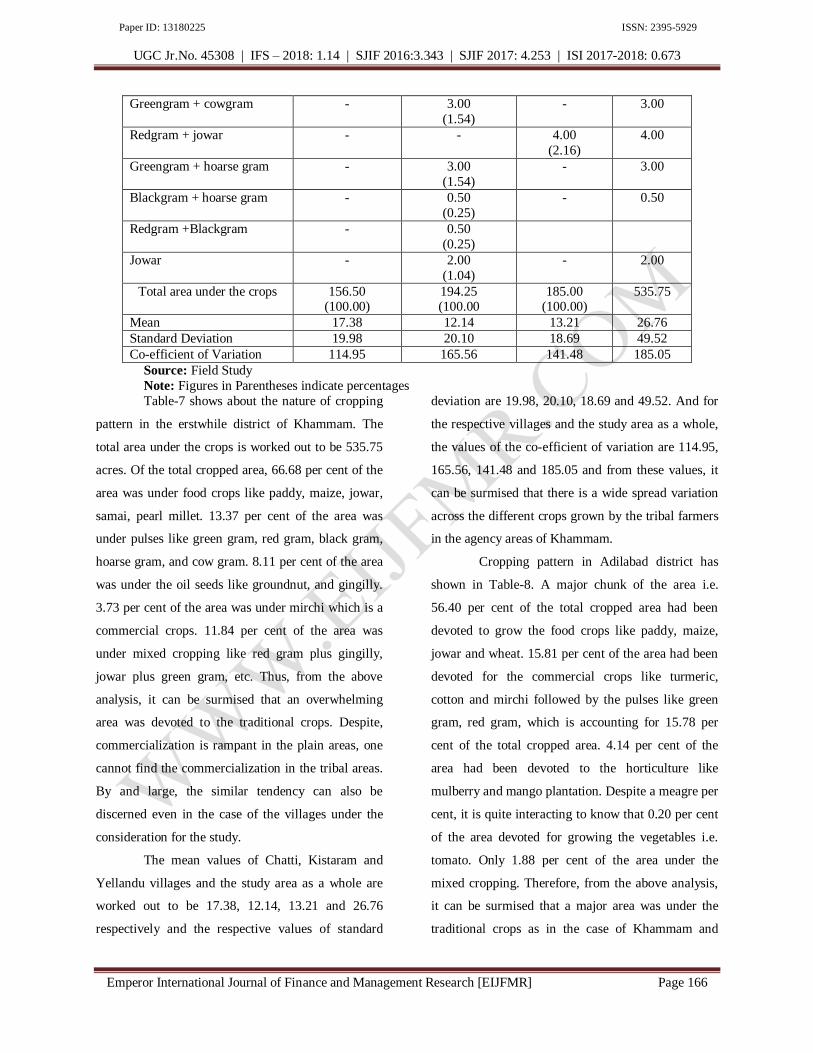
Table-7 shows about the nature of cropping
pattern in the erstwhile district of Khammam. The
total area under the crops is worked out to be 535.75
acres. Of the total cropped area, 66.68 per cent of the
area was under food crops like paddy, maize, jowar,
samai, pearl millet. 13.37 per cent of the area was
under pulses like green gram, red gram, black gram,
hoarse gram, and cow gram. 8.11 per cent of the area
was under the oil seeds like groundnut, and gingilly.
3.73 per cent of the area was under mirchi which is a
commercial crops. 11.84 per cent of the area was
under mixed cropping like red gram plus gingilly,
jowar plus green gram, etc. Thus, from the above
analysis, it can be surmised that an overwhelming
area was devoted to the traditional crops. Despite,
commercialization is rampant in the plain areas, one
cannot find the commercialization in the tribal areas.
By and large, the similar tendency can also be
discerned even in the case of the villages under the
consideration for the study.
The mean values of Chatti, Kistaram and
Yellandu villages and the study area as a whole are
worked out to be 17.38, 12.14, 13.21 and 26.76
respectively and the respective values of standard
deviation are 19.98, 20.10, 18.69 and 49.52. And for
the respective villages and the study area as a whole,
the values of the co-efficient of variation are 114.95,
165.56, 141.48 and 185.05 and from these values, it
can be surmised that there is a wide spread variation
across the different crops grown by the tribal farmers
in the agency areas of Khammam.
Cropping pattern in Adilabad district has
shown in Table-8. A major chunk of the area i.e.
56.40 per cent of the total cropped area had been
devoted to grow the food crops like paddy, maize,
jowar and wheat. 15.81 per cent of the area had been
devoted for the commercial crops like turmeric,
cotton and mirchi followed by the pulses like green
gram, red gram, which is accounting for 15.78 per
cent of the total cropped area. 4.14 per cent of the
area had been devoted to the horticulture like
mulberry and mango plantation. Despite a meagre per
cent, it is quite interacting to know that 0.20 per cent
of the area devoted for growing the vegetables i.e.
tomato. Only 1.88 per cent of the area under the
mixed cropping. Therefore, from the above analysis,
it can be surmised that a major area was under the
traditional crops as in the case of Khammam and
UGC Jr.No. 45308 | IFS – 2018: 1.14 | SJIF 2016:3.343 | SJIF 2017: 4.253 | ISI 2017-2018: 0.673
Emperor International Journal of Finance and Management Research [EIJFMR] Page 167
Paper ID: 13180225 ISSN: 2395-5929
mixed cropping is not the remarkable feature of the
tribal households in Adilabad district. Further, it had
also been observed that some sort of
commercialization had traced among the tribal
farmers in the Adilabad region. Apart from this, one
can find some sort of crop diversification in Adilabad
which is not true in the case of tribal farmers in
Khammam district. By and large, the village-wise
data also reflect the similar tendency as in the case of
study area as a whole.
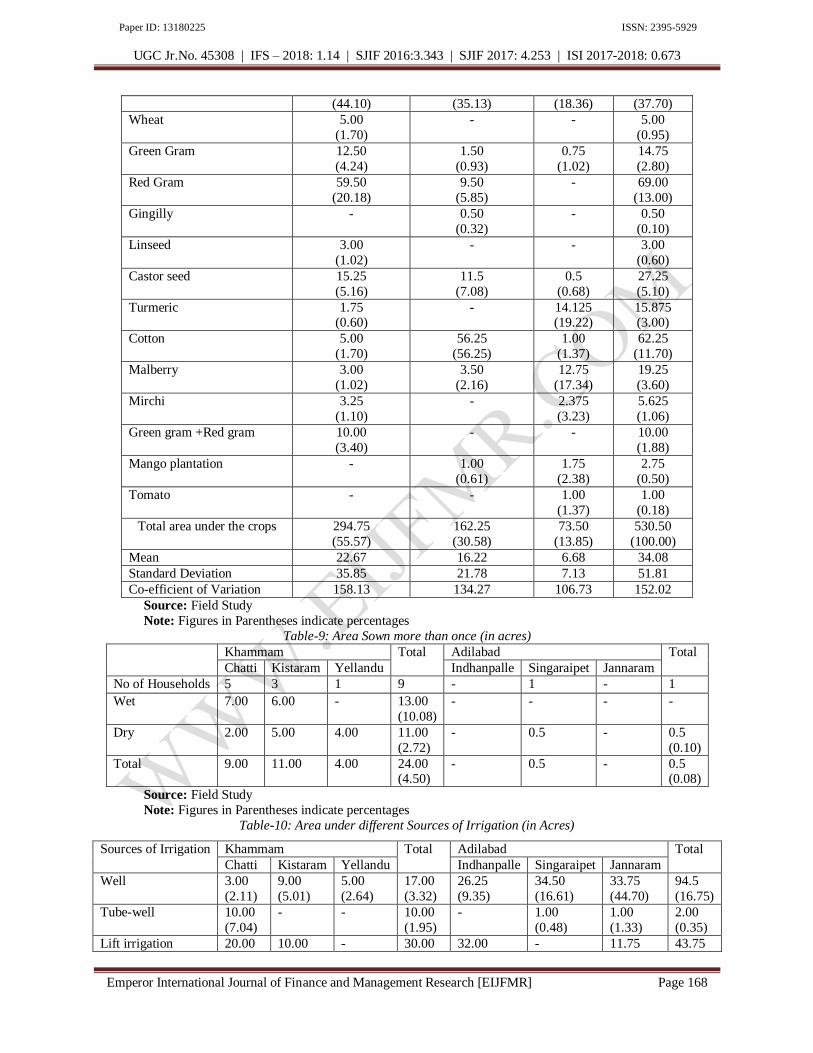
The mean values for Indhanpalle,
Singaraipet, Jannaram and the study area as a whole
are worked out to be 22.67, 16.22, 6.68 and 34.08
respectively and the respective values of the standard
deviation are 35.85, 21.78, 7.3 and 51.81. The co-
efficient of variation is worked out to be 158.13,
134.27, 106.73 and 152.02 for the villages of
Indhanpalle, Singaraipet, Jannaram and the study
area as a whole respectively. While looking at the
values of co-efficient variation, it can be inferred that
there is a much variation across the different crops
grown by the tribal farmers in the district of
Adilabad. The variation is higher in Indhanpalle
followed by Singaraipet and Jannaram.
Thus, from the above analysis of Khammam
and Adilabad districts, it can be inferred that the
traditionalisation of agriculture is predominant over
the commercialization of the agriculture in the tribal
areas which is in contrast to the prevalence of
agriculture in the plain areas. Further, during the field
work, it had also been observed that the suicidal rates
among the tribal households in the agency areas are
very negligible when compared with the households
in the plain areas as it is due to the fact that as the
tribal farmers are growing only food crops to the
extent possible and moreover they are using the
traditional methods of cultivation whose cost of
cultivation is less expensive. Thus, with this sort of
experience, one can suggest that the farmers are
supposed to grow the food crops instead of
commercial crops where cost of cultivation is very
expensive and more over commercial crops are more
prone to pests and insects.
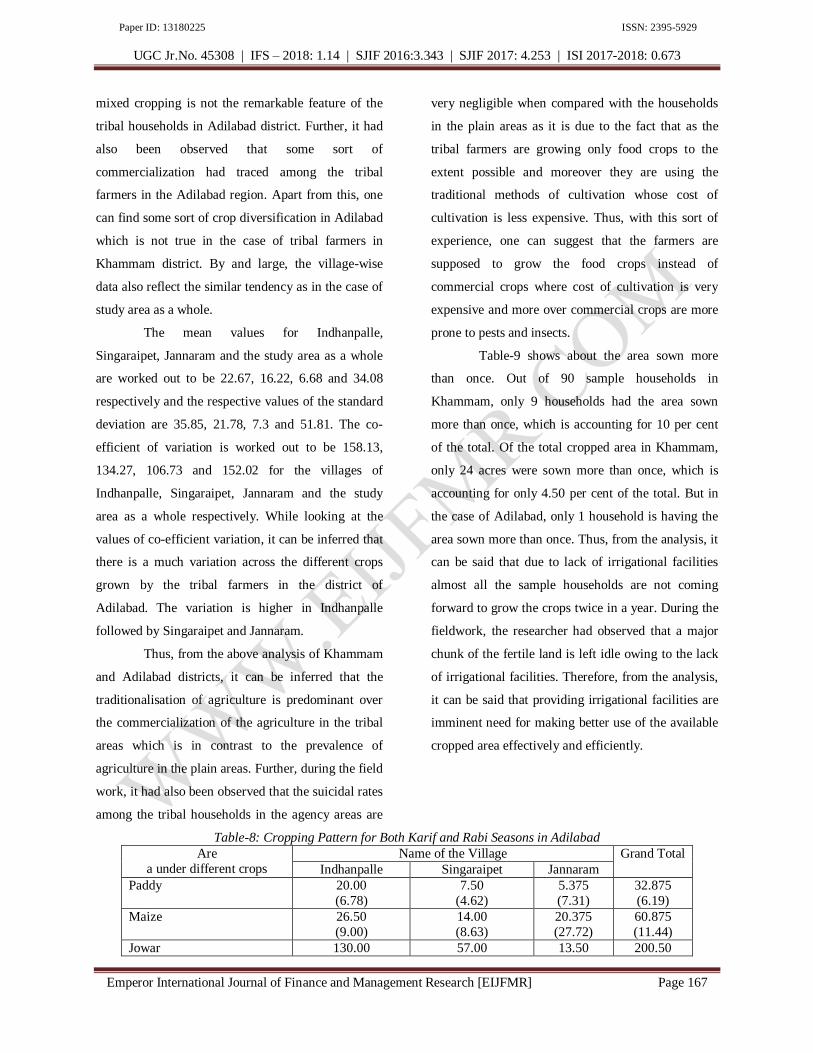
Table-9 shows about the area sown more
than once. Out of 90 sample households in
Khammam, only 9 households had the area sown
more than once, which is accounting for 10 per cent
of the total. Of the total cropped area in Khammam,
only 24 acres were sown more than once, which is
accounting for only 4.50 per cent of the total. But in
the case of Adilabad, only 1 household is having the
area sown more than once. Thus, from the analysis, it
can be said that due to lack of irrigational facilities
almost all the sample households are not coming
forward to grow the crops twice in a year. During the
fieldwork, the researcher had observed that a major
chunk of the fertile land is left idle owing to the lack
of irrigational facilities. Therefore, from the analysis,
it can be said that providing irrigational facilities are
imminent need for making better use of the available
cropped area effectively and efficiently.
Table-8: Cropping Pattern for Both Karif and Rabi Seasons in Adilabad
Are
a under different crops
Name of the Village Grand Total
Indhanpalle Singaraipet Jannaram
Paddy 20.00
(6.78)
7.50
(4.62)
5.375
(7.31)
32.875
(6.19)
Maize 26.50
(9.00)
14.00
(8.63)
20.375
(27.72)
60.875
(11.44)
Jowar 130.00 57.00 13.50 200.50
UGC Jr.No. 45308 | IFS – 2018: 1.14 | SJIF 2016:3.343 | SJIF 2017: 4.253 | ISI 2017-2018: 0.673
Emperor International Journal of Finance and Management Research [EIJFMR] Page 168
Paper ID: 13180225 ISSN: 2395-5929
(44.10) (35.13) (18.36) (37.70)
Wheat 5.00
(1.70)
- - 5.00
(0.95)
Green Gram 12.50
(4.24)
1.50
(0.93)
0.75
(1.02)
14.75
(2.80)
Red Gram 59.50
(20.18)
9.50
(5.85)
- 69.00
(13.00)
Gingilly - 0.50
(0.32)
- 0.50
(0.10)
Linseed 3.00
(1.02)
- - 3.00
(0.60)
Castor seed 15.25
(5.16)
11.5
(7.08)
0.5
(0.68)
27.25
(5.10)
Turmeric 1.75 (0.60)
- 14.125 (19.22)
15.875 (3.00)
Cotton 5.00
(1.70)
56.25
(56.25)
1.00
(1.37)
62.25
(11.70)
Malberry 3.00
(1.02)
3.50
(2.16)
12.75
(17.34)
19.25
(3.60)
Mirchi 3.25
(1.10)
- 2.375
(3.23)
5.625
(1.06)
Green gram +Red gram 10.00
(3.40)
- - 10.00
(1.88)
Mango plantation - 1.00
(0.61)
1.75
(2.38)
2.75
(0.50)
Tomato - - 1.00
(1.37)
1.00
(0.18)
Total area under the crops 294.75
(55.57)
162.25
(30.58)
73.50
(13.85)
530.50
(100.00)
Mean 22.67 16.22 6.68 34.08
Standard Deviation 35.85 21.78 7.13 51.81
Co-efficient of Variation 158.13 134.27 106.73 152.02
Source: Field Study
Note: Figures in Parentheses indicate percentages
Table-9: Area Sown more than once (in acres)
Khammam Total Adilabad Total
Chatti Kistaram Yellandu Indhanpalle Singaraipet Jannaram
No of Households 5 3 1 9 - 1 - 1
Wet 7.00 6.00 - 13.00
(10.08)
- - - -
Dry 2.00 5.00 4.00 11.00
(2.72)
- 0.5 - 0.5
(0.10)
Total 9.00 11.00 4.00 24.00 (4.50)
- 0.5 - 0.5 (0.08)
Source: Field Study
Note: Figures in Parentheses indicate percentages
Table-10: Area under different Sources of Irrigation (in Acres)
Sources of Irrigation Khammam Total Adilabad Total
Chatti Kistaram Yellandu Indhanpalle Singaraipet Jannaram
Well 3.00
(2.11)
9.00
(5.01)
5.00
(2.64)
17.00
(3.32)
26.25
(9.35)
34.50
(16.61)
33.75
(44.70)
94.5
(16.75)
Tube-well 10.00
(7.04)
- - 10.00
(1.95)
- 1.00
(0.48)
1.00
(1.33)
2.00
(0.35)
Lift irrigation 20.00 10.00 - 30.00 32.00 - 11.75 43.75
UGC Jr.No. 45308 | IFS – 2018: 1.14 | SJIF 2016:3.343 | SJIF 2017: 4.253 | ISI 2017-2018: 0.673
Emperor International Journal of Finance and Management Research [EIJFMR] Page 169
Paper ID: 13180225 ISSN: 2395-5929
(14.09) (5.56) (5.87) (11.40) (15.56) (7.75)
Canal - - - - - 6.00
(2.89)
12.00
(15.90)
18.00
(3.19)
Tank - 15.00
(8.35)
20.75
(10.95)
35.75
(6.99)
10.00
(3.56)
9.00
(4.33)
3.00
(3.97)
22.00
(3.90)
Kunta - - 6.50
(3.43)
6.50
(1.27)
- - - -
Others 109.00
(76.76)
145.75
(81.08)
157.25
(82.98)
412.00
(80.62)
212.50
(75.69)
157.25
(75.69)
14.00
(18.54)
383.75
(68.04)
Total 142.00
(100.0)
179.75
(100.0)
189.25
(100.0)
511.00
(100.0)
280.75
(100.0)
207.75
(100.0)
75.50
(100.0)
564.00
(100.0)
Source: Field Study
Note: Figures in Parentheses indicate percentages
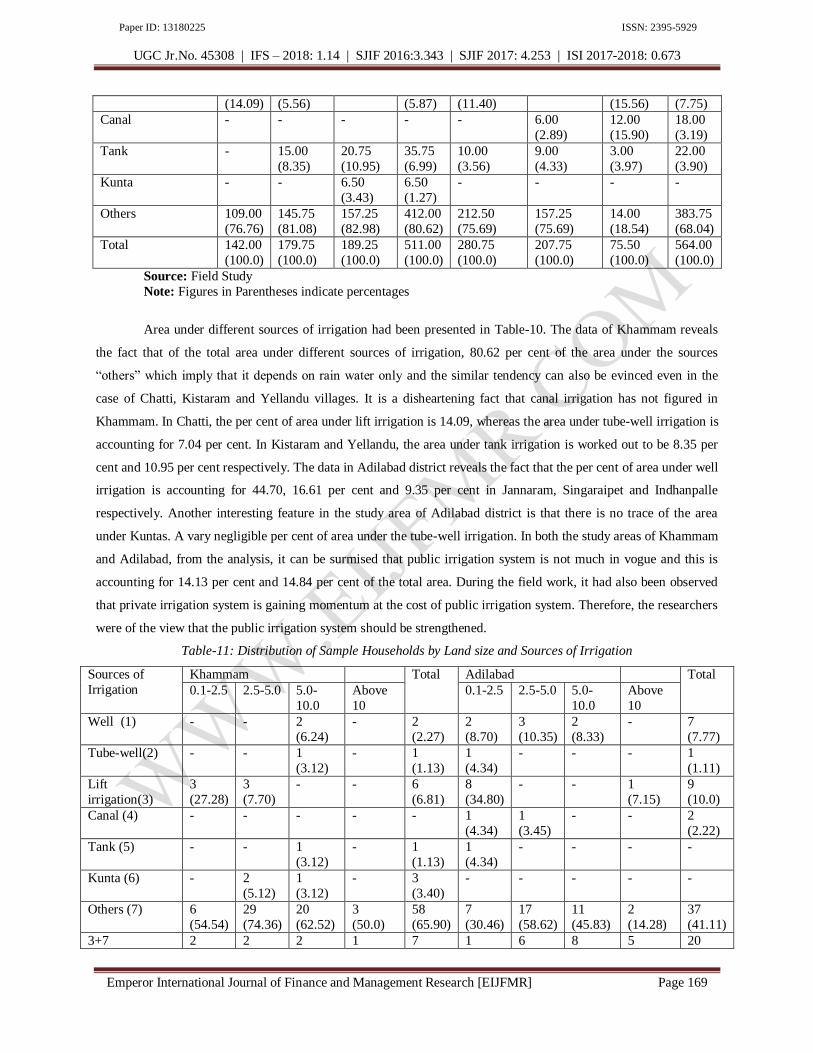
Area under different sources of irrigation had been presented in Table-10. The data of Khammam reveals
the fact that of the total area under different sources of irrigation, 80.62 per cent of the area under the sources
“others” which imply that it depends on rain water only and the similar tendency can also be evinced even in the
case of Chatti, Kistaram and Yellandu villages. It is a disheartening fact that canal irrigation has not figured in
Khammam. In Chatti, the per cent of area under lift irrigation is 14.09, whereas the area under tube-well irrigation is
accounting for 7.04 per cent. In Kistaram and Yellandu, the area under tank irrigation is worked out to be 8.35 per
cent and 10.95 per cent respectively. The data in Adilabad district reveals the fact that the per cent of area under well
irrigation is accounting for 44.70, 16.61 per cent and 9.35 per cent in Jannaram, Singaraipet and Indhanpalle
respectively. Another interesting feature in the study area of Adilabad district is that there is no trace of the area
under Kuntas. A vary negligible per cent of area under the tube-well irrigation. In both the study areas of Khammam
and Adilabad, from the analysis, it can be surmised that public irrigation system is not much in vogue and this is
accounting for 14.13 per cent and 14.84 per cent of the total area. During the field work, it had also been observed
that private irrigation system is gaining momentum at the cost of public irrigation system. Therefore, the researchers
were of the view that the public irrigation system should be strengthened.
Table-11: Distribution of Sample Households by Land size and Sources of Irrigation
Sources of
Irrigation
Khammam Total Adilabad Total
0.1-2.5 2.5-5.0 5.0-
10.0
Above
10
0.1-2.5 2.5-5.0 5.0-
10.0
Above
10
Well (1) - - 2
(6.24)
- 2
(2.27)
2
(8.70)
3
(10.35)
2
(8.33)
- 7
(7.77)
Tube-well(2) - - 1
(3.12)
- 1
(1.13)
1
(4.34)
- - - 1
(1.11)
Lift
irrigation(3)
3
(27.28)
3
(7.70)
- - 6
(6.81)
8
(34.80)
- - 1
(7.15)
9
(10.0)
Canal (4) - - - - - 1
(4.34)
1
(3.45)
- - 2
(2.22)
Tank (5) - - 1
(3.12)
- 1
(1.13)
1
(4.34)
- - - -
Kunta (6) - 2
(5.12)
1
(3.12)
- 3
(3.40)
- - - - -
Others (7) 6
(54.54)
29
(74.36)
20
(62.52)
3
(50.0)
58
(65.90)
7
(30.46)
17
(58.62)
11
(45.83)
2
(14.28)
37
(41.11)
3+7 2 2 2 1 7 1 6 8 5 20

UGC Jr.No. 45308 | IFS – 2018: 1.14 | SJIF 2016:3.343 | SJIF 2017: 4.253 | ISI 2017-2018: 0.673
Emperor International Journal of Finance and Management Research [EIJFMR] Page 170
Paper ID: 13180225 ISSN: 2395-5929
(18.18) (5.12 (6.24) (16.66) (7.95) (4.34) (20.68) (33.33) (35.71) (22.22)
5+7 - 3
(7.70)
5
(15.64)
2
(33.32)
10
(11.36)
2
(8.68)
2
(6.9)
3
(12.51)
6
(42.85)
13
(14.44)
Total 11
(100.0)
39
(100.0)
32
(100.0)
6
(100.0)
88
(100.0)
23
(100.0)
29
(100.0)
24
(100.0)
14
(100.0)
90
(100.0)
Source: Field Study
Note: Figures in Parentheses indicate percentages
Table-11 depicts the distribution of sample
households by size of land holding and the sources of
irrigation. From the data presented in the Table-11
reveals the fact that irrespective of size of the land
holding, an overwhelming majority of the sample
households are having the “other sources” for
irrigating their lands would imply that they may
depend on the “rain water”. While looking at the
Table-11, it can be said that in a relative sense in both
the study areas of Khammam and Adilabad, lift
irrigation is figured in and this is the highest in
Adilabad within the range of 0.1-2.5 acres, which is
accounting for 34.80 per cent followed by Khammam
with in the same size of landholding which is
accounting for 27.28 per cent. Thus, from the above
analysis, it can be said that there is no correlation
between the size of landholding and sources of
irrigation and hence, during the field work, it had also
been observed that private irrigation especially wells
as a source of irrigation is figured in relatively higher
in Adilabad as compared with Khammam.
By and large, from the above analysis, it can be
said that the causes and resultant consequences of the
changes in cropping were so complex and inter-
related to each other and therefore, it is not that much
easy to isolate the individual factors. The cropping
pattern among the tribal farmers was predominantly
oriented towards food crops only and there is no
change overtime in their cropping pattern. Further, it
can be said that the present study corroborates the
empirical findings of the scholars like B.K.Burman,
Krishnaswamy and Patel, Murthy and Singh, Pawer
etc. Finally, the study also lends support of the earlier
writings that the cropping pattern in most of the tribal
villages oriented towards growing the food crops
primarily cereals of the type. Therefore, the
researchers of the present study were of the view that
the tribal farmers have to be open minded and willing
to experiment with new technologies and have to
develop an alternative model with harmonious
admixture of traditional and modern scientific
knowledge.
Notes:
1. Economic factors include prices, income,
size of holdings, availability of inputs and land
tenure, etc.
2. These pertain to historical pattern of land
tenure. If the land is divided into a number of small
plots with ownership vested in numerous small and
marginal farmers (as under ryotwari) the tendency
will be to grow food crops. As against to this, if
ownership of land is vested in large owners (as under
zamindari) the tendency will be to produce more cash
crops.
3. Social factors include customs, traditions,
outlook towards material things and social
environment, etc.
4. Government policies relate to exports, taxes,
subsidies, supplies of inputs and availability of credit,
etc.
5. These include the use of agricultural inputs
and methods such as modern machinery, improved
seeds, fertilizers, improved ploughs, tractors,
harvesters and irrigation etc., which helps to raise
productivity.
UGC Jr.No. 45308 | IFS – 2018: 1.14 | SJIF 2016:3.343 | SJIF 2017: 4.253 | ISI 2017-2018: 0.673
Emperor International Journal of Finance and Management Research [EIJFMR] Page 171
Paper ID: 13180225 ISSN: 2395-5929
6. Single cropping (monoculture) means when
a single crop is grown during a season.
7. It refers to the practice of growing two crops
in a year.
8. It means when cropping is done in a definite
sequence.
9. It refers to a process of growing two or more
crops together in the same piece of land. Mixed
cropping widely practiced in India, particularly
during the kharif season.
10. It is the process of growing a number of
crops on the same piece of land during the given
period of time. The aim is to increase the income per
unit area within a specified period of time.
11. This is a cropping system in which two or
more crops are grown in succession within a year.
An example of multiple cropping is Rice-Potato-
Sunflower followed by Rice-Wheat-Moong.
12. This is a process of growing subsidiary
crops between two widely spaced rows of main crop.
Examples are Sugarcane-Soyabean, Moong or Urd-
Maize, and Urd, Moong or Cotton-Pigeonpea.
II. REFERENCE
1) Dobariya,J.B. et.al, (2016): Cropping Pattern
in Tribal Area of Dang District, J Krishi
Vigyan, Vol. 5(1), pp.19-22.
2) Jairath, M. S. (1994): Wholesale Market and
Agricultural Development in the Tribal Areas,
Indian Journal of Agricultural Marketing,
Special Issue, pp. 105-113.
3) Jalaja,V and Kala,P.A, (2015): Case Study of
Tribal farmers Agricultural Information Needs
and Accessibility in Attappady Tribal Block,
Palakkad, IOSR Journal of Humanities and
Social Science, Vol.20(8), pp.7-12.
4) Mohammad Awais (2012): An analytical
Study of Socio-economic Conditions of Tribal
Farmers in Bijnor District of U.P. State, Ph.D
Thesis, Aligarh Muslim University, Aligarh.
5) Pavankalyan, V and Vasudev, N (2017):
Cropping Pattern and Cropping Intensity of
Tribal Agriculture, International Journal of
Pure and Applied Bioscience, Vol. 5(4),
pp.1185-88.