Embed Size (px)
Citation preview
Cross-border Activity of Japanese Banks
W. Raphael Lam
© 2013 International Monetary Fund WP/13/235
IMF Working Paper
Asia and Pacific
Cross-border Activity of Japanese Banks
Prepared by W. Raphael Lam
Authorized for distribution by Stephan Danninger
November 2013
Abstract
This paper explores the determinants of Japanese banks’ overseas expansion and assesses
whether the growing cross-border activity will continue under the new macroeconomic
policies referred as “Abenomics”. The analysis finds that Japanese banks are well
positioned to scale up foreign exposures, thanks to their relative resilient balance sheets and
continued growth in the region. Stronger domestic growth in Japan could mitigate the pace,
but is unlikely to reverse the expansion as global and regional pull-factors play a more
prominent role in the growth of cross-border claims. Increasing cross-border activity could
pose funding risks and supervisory challenges and require continued close monitoring.
JEL Classification Numbers: G01
Keywords: Japan, cross-border banking, Abenomics, funding risks
Author’s E-Mail Address:[email protected]
This Working Paper should not be reported as representing the views of the IMF.
The views expressed in this Working Paper are those of the author(s) and do not necessarily represent those of the IMF or IMF policy. Working Papers describe research in progress by the author(s) and are published to elicit comments and to further debate.
2
Contents Page
I. Introduction ....................................................................................................................3
II. Expanding Abroad: Past Experience and Recent Developments ..................................4 A. Past Experience of Overseas Expansion by Japanese Financial Institutions ............4 B. Recent Developments of Overseas Activity..............................................................6 C. Nonbank Sector—Life Insurers and Securities Firms .............................................10
III. Contributing Factors for Increasing Cross-border Activity .........................................10
IV. Empirical Analysis in Cross-Borader Activity of Japanese Banks ..............................12 Outlook and Policy Implications .................................................................................14
V. Conclusions ..................................................................................................................15
References ................................................................................................................................16
Appendix ..................................................................................................................................17
3
I. INTRODUCTION
Cross-border activities of Japanese financial institutions have risen over the past few
years, particularly to the Asian region. Major Japanese banks have attained an important global and regional presence, particularly in areas of syndicated lending and project finance. Foreign claims on Asia have reached levels prior to the global financial crisis during 2005–08. Last year alone, overseas loans by major banks are growing by over 20 percent year-on year. At the same time, major brokerage firms and life insurers have sought acquisitions or strategic partnership overseas.
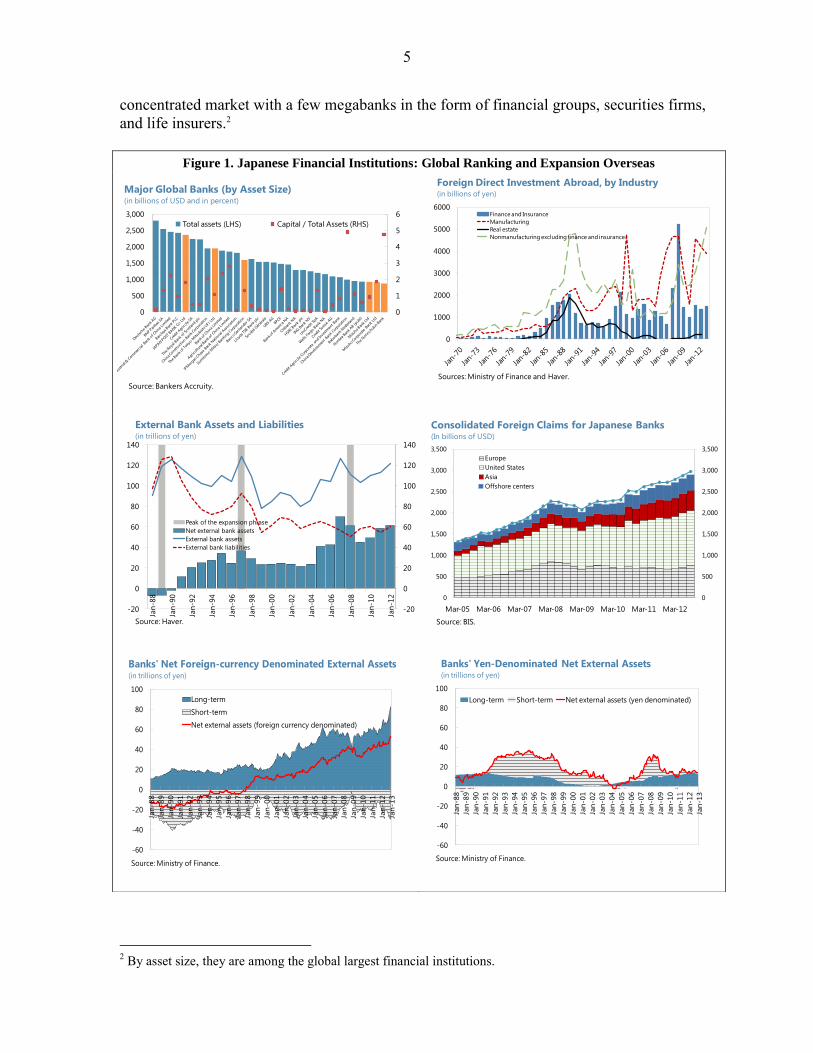
The current trend is often compared to previous episodes of overseas expansion by
Japanese financial institutions over last decades. Those episodes can be broadly classified in three waves (Figure 1): (i) the rapid expansion in the 1980s up until the burst of the asset bubbles in 1990; (ii) the expansion during the mid-1990s; and (iii) the expansion abroad beginning from 2006 but temporarily slowed during the global financial crisis. A question to explore would be how the current trend of overseas expansion has similarities to these episodes.
This paper assesses whether this trend is likely to continue under the government’s new
policy framework often referred to as Abenomics. The Bank of Japan’s (BoJ) new quantitative and qualitative monetary easing (QQME) framework—part of the three-pronged strategies to revive growth and exit deflation—intends to encourage financial institutions to shift away from government bonds and take on greater exposures of risky assets (such as loans and investment securities).1 An improved domestic outlook could increase financial institutions inward focus to satisfy rising credit demand. On the other hand, uncertainty over the Japanese government bond (JGB) market and yen movements may stimulate diversifying needs outside Japan. Are there new risks that may emerge in light of increasing cross-border activity and the implications for financial institutions and supervisors?
To answer these questions, the paper analyzes what factors contribute to Japanese
financial institutions expanding abroad recently. The analysis proceeds in tow steps: first, an empirical study of several banking systems in advanced countries is conducted to identify the determinants of their foreign claims. In the second step, the empirical results are applied to Japanese banking system to assess the role of each contributing factor in explaining overseas loan growth. The paper builds on the literature on cross-border banking (Berger, DeYoung, Genay, and Udell 2000, De Haas and Lelyveld 2010, De Young, Evanoff, and Molyneux 2009) and those on international capital flows (Fratzscher 2012, Jotikasthira, Lundblad, and Ramadorai 2012). The empirical results show that several regional and domestic factors have contributed
to overseas expansions. Stagnant growth and limited domestic credit demand have added incentives for Japanese financial institutions to seek opportunities abroad. Modest global uncertainty, large growth differentials, and the resilience of domestic banking systems are key drivers for cross-border claims. Outside Japan, growth in Asia and deleveraging of
1 The three-pronged strategies Abenomics include flexible fiscal policy, aggressive monetary easing, and structural reforms to exit deflation and raise growth.
4
European banks in the region contributed to a rise of cross-border lending. The exchange rate appreciation in the past years might have added incentives for expanding abroad. The paper argues that the trend of expanding overseas is likely to continue, but will
depend on a supportive domestic economy and careful risk supervision. Growth in Asia and sufficient liquidity at home would imply the trend of expanding abroad is likely to continue. Although stronger domestic growth might slow the expansion pace, it is not expected to reverse the trend unless incomplete policies under Abenomics elevate domestic financial stability risks. Increasing cross-border activity could add to funding risks while exacerbating supervisory challenges that require continued close monitoring. The paper is organized as follows. Section II takes stock of the past experience of Japanese financial institutions expanding abroad. The paper then illustrates the recent trend of overseas expansion, highlighting the regional distribution, areas of financing, and the financial performance relative to domestic activity. Section III analyzes the determinants for banks’ expanding abroad based on an empirical analysis and Japan’s experience. Section IV discusses the outlook and risks of Japanese financial institutions expanding overseas, followed by a discussion on policy implications. Section V concludes.
II. EXPANDING ABROAD: PAST EXPERIENCE AND RECENT DEVELOPMENTS
A. Past Experience of Overseas Expansion by Japanese Financial Institutions
Japanese financial institutions have attempted several times to expand abroad over last
three decades. The success was mixed. During three waves of earlier expansions, financial institutions have not, in generally, secured a major global footing, except a few megabanks and securities firms. The first wave of overseas expansion by Japanese financial institutions occurred during
the mid-to-late 1980s, about the same time when many real-estate and construction companies increased markedly their outward foreign direct investments (FDIs) (Figure 1). In addition to financing the FDI activity, banks also established extensively branches and subsidiaries abroad in major financial hubs such as London and New York (Nolle and Seth 1996). The expansion was partly driven by strong growth in Japan, sizeable FDIs of Japanese corporations, yen appreciation, and the desire to diversify bank lending. Following the bursting of asset bubbles in 1990, banks had to scale back their foreign claims or sold off foreign assets. External bank assets fell by over 20 percent from the peak. Japanese banks increased foreign lending to Asia again in the mid-1990s, in part to take
advantage of the rapid growth in the region. Those loans were often denominated in foreign currency related to investment projects in the region. Following the Asian Financial Crisis, Japanese banks, however, incurred sizeable valuation losses and their nonperforming loans rose sharply, forcing them to recede on overseas lending. External bank assets fell by about 40 percent in two years (Figure 1). Overseas losses, among domestic problems, had contributed to the subsequent banking crises in Japan that lasted until early 2000s. The banking crises have resulted significant restructuring and consolidations that gave rise to a
5
concentrated market with a few megabanks in the form of financial groups, securities firms, and life insurers.2
2 By asset size, they are among the global largest financial institutions.
Figure 1. Japanese Financial Institutions: Global Ranking and Expansion Overseas
0
1
2
3
4
5
6
0
500
1,000
1,500
2,000
2,500
3,000
Total assets (LHS) Capital / Total Assets (RHS)
Major Global Banks (by Asset Size) (in billions of USD and in percent)
Source: Bankers Accruity.
0
1000
2000
3000
4000
5000
6000Finance and Insurance
Manufacturing
Real estate
Nonmanufacturing excluding finance and insurance
Foreign Direct Investment Abroad, by Industry (in billions of yen)
Sources: Ministry of Finance and Haver.
-60
-40
-20
0
20
40
60
80
100
Jan
-88
Jan
-89
Jan
-90
Jan
-91
Jan
-92
Jan
-93
Jan
-94
Jan
-95
Jan
-96
Jan
-97
Jan
-98
Jan
-99
Jan
-00
Jan
-01
Jan
-02
Jan
-03
Jan
-04
Jan
-05
Jan
-06
Jan
-07
Jan
-08
Jan
-09
Jan
-10
Jan
-11
Jan
-12
Jan
-13
Long-term Short-term Net external assets (yen denominated)
Banks' Yen-Denominated Net External Assets (in trillions of yen)
Source: Ministry of Finance.-60
-40
-20
0
20
40
60
80
100
Jan
-88
Jan
-89
Jan
-90
Jan
-91
Jan
-92
Jan
-93
Jan
-94
Jan
-95
Jan
-96
Jan
-97
Jan
-98
Jan
-99
Jan
-00
Jan
-01
Jan
-02
Jan
-03
Jan
-04
Jan
-05
Jan
-06
Jan
-07
Jan
-08
Jan
-09
Jan
-10
Jan
-11
Jan
-12
Jan
-13
Long-term
Short-term
Net external assets (foreign currency denominated)
Banks' Net Foreign-currency Denominated External Assets (in trillions of yen)
Source: Ministry of Finance.
-20
0
20
40
60
80
100
120
140
-20
0
20
40
60
80
100
120
140
Jan
-88
Jan
-90
Jan
-92
Jan
-94
Jan
-96
Jan
-98
Jan
-00
Jan
-02
Jan
-04
Jan
-06
Jan
-08
Jan
-10
Jan
-12
Peak of the expansion phrase
Net external bank assets
External bank assets
External bank liabilities
External Bank Assets and Liabilities(in trillions of yen)
Source: Haver.
0
500
1,000
1,500
2,000
2,500
3,000
3,500
0
500
1,000
1,500
2,000
2,500
3,000
3,500
Mar-05 Mar-06 Mar-07 Mar-08 Mar-09 Mar-10 Mar-11 Mar-12
Europe
United States
Asia
Offshore centers
Consolidated Foreign Claims for Japanese Banks(In billions of USD)
Source: BIS.
6
Overseas activity by Japanese financial institutions has risen again since 2005 despite
the temporary decline during the peak of the global financial crisis. As Japanese financial system has remained resilient to the global financial crisis, Japanese banks have broadened their financing to non-Japanese entities and local demand, Recent developments and the factors contributing the rise will be discussed in the next section. Despite the rise and fall of overseas activity, net external assets for Japanese banks have
been on an increasing trend over the last decades. This possibly suggests a change of funding source on overseas activity. In the years leading up to the Asian Financial crisis, Japanese banks have relied on foreign-currency financing that created a net liability position. Over time Japanese banks have accumulated net external foreign assets while the short-term liabilities have remained stable, implying banks have increasingly financed long-term overseas loans with domestic yen-denominated funds.
B. Recent Developments of Overseas Activity
After the global financial crisis, Japanese financial institutions have increased their
overseas activity through takeovers and lending, mostly in the Asian region. Stagnant domestic growth, relative resilience of Japanese banks through the global financial crisis, and strong growth in Asia have contributed to the expansion abroad. Banking Sector
Japanese banks have increased their cross-
border activity, mostly to the Asian region. Cross-border consolidated claims of Japanese banks abroad have increased since 2005 and reached near US$3 trillion (about 15 percent of total banking and trust assets) according to the Bank of International Settlement (BIS) as of March 2013. Claims on Asia have more than doubled since the global financial crisis (now accounting for about 10 percent of total foreign consolidated claims). The exposures to Europe, however, have grown more moderately and significantly slowed in peripheral European countries after the global financial crisis (Table 1 and Figure 1). A large share of the rising foreign claims is attributed to growing overseas loans by major banks.
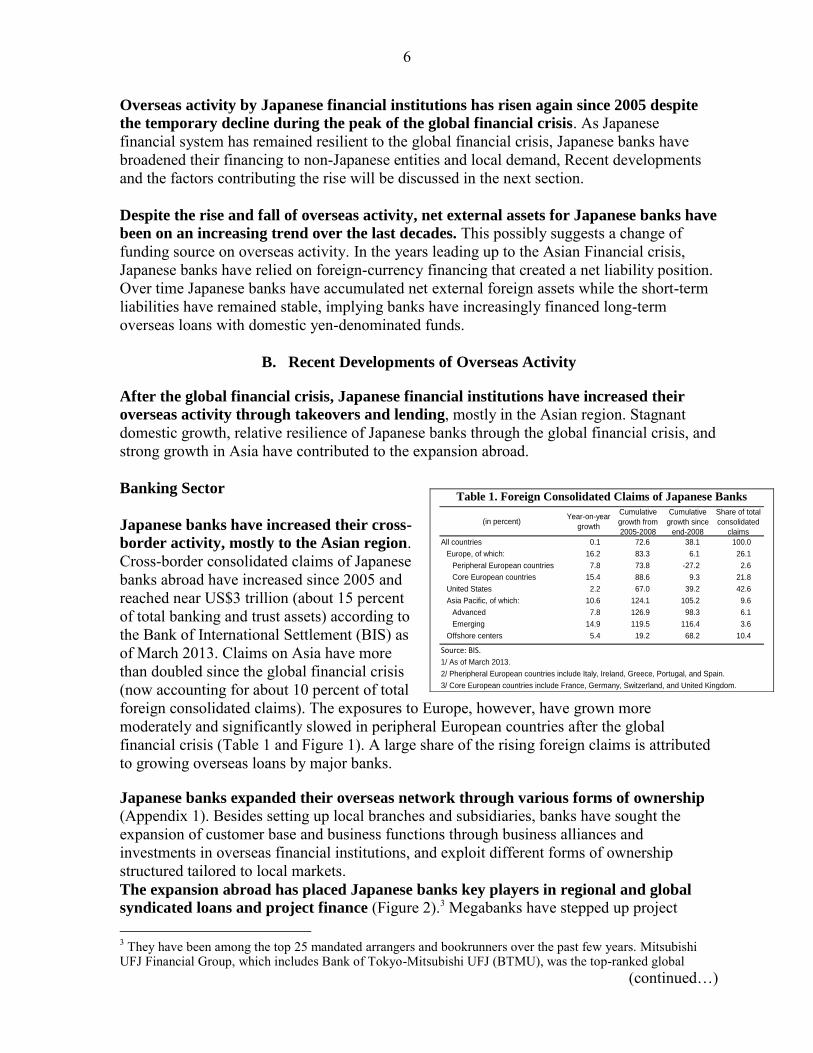
Japanese banks expanded their overseas network through various forms of ownership (Appendix 1). Besides setting up local branches and subsidiaries, banks have sought the expansion of customer base and business functions through business alliances and investments in overseas financial institutions, and exploit different forms of ownership structured tailored to local markets. The expansion abroad has placed Japanese banks key players in regional and global
syndicated loans and project finance (Figure 2).3 Megabanks have stepped up project 3 They have been among the top 25 mandated arrangers and bookrunners over the past few years. Mitsubishi UFJ Financial Group, which includes Bank of Tokyo-Mitsubishi UFJ (BTMU), was the top-ranked global
(continued…)
Table 1. Foreign Consolidated Claims of Japanese Banks
(in percent)Year-on-year
growth
Cumulative
growth from
2005-2008
Cumulative
growth since
end-2008
Share of total
consolidated
claims
All countries 0.1 72.6 38.1 100.0
Europe, of which: 16.2 83.3 6.1 26.1
Peripheral European countries 7.8 73.8 -27.2 2.6
Core European countries 15.4 88.6 9.3 21.8
United States 2.2 67.0 39.2 42.6
Asia Pacific, of which: 10.6 124.1 105.2 9.6
Advanced 7.8 126.9 98.3 6.1
Emerging 14.9 119.5 116.4 3.6
Offshore centers 5.4 19.2 68.2 10.4
Source: BIS.
1/ As of March 2013.
2/ Pheripheral European countries include Italy, Ireland, Greece, Portugal, and Spain.
3/ Core European countries include France, Germany, Switzerland, and United Kingdom.
7
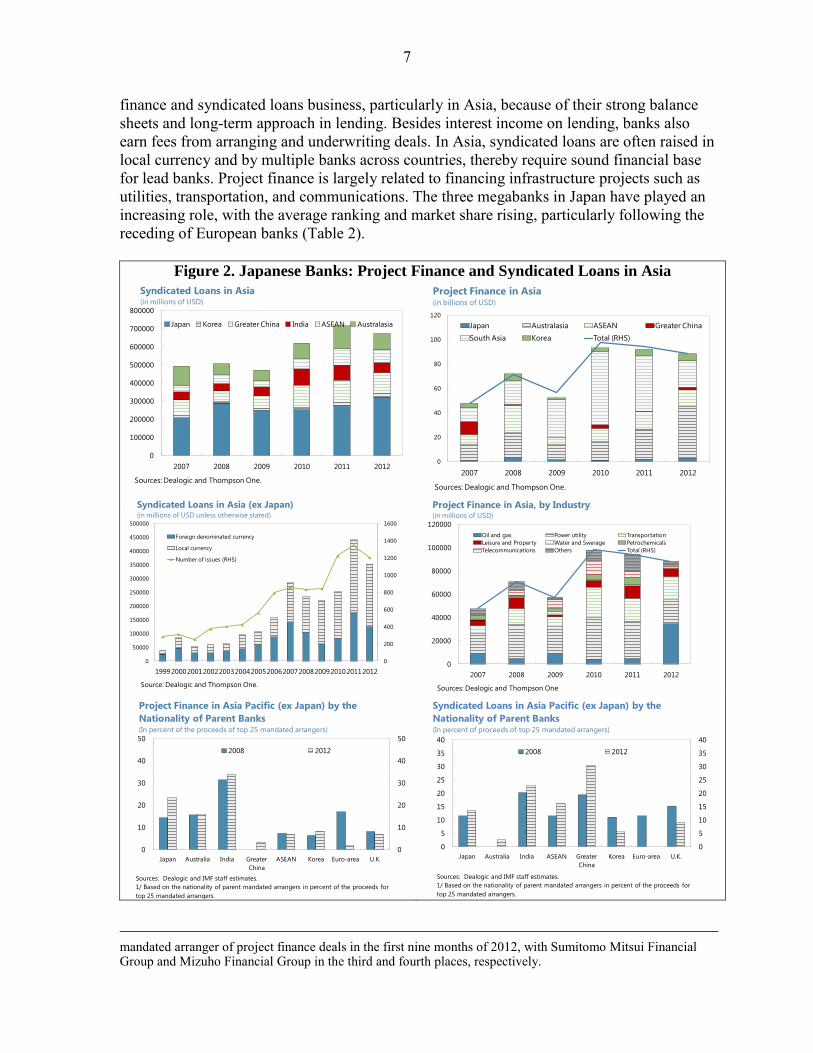
finance and syndicated loans business, particularly in Asia, because of their strong balance sheets and long-term approach in lending. Besides interest income on lending, banks also earn fees from arranging and underwriting deals. In Asia, syndicated loans are often raised in local currency and by multiple banks across countries, thereby require sound financial base for lead banks. Project finance is largely related to financing infrastructure projects such as utilities, transportation, and communications. The three megabanks in Japan have played an increasing role, with the average ranking and market share rising, particularly following the receding of European banks (Table 2).
Figure 2. Japanese Banks: Project Finance and Syndicated Loans in Asia
mandated arranger of project finance deals in the first nine months of 2012, with Sumitomo Mitsui Financial Group and Mizuho Financial Group in the third and fourth places, respectively.
0
100000
200000
300000
400000
500000
600000
700000
800000
2007 2008 2009 2010 2011 2012
Japan Korea Greater China India ASEAN Australasia
Syndicated Loans in Asia(in millions of USD)
Sources: Dealogic and Thompson One.
0
20
40
60
80
100
120
2007 2008 2009 2010 2011 2012
Japan Australasia ASEAN Greater China
South Asia Korea Total (RHS)
Project Finance in Asia(in billions of USD)
Sources: Dealogic and Thompson One.
0
200
400
600
800
1000
1200
1400
1600
0
50000
100000
150000
200000
250000
300000
350000
400000
450000
500000
19992000200120022003200420052006200720082009201020112012
Foreign denominated currency
Local currency
Number of issues (RHS)
Syndicated Loans in Asia (ex Japan)(in millions of USD unless otherwise stated)
Source: Dealogic and Thompson One.
0
20000
40000
60000
80000
100000
120000
2007 2008 2009 2010 2011 2012
Oil and gas Power utility Transportation
Leisure and Property Water and Swerage Petrochemicals
Telecommunications Others Total (RHS)
Project Finance in Asia, by Industry(in millions of USD)
Sources: Dealogic and Thompson One
0
10
20
30
40
50
0
10
20
30
40
50
Japan Australia India Greater
China
ASEAN Korea Euro-area U.K.
2008 2012
Project Finance in Asia Pacific (ex Japan) by the
Nationality of Parent Banks(In percent of the proceeds of top 25 mandated arrangers)
Sources: Dealogic and IMF staff estimates.
1/ Based on the nationality of parent mandated arrangers in percent of the proceeds for
top 25 mandated arrangers.
0
5
10
15
20
25
30
35
40
0
5
10
15
20
25
30
35
40
Japan Australia India ASEAN Greater
China
Korea Euro-area U.K.
2008 2012
Syndicated Loans in Asia Pacific (ex Japan) by the
Nationality of Parent Banks(In percent of proceeds of top 25 mandated arrangers)
Sources: Dealogic and IMF staff estimates.
1/ Based on the nationality of parent mandated arrangers in percent of the proceeds for
top 25 mandated arrangers.
8
Table 2. The Role of Japanese Banks in Asian Syndicated Loans and Project Finance 1/
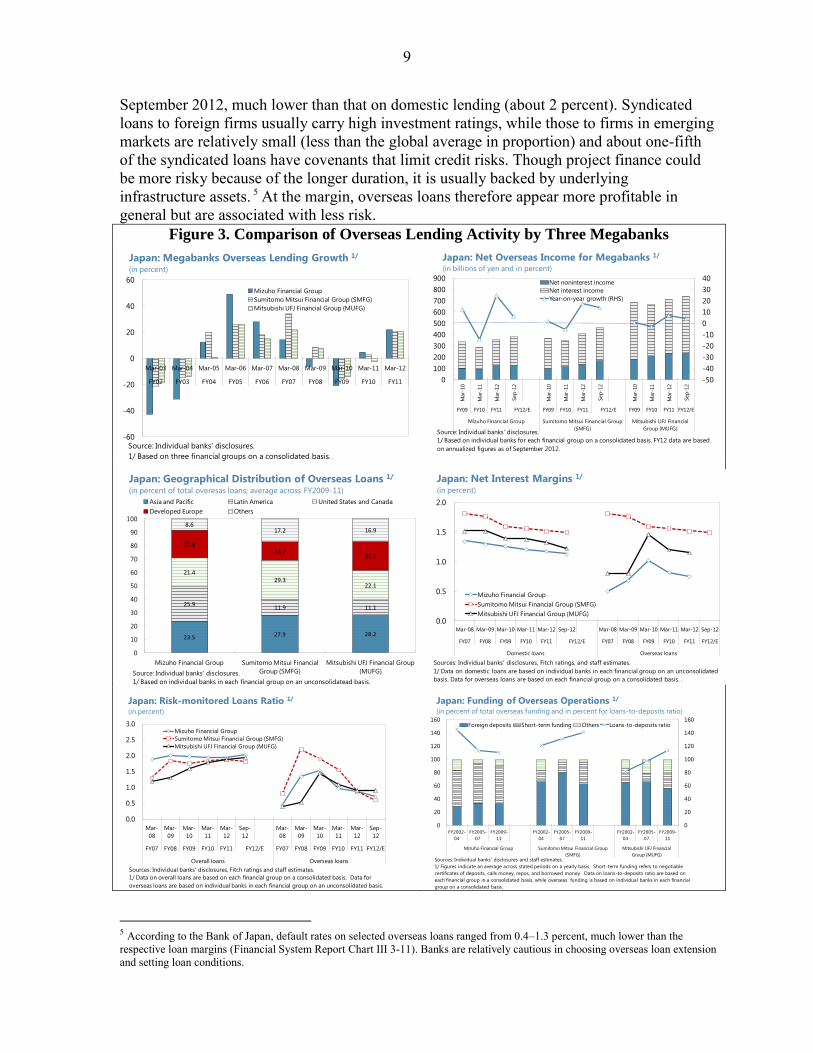
The performance of overseas lending among Japanese major banks has been stronger
in several ways compared to their domestic lending (Figure 3). Overseas gross profits now account for about 30 percent of total gross profits (about half of which arise from net interest income).4 Net interest margins for overseas loans have improved after the global financial crisis and exceeded those for domestic loans. As megabanks have been cautious in lending abroad to firms with established credit history, credit risks on overseas loans are moderate. The average risk-monitored loans ratio for overseas lending was about 0.7 percent as of 4 For instance, Mizuho Financial Group has about 25 percent of net business income derived from overseas customers, with return on assets for overseas loans at about 3.3 percent in FY2012.
Table. Project Finance in Asia by Top Mandated Arrangers, by Parent Nationality
Top 25 Mandated Arrangers 2012 2011 2010 2009 2008 2007 2012 2011 2010 2009 2008 2007
Parent Nationality
Asia Pacific 21 20 21 14 16 15
Japan 5 3 3 3 3 3 13,596 7,479 3,540 4,538 7,392 -
Australia 4 4 4 4 4 4 9,138 12,892 5,198 6,748 8,077 -
India 5 8 7 4 4 5 19,897 42,597 52,063 28,352 16,279 -
Greater China 2 2 3 0 0 0 1,946 1,886 14,743 - - -
ASEAN 4 1 3 2 3 3 4,061 1,616 2,298 1,419 3,767 -
Korea 1 2 1 1 2 1 4,788 4,539 1,855 603 3,294 -
Europe 4 5 4 11 9 9
Euro-area 1 2 2 9 7 6 985 1,678 2,379 6,833 8,757 -
UK 3 3 2 2 2 3 3,994 3,440 816 1,110 4,172 -
Others - - - - - 1 -
Total 25 25 25 25 25 25 88,119 91,317 97,511 56,422 56,422
Asia Pacific
Japan 4 11 16 10 8 21 15 8 4 8 13 -
Australia 11 8 12 8 12 9 10 14 5 12 14 -
India 8 5 4 5 15 10 23 47 53 50 29 -
Greater China 22 22 15 - - - 2 2 15 - - -
ASEAN 17 23 16 22 15 - 5 2 2 3 7 -
Korea 3 15 7 18 6 2 5 5 2 1 6 -
Europe
Euro-area 20 22 20 14 16 13 1 2 2 12 16 -
UK 16 19 22 22 19 19 5 4 1 2 7 -
Others - - - - - -Total
1/ Average for top arrangers that were among the top 25 list for at least two
consecutive years.
Distribution in each region (numbers)
Average ranking 2/
Total amount of proceeds (in USD mn)
Amount of Proceeds (in percent of industry total)
Table. Syndicated Loans in Asia Pacific (ex Japan) by Top Mandated Arrangers, by Parent Nationality
Top 25 Mandated Arrangers 2012 2011 2010 2009 2008 2012 2011 2010 2009 2008
Parent Nationality
Asia Pacific 23 19 21 19 19
Japan 3 3 3 3 3 24,419 26,323 18,170 7,839 14,749
Australia 1 1 1 1 - 4,378 5,680 4,514 1,878 -
India 4 4 5 3 4 40,488 50,725 63,822 37,999 25,946
ASEAN 5 6 3 3 3 28,893 36,233 16,089 11,085 14,700
Greater China 9 4 9 9 6 54,256 31,773 63,762 33,502 24,996
Korea 1 1 - - 3 9,672 5,002 - - 14,145
Europe and North America 2 6 4 6 6
Euro-area 0 2 2 3 3 - 7,614 9,610 6,310 14,763
UK 2 3 2 3 3 16,426 28,470 20,270 9,130 19,519
United States and Canada - 1 - - - - 5,706 - - -
Total / Industry total 25 25 25 25 25 260,594 299,211 281,191 160,773 198,952
Asia Pacific
Japan 7 7 10 15 11 9 9 6 5 7
Australia 17 15 18 20 - 2 2 2 1 0
India 13 10 8 5 16 16 17 23 24 13
ASEAN 14 15 15 10 12 11 12 6 7 7
Greater China 17 14 18 13 17 21 11 23 21 13
Korea 3 17 - - 13 4 2 0 0 7
Europe and North America
Euro-area - 22 15 19 12 0 3 3 4 7
UK 7 11 6 13 6 6 10 7 6 10
United States and Canada - 14 - - - 0 2 0 0 0
1/ Average for top arrangers that were among the top 25 list for at least two consecutive years.
Average ranking 1/ Amount of Proceeds (in percent of industry total)
Total amount of proceeds (in USD mn)Distribution (numbers)
9
September 2012, much lower than that on domestic lending (about 2 percent). Syndicated loans to foreign firms usually carry high investment ratings, while those to firms in emerging markets are relatively small (less than the global average in proportion) and about one-fifth of the syndicated loans have covenants that limit credit risks. Though project finance could be more risky because of the longer duration, it is usually backed by underlying infrastructure assets. 5 At the margin, overseas loans therefore appear more profitable in general but are associated with less risk.
Figure 3. Comparison of Overseas Lending Activity by Three Megabanks
5 According to the Bank of Japan, default rates on selected overseas loans ranged from 0.4–1.3 percent, much lower than the respective loan margins (Financial System Report Chart III 3-11). Banks are relatively cautious in choosing overseas loan extension and setting loan conditions.
-60
-40
-20
0
20
40
60
Mar-03 Mar-04 Mar-05 Mar-06 Mar-07 Mar-08 Mar-09 Mar-10 Mar-11 Mar-12
FY02 FY03 FY04 FY05 FY06 FY07 FY08 FY09 FY10 FY11
Mizuho Financial Group
Sumitomo Mitsui Financial Group (SMFG)
Mitsubishi UFJ Financial Group (MUFG)
Japan: Megabanks Overseas Lending Growth 1/
(in percent)
Source: Individual banks' disclosures.
1/ Based on three financial groups on a consolidated basis.
-50
-40
-30
-20
-10
0
10
20
30
40
0
100
200
300
400
500
600
700
800
900
Mar-
10
Mar-
11
Mar-
12
Sep
-12
Mar-
10
Mar-
11
Mar-
12
Sep
-12
Mar-
10
Mar-
11
Mar-
12
Sep
-12
FY09 FY10 FY11 FY12/E FY09 FY10 FY11 FY12/E FY09 FY10 FY11 FY12/E
Mizuho Financial Group Sumitomo Mitsui Financial Group
(SMFG)
Mitsubishi UFJ Financial
Group (MUFG)
Net noninterest income
Net interest income
Year-on-year growth (RHS)
Japan: Net Overseas Income for Megabanks 1/
(in billions of yen and in percent)
Source: Individual banks' disclosures.
1/ Based on individual banks for each financial group on a consolidated basis. FY12 data are based
on annualized figures as of September 2012.
23.5 27.9 28.2
25.911.9 11.1
21.429.3
22.1
20.613.7
21.7
8.617.2 16.9
0
10
20
30
40
50
60
70
80
90
100
Mizuho Financial Group Sumitomo Mitsui Financial
Group (SMFG)
Mitsubishi UFJ Financial Group
(MUFG)
Asia and Pacific Latin America United States and Canada
Developed Europe Others
Japan: Geographical Distribution of Overseas Loans 1/
(in percent of total overesas loans; average across FY2009-11)
Source: Individual banks' disclosures.
1/ Based on individual banks in each financial group on an unconsolidatead basis.
0.0
0.5
1.0
1.5
2.0
Mar-08 Mar-09 Mar-10 Mar-11 Mar-12 Sep-12 Mar-08 Mar-09 Mar-10 Mar-11 Mar-12 Sep-12
FY07 FY08 FY09 FY10 FY11 FY12/E FY07 FY08 FY09 FY10 FY11 FY12/E
Domestic loans Overseas loans
Mizuho Financial Group
Sumitomo Mitsui Financial Group (SMFG)
Mitsubishi UFJ Financial Group (MUFG)
Japan: Net Interest Margins 1/
(in percent)
Sources: Individual banks' disclosures, Fitch ratings, and staff estimates.
1/ Data on domestic loans are based on individual banks in each financial group on an unconsolidated
basis. Data for overseas loans are based on each financial group on a consolidated basis. .
0.0
0.5
1.0
1.5
2.0
2.5
3.0
Mar-
08
Mar-
09
Mar-
10
Mar-
11
Mar-
12
Sep-
12
Mar-
08
Mar-
09
Mar-
10
Mar-
11
Mar-
12
Sep-
12
FY07 FY08 FY09 FY10 FY11 FY12/E FY07 FY08 FY09 FY10 FY11 FY12/E
Overall loans Overseas loans
Mizuho Financial Group
Sumitomo Mitsui Financial Group (SMFG)
Mitsubishi UFJ Financial Group (MUFG)
Japan: Risk-monitored Loans Ratio 1/
(in percent)
Sources: Individual banks' disclosures, Fitch ratings and staff estimates.
1/ Data on overall loans are based on each financial group on a consolidated basis. Data for
overseas loans are based on individual banks in each financial group on an unconsolidated basis.
0
20
40
60
80
100
120
140
160
0
20
40
60
80
100
120
140
160
FY2002-
04
FY2005-
07
FY2009-
11
FY2002-
04
FY2005-
07
FY2009-
11
FY2002-
04
FY2005-
07
FY2009-
11
Mizuho Financial Group Sumitomo Mitsui Financial Group
(SMFG)
Mitsubishi UFJ Financial
Group (MUFG)
Foreign deposits Short-term funding Others Loans-to-deposits ratio
Japan: Funding of Overseas Operations 1/
(in percent of total overseas funding and in percent for loans-to-deposits ratio)
Sources: Individual banks' disclosures and staff estimates.
1/ Figures indicate an average across stated periods on a yearly basis. Short-term funding refers to negotiable
certificates of deposits, calls money, repos, and borrowed money. Data on loans-to-deposits ratio are based on
each financial group in a consolidated basis, while overseas funding is based on individual banks in each financial
group on a consolidated basis.
10
Nonetheless, overseas expansion also brought new risks. Foreign currency and maturity mismatches are likely to rise going forward as the growth of long-term funding in Japanese banks will begin to fall short of total external loans. Banks have increased their local deposit base (e.g., corporate deposits)—accounting for about half of the funding base—but it still falls short of the total external loans. Banks therefore rely on short-term finance such as yen-dollar basis and currency swaps that are subject to volatility, and by issuing foreign exchange-denominated bonds. The loan-to-deposit ratio for overseas loans continues to exceed 100 percent (compared to the loan-to-deposit ratio for domestic loans at about 70 percent), potentially contributing to funding risks. Funding cost and availability depend on credit ratings, which also affect prospects of securing certain lines of business. In an event of credit downgrades, funding cost could rise substantially and the loss of certain lines of business precipitate more severe funding difficulties.
C. Nonbank Sector—Life Insurers and Securities Firms
The trend of expanding abroad is not only limited to Japanese banks. Major life insurers have begun to strengthen their overseas business, especially in Asia, by acquiring or affiliating with local insurers for long-term profitability (Appendix 1).6 They usually expand via incremental capital and building alliances typically involving minority stakes rather than aggressive acquisitions. To gain competitiveness in local markets, they broaden in products and services (e.g., medical insurance) and increasingly rely on more efficient distribution channels (e.g., selling through banks “bancassurance”).7 To date, as majority of overseas investments are minority interests, the risk and return from overseas business for major life insurers tends to be modest.
Despite the recent setback in global operations, leading Japanese securities firms sought
to counter diminishing prospects by expanding overseas. Outward FDIs on financial services (banks and insurers) surged in 2008 on the account of Nomura holdings, a securities firm, acquiring the European arms of Lehman Brothers, which it later scaled back after incurring losses. Market share outside Japan by leading Japanese securities firms is relatively limited in most areas, such as financial advisory roles in mergers and acquisitions, and capital market issuance and underwriting (Thomson Reuters 2012). This is because of limited expertise in executing services outside Japan, and relative higher funding cost on foreign-currency instruments than other leading global peers, possibly due to lower credit ratings.
III. CONTRIBUTING FACTORS FOR INCREASING CROSS-BORDER ACTIVITY
Several domestic and regional factors contribute to the increasing trend of overseas
activity among Japanese financial institutions.
6 As life and nonlife insurers tend to lower their weight of their stockholdings, they are likely to reinvest these funds in
overseas mergers and acquisitions. Dai-ichi Life has investments in Taiwan, India, Thailand, and Vietnam. Nippon Life
recently acquired a 26 percent stake in Reliance of India for 680$ million, largest foreign direct investment deal in India.
Tokio Marine has an Asian business portfolio in general insurance. 7 “Bancassurance” accounts for about 35-70 percent of new business premium in Asia.
11
First, limited domestic opportunities have generated a need for major Japanese
banks to expand abroad. Domestic credit demand was sluggish in the past few years due to stagnant growth, though it has picked up recently. Large corporations have limited funding need as they accumulated sizeable surpluses (rising to about 6 percent of GDP). 8 Structural factors— such as high leverage among SMEs, population aging, and sluggish growth in Japan’s regions—have limited domestic opportunities. At the same time, lingering deflation has limited the decline of real interest rate to sufficiently stimulate credit demand. Shrinking net interest margin on loans (about 0.6-1.2 percent now relative to about 1.2–2.1 percent in early 2000s) tends to limit banks’ core profitability as interest income accounts for more than two-thirds of banks’ total income.
Second, major banks have weathered the global financial crisis well and have
capacity to take on more foreign exposures. They have abundant yen liquidity supported by a stable deposit base, and have further strengthened their capital adequacy (Tier 1 ratio at 12 percent) after the global financial crisis, in part to meet the Basel III requirements. The resilience of balance sheets in the Japanese banks has placed them in a better position to further expand overseas, despite lingering global uncertainty. The exchange rate has appreciated until recently, which may offer an additional incentive for expanding abroad.
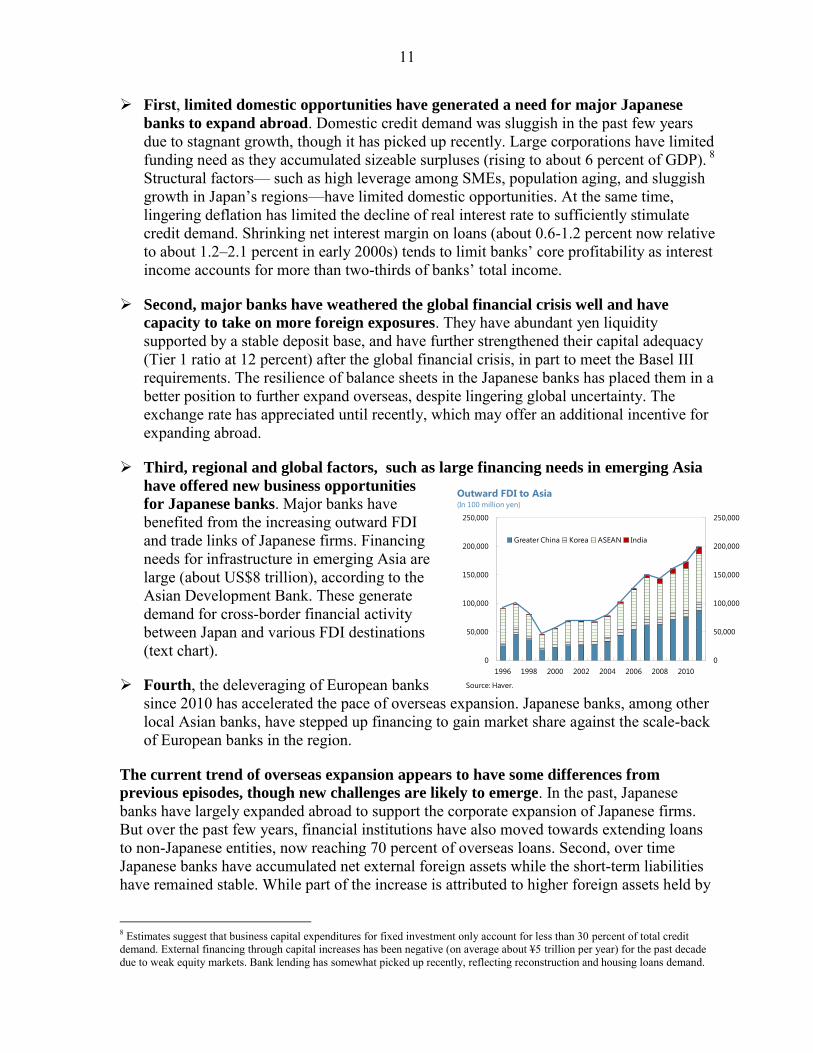
Third, regional and global factors, such as large financing needs in emerging Asia
have offered new business opportunities
for Japanese banks. Major banks have benefited from the increasing outward FDI and trade links of Japanese firms. Financing needs for infrastructure in emerging Asia are large (about US$8 trillion), according to the Asian Development Bank. These generate demand for cross-border financial activity between Japan and various FDI destinations (text chart).
Fourth, the deleveraging of European banks since 2010 has accelerated the pace of overseas expansion. Japanese banks, among other local Asian banks, have stepped up financing to gain market share against the scale-back of European banks in the region.
The current trend of overseas expansion appears to have some differences from
previous episodes, though new challenges are likely to emerge. In the past, Japanese banks have largely expanded abroad to support the corporate expansion of Japanese firms. But over the past few years, financial institutions have also moved towards extending loans to non-Japanese entities, now reaching 70 percent of overseas loans. Second, over time Japanese banks have accumulated net external foreign assets while the short-term liabilities have remained stable. While part of the increase is attributed to higher foreign assets held by
8 Estimates suggest that business capital expenditures for fixed investment only account for less than 30 percent of total credit demand. External financing through capital increases has been negative (on average about ¥5 trillion per year) for the past decade due to weak equity markets. Bank lending has somewhat picked up recently, reflecting reconstruction and housing loans demand.
0
50,000
100,000
150,000
200,000
250,000
0
50,000
100,000
150,000
200,000
250,000
1996 1998 2000 2002 2004 2006 2008 2010
Greater China Korea ASEAN India
Outward FDI to Asia(In 100 million yen)
Source: Haver.
12
trust banks, the increase may suggest banks have relied on domestic yen-denominated funds to finance long-term overseas loans.
IV. EMPIRICAL ANALYSIS IN CROSS-BORADER ACTIVITY OF JAPANESE BANKS
To analyze the role of these factors in contributing to the rising cross-border bank
lending, the paper conducts an empirical analysis to assess determinants of banks’
overseas expansion. The analysis also assesses whether and how the current expansion is different from previous episodes. Several other studies also looked into the factors contributing to cross-border banking (Shirota 2013, and Focarelli and Pozzolo 2005) through factor analyses and institutional features.
The empirical analysis here uses the quarterly consolidated year-on-year growth of
foreign claims on an immediate-borrowers basis published by the Bank of International Settlement (BIS). The sample is from 1984–2012, spanning across a panel of banking systems consisting of both origination and destination of cross-border claims: the origination countries/regions are mostly advanced countries, including Australia, Japan, France, Germany, Italy, Switzerland, Sweden, the United Kingdom, the United States, and Developed Europe; the destination countries or regions include Emerging Asia (China, India, ASEAN5), Developing Europe, and Latin America. The foreign claims (FC) are in U.S. dollar terms and are subject to valuation changes driven by exchange rate movements, which could be partly controlled by including the weighted exchange rates as an explanatory variable.9 The explanatory variables are broadly classified into three categories with the specification as follows:
where i and j stand for origination and destination countries/regions of foreign claims, respectively. A fixed effect coefficient i,jis included for each group. The explanatory variables include:
Global factors (GF) consisting of the VIX index, and the Fed Fund rate;
Regional factors (RF) consisting of growth differentials and real effective exchange rate movements between destination and origination countries/regions. The regression also considers alternative indicators of growth differentials using the change of fixed investments.
Home factors (HF) consisting of domestic interest rates, real effective exchange rates, growth of domestic credit to GDP ratio, several indicators for the soundness of the banking systems in origination countries/regions that include Tier 1 capital ratios, nonperforming loan ratios, and the return on assets.
9 Including the exchange rate as an explanatory variable controls partly for valuation changes in the BIS data. Strictly speaking, the exchange rate to be included should reflect the composition of foreign claims of origination countries/regions. By using the real effective exchange rate based on external trade weights as a proxy would imply an assumption that those weights are identical to those of foreign claims composition.

13
Table 3. Empirical Analysis on Bank’s Foreign Claims 1/ 2/
The empirical results underscore that a multitude of factors contribute to the growth of
banks’ foreign claims in Japan and other advanced countries (Table 3). First, higher global uncertainty (measured by the VIX index) tend to reduce banks’ activities abroad, though the net adverse impact on Japanese banks is relatively less compared to other countries. Second, in terms of regional factors, interest rates at the destination, as a proxy for the tightness of financing conditions, also play some role. Third, the growth differential is also an important driver for banks’ foreign claims. For instance, a 1-percentage-point increase of the real growth differential could increase the foreign claims by about 0.3–1.6 percentage points. While a currency appreciation in the origination countries tends to increase banks’ activity overseas, the coefficients are not statistically significant across all specifications. Regarding home factors, higher domestic credit growth is generally associated with slower growth overseas, possibly suggesting some substitution in banks when extending credit between home and abroad. Moreover, the soundness of banking systems at home is statistically significant in banks’ overseas activity. Stronger banks’ balance sheets such as
Dependent variable: Foreign claims (year-on-year percentage change (i,j))
Origination
European
banks only All All All
Destination countries / regions All All
Grouped by
regions ex.
China
Grouped by
regions
(1) (2) (3) (4)
Fixed effects (i,j) Y Y Y Y
Constant 171.1*** 127.6*** 49.7 65.60*
(54.8) (40.9) 35.2 (38.1)
Lagged foreign claims 0.45*** 0.48*** 0.58*** 0.58***
(yoy pct. change) (0.05) (0.04) (0.61) (0.05)
Global factors
Lagged VIX index -1.01*** -0.70*** -0.44*** -0.63***
(0.21) (0.21) (0.15) (0.18)
Lagged U.S. Fed-fund rates 0.27** 0.17** 0.15** 0.17**
(0.09) (0.08) (0.09) (0.06)
Regional factors
Real growth differential (i,j) 0.78 1.66** 0.59 1.02**
0.69 (0.73) 0.48 (0.56)
dln (REER differential (i,j)) -4.62 -7.32 -7.27 -5.27
3.80 8.00 5.32 4.95
Interest rates (j) - 1.19* -1.16 -1.06
(0.64) 1.86 1.54
Home factors
Interest rates (i) -1.08 - - -
1.09
Lagged domestic credit/GDP (i) -24.2** -18.6** -2.32 -6.63
(11.0) (8.8) 8.15 8.26
Soundness of banking system (i)
Capital adequacy (Tier 1 ratio) 17.45*** 13.05** 8.8* 10.02*
(4.51) (5.04) (4.9) (5.09)
Nonperforming loans ratios -7.57*** -5.5** -5.77*** -4.3**
(2.05) (2.6) (1.3) (1.9)
Returns on assets -15.6 20.8 17.5* 22.4*
(18.6) (17.4) (10.3) (13.3)
R-squared 0.40 0.36 0.49 0.49
No. of observations 535 863 389 496
No. of origination countries or regions 5 9 9 9
No. of destination countries or regions 7 7 3 4
Source: author's estimates.
1/ Notation i and j refer to origination and destination countries or regions of the foreign claims,
respectively.
2/ '*'. '**', and '***' denote the statistical significance at 10 percent, 5 percent, and 1 perecnt,
respectively.
Specification
14
higher capital adequacy ratios and lower nonperforming loan ratios are often associated with higher cross-border activity.
The empirical results also provide insights whether recent developments are likely to
continue and how they may be affected by the new policy framework in Japan. Applying the estimated results to Japan shows that global and regional factors explain a large part of the rise of foreign claims. As an illustration, Japanese banks’ foreign claims on Asia have grown by 103 percent since end-2008, of which about 40 percentage points are attributed by a decline of global uncertainty proxied by the VIX index, while regional factors contributed another 20–25 percentage points. Regarding home factors, the resilience of the Japanese major banks, particularly the strengthening of capital adequacy and low NPLs during the global financial crisis, contributed to around one-third of foreign claims growth. The substitution between domestic and foreign credit contributed modestly by about 5 percentage points.
Outlook and Policy Implications
Japanese financial institutions would benefit from a more diversified income base as
they expand abroad, though a gradual and cautious approach in overseas strategies is
warranted. Financial institutions’ expansion overseas helps improve their profitability by better allocating their liquidity and developing local markets in the Asian region. Banks may also favor a gradual expansion to maintain their balance sheets under the global regulatory reform agenda (e.g., Basel III requirements). A rapid expansion could lead to buying foreign assets at high prices or entering unfamiliar local markets that could eventually result to heavy losses as in the late 1980s and 1990s.
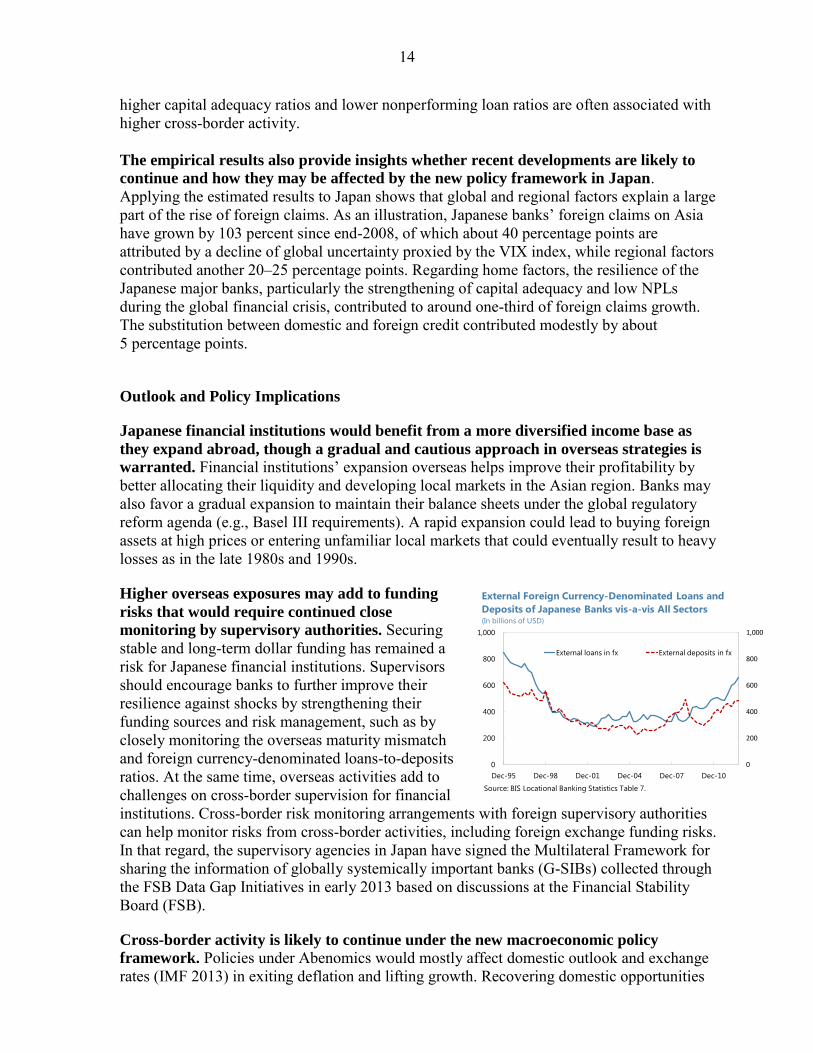
Higher overseas exposures may add to funding
risks that would require continued close
monitoring by supervisory authorities. Securing stable and long-term dollar funding has remained a risk for Japanese financial institutions. Supervisors should encourage banks to further improve their resilience against shocks by strengthening their funding sources and risk management, such as by closely monitoring the overseas maturity mismatch and foreign currency-denominated loans-to-deposits ratios. At the same time, overseas activities add to challenges on cross-border supervision for financial institutions. Cross-border risk monitoring arrangements with foreign supervisory authorities can help monitor risks from cross-border activities, including foreign exchange funding risks. In that regard, the supervisory agencies in Japan have signed the Multilateral Framework for sharing the information of globally systemically important banks (G-SIBs) collected through the FSB Data Gap Initiatives in early 2013 based on discussions at the Financial Stability Board (FSB).
Cross-border activity is likely to continue under the new macroeconomic policy
framework. Policies under Abenomics would mostly affect domestic outlook and exchange rates (IMF 2013) in exiting deflation and lifting growth. Recovering domestic opportunities
0
200
400
600
800
1,000
0
200
400
600
800
1,000
Dec-95 Dec-98 Dec-01 Dec-04 Dec-07 Dec-10
External loans in fx External deposits in fx
External Foreign Currency-Denominated Loans and
Deposits of Japanese Banks vis-a-vis All Sectors(In billions of USD)
Source: BIS Locational Banking Statistics Table 7.
15
may slow the expansion pace but empirical estimates suggest that the substitution effect between domestic and overseas lending contributed modestly to the trend (about 5 percent in the growth of foreign claims in Japan). Global and regional factors explain a large portion of cross-border activity of banks.
V. CONCLUSIONS
Cross-border activities of Japanese financial institutions have risen over the past few
years, particularly to the Asian region. The relative resilience of Japanese banks during the global financial crisis has allowed them to take on further foreign exposures. Stagnant growth and low interest margins in Japan have added to incentives to seek opportunities abroad. Outside Japan, growth in Asia and deleveraging of European banks in the region also contributed to a rise of cross-border lending. In some aspects, such as funding sources and areas of finance are broader than previous episodes of overseas expansion. As the global recovery takes hold and growth in Asia is expected to continue over the
medium term, Japanese banks will likely continue the trend. Stronger domestic growth in Japan could mitigate the pace, but is unlikely to reverse a long-standing trend because empirical estimates suggest that global and regional factors play a more prominent role in the growth of Japanese cross-border claims. An incomplete set of policies under Abenomics, however, could pose risks for financial stability that could halt the overseas expansion.
But higher overseas exposures may add to funding risks that would require continued
close monitoring by supervisory authorities. Securing stable and long-term dollar funding has remained a risk for Japanese financial institutions. At the same time, overseas activities add to challenges on cross-border supervision for financial institutions. Overseas expansion by Japanese financial institution is welcome, but would warrant a gradual and cautious approach in light of earlier episodes in the late 1980s and 1990s.
16
REFERENCES
Bank of Japan (2013) “Financial System Report”, April 2013, Bank of Japan. Berger A., R. DeYoung, H, Genay, and G. Udell (2000) “The Globalization of Financial
Institutions: Evidence from a Cross-Border Banking Performance”, Brookings-Wharton Paper on Financial Services, 2000, vol. 3, pp. 23-120.
De Haas, R., and I. Lelyveld (2010) “Internal Capital Markets and Lending by Multinational
Bank Subsidiaries”, Journal of Financial Intermediation, Volume 19, Issue 1, January 2010, Pages 1–25.
De Young, R., D. Evanoff, and P. Molyneux (2009) “Mergers and Acquisitions of Financial
Institutions: A Review of the Post-2000 Literature”, Journal of Financial Services Research, December 2009, Volume 36, Issue 2-3, pp 87-110.
Fitch Ratings (2013) “Japanese Mega Banks’ Offshore Growth Continues”, Fitch Ratings
Special Report, February 2013. Focarelli, D., and Pozzolo, A.F. (2005) “Where do Banks Expand Abroad? An Empirical
Analysis”, The Journal of Business, vol.78, no. 6, November 2005. Fratzscher, M. (2012) “Capital Flows, Push versus Pull Factors and Global Financial Crisis”
Journal of International Economics, November 2012, vol. 88(2), pp.341-356. International Monetary Fund (2013) “Spillover Report” August 2013. Jotikasthira, P., C. Lundblad, and T. Ramadorai (2012) “Asset Fire Sales and Purchases and
the International Transmission of Fudning Shocks” Journal of Finance, December 2012, vol.67 (6), pp.2015-2050.
Nolle, D. and R. Seth (1996) “Do Banks Follow Their Customers Abroad?” Federal Reserve
Bank of New York Research Paper, No. 9620, August 1996. Shirota T. (2013) “What is the Major Determinant of Credit Flows through Cross-border
Banking?”, Bank of Japan Working Paper Series, No.13-E-5, March 2013.
Thompson Reuters (2012) “Quarterly Reviews on Deals Intelligence” various weblinks—http://dmi.thomsonreuters.com/DealsIntelligence/QuarterlyReviews
17
APPENDIX
Selected Overseas Merger and Acquisitions of Life Insurers
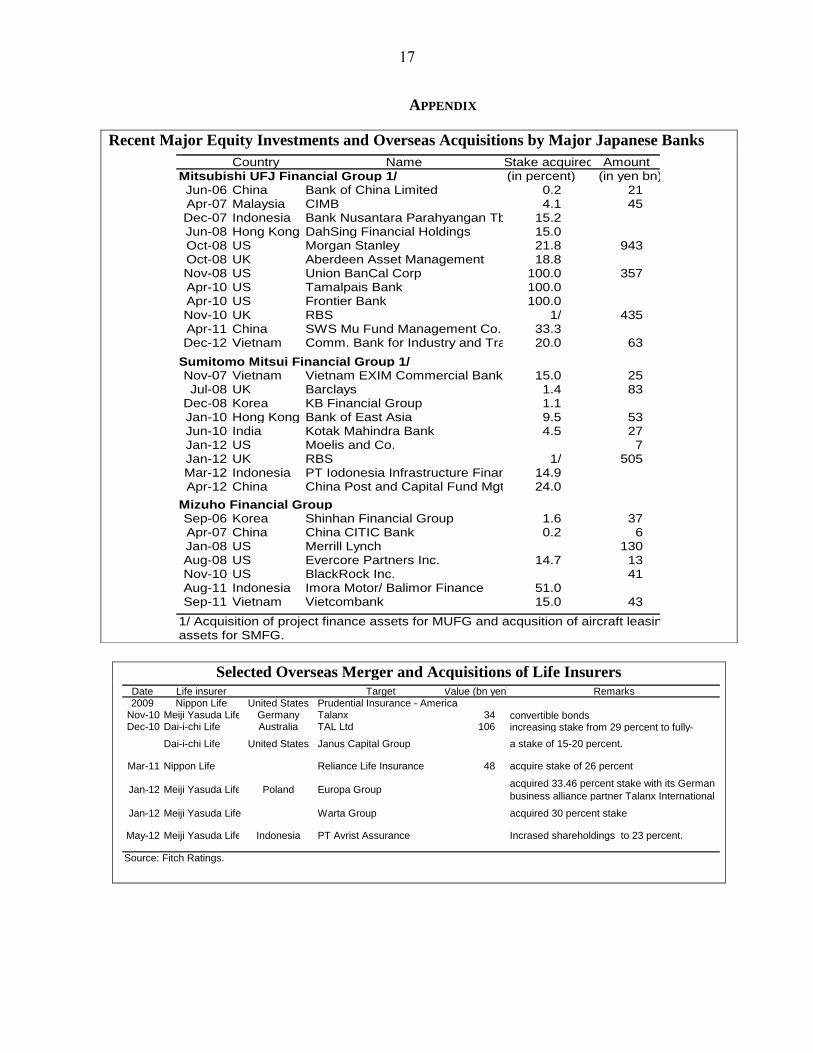
Recent Major Equity Investments and Overseas Acquisitions by Major Japanese Banks
Date Life insurer Target Value (bn yen) Remarks2009 Nippon Life United States Prudential Insurance - America
Nov-10 Meiji Yasuda Life Germany Talanx 34 convertible bondsDec-10 Dai-i-chi Life Australia TAL Ltd 106 increasing stake from 29 percent to fully-
Dai-i-chi Life United States Janus Capital Group a stake of 15-20 percent.
Mar-11 Nippon Life Reliance Life Insurance 48 acquire stake of 26 percent
Jan-12 Meiji Yasuda Life Poland Europa Groupacquired 33.46 percent stake with its German
business alliance partner Talanx International
Jan-12 Meiji Yasuda Life Warta Group acquired 30 percent stake
May-12 Meiji Yasuda Life Indonesia PT Avrist Assurance Incrased shareholdings to 23 percent.
Source: Fitch Ratings.
Country Name Stake acquired AmountMitsubishi UFJ Financial Group 1/ (in percent) (in yen bn)Jun-06 China Bank of China Limited 0.2 21Apr-07 Malaysia CIMB 4.1 45Dec-07 Indonesia Bank Nusantara Parahyangan Tbk 15.2Jun-08 Hong Kong DahSing Financial Holdings 15.0Oct-08 US Morgan Stanley 21.8 943Oct-08 UK Aberdeen Asset Management 18.8Nov-08 US Union BanCal Corp 100.0 357Apr-10 US Tamalpais Bank 100.0Apr-10 US Frontier Bank 100.0Nov-10 UK RBS 1/ 435Apr-11 China SWS Mu Fund Management Co. 33.3Dec-12 Vietnam Comm. Bank for Industry and Trade 20.0 63
Sumitomo Mitsui Financial Group 1/Nov-07 Vietnam Vietnam EXIM Commercial Bank 15.0 25Jul-08 UK Barclays 1.4 83
Dec-08 Korea KB Financial Group 1.1Jan-10 Hong Kong Bank of East Asia 9.5 53Jun-10 India Kotak Mahindra Bank 4.5 27Jan-12 US Moelis and Co. 7Jan-12 UK RBS 1/ 505Mar-12 Indonesia PT Iodonesia Infrastructure Finance 14.9Apr-12 China China Post and Capital Fund Mgt. 24.0
Mizuho Financial GroupSep-06 Korea Shinhan Financial Group 1.6 37Apr-07 China China CITIC Bank 0.2 6Jan-08 US Merrill Lynch 130Aug-08 US Evercore Partners Inc. 14.7 13Nov-10 US BlackRock Inc. 41Aug-11 Indonesia Imora Motor/ Balimor Finance 51.0Sep-11 Vietnam Vietcombank 15.0 43
1/ Acquisition of project finance assets for MUFG and acqusition of aircraft leasing assets for SMFG.