Embed Size (px)
Citation preview

Cross Border Issues—
the financial plumbing
Manmohan Singh
Senior Economist, International Monetary Fund
Views expressed are of the author only and not attributable to the IMF, its
Executive Board or Management.

Pledged Collateral—US banks

Pledged Collateral—European banks
(plus Nomura)
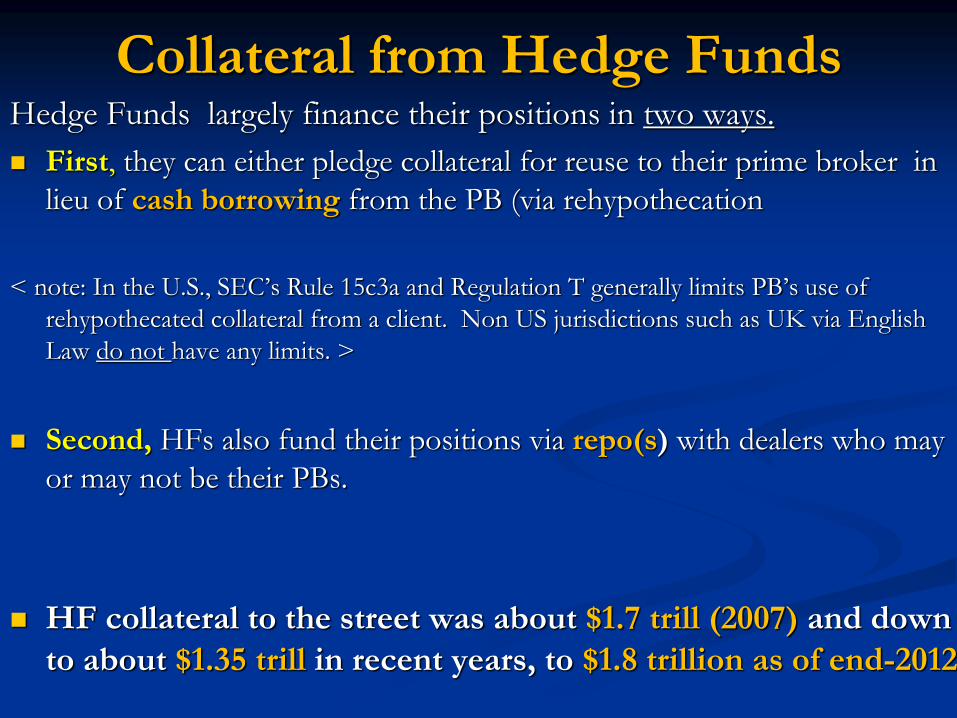
Collateral from Hedge Funds Hedge Funds largely finance their positions in two ways.
First, they can either pledge collateral for reuse to their prime broker in
lieu of cash borrowing from the PB (via rehypothecation
< note: In the U.S., SEC’s Rule 15c3a and Regulation T generally limits PB’s use of
rehypothecated collateral from a client. Non US jurisdictions such as UK via English
Law do not have any limits. >
Second, HFs also fund their positions via repo(s) with dealers who may
or may not be their PBs.
HF collateral to the street was about $1.7 trill (2007) and down
to about $1.35 trill in recent years, to $1.8 trillion as of end-2012

The “non-hedge fund” source of collateral—
declining due to counterparty risk etc
2007 2008 2009 2010 2011 2012
Securities Lending vs. Cash Collateral 1209 935 875 818 687 620
Securities Lending vs. Non-Cash Collateral 486 251 270 301 370 378
Total Securities Lending 1695 1187 1146 1119 1058 998
source: RMA
Table 1: Securities Lending, 2007-2012
Collateral Received from Pension Funds, Insurers, Official Accounts etc
(US dollar, billions)

Custodians(for asset managers,
pensions, insurers,
official sector)
$1.7 trill (2007)
$1.1 trill (2010)
$1.05 trill (2011)
$1.0 trill (2012)
Collateral
Money/Collateral
Hedge Funds $1.7 trill (2007)
$1.3 trill (2010)
$1.35 trill (2011)
$1.8 trill (2012)
Collateral
Money
REPO/PRIME
BROKERAGE
Collateral
SECURITIES
LENDING
Money
Non Bank / Bank / CB Nexus
Tri-Party
Banks
(US specific) Money Market
Funds
Dealer banks$ 10 trill (2007)
$ 5.8 trill (2010)
$ 6.2 trill (2011)
$ 6.0 trill (2012)
SHORT-TERM
(REPO) FUNDING

An example of repeated use of collateral
(that leads to “collateral chains”)


IS/LM and pledged collateral market:
IS shifts “in” as financial plumbing crashes
Output
Interest rate
Negative interest
rate
YAYB
LM
LM'
IS
IS'
A
B

Overall Financial Lubrication—some
intuition……Money and Collateral

US money (IOER) and GC rates
0.00
0.10
0.20
0.30
0.40
0.50
0.60
0.70 Fed Funds Rate IOER Treasury GCF Repo
0.00
0.10
0.20
0.30
0.40
0.50
0.60
0.70 Fed Funds Rate IOER Treasury GCF Repo
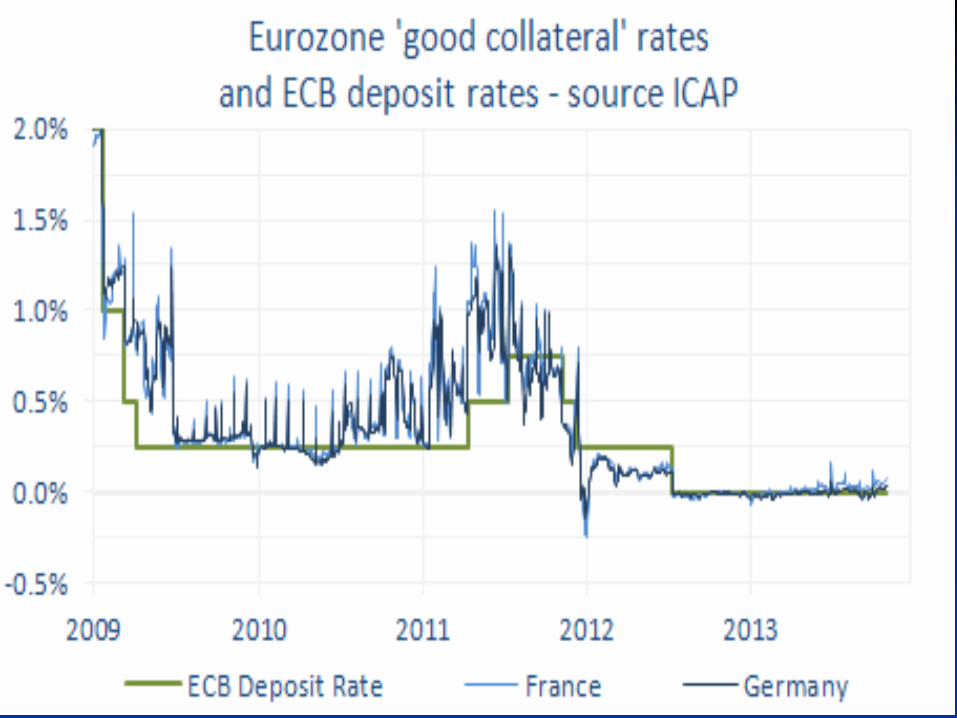
Eurozone ‘good collateral’ rates and
ECB deposit rates

The changing collateral space: In the “new” collateral space, the increasing role of central banks
regulations, and collateral custodians is significantly changing the
collateral landscape. As collateral remains scarce (i.e., low repo
rates), good collateral will become more fungible (i.e.,
Bunds/UST substitutability )
(i) unconventional monetary policies pursued by central banks
(ii) regulatory demands stemming from Basel III, Dodd Frank, EMIR
etc that will entail builder collateral buffers at banks (LCR), CCPs etc;
(iii) collateral custodians who are striving to connect with the central
security depositories (CSDs) to break out of silo(s).
(iv) supply of new collateral (assume D/GDP ratio does not increase
significantly in developed countries).

Financial Plumbing via pledged Collateral

The new plumber…..

Financial plumbing/ monetary policy If QE is buying US Treasury directly from a bank, the Fed is substituting
one bank asset for another. No change in bank balance sheet
But if QE is buying UST from a non-bank (which has been the
case..refer Carpenter et al 2013), then they're increasing bank balance
sheet by increasing nonbank deposits with banks. That deposit never
really goes away - no matter how the non-bank lends it to or pays it out, it
ends up as someone's deposit eventually. So M2 increases by the amount
by which the securities purchased were non-bank assets.
Money market funds have had increasing difficulty finding balance sheets
willing to provide investments. That implies that custodial banks – BoNY,
State Street especially – will likely grow because of their position as
'balance sheet of last resort' for the MMMF industry.
QE converts useful collateral to excess balance sheet at banks.

Excess reserves do not equal good collateral So if all the excess reserves deposits were converted to reverse repos
and reverse repos were a perfect substitute for a excess reserve
deposit (but they are not!!) Fed could reduce total bank balance sheets by the amount of reverse repo done with eligible nonbanks.
However, collateral with these nonbanks via reverse repos cannot
be rehypothecated, and thus will not contribute towards financial
lubrication. Only banks are allowed to rehypothecate collateral
received via reverse repos (this impacts collateral velocity).
So by design, collateral release to nonbanks will avoid any jumps
in repo rates (as this will be important when policy rates lift off)

Collateral Transformation and Regulation
Dealers are interested in collateral transformation. In fact they may be
the only actor in the financial space to bridge the likely demand/ supply
gap quickly. However transforming a BB to AA off balance sheet—via
pledged collateral -- may be constrained due to Basel III.
The final definition of leverage/LCR ratios will matter, especially if ratios
“pick up” all/most off-balance sheet pledged collateral transactions.
The re-use of collateral is fundamental to bridging the gap
between demand and supply. Reserve Bank of Australia’s suggestion
is similar to collateral transformation by using good assets from their own
balance sheet to keep collateral re-use rate high. (Academia has so far
ignored collateral velocity in their models)
Demandcollateral = Supplycollateral *re-use factor

Recent example of “puts” to the shadow:
Reverse Repo .. At least prior to QE, non-banks like MMMFs had to
work hard to get a positive return (i.e., higher than
bank deposits) by choosing a good counterparty.
Going forward, it is likely that MMMFs assets will grow,
given the guarantee return from reverse repos (and at odds
with proposed regulations — like floating NAV– that try to
limit the size of MMMFs).
Banks get balance sheet space to the extent of reverse repos
done w/nonbanks. So banks get to “push out deposits”
from their balance sheet and get “balance sheet
space”……..
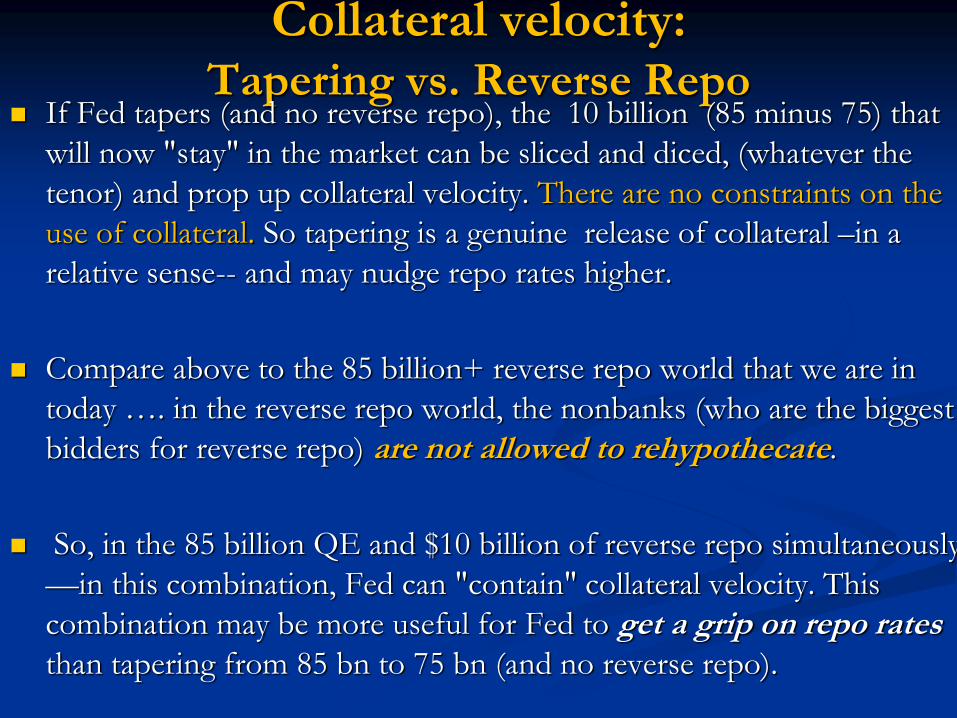
Collateral velocity: Tapering vs. Reverse Repo
If Fed tapers (and no reverse repo), the 10 billion (85 minus 75) that
will now "stay" in the market can be sliced and diced, (whatever the
tenor) and prop up collateral velocity. There are no constraints on the
use of collateral. So tapering is a genuine release of collateral –in a
relative sense-- and may nudge repo rates higher.
Compare above to the 85 billion+ reverse repo world that we are in
today …. in the reverse repo world, the nonbanks (who are the biggest
bidders for reverse repo) are not allowed to rehypothecate.
So, in the 85 billion QE and $10 billion of reverse repo simultaneously
—in this combination, Fed can "contain" collateral velocity. This
combination may be more useful for Fed to get a grip on repo rates than tapering from 85 bn to 75 bn (and no reverse repo).

Monetary Policy Rate in the medium term—as projected by
Fed’s paper from Jan 2013 (baseline consensus forecast).
Repo rates will matter!


![[American Society of Plumbing Engineers] Plumbing](https://img.pdfslide.net/doc/110x75/577cb1c91a28aba7118bddeb/american-society-of-plumbing-engineers-plumbing.jpg)